.
Share with LinkedIn Share with Twitter Share with facebook

Highlights

What GAO Found

In response to the national public health and economic threats caused by COVID-19, four relief laws making appropriations of about $2.6 trillion had been enacted as of July 31, 2020. Overall, federal obligations and expenditures government-wide of these COVID-19 relief funds totaled $1.5 trillion and $1.3 trillion, respectively, as of June 30, 2020. GAO also obtained preliminary data for six major spending areas as of July 31, 2020 (see table).
COVID-19 Relief Appropriations, Obligations, and Expenditures for Six Major Spending Areas, as of July 2020
Spending area

Appropriations a

($ billions)

Preliminary obligations b

($ billions)

Preliminary expenditures b

($ billions)
Business Loan Programs 687.3 538.1 522.2c
Economic Stabilization and Assistance to Distressed Sectors 500.0 30.4 19.2c
Unemployment Insurance 376.4 301.1 296.8
Economic Impact Payments 282.0 273.5 273.5
Public Health and Social Services Emergency Fund 231.7 129.6 95.9
Coronavirus Relief Fund 150.0 149.5 149.5
Total for six spending areas 2,227.4 1,422.2 1,357.0
Source: GAO analysis of data from the Department of the Treasury, USAspending.gov, and applicable agencies. | GAO-20-708

aCOVID-19 relief appropriations reflect amounts appropriated under the Coronavirus Preparedness and Response Supplemental Appropriations Act, 2020, Pub. L. No. 116-123, 134 Stat. 146; Families First Coronavirus Response Act, Pub. L. No. 116-127, 134 Stat. 178 (2020); CARES Act, Pub. L. No. 116-136, 134 Stat. 281 (2020); and Paycheck Protection Program and Health Care Enhancement Act, Pub. L. No. 116-139, 134 Stat. 620 (2020). These data are based on appropriations warrant information provided by the Department of the Treasury as of July 31, 2020. These amounts could increase in the future for programs with indefinite appropriations, which are appropriations that, at the time of enactment, are for an unspecified amount. In addition, this table does not represent transfers of funds that federal agencies may make between appropriation accounts or transfers of funds they may make to other agencies.
bObligations and expenditures data for July 2020 are based on preliminary data reported by applicable agencies.
cThese expenditures relate to the loan subsidy costs (the loan’s estimated long-term costs to the United States government).

The CARES Act included a provision for GAO to assess the impact of the federal response on public health and the economy. The following are examples of health care and economic indicators that GAO is monitoring.

Health care. GAO’s indicators are intended to assess the nation’s immediate response to COVID-19 as it first took hold, gauge its recovery from the effects of the pandemic over the longer term, and determine the nation’s level of preparedness for future pandemics, involving subsequent waves of either COVID-19 or other infectious diseases.

For example, to assess the sufficiency of testing—a potential indicator of the system’s response and recovery—GAO suggests monitoring the proportion of tests in a given population that are positive for infection. A higher positivity rate can indicate that testing is not sufficiently widespread to find all cases. That is higher positivity rates can indicate that testing has focused on those most likely to be infected and seeking testing because they have symptoms, and may not be detecting COVID-19 cases among individuals with no symptoms.

Although there is no agreed-upon threshold for the test positivity rate, governments should target low positivity rates. The World Health Organization recommends a test positivity rate threshold of less than 5 percent over a 14-day period. As of August 12, 2020, 12 states and the District of Columbia had met this threshold (38 states had not). Resolve to Save Lives, another organization, recommends a threshold of less than 3 percent over a 7-day period, and 11 states and the District of Columbia had met this threshold (39 states had not) as of August 12, 2020.

GAO also suggests monitoring mortality from all causes compared to historical norms as an indicator of the pandemic’s broad effect on health care outcomes. Mortality rates have tended to be consistent from year to year. This allows an estimation of how much mortality rose with the onset of the pandemic, and provides a baseline by which to judge a return to pre-COVID levels. According to Centers for Disease Control and Prevention data, about 125,000 more people died from all causes January 1–June 13 than would normally be expected (see figure).

CDC Data on Higher-Than-Expected Weekly Mortality, January 1 through June 13, 2020

Note: The figure shows the number of deaths from all causes in a given week that exceeded the upper bound threshold of expected deaths calculated by CDC on the basis of variation in mortality experienced in prior years. Changes in the observed numbers of deaths in recent weeks should be interpreted cautiously as this figure relies on provisional data that are generally less complete in recent weeks. Data were accessed on July 16, 2020.

Economy. GAO updated information on a number of indicators to facilitate ongoing and consistent monitoring of areas of the economy supported by the federal pandemic response, in particular the COVID-19 relief laws. These indicators suggest that economic conditions—including for workers, small businesses, and corporations—have improved modestly in recent months but remain much weaker than prior to the pandemic.

In June and July initial regular unemployment insurance (UI) claims filed weekly averaged roughly 1.4 million (see figure), which was six and a half times higher than average weekly claims in 2019, but claims have decreased substantially since mid-March, falling to 971,000 in the week ending August 8, 2020. Increasing infections in some states and orders to once again close or limit certain businesses are likely to pose additional challenges for potentially fragile economic improvements, especially in affected sectors, such as the leisure and hospitality sector.

National Weekly Initial Unemployment Insurance Claims, January 2019–July 2020

Note: See figure 5 in the report.

As GAO reported in June, consistent with the urgency of responding to serious and widespread health issues and economic disruptions, federal agencies gave priority to moving swiftly where possible to distribute funds and implement new programs designed to help small businesses and the newly unemployed, for example. However, such urgency required certain tradeoffs in achieving transparency and accountability goals. To make mid-course corrections, GAO made three recommendations to federal agencies:
  • To reduce the potential for duplicate payments from the Paycheck Protection Program (PPP)—a program that provides guaranteed loans through lenders to small businesses—and unemployment insurance, GAO recommended that the Department of Labor (DOL), in consultation with the Small Business Administration (SBA) and the Department of the Treasury (Treasury), immediately provide information to state unemployment agencies that specifically addresses PPP loans, and the risk of improper unemployment insurance payments. DOL issued guidance on August 12, 2020, that, among other things, clarified that individuals working full-time and being paid through PPP are not eligible for UI.
  • To recoup economic impact payments totaling more than $1.6 billion sent to decedents, GAO recommended that the Internal Revenue Service (IRS) consider cost-effective options for notifying ineligible recipients of economic impact payments how to return payments. IRS has taken steps to address this recommendation. According to a Treasury official, nearly 70 percent of the payments sent to decedents have been recovered. However, GAO was unable to verify that amount before finalizing work on this report. GAO is working with Treasury to determine the number of payments sent to decedents that have been recovered. Treasury was considering sending letters to request the return of remaining outstanding payments but has not moved forward with this effort because, according to Treasury, Congress is considering legislation that would clarify or change payment eligibility requirements.
  • To reduce the potential for fraud and ensure program integrity, GAO recommended that SBA develop and implement plans to identify and respond to risks in PPP to ensure program integrity, achieve program effectiveness, and address potential fraud. SBA has begun developing oversight plans for PPP but has not yet finalized or implemented them.

In addition, to improve the government’s response efforts, GAO suggested three matters for congressional consideration:
  • GAO urged Congress to take legislative action to require the Department of Transportation (DOT) to work with relevant agencies and stakeholders, such as HHS, the Department of Homeland Security (DHS), and international organizations, to develop a national aviation-preparedness plan to ensure safeguards are in place to limit the spread of communicable disease threats from abroad, while also minimizing any unnecessary interference with travel and trade. In early July 2020, DOT collaborated with HHS and DHS to issue guidance to airports and airlines for implementing measures to mitigate the public health risks associated with COVID-19, but it has not developed a preparedness plan for future communicable disease threats. DOT has maintained that HHS and DHS should lead such planning efforts as they are responsible for communicable disease response and preparedness planning, respectively. In June 2020, HHS stated that it is not in a position to develop a national aviation-preparedness plan as it does not have primary jurisdiction over the entire aviation sector or the relevant transportation expertise. In May 2020, DHS stated that it had reviewed its existing plans for pandemic preparedness and response activities and determined it is not best situated to develop a national aviation-preparedness plan. Without such a plan, the U.S. will not be as prepared to minimize and quickly respond to future communicable disease events.
  • GAO also urged Congress to amend the Social Security Act to explicitly allow the Social Security Administration (SSA) to share its full death data with Treasury for data matching to help prevent payments to ineligible individuals. In June 2020, the Senate passed S.4104, referred to as the Stopping Improper Payments to Deceased People Act. If enacted, the bill would allow SSA to share these data with Treasury's Bureau of the Fiscal Service to avoid paying deceased individuals.
  • Finally, GAO urged Congress to use GAO's Federal Medical Assistance Percentage (FMAP) formula for any future changes to the FMAP—the statutory formula according to which the federal government matches states' spending for Medicaid services—during the current or any future economic downturn. Congress has taken no action thus far on this issue.

GAO incorporated technical comments received the Departments of Labor, Commerce, Health and Human Services, Transportation, and the Treasury; the Federal Reserve; Office of Management and Budget; and Internal Revenue Service. The Small Business Administration commented that GAO did not include information on actions taken and controls related to its loan forgiveness program or its plans for loan reviews. GAO plans to provide more information on these topics in its next CARES Act report.

Why GAO Did This Study

As of August 20, 2020, the U.S. had over 5.5 million cumulative reported cases of COVID-19, and 158,000 reported deaths, according to federal agencies. The country also continues to experience serious economic repercussions and turmoil. Four relief laws, including the CARES Act, were enacted between March and July 2020 to provide appropriations for the response to COVID-19.

The CARES Act includes a provision for GAO to report bimonthly on its ongoing monitoring and oversight efforts related to COVID-19. This second report examines federal spending on the COVID-19 response; indicators for monitoring public health and the economy; and the status of matters for congressional consideration and recommendations from GAO’s June 2020 report ( GAO-20-625 ).

GAO reviewed data through June 30, 2020 (the latest available) from USAspending.gov, a government website with data from government agencies. GAO also obtained, directly from the agencies, spending data, as of July 31, 2020, for the six largest spending areas, to the extent available.

To develop the public health indicators, GAO reviewed research and federal guidance. To understand economic developments, GAO reviewed data from federal statistical agencies, the Federal Reserve, and Bloomberg Terminal, as well as economic research.

To update the status of matters for congressional consideration and recommendations, GAO reviewed agency and congressional actions.

Introduction 


Congressional Committees

The Coronavirus Disease 2019 (COVID-19) pandemic has resulted in catastrophic loss of life and substantial damage to the global economy, stability, and security. Worldwide there were 22,256,000 reported cases and 782,000 reported deaths due to COVID-19, as of August 20, 2020; within the United States, there were 5,507,000 cumulative reported cases and 158,000 reported deaths. [1] The United States also continues to experience serious economic repercussions and turmoil. As of July 2020, there were about 16.3 million unemployed individuals, compared to nearly 5.9 million individuals at the beginning of the calendar year. [2]

In response to the far-reaching public health and economic crises, Congress and the administration have taken a series of actions. For example, in March 2020, Congress passed, and the President signed into law, the CARES Act, which provides over $2 trillion in emergency assistance and health care response for individuals, families, and businesses affected by COVID-19. [3]

The CARES Act includes a provision for us to conduct monitoring and oversight of the federal government’s efforts to prepare for, respond to, and recover from the COVID-19 pandemic, including monitoring and oversight of the use of funds made available. [4] We are to report on, among other things, the effect of the pandemic on the public health, economy, and public and private institutions.

According to the provision, GAO is to submit bimonthly reports on its ongoing monitoring and oversight efforts related to the COVID-19 pandemic. We issued our first report on June 25, 2020. [5] In addition to these bimonthly reports, we will issue other reports that focus on specific aspects of the federal government’s efforts to respond to COVID-19. As of August 20, 2020, we had 75 audits underway related to the pandemic examining a variety of issues, including vaccines and therapeutics, COVID-19 testing, small business programs, the Strategic National Stockpile, use of the Defense Production Act, the response of the Department of Veterans Affairs to COVID-19, child welfare and education, worker safety, and homeowner and renter protections. We continue to actively coordinate our audits with other accountability organizations, including the Pandemic Response Accountability Committee, federal inspectors general, and state and local auditors. [6]

To provide the most up-to-date information on the federal government’s initial response from March through July 2020, we are issuing today’s report. This report provides information on (1) total appropriated funds as of July 31, 2020, and the latest spending information available; (2) indicators for monitoring the public health system’s preparedness for, response to, and recovery from COVID-19, and indicators for key areas of the economy targeted by federal efforts; and (3) the status of recommendations we made to executive agencies and matters for congressional consideration in our June report.

Our September report will provide a comprehensive review of key federal actions to prepare for, respond to, and recover from COVID-19, including actions to address testing, medical supplies, vaccine and therapeutic development, the Paycheck Protection Program (PPP), and unemployment insurance. Based on the review, the report will include recommendations for federal agencies.

For this report, we obtained a listing of all appropriation warrants issued by the Bureau of the Fiscal Service to the respective federal agencies for the four COVID-19 relief laws. [7] We compared each appropriation amount to the respective law or other supporting documentation. We determined that the data were sufficiently reliable for our purposes. We analyzed centralized, government-wide data on federal spending for the pandemic from USAspending.gov as of June 30, 2020, the most recent data available. USAspending.gov is a publicly available website that includes detailed data on federal spending for nearly all accounts across the federal government, maintained by the Department of the Treasury (Treasury). We also sought July 31, 2020, spending data from the six areas with the largest appropriations in the four COVID-19 relief laws and present this information to the extent it was available.

To update the indicators that we identified in our June 2020 report and to identify additional indicators for monitoring the public health system’s preparedness for, response to, and recovery from COVID-19, we reviewed selected research published in June and July 2020 by organizations with public health and policy researchers who are knowledgeable about the use of COVID-19 data to support decision-making, such as the Harvard Global Health Institute and the Edmond J. Safra Center for Ethics at Harvard, and Resolve to Save Lives. We also reviewed Department of Health and Human Services (HHS) documents, such as HHS’s COVID-19 guidance for hospital reporting and the Centers for Disease Control and Prevention’s (CDC) guidance on contact tracing workforce and programs. [8] We assessed the reliability of data on the number of higher than expected deaths from CDC’s National Center for Health Statistics, which we intend to use for monitoring and reporting, by reviewing relevant documents and published reports that use these data and obtaining additional information about the data from CDC officials. We found that the data were sufficiently reliable for our purposes. Finally, we interviewed officials from HHS and organizations including the Harvard Global Health Institute and the National Association of County and City Health Officials.

To identify indicators for monitoring the economy, we first reviewed the federal responses to the pandemic, in particular the COVID-19 relief laws, and identified five key provisions intended to support the economy, corresponding to five different areas of the economy: labor markets, households, small business credit markets, corporate credit markets, and markets associated with state and local government finances. We identified these key provisions based on their relative size, in dollars, as well as their potential economic effects. We then identified economic indicators corresponding to those five areas of the economy in order to provide a timely, general sense of how those areas of the economy were performing. In addition, we identified two indicators of the economic condition of the health care sector.

To identify potential indicators, we reviewed a number of sources, including prior GAO work, releases from federal statistical agencies, information from the Board of Governors of the Federal Reserve System (Federal Reserve) and relevant federal agencies responsible for the pandemic response and oversight of the health care system, data available on the Bloomberg Terminal, and input from internal GAO experts. To understand the relative importance of the key factors that could influence economic activity during the pandemic, such as supply and demand, the severity of the pandemic, and the impact of mitigation measures, we have begun to identify and review empirical research on these topics. We assessed the reliability of the data we intend to use for monitoring and reporting on areas of the economy supported by the federal pandemic response, in particular the COVID-19 relief laws. We took a number of steps to determine the reliability of proposed data sources and indicators, including reviewing relevant documentation, reviewing prior GAO work, and interviewing data providers. The quality of some available data and collection methods have been influenced by the COVID-19 pandemic. Nevertheless, we found that, collectively, the indicators were sufficiently reliable to provide a general sense of how these areas of the economy are performing.

To update the status of recommendations made to agencies and matters for congressional consideration made in our June 2020 report, we interviewed agency officials and monitored bills in Congress. We report the status of relevant bills that had, at a minimum, been reported out of a committee of jurisdiction as of July 2020.

We conducted this performance audit from June 2020 to August 2020 in accordance with generally accepted government auditing standards. Those standards require that we plan and perform the audit to obtain sufficient, appropriate evidence to provide a reasonable basis for our findings and conclusions based on our audit objectives. We believe the evidence obtained provides a reasonable basis for our findings and conclusions based on our audit objectives.

Background 


Since early July, the United States had approximately 50,000 to 65,000 reported new COVID-19 cases per day, on average. [9] Figure 1 shows the reported U.S. COVID-19 cases per day as a 7-day moving average.

Figure 1: Reported COVID-19 Cases per Day in the United States, as of August 20, 2020
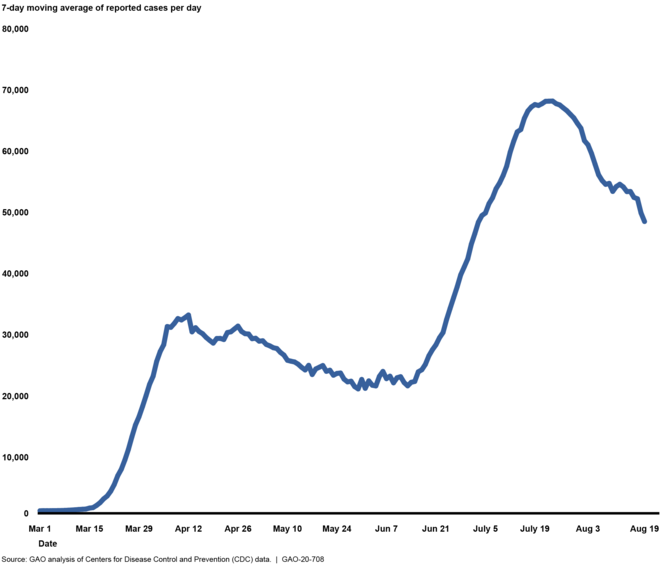
Note: Reported COVID-19 cases include confirmed and probable cases, as of April 14, 2020, if states report probable cases to CDC. According to CDC, the actual number of cases is unknown for a variety of reasons, including that people who have been infected may have not been tested or may have not sought medical care. The data presented in the figure were last updated on August 20, 2020. The 7-day moving average of new cases (current day plus 6 preceding days divided by 7) was calculated to smooth variations in daily counts.

The total number of cases nationwide, while useful in assessing the magnitude of the outbreak, can mask the severity of the outbreak in certain locations, including locations where the number of cases are increasing (often referred to as hotspots). Since the first case was reported in the United States, the severity and timing of outbreaks have varied across the nation. For example, from late March through early June, some states in the Northeast had higher numbers of reported cases than others. Subsequently, the outbreak slowed in that region while some states in the Southeast and Southwest saw increases in reported cases from late June through July. The number of reported new cases has varied geographically. Figure 2 shows reported cases per 100,000 population by state from August 13 to August 19, the most recent data available at the time of this analysis.

Figure 2: Reported COVID-19 Cases August 13-19, 2020, by State, per 100,000 Population
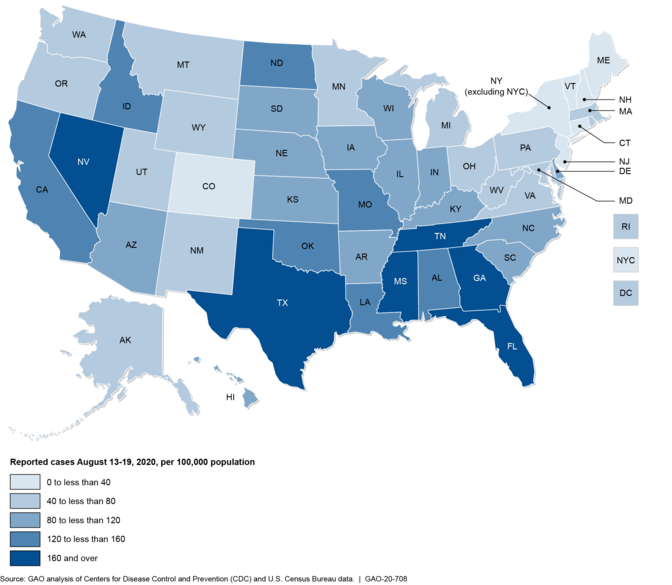
Note: Reported COVID-19 cases include confirmed and probable cases as of April 14, 2020, if states report probable cases to CDC. According to CDC, the actual number of cases is unknown for a variety of reasons, including that people who have been infected may have not been tested or may have not sought medical care. The data presented in the figure were last updated on August 19, 2020. Rates were calculated using population estimates from U.S. Census Bureau, 2018 American Community Survey 1-Year Estimates, as the number of cases per 100,000 population.

Major Findings 

Federal COVID-19 Funding and Spending

As of July 31, 2020, about $2.6 trillion had been appropriated to fund response and recovery efforts for—as well as to mitigate the public health, economic, and homeland security effects of —COVID-19. [10] The Business Loan Programs, Economic Stabilization and Assistance to Distressed Sectors programs, unemployment insurance, Economic Impact Payments, the Public Health and Social Services Emergency Fund, and the Coronavirus Relief Fund represent $2.2 trillion, or 85 percent, of the total amounts appropriated. [11]

As of June 30, 2020, the most recent date for which government-wide information was available, the federal government had obligated a total of $1.5 trillion and expended $1.3 trillion of the COVID-19 relief funds as reported by federal agencies on USAspending.gov. [12] The Office of Management and Budget (OMB) directed federal agencies to report obligations and expenditure data on a monthly basis for posting on USAspending.gov, to provide monthly attestations on the financial data, and to certify the data quality on a quarterly basis beginning with the June 2020 reporting period. [13] As shown in table 1, OMB’s prescribed certification time frames are consistent with pre-COVID-19 quarterly reporting. Agencies will provide monthly attestations over their financial files, and quarterly government-wide spending information as of July 31, 2020, certified in mid-November 2020.
Table 1: Time Frames for Reporting and Certifying COVID-19 Relief Spending Data
Period covered by COVID-19 agency reporting to USAspending.gov Time frames for agency reporting Deadline for agencies to certify data reported
April, May, June 2020 July 17–30, 2020 August 14, 2020
July 2020 August 19–28, 2020 November 16, 2020
August 2020 September 18–29, 2020
September 2020 October 19–November 16, 2020
Source: Fiscal year 2020 Digital Accountability and Transparency Act of 2014 (DATA Act) Monthly Reporting Window Schedule published by the Department of the Treasury. | GAO-20-708

Note: USAspending.gov is a publicly available website that includes detailed data on federal spending for nearly all accounts across the federal government and is maintained by the Department of the Treasury.

Because July 2020 monthly data have not been reported and certified on USAspending.gov, we collected preliminary obligation and expenditure data for the six largest areas, to the extent practicable, as of July 31, 2020. [14] For these six largest spending areas, agencies estimated obligations totaling $1.4 trillion and expenditures totaling $1.4 trillion. Table 2 shows appropriations, obligations, and expenditures of COVID-19 relief funds by these spending areas.
Table 2: COVID-19 Relief Appropriations, Obligations, and Expenditures for the Six Largest Spending Areas, as of May, June, and July 2020

Total appropriations

($ billions)

Reported cumulative obligations

($ billions)

Reported cumulative expenditures

($ billions)
Spending area July 31, 2020 a May 2020 b June 2020 c Preliminary July 2020 d May 2020 b June 2020 c Preliminary July 2020 d
Business Loan Programs (Small Business Administration) 687.3 528.9 534.4 538.1 9.9 506.3e 522.2e
Economic Stabilization and Assistance to Distressed Sectors (Department of the Treasury) 500.0 22.1 22.2 30.4 2.2 11.2e 19.2e
Unemployment insurance (Department of Labor) 376.4 107.1 202.4 301.1 101.8 197.1 296.8
Economic Impact Payments (Department of the Treasury) 282.0 267.4 270.7 273.5 267.4 270.7 273.5
Public Health and Social Services Emergency Fund (Department of Health and Human Services) 231.7 87.9 110.5 129.6 66.0 79.7 95.9
Coronavirus Relief Fund (Department of the Treasury) 150.0 146.6 149.5 149.5 146.6 149.5 149.5
Total for six spending areas 2,227.4 1,160.1 1,289.7 1,422.2 594.0 1,214.4 1,357.0
Source: GAO analysis of data from the Department of the Treasury, USAspending.gov, and applicable agencies. | GAO-20-708

aCOVID-19 relief appropriations reflect amounts appropriated under the Coronavirus Preparedness and Response Supplemental Appropriations Act, 2020, Pub. L. No. 116-123, 134 Stat. 146; Families First Coronavirus Response Act, Pub. L. No. 116-127, 134 Stat. 178 (2020); CARES Act, Pub. L. No. 116-136, 134 Stat. 281 (2020); and Paycheck Protection Program and Health Care Enhancement Act, Pub. L. No. 116-139, 134 Stat. 620 (2020). These data are based on appropriations warrant information provided by the Department of the Treasury as of July 31, 2020. These amounts could increase in the future for programs with indefinite appropriations, which are appropriations that, at the time of enactment, are for an unspecified amount. In addition, this table does not represent transfers of funds that federal agencies may make between appropriation accounts or transfers of funds they may make to other agencies.
bObligations and expenditures data for May 2020 are based on agency-reported data from the Department of the Treasury as of May 31, 2020. Some amounts differ from our June 2020 report ( GAO-20-625 ) because they are based on more current information that has been made available since then.
cObligations and expenditures data for June 2020 are based on data from USAspending.gov as of August 19, 2020.
dObligations and expenditures data for July 2020 are based on preliminary data reported by applicable agencies.
eThese expenditures relate to the loan subsidy costs (the loan’s estimated long-term costs to the United States government).

The following provide information on what has been happening in each of the six programs since our last report:
  • Business Loan Programs. The Small Business Administration’s (SBA) Business Loan Programs received $687 billion in appropriations and had obligated $538.1 billion of these funds as of July 31, 2020. SBA’s Business Loan Program account includes amounts for the PPP and for subsidies for certain SBA loan programs. Most of the appropriations went to the PPP, which is a loan guarantee program in which loans are guaranteed at 100 percent by SBA, are low-interest (1 percent), and will be fully forgiven if the borrower meets certain conditions. As of July 31, 2020, SBA reported that lenders had made about 5.1 million PPP loans, up from 4.6 million loans as of June 12, 2020. [15] SBA stated that its loan guarantee expenditures were $522.2 billion as of July 31, 2020, which represents the estimated cost to the federal government to satisfy the loan guarantee obligations to lenders. [16] The amount SBA ultimately spends largely depends on the number of loans actually forgiven. When the loans are forgiven, payments will be made to the lenders.
  • Economic Stabilization and Assistance to Distressed Sectors. The Economic Stabilization and Assistance to Distressed Sectors programs received $500 billion in appropriations. [17] Most of these appropriations—about $454 billion—relate to support for lending facilities administered by the Federal Reserve. Since early June 2020, five additional emergency lending programs (or facilities) supported through CARES Act appropriated funds became operational, resulting in a total of seven CARES Act facilities being operational as of July 31, 2020. As of that date, Treasury had committed $195 billion, or about 43 percent, of the $454 billion from the CARES Act available to support the facilities and disbursed $102.5 billion of that commitment, up from $55 billion in early June. [18] Most of the $19.2 billion of expenditures also relate to this program. Budget expenditures related to the lending facilities administered by the Federal Reserve represent the loan subsidy costs (the loan’s estimated long-term costs to the United States government) of the facilities to the federal government. The subsidy cost is calculated as the estimated net present value of both cash disbursements made to the facilities and cash received from the facilities when the facilities are terminated. Treasury estimates, on a net present value basis, that cash disbursed to the facilities will exceed the cash received from the facilities by $18 billion, as of July 31, 2020.

    The Economic Stabilization and Assistance to Distressed Sectors program also includes an appropriation of $46 billion in loans, loan guarantees, and other investments to provide liquidity to the aviation sector and businesses critical to maintaining national security, including non-aviation sector businesses. As of July 2020, Treasury had made one loan for up to $700 million to a business designated as critical to maintaining national security, and had also signed letters of intent with 10 passenger carriers to provide loans that could total over $20 billion.
  • Unemployment Insurance. Between May and July 2020, obligations for regular unemployment insurance increased from $107.1 billion to $301.1billion, and expenditures increased from $101.8 billion to $296.8 billion. In May 2020, 9.4 million initial unemployment claims were processed. In July 2020, states processed 6.7 million initial unemployment claims. [19]
  • Economic Impact Payments. Both cumulative obligations and cumulative expenditures for economic impact payments—direct payments to individuals and households to mitigate the effects of the pandemic—increased from $267.4 billion in May 2020 to $273.5 billion in July 2020. The vast majority of the 164 million economic impact payments disbursed by Treasury and Internal Revenue Service (IRS) had been disbursed by May 22, 2020. Those who received payments in June and July 2020 were individuals who filed their taxes up until the extended tax filing season deadline of July 15, individuals who previously filed a paper return that IRS was unable to process due to certain functions being shut down during the pandemic, and individuals who did not file taxes but used the IRS’s non-filer portal to claim their economic impact payment. [20]
  • Public Health and Social Services Emergency Fund. Payments to health care providers for costs related to COVID-19 or lost revenues are one of the activities supported by Public Health and Social Services Emergency Fund appropriations, through what is known as the Provider Relief Fund. Payments to providers totaled $65.2 billion as of May 31, 2020, and increased to $92.4 billion by the end of July. After initially making general relief payments to health care providers in April, HHS subsequently began allocating more funding to areas particularly affected by the COVID-19 outbreak, including rural health care facilities, high-impact hospitals (those hospitals with a high rate of COVID-19 inpatient admissions), safety net hospitals, health care providers that participate in Medicaid and the Children’s Health Insurance Program, skilled nursing facilities, Indian health care providers, and dental providers.
  • Coronavirus Relief Fund. As of July 31, 2020, Treasury had received $150 billion in appropriations and had provided $149.5 billion in direct assistance to states, localities, tribal governments, the District of Columbia, and U.S. territories to help offset costs of their response to the COVID-19 pandemic. The approximately $2.9 billion in additional obligations and expenditures since the end of May were payments to tribal governments that Treasury made in June.

Clear and transparent reporting of COVID-19 relief spending data and related information is an important tool for Congress, agency officials, and the public in monitoring and assessing implementation of the COVID-19 relief laws. Toward that end, the CARES Act contains several requirements for federal agencies and nonfederal entities receiving federal awards for the timely reporting of covered funds. [21] In April 2020, OMB issued guidance to direct agencies and recipients on how to implement CARES Act reporting requirements. This guidance included making some modifications to the existing framework of reporting requirements under the Federal Funding Accountability and Transparency Act of 2006, as amended by the Digital Accountability and Transparency Act of 2014 (DATA Act). [22] Among these modifications was the requirement that agencies use predefined codes to designate the funds associated with the appropriations enacted in the COVID-19 relief laws and enable tracking at the award level and as displayed on USAspending.gov. [23]

In an effort to help ensure the quality of data reported on USAspending.gov, OMB’s DATA Act guidance directs each agency to identify a Senior Accountable Official (SAO) who must provide a quarterly assurance that the agency’s internal controls support the reliability and validity of the agency account-level and award-level data. [24] OMB and Treasury still require quarterly SAO certifications of data quality. In addition, agencies that receive COVID-19 related funding that are reporting on a monthly basis are also required to provide monthly attestations for their financial files beginning with the June 2020 reporting period. These attestations state that the monthly data followed the agency’s normal practices and procedures, and that the SAO will certify the data at the end of the quarter.

Previous work by GAO and agency inspectors general has identified several challenges related to the quality of the data contained on USAspending.gov. Among these is the need to more fully disclose the limitations of data displayed on USAspending.gov. [25] We previously recommended that Treasury disclose known data quality issues and limitations on USAspending.gov. [26] Treasury has recently disclosed some data limitations for COVID-19 related spending. [27] These disclosures are an important step toward more fully identifying and disclosing known data limitations on USAspending.gov. Systematic expansion of such disclosures across the website could help users of the data better understand potential quality issues with particular data elements and sources, and how to appropriately interpret the data. In the absence of such information, users are unable to consider these differences in their assessment of how to use and understand the data provided. We will continue to monitor this issue and conduct work related to the quality of data reported on USAspending.gov and the related issues of data governance and data use.

Key Health Care and Economic Indicators

As we noted in our June 2020 report, indicators can be powerful tools to assess the federal government’s response to the COVID-19 pandemic. GAO’s indicators are intended to assess the nation’s immediate response to COVID-19 as it first took hold, gauge its recovery from the effects of the pandemic over the longer term, and determine the nation’s level of preparedness for future pandemics, involving subsequent waves of either COVID-19 or other infectious diseases.

Four Indicators Help to Monitor Areas of the Health Care System’s Response and Recovery

To date, we have identified four indicators that can help to monitor the status of the U.S. health care system’s response to and recovery from the COVID-19 pandemic, as well as its preparedness for future outbreaks. These indicators are (1) the positivity rate for COVID-19 testing, (2) contact tracing performance, (3) the proportion of intensive care unit (ICU) beds available, and (4) the number of higher than expected deaths from all causes. Given the evolving knowledge about COVID-19, we focused on new information about the potential indicators that we identified in our prior report, such as recommended thresholds for governments to target. We plan to work with the National Academies of Sciences, Engineering, and Medicine (National Academies) to establish approaches for monitoring these and other potential indicators, such as identifying data sources and thresholds as appropriate.

Positivity Rate for COVID-19 Testing

The proportion of COVID-19 viral tests in a given population that are positive for infection (the positivity rate) is one indicator of the sufficiency of testing. Viral tests provide data on ongoing infections, while antibody tests provide data on prevalence of past infections. A higher positivity rate indicates that not enough testing is being conducted to find all cases. That is, a higher rate indicates that testing has been focused on those most likely to be infected and seeking testing because they have symptoms, and may not be detecting COVID-19 cases among individuals with no symptoms. This is important because presymptomatic (infected individuals who will go on to develop symptoms) and asymptomatic individuals can transmit COVID-19.

Although there is no agreed-upon threshold for the test positivity rate for COVID-19, governments should target low positivity rates. Examples of recommended positivity rate levels for COVID-19 include the following:
  • In May 2020, the World Health Organization recommended that governments target a test positivity rate of less than 5 percent over a 14-day period. As of August 12, 2020, 12 states and the District of Columbia had met the World Health Organization recommended threshold of less than 5 percent over a 14-day period (38 states did not), according to data reported publicly by states. [28] In June and July 2020, several organizations also included the positivity rate as a key indicator in their new guidance to help governments assess progress in reducing the incidence of COVID-19. [29] For example, Resolve to Save Lives recommended that governments target a positivity rate of less than 3 percent based on a 7-day average and that they monitor positivity rates by age and race. [30] As of August 12, 2020, 11 states and the District of Columbia had met the threshold of less than 3 percent over a 7-day period (39 states did not), according to data reported publicly by states. [31]
  • Similarly, in July 2020, the Harvard Global Health Institute and the Edmond J. Safra Center for Ethics published a framework—developed in collaboration with a network of research, policy, and public health experts—that includes targets for positivity rates that depend on a government’s goal to achieve “mitigation” (i.e., reduce the incidence of COVID-19) or “suppression” (i.e., eliminate the incidence of COVID-19 almost entirely) through the use of testing, contact tracing, and isolation. [32] Harvard officials told us they established these targets based on the World Health Organization’s recommendation and positivity rates observed in other countries that have made progress in working toward suppression (e.g., South Korea, Germany). Harvard officials explained that these goals are part of a continuum, with the ultimate goal of suppression, and that governments should work toward a goal that is achievable. For example, governments that are faced with serious outbreaks in their communities should first work toward a goal of mitigation before suppression. Under the framework, it is suggested that governments target a positivity rate of about 10 percent for mitigation or a positivity rate of less than 3 percent for suppression. [33]

The extent to which governments can reduce the positivity rate is partly dependent on the available resources to perform testing and contact tracing. [34] This is because a more intensive use of testing and contact tracing is needed to identify infected individuals and take steps to help prevent further disease transmission. By helping to reduce disease transmission, more intensive testing and contact tracing may lead to a lower positivity rate over time as more people being tested are less likely to be infected.

As stated in our June 2020 report, we determined that the testing data that CDC reported did not provide sufficiently reliable information on the amount of COVID-19 viral testing occurring over time because the data were incomplete and inconsistent. For example, some states were combining viral and antibody tests in their reporting to CDC. However, we also reported that CDC had taken steps to improve the reliability of testing data, and we will continue to review the reliability of these data. [35] We plan to work with the National Academies to establish an approach for monitoring this potential indicator, such as an appropriate way to geographically define the positivity rate (e.g., national, state, county).

Contact Tracing Performance

Contact tracing is a critical tool to contain community outbreaks of COVID-19. It is a process in which trained public health officials attempt to limit disease transmission by identifying infected individuals, notifying their “contacts”—all the people they may have transmitted the disease to—and asking infected individuals and their contacts to quarantine, if appropriate. [36] After identifying an infected individual, public health officials interview the individual to identify recent contacts. They also ask the individual and their contacts to take containment measures, if appropriate (e.g., a 14-day quarantine for COVID-19) and coordinate any needed care and testing. To be most effective, test turnaround time and time to trace contacts must be rapid. Further, contact tracing must be implemented with other measures, such as social distancing, to effectively limit disease transmission. [37] When the level of community spread has become uncontrolled, however, stay-at-home orders combined with other measures may be required, as well as surge levels of testing and contact tracing resources.

In June and July 2020, several organizations recommended that governments track performance indicators for contact tracing to help them assess the effectiveness of their contact tracing programs and overall progress in reducing the transmission of COVID-19. [38] In addition, they recommended several thresholds for governments to target. For example, in July 2020, Resolve to Save Lives recommended that governments monitor on a weekly basis the percentage of new COVID-19 cases that were linked to already-known cases (based on contact tracing data) and that they achieve a target of at least 50 percent. Resolve to Save Lives and other organizations have emphasized the importance of monitoring both contact tracing and testing performance concurrently because contact tracing effectiveness depends on testing turnaround and capacity.

Similarly, CDC issued interim contact tracing guidance for state and local health departments in June 2020, and it states that state and local health departments should regularly collect and monitor performance indicators to assess program outcomes and identify and address issues. [39] For example, CDC provides examples of specific measures that health departments may track, such as the number of contacts of infected individuals identified through contact tracing that were subsequently tested for COVID-19. In addition, CDC’s guidance states that state and local health departments should consider setting targets for their performance indicators. According to CDC officials, state and local health departments that receive funds are required to report to CDC data on six performance measures related to contact tracing. [40] For example, CDC officials told us that state and local health departments are to report the proportion of close contacts of infected individuals who are notified within 24 hours of health departments initiating follow up. [41] CDC officials added that close contacts are identified through interviews with infected individuals. CDC officials told us each of the six measures are to be reported on a monthly or quarterly basis, beginning August 14, 2020, and that CDC plans to use the measures to monitor progress in reducing the transmission of COVID-19. There are no national data on contact tracing performance.

As discussed in our June 2020 report, a sufficient contact tracing workforce is critical in responding to a pandemic, such as COVID-19. We also reported that there are no national data on the number of contact tracers. In April 2020, the National Association of City and County Health Officials recommended a benchmark of 30 contact tracers per 100,000 population. [42] However, association officials told us this was an early estimate and it did not account for variation in state and local needs. The association subsequently worked with George Washington University to develop a workforce estimator that would account for this variation. While other organizations, such as Johns Hopkins Bloomberg School of Public Health and Harvard Global Health Institute and Harvard’s Edmond J. Safra Center for Ethics, have recently highlighted the importance of a sufficient contact tracer workforce, they emphasized that the recommended baseline varies among state and local health departments and in relation to changes in the incidence of COVID-19 and local and state testing capabilities. Harvard officials told us that the recommended baseline is a moving target, for example, that would significantly increase with community outbreaks.

CDC has provided funds to help state and local health departments expand their contact tracing capacity, which may include hiring additional contact tracers. [43] In addition, to support surge staffing needs in health departments, CDC awarded funds to the CDC Foundation to hire and place public health professionals—including contact tracers—in state, local, territorial, and tribal health departments. As of July 30, 2020, CDC officials told us that the CDC Foundation had hired and placed about 300 such professionals, of which more than half were contact tracers.

Proportion of Intensive Care Unit Beds Available

Tracking the proportion of staffed ICU beds that are available at regular intervals over time offers insight on changes in our health care system’s capacity to care for the sickest patients with COVID-19 (i.e., those that may require respiratory support on a ventilator to survive). In addition to COVID-19, the upcoming flu season could increase demand for hospital resources—for example, about 490,000 hospitalizations associated with the flu occurred during the 2018–2019 flu season, according to CDC estimates. [44] Given that several states reported record increases in the number of new COVID-19 cases in July 2020, and that flu cases will likely increase starting in the fall, the proportion of staffed ICU beds remains an important indicator to monitor.

CDC and several organizations included this indicator in recent reports that included guidance to help inform response decisions at different levels of government and provided different ways to geographically define it (e.g., states, hospital referral regions), and they differed in whether to recommend a threshold. [45] For example, CDC recommends that states and local jurisdictions monitor the indicator based on a threshold of 70 percent ICU bed occupancy (i.e., 30 percent of its staffed ICU beds are available). That is, an ICU bed occupancy rate of less than 70 percent indicates that a hospital likely has sufficient capacity to accommodate a certain level of additional patients. In comparison, the Bloomberg Philanthropies and Johns Hopkins Bloomberg School of Public Health recommended that cities monitor this indicator by ZIP code but do not specify a threshold.

One way to present data on ICU bed occupancy is to determine the number of states that met the 70 percent threshold on a given day, and then calculate the average of that daily result over some period of time, such as a week or month. For example, from July 1 to July 7, 2020, a daily average of 39 states met the 70 percent threshold of ICU bed occupancy (i.e., 30 percent or more of their staffed ICU beds were available), according to data from CDC. [46] We plan to work with the National Academies to further refine this indicator, such as by developing a threshold for ICU bed availability and ways to geographically define it (e.g., national, state, hospital referral region) for the purposes of monitoring.

Since our June 2020 report, HHS revised its guidance for hospitals to report COVID-19 data—including ICU bed availability—in an effort to help coordinate federal reporting and ensure flexibility in data collection. As of July 15, 2020, hospitals are to report these data directly to HHS through TeleTracking, or states may submit these data on behalf of hospitals to HHS Protect. [47] For ICU bed availability, hospitals are to include in their reports all staffed ICU beds (including overflow and surge ICU beds that are staffed). Prior to July 15, hospitals also had the option to report these data through CDC’s National Healthcare Safety Network (NHSN). [48] According to HHS, this change will help the agency more quickly update the type of data it collects, for example, by adding data elements on the kinds of COVID-19 treatments that are being used.

As of July 20, 2020, under its revised reporting process, HHS provides hospital utilization data—including the proportion of staffed ICU beds that are available within each state—from all participating hospitals on its new HHS Protect Public Data Hub website. [49] According to data published on July 30, 2020, about 92 percent of hospitals nationally reported at least one data element within the past 7 days, and the percentage of those hospitals reporting varied by state, from about 68 to 100 percent. [50] However, the percentage of hospitals that are reporting the proportion of ICU beds available on a daily basis is unclear. Prior to the revised reporting process, CDC provided hospital utilization data on its NHSN website, which included only the hospitals that reported through NHSN. We plan to monitor the transition to and implementation of HHS’s new data collection and reporting system, such as any effects on transparency.

Higher than Expected Deaths from All Causes

Mortality rates have tended to be consistent from year to year. As stated in our June 2020 report, the number of deaths from all causes during the pandemic compared to historical counts provides a potential indicator of the impact of deaths from COVID-19, as well as the pandemic’s broad effect on deaths from other causes. The full effect of COVID-19 goes beyond those infected with the disease. That is, it has affected access and utilization across the continuum of health care services, from primary care visits to emergency treatment of heart attacks, for example. Of particular concern are the potential effects of COVID-19-related disruptions of the health care system on mortality.

Examining higher than expected deaths can also address the imperfect reporting of COVID-19 deaths where the cause of death was unknown or misdiagnosed. [51] Several researchers and professional organizations have recently underscored the importance of monitoring this indicator to understand the effects of the pandemic on mortality. [52] Between January 1, 2020, and June 13, 2020, about 125,000 more deaths occurred from all causes than would normally be expected, according to data from CDC’s National Center for Health Statistics (see fig. 3). [53]

Figure 3: CDC Data on Higher Than Expected Weekly Mortality, January 1 through June 13, 2020

Notes: The figure shows the number of deaths from all causes in a given week that exceeded the upper bound threshold of expected deaths calculated by CDC on the basis of variation in mortality experienced in prior years. See CDC’s National Center for Health Statistics webpage on excess deaths for further details on how CDC estimates this upper bound threshold: https://www.cdc.gov/nchs/nvss/vsrr/covid19/excess_deaths.htm, accessed on July 16, 2020. Changes in the observed numbers of deaths in recent weeks should be interpreted cautiously as this figure relies on provisional data that are generally less complete in recent weeks.

The Economy Remains Weak but Indicators Suggest Modest Improvement in Key Areas Supported by the Federal Pandemic Response

The national economy and areas of the economy supported by the federal pandemic response have improved modestly in recent months but remain much weaker than prior to the pandemic. By the end of May 2020, the majority of states had eased the stay-at-home orders and certain restrictions on nonessential businesses that they had introduced at the onset of the pandemic. Contemporaneous gains in employment were driven by individuals returning to work in leisure and hospitality, retail trade, and health care.

Aggregate economic conditions in the United States also improved in June and July based on the Federal Reserve Bank of New York’s Weekly Economic Index, which combines high-frequency economic data from a wide range of sources. [54] Nevertheless, the index suggests a large drop in economic activity relative to a year ago. Similarly, U.S. gross domestic product fell at a 32.9 percent annual rate in the second quarter of 2020, the fastest rate on record, and was 9.5 percent lower than a year ago. As we noted in June, the impact of the pandemic on the economy will reduce federal tax revenues while the fiscal response from the COVID-19 relief laws and heightened demands on federal social programs will increase expenditures. [55] Federal debt held by the public increased from $19.8 trillion in May to $20.6 trillion in July—up over $3 trillion since February—while 3-month Treasury interest rates increased 3 basis points from 0.13 percent to 0.16 percent from May to June but returned to 0.13 percent in July. [56]

Increasing infections in some states and orders to once again close or limit certain businesses are likely to pose additional challenges for potentially fragile economic improvements, especially in affected sectors, such as the leisure and hospitality sector. More generally, economic activity during the pandemic will evolve based on a complex interaction of supply constraints, patterns of consumer demand, the severity of the pandemic, the effectiveness of mitigation measures, and when and how states and localities reopen—or restrict—various parts of their economies. [57] Emerging empirical research on these topics, which we plan to monitor and review in greater depth to better understand changes in national and regional economic activity, should provide insight into the relative importance of these various factors and how they interact. [58]

Both imports to and exports from the United States fell in May but rose significantly in June as other areas of the economy continued to recover. Trade in transportation and travel services in June 2020 continued to be substantially below their levels from a year ago. Travel exports in June 2020, for example, were 73 percent lower than in June 2019. COVID-19-related imports continued to rise in May and June while COVID-19-related exports were roughly constant. [59] Measures of economic and financial stress in advanced and emerging market economies improved in June relative to May but remained elevated compared to 2019.

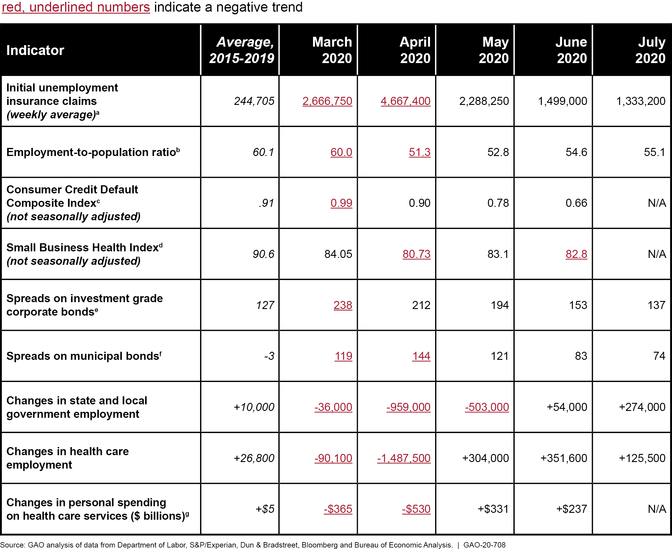
Indicators of areas of the economy supported by the federal pandemic response improved in June, but labor market indicators remained far from prepandemic levels (see fig. 4). [60]

Figure 4: Indicators for Areas of the Economy Supported by the Federal Pandemic Response, 2015-2019 and March 2020-July 2020
aInitial unemployment claim totals include initial regular unemployment claims submitted during the month but may understate emerging unemployment of workers who qualify for the Pandemic Unemployment Assistance (PUA) program. The PUA program generally authorizes up to 39 weeks of unemployment insurance (UI) benefits to individuals not otherwise eligible for UI benefits, such as self-employed and certain gig economy workers, who are unable to work as a result of COVID-19. Claims weeks are included in the month where the majority of the week falls. For example, the weekly average for April 2020 includes the claims week ending May 2.
bThe employment-to-population ratio represents the number of employed people as a percentage of the civilian noninstitutional population 16 years and over and is subject to misclassification errors with respect to consistently identifying workers as employed and absent from work or unemployed on temporary layoff.
cHigher levels of the Consumer Credit Default Composite Index indicate more defaults on consumer loans, including auto loans, bank cards, and mortgages. The Consumer Credit Default Composite Index could be subject to seasonal variation but is not seasonally adjusted.
dLower levels of the Small Business Health Index indicate higher utilization of credit, delayed payments on credit, and more small business failures. The Small Business Health Index is published under license and permission from Dun & Bradstreet and no commercial use can be made of these data.
eCorporate bond spreads are option-adjusted spreads on dollar-denominated investment grade corporate bonds and are measured in basis points or 1/100th of a percentage point. Higher spreads reflect higher perceived risk among corporate borrowers by investors.
fSpreads on municipal bonds are calculated relative to interest rates on Treasury securities based on the Bloomberg-Barclays Municipal Bond Index and are measured in basis points or 1/100th of a percentage point. Higher spreads reflect higher perceived risk among municipal borrowers by investors.
gExpenditures are in real (inflation-adjusted) dollars using chained (2012) dollars and are seasonally adjusted at annual rates.

Labor markets. The labor market showed some signs of improvement as the employment-to-population ratio increased from a historic low of 51.3 percent in April to 55.1 percent in July. [61] Gains in employment were primarily driven by individuals returning to work in leisure and hospitality, government, and retail trade. However, new state orders to restrict certain business activities in some states may slow growth in employment in impacted industries. Employment levels remain below their prepandemic levels, as the employment-to-population ratio in July was 6 percentage points lower than in February 2020. [62] Percentage declines in the employment-to-population ratios from February to July were larger for Black and Hispanic workers compared to White workers, and were also larger for those without a bachelor’s degree.

In four states, the employment-to-population ratio was less than 50 percent. Moreover, the number of initial regular unemployment insurance (UI) claims filed weekly in June and July 2020 averaged roughly 1.4 million, which was six and a half times higher than average weekly claims in 2019 (see fig. 5). While the number of initial regular UI claims filed weekly has decreased since March when the pandemic began, falling to 971,000 in the week ending August 8, 2020, the persistently high level of claims indicates that economic disruption from the pandemic and significant stress in some areas of the labor market continue.

Figure 5: National Weekly Initial Regular Unemployment Insurance Claims, January 2019–July 2020

Notes: National initial regular unemployment insurance (UI) claims data are seasonally adjusted and include the 50 states, the District of Columbia, Puerto Rico, and the U.S. Virgin Islands. Figure includes data retrieved on August 20, 2020, and covers weekly claims from January 5, 2019, through August 8, 2020. Recent initial UI claims totals may understate emerging unemployment due to capacity issues that may have limited or delayed successful claim filing in many states. Initial unemployment claims totals may also understate emerging unemployment of workers who qualify for the Pandemic Unemployment Assistance (PUA) program, as states have different processes for processing claims under this program since its implementation in May 2020. The PUA program generally authorizes up to 39 weeks of UI benefits to individuals not otherwise eligible for such benefits, such as self-employed and certain gig economy workers, who are unable to work as a result of COVID-19. According to the Department of Labor, in some states, workers eligible for PUA may first submit an UI claim, but in other states, these workers can apply directly for the PUA program, and PUA claims are not counted as initial regular UI claims. Due to outstanding and unresolved data issues specific to the PUA program, this graphic does not include separate initial PUA claims.

Household financial conditions. The Consumer Credit Default Composite Index—a timely measure of households’ ability to make scheduled payments—continued to improve in June. [63] While subindexes for mortgages, auto loans, and bank cards improved in June relative to May, defaults on bank cards remained higher than a year ago. Relatively high bank card defaults could indicate that households are prioritizing payments on some liabilities over others or that households that disproportionately rely on credit cards have experienced more financial hardship since the onset of the pandemic. In addition, preliminary data on households participating in the Supplemental Nutrition Assistance Program (SNAP) rose by about 17 percent in April compared to March—suggesting a significant increase in the demand for food assistance. [64] Federal Pandemic Unemployment Compensation benefits expired at the end of July, which could influence eligibility for SNAP as well as demand for food assistance.

Small business credit markets. The Small Business Health Index—a timely measure of the financial condition of small businesses—improved in May, but dropped in June. In addition, subcomponents of the index measuring delinquency on certain financial obligations were still on the rise, suggesting that small businesses had increased difficulty making scheduled payments. [65] As of June 2020, small businesses in the retail and automotive sectors had the largest deterioration in their sector-level indexes since January, with increases in business failures and growing delinquencies driving the changes.

Corporate credit markets. Spreads on investment grade corporate bonds improved in June and July relative to April and May, suggesting that perceived risk among corporate borrowers has fallen and that access to credit for corporations has improved. [66]

State and local government finances. Spreads on municipal bonds also improved in June and July relative to April and May, suggesting that perceived risk among municipal borrowers has fallen and access to credit for state and local governments has improved. [67] State and local government employment, another indicator of state and local government finances, improved based on growth in local educational employment.

Monthly change in personal consumption expenditures for health care. The COVID-19 pandemic has taken a severe toll on the health care sector, not only through the sharp rise in demand for services for COVID-19 patients but also through the disruption of services for non-COVID-19 patients. Early in the pandemic, state stay-at-home orders and federal recommendations to postpone nonessential medical procedures contributed to declines in hospital/facility stays and patient visits for non-COVID-related conditions or impairments. States began easing COVID-related restrictions in late April, and by the end of May, most had relaxed or ended stay-at-home orders. Some states began reimposing certain restrictions, such as bar closures, in June or July. This indicator, based on data reported by the Bureau of Economic Analysis, reflects these developments.

As shown in figure 6, seasonally adjusted real (inflation-adjusted) personal consumption expenditures for health care dropped by $365 billion (16 percent) between February and March and then another $530 billion (28 percent) between March and April, with large drops in spending for both outpatient and hospital services. [68] Personal consumption expenditures for health care rose in May and again in June, with increases in spending for both outpatient and hospital services, but remained well below prepandemic levels. New stay-at-home orders or other measures to address increasing numbers of cases in some areas of the country may slow growth in spending.

Figure 6: Real Personal Consumption Expenditures for Health Care, Seasonally Adjusted, June 2019–June 2020

Note: Expenditures are in real (inflation-adjusted) dollars using chained (2012) dollars and are seasonally adjusted at annual rates.

Monthly change in health care employment. As the COVID-19 pandemic spread throughout the United States, and hospital stays and patient visits for non-COVID-related conditions or impairments declined, many health care establishments such as private physician offices curtailed services and laid off staff. Declines in health care employment lagged those in health care spending, with employment declining substantially in April while personal health care expenditures fell sharply the previous month. Even when facing revenue losses, employers may have retained staff for a number of reasons—for example, to avoid the future costs of hiring and training new staff when patient visits resume or, in the case of hospitals, to care for individuals with COVID-19. Financial support provided by the COVID-19 relief laws to assist providers facing increased health-care-related expenses or lost revenue attributable to COVID-19, known as the Provider Relief Fund, may also have helped some providers retain staff. [69]

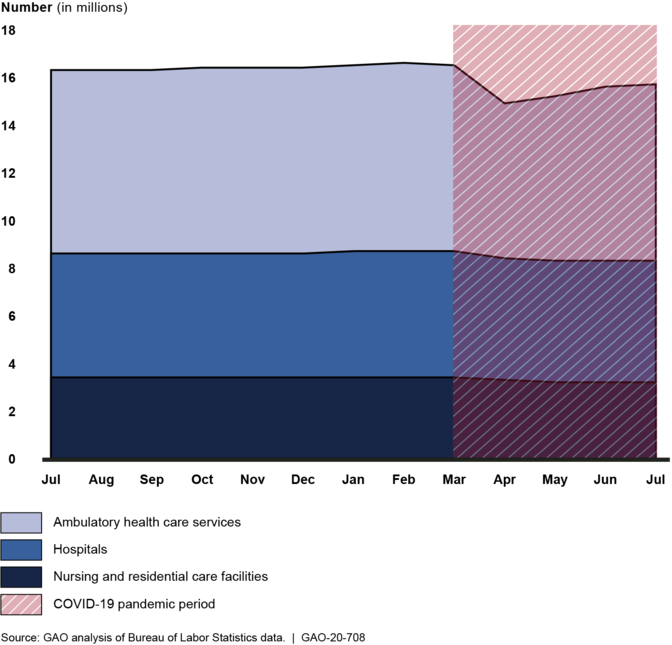
According to data from the Bureau of Labor Statistics (BLS) Current Employment Statistics Survey of establishments, seasonally adjusted employment in the health care sector dropped by almost 1.6 million between February and April 2020, largely due to declines in employment in ambulatory health care establishments—including dentists’ offices, which accounted for 35 percent of all job losses in health care during that period (see fig. 7). [70] BLS data show recovery in health care sector employment in the following 3 months, including in dentists’ offices, which regained almost nine in 10 of the jobs lost in March and April. [71] However, employment in this sector was still below prepandemic levels as of July.

Figure 7: Health Care Sector Employment, Seasonally Adjusted, July 2019–July 2020

Note: June and July 2020 data are preliminary.

Status of GAO’s June 2020 Recommendations and Matters for Congressional Consideration

As we reported in June, consistent with the urgency of responding to serious and widespread health issues and economic disruptions, federal agencies gave priority to moving swiftly where possible to distribute funds and implement new programs designed to help small businesses and the newly unemployed, for example. However, such urgency required certain tradeoffs in achieving transparency and accountability goals. To make mid-course corrections, GAO made three recommendations to federal agencies:

Recommendations

Unemployment insurance. We recommended that the Secretary of Labor, in consultation with SBA and Treasury, immediately provide information to state unemployment agencies that specifically addresses SBA’s PPP loans, and the risk of improper payments associated with these loans. DOL issued guidance on August 12, 2020, that clarified that individuals working full-time and being paid through PPP are not eligible for UI, and that individuals working part-time and being paid through PPP would be subject to certain state policies, including state policies on partial unemployment to determine their eligibility for UI benefits. Further, the guidance clarified that individuals being paid through PPP but not performing any services would similarly be subject to certain provisions of state law, and noted that an individual receiving full compensation would be ineligible for UI.

Economic impact payments. Treasury and IRS sent almost 1.2 million economic impact payments totaling $1.6 billion to deceased individuals. In June 2020, we recommended that IRS consider cost-effective options for notifying ineligible recipients on how to return payments. IRS agreed with this recommendation. Treasury and IRS have taken steps to implement this recommendation and are considering further actions. Currently, IRS has instructions on its website requesting that individuals voluntarily mail the appropriate economic impact payment amount sent to the decedent or incarcerated individual back to IRS, for both electronic and paper check payments. The envelopes in which paper checks were sent also have a checkbox to indicate if the recipient is deceased, which then could be mailed back to the Bureau of the Fiscal Service. Treasury has also held and canceled payments to decedents along with those that have been returned.

According to a Treasury official, of the $1.6 billion in economic impact payments sent to decedents, nearly 70 percent have been recovered. However, we were unable to verify that amount by the time we finalized our work on this report. We are working with Treasury to determine the number of payments sent to decedents that have been recovered.

Treasury was considering sending letters to request the return of outstanding checks and the repayment of amounts already paid by direct deposit or by checks that have been cashed. However, Treasury has not moved forward with this effort because, according to Treasury, Congress is currently considering legislation that would clarify or change the eligibility requirements of the payments, including payments to the deceased and incarcerated.

Paycheck Protection Program. We recommended that the Administrator of the Small Business Administration develop and implement plans to identify and respond to risks in the PPP to ensure program integrity, achieve program effectiveness, and address potential fraud, including in loans of $2 million or less. As of August 2020, SBA has begun developing oversight plans for the PPP but has not yet finalized or implemented them.

Specifically, SBA is currently working with Treasury to finalize plans for reviewing PPP loans. For example, SBA officials told us that a contractor would use an automated review tool to flag potentially questionable loans over $2 million and that the contractor would conduct manual reviews of flagged loans. According to SBA officials, SBA would then complete the reviews with a combination of contract and federal staff, and another contractor would perform a quality assurance review on a sample of loans. However, as of August 14, 2020, SBA was still working with Treasury to finalize the specific review procedures its contractors and staff would follow.

Matters for Congressional Consideration

In addition, to improve the government’s response efforts, GAO suggested three matters for congressional consideration.

Aviation preparedness. In our June 2020 report, we urged Congress to take legislative action to require the Secretary of Transportation to work with relevant agencies and stakeholders, such as HHS, the Department of Homeland Security (DHS), members of the aviation and public health sectors, and international organizations, to develop a national aviation-preparedness plan to limit the spread of communicable disease threats and minimize travel and trade impacts. We originally made this recommendation to the Department of Transportation (DOT) in December 2015. [72] As of August 2020, no aviation-preparedness plan had been developed.

Although DOT supports the inclusion of aviation in a comprehensive pandemic preparedness plan, it maintains that other federal agencies should lead such planning efforts. DOT has reiterated that because HHS and DHS are responsible for communicable disease response and preparedness planning, respectively, these departments should lead any efforts to address planning for communicable disease outbreaks, including for transportation. [73]

However, in May 2020, DHS stated that it had reviewed its existing national, sector, and modal plans for pandemic preparedness and response activities and determined that it is not best situated to develop a national aviation-preparedness plan. It noted that DOT, along with HHS and DHS, would be the appropriate leads. In June 2020, HHS stated that it is not in a position to develop a national aviation-preparedness plan because it does not have primary jurisdiction over the entire aviation sector or the relevant transportation expertise. Also, the National Response Framework—a guide to how the nation responds to all types of disasters and emergencies—identifies DOT as the lead federal agency for coordinating the management of transportation systems and infrastructure during domestic threats or in response to actual or potential incidents. [74]

Several recent developments indicate progress to respond to this recommendation. For example, in May 2020, the House of Representatives passed H.R. 6800, referred to as the HEROES Act, which would require DOT, in coordination with HHS, DHS, and other appropriate federal departments and agencies, to develop a national aviation preparedness plan. The legislation directs the plan to incorporate all elements referenced in the recommendation from our December 2015 report. The plan would also be required to provide for an adaptable and scalable framework to help align individual airport and airline plans, as well as improve coordination among appropriate federal, state, and local governments.

In addition, in May 2020, the Senate Committee on Commerce, Science, and Transportation favorably reported S. 3681, Restoring Safety in the Skies Act of 2020. This bill would require HHS, DHS, and DOT to form a joint task force on air travel during and after the COVID-19 public health emergency, and includes a provision for the task force to develop operating procedures to manage future anticipated public health crises affecting air travel. The task force would be focused on COVID-19 and the immediate aftermath of the pandemic, not future communicable disease threats.

In early July 2020, DOT, HHS, and DHS issued guidance to airports and airlines for implementing measures to mitigate the public health risks associated with COVID-19. [75] Among other things, the document establishes the principles for implementing public health measures in the aviation sector and identifies risk mitigation measures that should be applied for the entire passenger journey in the air transportation system, such as social distancing and contact tracing. While this guidance is a positive step, DOT has not taken action to develop an aviation preparedness plan for future communicable disease threats that incorporates all of the elements referenced in our 2015 report, such as protocols for responding to the threat and coordination among stakeholders. Without such a plan, the United States will not be as prepared to minimize and quickly respond to future communicable disease events.

Full access to death data. In our June 2020 report, we urged Congress to amend the Social Security Act to explicitly allow the Social Security Administration (SSA) to share its full death data with Treasury for data matching to prevent payments to ineligible individuals.

In June 2020, the Senate passed S.4104, referred to as the Stopping Improper Payments to Deceased People Act. If enacted, the bill would allow SSA to share these data with Treasury’s Bureau of Fiscal Service to avoid paying deceased individuals.

Fiscal assistance through Medicaid. In our June 2020 report, we urged Congress to use our Federal Medical Assistance Percentage (FMAP) formula for any future changes to the FMAP—the statutory formula according to which the federal government matches states’ spending for Medicaid services—during the current or any future economic downturn. Our past work has found that during economic downturns—when Medicaid enrollment can rise and state economies weaken—the FMAP formula, which is based on each state’s per capita income, does not reflect current state economic conditions. In addition, past efforts to provide states with temporary increases in the FMAP were not as timely or responsive as they could have been. No congressional action has been taken to date.

Agency Comments and Our Evaluation 


We shared a draft of this report with multiple agencies for review and comment. [76] Agencies provided the following comments:

Small Business Administration. In an email on August 14, 2020, SBA provided substantive comments on the report. SBA commented that the language in this report on PPP did not mention controls in place during the application process, rules and guidance that the agency had issued, or actions it had taken to create a portal for submitting loan forgiveness applications. SBA also stated that we had not included all of the information provided to us in interviews on its plans for loan reviews. As our goal was to provide a brief overview of actions SBA had taken in response to the recommendation in our June 2020 report that focused on SBA’s reviews of approved PPP loans, we did not make any changes to this report. We plan to provide more detailed information on the status of SBA’s plans for loan reviews and the loan forgiveness process in our next report on the CARES Act.

Technical comments. The following agencies provided technical comments, which we incorporated as appropriate: Departments of Labor, Commerce, Health and Human Services, Transportation, and the Treasury; the Federal Reserve; Office of Management and Budget; and Internal Revenue Service.

We are sending copies of this report to the appropriate congressional committees, the Director of the Office of Management and Budget, White House Coronavirus Task Force, and other relevant agencies. In addition, the report is available at no charge on the GAO website at https://www.gao.gov.

If you or your staff have any questions about this report, please contact me at (202) 512-5500 or dodarog@gao.gov . Questions can also be directed to Kate Siggerud, Chief Operating Officer, at (202) 512-5600, A. Nicole Clowers, Managing Director, Health Care, at (202) 512-7114 or clowersa@gao.gov or Orice Williams Brown, Managing Director, Congressional Relations, at (202) 512-4400 or williamso@gao.gov. Contact points for our Offices of Congressional Relations and Public Affairs may be found on the last page of this report.

Gene L. Dodaro

Comptroller General of the United States

Congressional Addressees

The Honorable Richard C. Shelby
Chairman
The Honorable Patrick J. Leahy
Vice Chairman
Committee on Appropriations
United States Senate

The Honorable Lamar Alexander
Chairman
The Honorable Patty Murray
Ranking Member
Committee on Health, Education, Labor, and Pensions
United States Senate

The Honorable Ron Johnson
Chairman
The Honorable Gary C. Peters
Ranking Member
Committee on Homeland Security and Governmental Affairs
United States Senate

The Honorable Nita M. Lowey
Chairwoman
The Honorable Kay Granger
Ranking Member
Committee on Appropriations
House of Representatives

The Honorable Frank Pallone, Jr.
Chairman
The Honorable Greg Walden
Republican Leader
Committee on Energy and Commerce
House of Representatives

The Honorable Bennie Thompson
Chairman
The Honorable Mike D. Rogers
Ranking Member
Committee on Homeland Security
House of Representatives

The Honorable Carolyn B. Maloney
Chairwoman
The Honorable James R. Comer
Ranking Member
Committee on Oversight and Reform
House of Representatives

References

Figures

  1. CDC Data on Higher-Than-Expected Weekly Mortality, January 1 through June 13, 2020
  2. National Weekly Initial Unemployment Insurance Claims, January 2019–July 2020
  3. Figure 1: Reported COVID-19 Cases per Day in the United States, as of August 20, 2020
  4. Figure 2: Reported COVID-19 Cases August 13-19, 2020, by State, per 100,000 Population
  5. Figure 3: CDC Data on Higher Than Expected Weekly Mortality, January 1 through June 13, 2020
  6. Figure 4: Indicators for Areas of the Economy Supported by the Federal Pandemic Response, 2015-2019 and March 2020-July 2020
  7. Figure 5: National Weekly Initial Regular Unemployment Insurance Claims, January 2019–July 2020
  8. Figure 6: Real Personal Consumption Expenditures for Health Care, Seasonally Adjusted, June 2019–June 2020
  9. Figure 7: Health Care Sector Employment, Seasonally Adjusted, July 2019–July 2020
  10.  

Tables

  1. COVID-19 Relief Appropriations, Obligations, and Expenditures for Six Major Spending Areas, as of July 2020
  2. Table 1: Time Frames for Reporting and Certifying COVID-19 Relief Spending Data
  3. Table 2: COVID-19 Relief Appropriations, Obligations, and Expenditures for the Six Largest Spending Areas, as of May, June, and July 2020
  4.  

Abbreviations

Abbreviation Description
BLS Bureau of Labor Statistics
CDC Centers for Disease Control and Prevention
COVID-19 Coronavirus Disease 2019
DATA Act Digital Accountability and Transparency Act of 2014
DHS Department of Homeland Security
DOT Department of Transportation
Federal Reserve Board of Governors of the Federal Reserve System
FMAP Federal Medical Assistance Percentage
HHS Department of Health and Human Services
HS Harmonized Schedule
ICU intensive care unit
IRS Internal Revenue Service
NCHS National Center for Health Statistics
NHSN National Healthcare Safety Network
OMB Office of Management and Budget
PPP Paycheck Protection Program
PUA Pandemic Unemployment Assistance
SAO Senior Accountable Official
SBA Small Business Administration
SNAP Supplemental Nutrition Assistance Program
SSA Social Security Administration
Treasury Department of the Treasury
UI unemployment insurance

End Notes

Contacts

A. Nicole Clowers

Managing Director, Health Care, clowersa@gao.gov , (202) 512-7114

Congressional Relations

Orice Williams Brown, Managing Director, williamso@gao.gov , (202)-512-4400
U.S. Government Accountability Office
441 G Street NW, Room 7125, Washington, DC 20548

Public Affairs

Chuck Young, Managing Director, youngc1@gao.gov , (202)-512-4800
U.S. Government Accountability Office
441 G Street NW, Room 7149, Washington, DC 20548

Strategic Planning and External Liaison

James-Christian Blockwood, Managing Director, spel@gao.gov , (202)-512-4707
U.S. Government Accountability Office
441 G Street NW, Room 7814, Washington, DC 20548

Obtaining Copies of GAO Reports and Testimony

The fastest and easiest way to obtain copies of GAO documents at no cost is through our website. Each weekday afternoon, GAO posts on its website newly released reports, testimony, and correspondence. You can also subscribe to GAO’s email updates to receive notification of newly posted products.

Order by Phone

The price of each GAO publication reflects GAO’s cost of production and distribution. Pricing and ordering information is posted on our website .

To Report Fraud, Waste, and Abuse in Federal Programs

Website: https://www.gao.gov/fraudnet/fraudnet.htm
Automated answering system: (800) 424-5454 or (202) 512-7470

Connect with GAO

Connect with GAO on Facebook , Flickr , LinkedIn , Twitter , and YouTube . Subscribe to our RSS Feeds or E-mail updates . Listen to our Podcasts . Visit GAO on our website and read the Watchblog .

GAO’s Mission

The Government Accountability Office, the audit, evaluation, and investigative arm of Congress, exists to support Congress in meeting its constitutional responsibilities and to help improve the performance and accountability of the federal government for the American people. GAO examines the use of public funds; evaluates federal programs and policies; and provides analyses, recommendations, and other assistance to help Congress make informed oversight, policy, and funding decisions. GAO’s commitment to good government is reflected in its core values of accountability, integrity, and reliability.

Copyright

This is a work of the U.S. government and is not subject to copyright protection in the United States. The published product may be reproduced and distributed in its entirety without further permission from GAO. However, because this work may contain copyrighted images or other material, permission from the copyright holder may be necessary if you wish to reproduce this material separately.
 

(104461)