Congressional attention, Office of Management and Budget (OMB) engagement, and federal agencies’ sustained leadership, planning, and execution are key practices for successfully addressing high-risk areas. Such practices have contributed to hundreds of billions of dollars saved since the High-Risk List was established. Further progress to narrow or remove the 37 areas remaining on GAO’s High-Risk List can contribute to saving additional billions of dollars, improving services to the public, and enhancing trust in government.
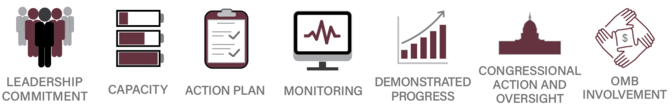
Key Practices for High-Risk Progress and Selected Benefits Achieved
Leadership commitment to initiate and sustain progress. For example:
To facilitate terrorism information sharing after the 9/11 terrorist acts, legislation was enacted that required the President to establish an Information Sharing Environment (ISE). Through ISE, agency leaders established policies, procedures, and technologies that strengthened the sharing of terrorism-related information among federal, state, local, tribal, international, and private-sector partners. These actions put our country in a better position to protect against terrorist threats and contributed to nearly $531 million in savings and removal of this area in 2017.
To address federal excess and underutilized properties, Congress passed and the President signed two reform bills and OMB developed a strategic framework to guide agencies’ real property management. Such efforts resulted in decreased lease costs, leading to a narrowing in scope of this high-risk area in 2011 and 2021. Benefits include nearly $3.6 billion in savings and estimated additional savings of $4.7 billion in lease cost avoidances through 2023.
Capacity (i.e., skilled staff, adequate funding, internal controls, technology, and management and organization infrastructure) to resolve key risks. For example:
To address turmoil in the savings and loan industry in the late 1980s and early 1990s, Congress created the Resolution Trust Corporation (RTC) in 1989 to resolve failed thrifts and dispose of their assets. Subsequently, Congress provided RTC with additional funding; mandated management reforms; and established an interagency transition task force to facilitate the transfer of RTC’s workload, personnel, and operations to the Federal Deposit Insurance Corporation. With adequate capacity and management improvements, RTC substantially completed its mission and was removed from the list in 1995.
An action plan to define the root causes and solutions and provide an approach for substantially completing corrective measures. For example:
To address interagency contracting abuses, OMB established a working group that addressed root causes GAO had identified—unclear roles and responsibilities for interagency contract managers and government customers, weak internal controls, and inadequate training for acquisition personnel. Congress also required management controls and set agency reporting requirements. These actions, among others, contributed to nearly $5 billion in savings and the area’s 2013 removal.
To address contract and project management problems at the Department of Energy (DOE), OMB directed DOE officials to develop a corrective action plan and performance measures for the National Nuclear Security Administration and Office of Environmental Management. DOE actions have led to nearly $14.5 billion in benefits, strengthened oversight, and resulted in narrowing the scope of this area in 2009 and 2013.
Monitoring to help agency leaders track and independently validate effectiveness and sustainability of corrective measures. For example:
To mitigate Department of Defense (DOD) supply chain management issues, Congress established statutory requirements for DOD to submit comprehensive plans for improved monitoring of asset visibility. DOD leaders subsequently developed detailed corrective action plans and a process for monitoring progress. These actions contributed to nearly $3.7 billion in savings from fiscal years 2006 through 2019 and the area’s removal in 2019.
Demonstrated progress in implementing corrective measures that address the root causes of high-risk areas. For example:
To better manage its excess infrastructure, DOD reduced its support infrastructure footprint and use of leases, improved its use of installation agreements, and implemented a set of key actions and outcomes. As a result, in fiscal year 2016, DOD accounted for 68 percent of government-wide office and warehouse space reductions and 75 percent of other property reductions. GAO removed this area in 2021.
To resolve funding challenges facing the Bank Insurance Fund (a precursor to the Deposit Insurance Fund), Congress took action to rebuild the Fund and reform corporate governance, regulatory, and accounting practices. As a result, the Federal Deposit Insurance Corporation rebuilt the Fund’s reserves and addressed risky banking activities that contributed to record numbers of bank failures and insurance losses during the late 1980s and early 1990s. The Fund’s balance became positive in 1993 and it was fully capitalized by May 1995. GAO removed this area in 1995. Since that time, the Deposit Insurance Fund has protected insured depositors, including those at the nearly 500 banks that failed as a result of the 2007-2009 financial crisis.
As shown below, most high-risk areas (nearly 52 percent) have either been removed from the list or narrowed in scope. Many others have shown significant progress in other ways, having met or partially met all five criteria for removal.
Status of All Areas on GAO’s High-Risk List, 1990–2021
Note: Some high-risk areas were narrowed in scope more than once and may have been removed after they were narrowed. They are only counted once. Significant progress means the high-risk areas were rated as met or partially met on all criteria in our 2021 High-Risk report (GAO-21-119SP). Some areas were not rated because they were very recently added to the list, primarily involve congressional actions rather than agency actions, or were consolidated with other high-risk areas.
Why GAO Did This Study
This report discusses key practices for successfully addressing federal programs and operations vulnerable to waste, fraud, abuse, or mismanagement, or in need of transformation. Since the inception of GAO’s High-Risk List in 1990, GAO has removed more than 40 percent of the areas on the list in response to demonstrated progress.
Five practices, which align with GAO’s criteria for removal from the list, have led to this progress and contributed to billions of dollars in savings. Federal financial benefits due to progress in addressing high-risk areas during the past 16 years (fiscal years 2006 through 2021) totaled more than $626 billion.
This report explains the relationship between the key practices and significant improvements to reduce risks. The examples of progress in this report can serve as a guide for federal action to successfully address areas that remain on the High-Risk List.
GAO reviewed prior high-risk reports to determine criteria and actions that contributed to the removal, narrowing, or sustained progress for selected high-risk areas. GAO also interviewed former and current agency officials to obtain their views on practices that resulted in progress on high-risk areas and corresponding achievement of related benefits.
Dedicated action to address areas with vulnerabilities to fraud, waste, abuse, and mismanagement, or in need of transformation is vital to make progress on the current and emerging challenges facing the nation. Since the high-risk program began in 1990, we have added 66 areas to our High-Risk List and removed more than 40 percent of these in response to sufficient progress addressing the problems identified. In addition, many high-risk areas remaining on the list have made meaningful progress and demonstrated significant financial and nonfinancial benefits. Progress addressing high-risk areas during the past 16 years (fiscal years 2006 through 2021) resulted in more than $626 billion in financial benefits to the federal government. Progress on high-risk areas has also resulted in many other benefits that cannot be measured in dollar terms, such as improved service to the public and enhanced ability to achieve agency missions.
Progress on high-risk areas requires top-level attention by federal officials. Five key practices that align with our criteria used to assess the areas on our High-Risk List—leadership commitment, capacity, action plan, monitoring, and demonstrated progress—provide a guide for federal actions to demonstrate progress. This report presents examples of high-risk areas (case illustrations) that have used the key practices to make overall progress. Lasting solutions to the federal government’s high-risk problems can potentially save billions of dollars, dramatically improve service to the American public, strengthen public confidence and trust in the performance and accountability of the national government, and ensure the ability of the federal government to deliver on its promises.
As shown in figure 1, since the start of the High-Risk List in 1990, most high-risk areas (nearly 52 percent) have either been removed from the list or narrowed in scope. Many others have shown significant progress in other ways, having met or partially met all five criteria for removal from the list.
Figure 1: Status of All Areas on Our High-Risk List 1990–2021
Note: Some high-risk areas were narrowed in scope more than once and may have been removed after they were narrowed. They are only counted once. Significant progress means the high-risk areas were rated as met or partially met on all criteria in our 2021 High-Risk Report (GAO-21-119SP). Some areas were not rated because they were very recently added to the list, primarily involve congressional actions rather than agency actions, or were consolidated with other high-risk areas.
We conducted this work under the authority of the Comptroller General in light of congressional interest in agencies’ progress on our High-Risk List. This report provides information on
the key practices that contributed to progress on selected high-risk areas that resulted in their removal from the High-Risk List or narrowing in scope, and the lessons learned from these areas; and
the financial and other benefits generated from our work on high-risk areas that have been removed from the list as well as areas that remained on the High-Risk List.
To identify the illustrative examples of progress, we reviewed our prior high-risk reports and the key practices that played a role in the removal or narrowing of each of the 27 high-risk areas since the inception of our High-Risk List in 1990. We conducted a qualitative analysis of how removed and narrowed areas made progress. We also reviewed our prior work on the underlying leading practices applicable to high-risk removal criteria. We selected case illustrations of high-risk areas based on considerations such as
demonstrated and sustained progress to address risks,
representation of a range of actions that illustrate the application of the key practices to support progress, and
inclusion of a mix of recent and older high-risk areas.
In addition to our prior reports, our case illustrations included review of congressional hearing transcripts and legislation. For areas removed from our High-Risk List, we also interviewed former and current agency officials, as well as our own, to obtain their views on how key practices contributed to the significant progress achieved for removed areas. To identify the financial and other benefits stemming from our high-risk work, we reviewed our own systems that track results from our recommendations and accomplishments.
We conducted our work from April 2021 to March 2022 in accordance with all sections of our Quality Assurance Framework that are relevant to our objectives. The framework requires that we plan and perform the engagement to obtain sufficient and appropriate evidence to meet our stated objectives and to discuss any limitations in our work. We believe that the information and data obtained, and the analysis conducted, provide a reasonable basis for any findings and conclusions in this product.
Key Practices Facilitate Agencies’ Progress on High-Risk Areas
The five high-risk criteria that must be met for removal of areas from our High-Risk List provide a guide for efforts to narrow and ultimately address high-risk issues. Figure 2 below illustrates the five high-risk criteria.
Figure 2: High-Risk Criteria Essential to Addressing High-Risk Areas
Below, we describe key practices that align with each high-risk criterion in more detail, identify why it is important, and provide examples of agencies’ actions to make progress toward removal from the High-Risk List. Additional details on actions that illustrate these key practices are available in the case illustrations section.
Leadership Commitment
We have consistently reported that leadership commitment is the critical element for initiating and sustaining progress and making the types of management and operational improvements required for narrowing or removing high-risk areas. Our experience has shown that sustained leadership commitment is essential to successfully addressing high-risk areas and mobilizing sufficient attention and resources for high-risk removal. Maintaining continuity of effort through changes in agency leadership or presidential administrations is critical to ensuring that progress and improvements do not degrade over time.
The practices listed in figure 3 can help agencies demonstrate leadership commitment and sustain continuity for high-risk area efforts:[1]
Figure 3: Key Practices to Demonstrate Leadership Commitment and Sustain High-Risk Efforts
In addition to agency leadership, leadership commitment also includes congressional action, as well as leadership from the Executive Office of the President and OMB. Congressional interest and oversight to improve the management and accountability of government are at the core of the high-risk program. Congressional action plays a critical role in meaningful progress to narrow some high-risk areas or result in removal from the High-Risk List. OMB can also lead and support agencies in addressing high-risk issues by monitoring agency efforts, convening working groups for specific management challenges, and coordinating and reviewing relevant regulations and guidance for implementing laws and clarifying executive branch initiatives.
Examples of high-risk progress related to leadership commitment include:
Establishing Effective Mechanisms for Sharing and Managing Terrorism-Related Information to Protect the Homeland. We designated this area as high risk in 2005 because the federal government faced serious challenges in analyzing key terrorism-related information and disseminating it among federal, state, and local government agencies as well as private-sector partners in a timely, accurate, and useful way.
To help ensure sustained and consistent progress toward the removal of this area in 2017, top leaders from across the federal government demonstrated commitment and support for addressing information sharing challenges. After the 9/11 terrorist acts, the Information Sharing Environment (ISE) was established in accordance with the Intelligence Reform and Terrorism Prevention Act of 2004 to facilitate the sharing of terrorism-related information among federal, state, local, tribal, international, and private-sector partners.[2] In general, ISE provided and facilitated the means for sharing terrorism-related information through the use of policy guidelines and technologies and put our nation in a better position to protect against terrorist threats.
In December 2012, the president facilitated organizational changes by adopting the National Strategy for Information Sharing and Safeguarding. This executive initiative provided guidance on implementing policies, standards, and technologies that promote secure and responsible national security information sharing. We removed this area in 2017 due to efforts by Congress and top government leaders to strengthen the sharing of terrorism, homeland security, law enforcement, and other information (which we collectively refer to as terrorism-related information). Savings related to this high-risk area totaled $531 million.
Managing Federal Real Property. We placed the management of federal real property on our High-Risk List in 2003 because we found that federal agencies had excess and underutilized real property; rapidly deteriorating facilities; unreliable real property data for strategic asset management; an overreliance on costly leasing in situations where ownership would be more efficient; and insufficient security.
To help address the long-standing problem of federal excess and underutilized property, Congress passed and the President signed two real property reform bills. The Federal Assets Sale and Transfer Act of 2016 established the Public Buildings Reform Board to identify and recommend real property reduction and other cost-saving opportunities.[3] The Federal Property Management Reform Act of 2016 codified the Federal Real Property Council (FRPC) for the purpose of ensuring efficient and effective real property management while reducing costs to the federal government.[4]
OMB’s Deputy Director for Management also demonstrated leadership as the Chair of the FRPC. To promote reform efforts, OMB helped develop the Federal Real Property Profile, a comprehensive database of federal real property assets which allows OMB to measure progress government-wide, and issued several key guidance documents. Both of these actions—plus the creation of the 2015 National Strategy for Real Property that provides a strategic framework to guide agencies' real property management—increased efficient real property use, controlled costs, and reduced real property holdings.
As federal agencies demonstrated progress, we were able to twice narrow the overall high-risk area. In 2011, we found that government-wide data reliability and managing the condition of facilities no longer remained high-risk concerns. In 2021, we found that the Costly Leasing segment no longer remained a high-risk concern. Such efforts resulted in decreased lease costs, leading to a narrowing in scope of this high-risk area in 2011 and 2021. Benefits include $3.6 billion in savings and estimated additional savings of $4.7 billion in lease cost avoidances through 2023.
The Year 2000 (Y2K) Computing Challenge. Prior to the year 2000, computer systems worldwide had typically used two digits to represent the year, rather than four digits. As such, leading up to the year 2000 rollover, computer systems were at risk of interpreting “00” as the year 1900 instead of the year 2000, “01” as 1901, and so on. Leadership and collaboration among Congress, the administration, federal agencies, state and local governments, and the private sector helped address the Y2K Computing Challenge. For example, in October 1998, the Year 2000 Information and Readiness Disclosure Act was enacted.[5] The act provided limited exemptions and protections for the private sector to facilitate the sharing of information on Y2K readiness. According to the President Council on Year 2000 Conversion, the act also paved the way for more disclosures about Y2K readiness and experiences with individual products and fixes.
Further, the President’s Council, which played an essential role in the Y2K remediation efforts, established more than 25 sector-based working groups, led by one or more federal entities that established partnerships with more than 250 organizations, to gather information critical to the nation’s Y2K efforts. The President’s Council was responsible for
ensuring that federal systems were ready for the date change,
coordinating Y2K efforts with interface partners (primarily states) for important federal services, and
promoting action on the Y2K problem among businesses and other governments.
Due to focused efforts by Congress, OMB, and two dozen major federal agencies, the U.S. avoided major national failures during the century-change rollover period, enabling us to remove this area from our High-Risk List in 2001.
Capacity
Capacity entails an agency having sufficient staff and resources to address its risks. Capacity also includes the management and organizational infrastructure necessary for an agency to achieve its mission. Human capital is a particularly important aspect of capacity and skills gaps affecting progress on many high-risk areas. In addition to having sufficient skilled staff, agencies must also build capacity by ensuring that adequate funding, internal controls, systems, structures, and technology are present to effectively carry out their mission.
Our work has shown that specific attributes pertaining to capacity include[6]:
Establishing and maintaining procedures or systems;
Establishing work groups with specific responsibilities;
Allocating or reallocating funds or staff;
Workforce planning;
Identifying current and emerging skills gaps;
Addressing skills gaps by providing guidance and training to staff and using flexibility in hiring authorities; and
Improving capabilities related to other high-risk criteria, such as action planning and monitoring.
The Resolution Trust Corporation is an example of a high-risk area that illustrates capacity to demonstrate progress.
Resolution Trust Corporation (RTC). Due to turmoil in the savings and loan industry in the late 1980s and early 1990s, the RTC was created in August 1989 to resolve failed savings and loan institutions (thrifts) and dispose of their assets.[7] We added RTC to our High-Risk List in 1990 because while original estimated costs that RTC would need to close known failed thrifts totaled $50 billion, the number of known failed thrifts had increased and RTC’s most conservative cost estimates had grown to nearly $90 billion by May 1990.
Based on our recommendations, Congress passed and the President signed several laws that provided RTC with adequate capacity to address its risks. These laws provided RTC with additional funding; mandated that RTC implement specific management reforms; and required the establishment of an interagency transition task force with specific responsibilities to facilitate the transfer of RTC’s workload, personnel, and operations to the Federal Deposit Insurance Corporation by January 1996.
With adequate capacity—along with improvements that RTC made in its estimating processes, internal controls, and financial management systems that enabled us to attest to the accuracy of RTC’s balance sheet beginning in 1991—RTC no longer posed the risk it once did and was removed from our High-Risk List in 1995.
Action Plans
Action plans are critical to success because they can help agencies articulate objectives and provide a roadmap for how the agency plans to achieve progress. Our work has shown that agencies should have a process to track these actions and communicate the progress made toward them. Such a process should identify for each action item, among other things, the responsible party, target completion dates, and significant milestones. In addition, our work has shown that agency leadership should hold responsible officials accountable for taking the agreed-upon actions and routinely communicating what they have completed. For example, one approach for holding officials accountable is to include high-risk elements in employee performance management systems.
Additionally, performance goals, measures, and milestones are necessary components of an action plan and an agency’s ability to monitor and demonstrate progress toward resolving its challenges. Our previous work has shown that federal agencies can develop action plans to make progress in their high-risk areas by using performance information to identify improvement opportunities, improve program implementation and organizational processes, and make other important management and resource allocation decisions.[8]
Effective action plans also identify the root causes of issues and propose actionable solutions. In particular, root cause analysis identifies multiple interacting causes that together produce an effect. The goal of root cause analysis is to identify as many causes, at whatever level of depth is necessary, to increase the chances of solving an underlying problem rather than treating a symptom. Once the causes are identified, action plans can be formulated to address them and make progress toward resolution.
Our work has shown characteristics that define the most effective action plans. Agencies’ action plans should:
establish goals and performance measures;
identify and analyze the root cause of problems;
identify critical actions, corrective actions, and outcomes to address root causes;
identify resources needed to implement the corrective actions, including funding, and stakeholders;
develop clear timelines, targeted milestones, and performance metrics to evaluate progress;
ensure that there is a process to report progress; and
be accessible and transparent to other agencies, Congress, and the public.
Examples of high-risk areas related to implementation of an action plan include:
Management of Interagency Contracting. We designated this area as high risk in 2005 due in part to the need for stronger internal controls, clearer definitions of roles and responsibilities, and training to ensure proper use of the interagency contracting method.
In response to our recommendations, the General Services Administration and OMB established corrective action plans. In addition, OMB and federal agencies addressed the root causes of interagency contracting abuses by acting on our prior recommendations and monitoring the implementation of new guidance and management controls. For example, OMB issued guidance to clarify the roles and responsibilities for agencies involved in interagency contracting transactions, including those responsible for prior abuses, in response to our recommendations. This guidance helped ensure that federal agencies were only using interagency contracts when they were in the best interest of the government and that agencies adhered to sound contracting practices.
Congress passed and the President signed several provisions of law mandating the revision of federal procurement regulations to establish additional management controls for interagency acquisitions, as well as reporting requirements for agencies, OMB, and various agencies’ inspectors general.[9] We cited this evidence of strengthened management controls, as well as the mechanisms that OMB and federal agencies had in place to monitor and address interagency contracting issues, as key reasons for removing the high-risk designation in 2013 and contributors to nearly $5 billion in savings.
Strengthening Department of Homeland Security (DHS) Management Functions. We initially designated implementing and transforming DHS as high risk in 2003 because DHS had to transform 22 agencies—several with major management challenges—into one department.
In 2011, DHS established an action plan for addressing its high-risk designation, referred to as the Integrated Strategy for High Risk Management (Integrated Strategy). The Integrated Strategy included key management initiatives and related corrective action plans for addressing DHS’s management challenges and the actions and outcomes we identified. In the June 2012 update to the Integrated Strategy, DHS included, for the first time, performance measures to monitor and track its progress in implementing all of its key management initiatives.
DHS’s progress in transformation and mission implementation enabled us to narrow the scope of the high-risk area in 2013. DHS had accomplished the task of bringing 22 separate organizations and missions together into one department. Additionally, several congressional actions contributed to progress implementing and transforming DHS. For example, DHS is required to report to us every 6 months to demonstrate measurable, sustainable progress until this area is removed from the High-Risk List.[10]
Department of Energy’s (DOE) Contract and Project Management for the National Nuclear Security Administration (NNSA) and Office of Environmental Management (EM). We first designated DOE’s contract management as a high-risk area in 1990. Contract management—which includes both contract administration and program and project management—is a high- risk area because of DOE’s record of inadequate management and oversight of its contractors.
In 2009, OMB asked DOE to develop a detailed corrective action plan for its contract management. DOE obtained input from OMB and DOE officials with contract and project management expertise to develop a root-cause analysis of its weaknesses, which it then used to develop a corrective action plan as well as performance measures to assess progress. These efforts contributed to progress on the high-risk area and enabled us to narrow the scope of the high-risk area in 2009 from a focus on DOE-wide contract and project management to NNSA and EM contract and project management. DOE actions have led to nearly $14.5 billion in benefits, strengthened oversight, and resulted in narrowing the scope of this area in 2009 and 2013.
Monitoring
A monitoring plan can help agency leaders track and independently validate the effectiveness and sustainability of corrective actions. Our work has shown that agencies can use performance data to determine the status of corrective actions and determine if they are having the desired effect on the root cause of the high-risk area and identify any unintended consequences.
As agencies establish their monitoring strategies, they should take the following actions[11]:
ensure agency capacity to collect, analyze, and communicate accurate, useful, and timely information;
match the complexity of the monitoring strategy with the complexity of the high-risk issue needing attention;
incorporate best practices in evidence-building when information needs to be created and applied to a monitoring program;[12]
use trend information to help determine the extent to which progress has been sustained;
track actions to implement our recommendations as an indication of progress to address high-risk issues;
incorporate reviews of high-risk issues into regular management reviews of agency goals and results and involve top agency leaders;
use communication methods which may include dashboards and other tools to track the progress of activities that address root causes; and
ensure accountability by holding senior agency managers responsible for making progress and having a plan if and when there is not sufficient progress.
Department of Defense supply chain management is an example of a high-risk area that illustrates monitoring to demonstrate progress.
DOD Supply Chain Management. We added this area to our High-Risk List in 1990, starting with a focus on inventory management, based on inefficient and ineffective management practices leading to excess inventory. In 2005, we added asset visibility (i.e., maintaining visibility of supplies) and materiel distribution (i.e., delivering supplies and equipment) to this high-risk area due to weaknesses identified during operations in Iraq and Afghanistan, including backlogs of hundreds of pallets and containers at distribution points.
Congressional action, such as provisions of the National Defense Authorization Acts for 2010 and 2014 requiring DOD to submit comprehensive plans to Congress, was critical to gaining DOD leadership commitment and developing DOD’s strategic guidance for its action plan and monitoring improvements.[13]
DOD established guidance and took steps to monitor asset visibility by establishing a process for monitoring progress. DOD developed detailed corrective action plans for supply chain management that identified key root causes of weaknesses, action items, targeted milestones, expected outcomes, measures of success, and a process for monitoring progress. These monitoring efforts included the 2010 Comprehensive Inventory Management Improvement Plan, which had actions and goals scheduled through fiscal year 2016 and included a follow-on improvement plan to guide efforts through 2020.
We narrowed this area in 2017 to remove the excess inventory portion of the overall high-risk area. In 2019, we removed the entire high-risk area from the list due to DOD’s efforts implementing and monitoring these actions as well as managing its inventory, maintaining visibility of supplies, and delivering supplies and equipment. These actions contributed to nearly $3.7 billion in savings from fiscal years 2006 through 2019.
As of July 2021, DOD reported it continues to monitor its improvements and supply chain management efforts. DOD has monitored materiel distribution by making progress in developing its suite of distribution performance metrics, improving the quality of their underlying data, and sharing metrics information with stakeholders. Senior departmental leadership also oversaw and monitored the implementation of corrective actions and performance on the associated metrics through monthly progress review meetings with representatives from the military services and the Defense Logistics Agency.
Demonstrated Progress
Progress means that problems are being addressed and risks are being reduced or better managed. Agencies can demonstrate progress by implementing corrective measures that address the root causes of high-risk issues and work to resolve them. While agencies do not need to eliminate all risks to meet the demonstrated progress criterion, they do need to show evidence of sufficiently managing them. Also, because high-risk areas often encompass long-standing management challenges, it is critical that agencies’ improvements are sustainable over the long term and allow agency leaders to show progress along the way.
To demonstrate progress, leaders can develop an overall implementation or action plan that keeps the agency’s efforts focused and specific to addressing the underlying root cause. Such a plan should show how progress will be sustained over time and provide a way for senior leaders to track desired outcomes and measures toward progress.
Agencies can take the following steps to demonstrate progress:
Implement our recommendations;
Use data to show action plan implementation;
Show high-risk issues are being effectively managed and root causes are being addressed; and
Take actions to ensure progress or improvements are sustained over time.
Examples of high-risk areas that illustrate improvement based on the demonstrated progress high-risk key practice include:
Department of Defense (DOD) Support Infrastructure Management. We designated this area as high risk in 1997 because of challenges DOD faced in reducing excess infrastructure, using underutilized facilities efficiently, and reducing base support costs. DOD demonstrated progress in aligning its infrastructure to its force structure needs by implementing actions to reduce excess infrastructure and achieve efficiencies in base support.
Over the years, we had identified 16 actions and outcomes that DOD needed to implement for its support infrastructure management to be removed from the High-Risk List. In the 2019 High-Risk List, we reported that DOD had made progress addressing nine actions and met the leadership commitment and action plan criteria. Congress aided this process by authorizing five Base Realignment and Closure rounds since 1988. The last round took place in 2005, which DOD used primarily to reduce excess infrastructure, readjust bases to accommodate changes in the size and structure of DOD’s forces, and produce cost savings.
In 2021, we removed this area from the High-Risk List because DOD addressed the outstanding seven actions and outcomes. Among other things, DOD had more efficiently used military installation space; reduced its infrastructure footprint and use of leases, reportedly saving millions of dollars; and improved its use of installation agreements, reducing base support costs. For example, under an OMB program to restrict the growth of excess or underutilized federal properties, in fiscal year 2016, DOD accounted for 68 percent of government-wide office and warehouse space reductions and 75 percent of other property reductions.
Bank Insurance Fund. We put the Bank Insurance Fund (Fund; a precursor to the Deposit Insurance Fund) on our High-Risk List in 1991 because unprecedented numbers of bank failures and insurance losses in the late 1980s and early 1990s had depleted the Fund’s reserves. These failures resulted from the banking industry’s shift to increasingly risky lending activities in response to a shrinking customer base and increased competition. Banks’ lending risks were exacerbated by weak internal controls, flawed corporate governance systems, and lax regulatory supervision. By year-end 1991, the Fund was in a deficit position.
We removed this area in 1995 because, in response to our recommendations, Congress passed and the President signed several pieces of legislation that facilitated progress. Specifically, section 2002 of the Omnibus Reconciliation Act of 1990 removed caps on premium increases and gave the Federal Deposit Insurance Corporation (FDIC) increased flexibility to set premium rates.[14] Additionally, the Federal Deposit Insurance Corporation Improvement Act of 1991 provided for rebuilding the depleted deposit insurance fund and required significant corporate governance, regulatory, and accounting reforms.[15] At the time, these reforms helped FDIC more effectively manage the Fund and address the root causes of weaknesses that contributed to earlier record bank failures.
FDIC rebuilt the Fund’s reserves, which stood at $17.5 billion on June 30, 1994, and addressed risky banking activities that contributed to record numbers of bank failures and insurance losses during the late 1980s and early 1990s. The Fund’s balance became positive in 1993 and it was fully capitalized by May 1995. We removed this area in 1995. Since that time, the Deposit Insurance Fund has protected insured depositors, including those at the nearly 500 banks that failed as a result of the 2007-2009 financial crisis. However, continued attention to banks’ lending practices is still needed because as the environment evolves, new challenges—such as those that resulted from the Great Recession—could arise that would pose new threats.
Our high-risk program continues to be a top priority and we will continue our emphasis on identifying high-risk issues across the government and providing recommendations and sustained attention to help address them by working collaboratively with Congress, agency leaders, and OMB.
Dedicated actions that leverage the key practices are vital to making progress on the current and emerging challenges facing the nation. Solving high-risk problems can potentially save billions of dollars, improve service to the American public, and help restore trust in government.
We are providing this report to the President and Vice President, congressional leadership, other Members of Congress, OMB, and the heads of major departments and agencies.
Gene L. Dodaro Comptroller General of the United States
Congressional Addressees
The Honorable Gary C. Peters Chairman The Honorable Rob Portman Ranking Member Committee on Homeland Security and Governmental Affairs United States Senate
The Honorable Carolyn B. Maloney Chairwoman The Honorable James Comer Ranking Member Committee on Oversight and Reform House of Representatives
This section highlights 12 case illustrations of high-risk areas to describe how they made progress. All 12 case illustrations describe financial and other benefits achieved from addressing our recommendations while the areas were on the High-Risk List.
Five high-risk areas were removed from the High-Risk List. Five high-risk case illustrations highlight and demonstrate key practices that contributed to their removal from the High-Risk List. Each case illustration includes actions taken and lessons learned that can guide agency officials in identifying strategies they can take to make progress in their own high-risk areas. The five high-risk case illustrations are
DOD Supply Chain Management,
Mitigating Gaps in Weather Satellite Data,
Establishing Effective Mechanisms for Sharing and Managing Terrorism-Related Information to Protect the Homeland,
Management of Interagency Contracting, and
The Year 2000 Computing Challenge.
One high-risk area narrowed in scope due to progress. The Managing Federal Real Property case illustration highlights and demonstrates its scope narrowing due to progress made while on the High-Risk List.
Six high-risk areas remain on the High-Risk List since 1990. The following six case illustrations demonstrate that although these areas have remained on the High-Risk List since 1990, they have achieved significant progress to address risks resulting in financial savings and other benefits:
DOD Weapon Systems Acquisition,
DOE's Contract Management for the National Nuclear Security Administration and Office of Environmental Management,
Due to significant progress made by the Department of Defense (DOD) in managing its inventory, maintaining visibility of supplies, and delivering supplies and equipment, we removed the DOD Supply Chain Management area from our High-Risk List in 2019. Actions by Congress and DOD were essential elements of achieving this result.
Effective and efficient supply chain management is critical for (1) supporting the readiness and capabilities of the military force and (2) helping to ensure that DOD avoids spending resources on unneeded inventory that could be better applied to other defense and national priorities. DOD Supply Chain Management was included on our High-Risk List in 1990—starting with inventory management—because of inefficient and ineffective management practices leading to excess inventory. In 2005, we added asset visibility (i.e., maintaining visibility of supplies) and materiel distribution (i.e., delivering supplies and equipment) to this high-risk area due to weaknesses identified during operations in Iraq and Afghanistan, including backlogs of hundreds of pallets and containers at distribution points.
In 2017, we removed inventory management from this area because DOD addressed each of our high-risk criteria, resulting in demonstrable and sustained improvements. For example, DOD made significant improvements in its management of “on-order excess inventory” (i.e., items already purchased that may be excess due to subsequent changes in requirements) and “on-hand excess inventory” (i.e., items categorized for potential reuse or disposal). These actions resulted in percentage reductions in the value of both categories from fiscal years 2009 through 2015. Because DOD made sufficient progress on monitoring and demonstrating progress, in 2019, we removed asset visibility and materiel distribution. For example, DOD completed 34 of the 39 initiatives to improve asset visibility and was continuing to focus on the remaining five initiatives as of 2019.
Key Practices Leading to Progress
Several key practices contributed to DOD’s progress in Supply Chain Management:
Congressional action was critical in gaining DOD leadership commitment and in developing DOD’s strategic guidance used for its action plan and monitoring improvements.
DOD demonstrated sustained agency leadership commitment through its development and participation in several intra-agency bodies focused on supply chain management issues.
To address statutory requirements and our recommendations, DOD developed strategic documentation and corrective action plans critical to addressing supply chain management challenges.
Between 2010 and early 2019, senior DOD officials met with us regularly to discuss the department’s plans and progress in addressing inventory management, asset visibility, and materiel distribution challenges, and we provided feedback on the department’s efforts throughout these meetings.
Leadership commitment. Senior officials—including the Assistant Secretary of Defense for Logistics and Materiel Readiness, the Deputy Assistant Secretary of Defense for Supply Chain Integration, the Commander of U.S. Transportation Command, and commanders of the combatant commands—demonstrated commitment and top leadership support for addressing the department’s supply chain management challenges.
DOD developed and used senior-level collaborative working groups to manage supply chain issues across the department. These groups included forecasting and demand planning, inventory and retention, and supply chain metrics working groups; the Supply Chain Executive Steering Committee; the Asset Visibility Working Group; and the Distribution Working Group. In particular, the Supply Chain Executive Steering Committee received a quarterly update brief and approved action item closures, as well as provided senior leader attention for any areas that required escalation.
Additionally, DOD provided continuity of effort on supply chain management issues at the leadership level. For example, DOD staff working on inventory management efforts remained generally consistent from 2010 through 2017. These staff took actions, such as establishing a performance management framework to monitor and implement its corrective action plan and revising inventory management policy and guidance, to institutionalize the commitment to help ensure the long-term success of the department’s efforts.
Corrective action plans and monitoring. DOD developed detailed corrective action plans for supply chain management that identified key root causes of weaknesses (which were in part based on a review of our prior work and recommendations), action items, targeted milestones, expected outcomes, measures of success, and a process for monitoring progress. This included its 2010 Comprehensive Inventory Management Improvement Plan, which had actions and goals scheduled through fiscal year 2016 and included a follow-on improvement plan to guide efforts through 2020. (See fig. 4.) As of July 2021, DOD stated it continues to use a similar concept to manage its efforts. Senior departmental leadership oversaw and monitored the implementation of its corrective actions and performance on the associated metrics through monthly progress review meetings with representatives from the military services and the Defense Logistics Agency (DLA). Additionally, between 2012 and January 2022, DOD implemented 17 of 18 GAO recommendations related to the Comprehensive Inventory Management Improvement Plan, providing DOD continued improvement managing its inventory.
Figure 4: A Timeline of the Department of Defense’s (DOD) Comprehensive Inventory Management Plan
In 2014, DOD issued its Strategy for Improving DOD Asset Visibility (Strategy) and accompanying implementation plans, with updates in 2015 and 2017. DOD provided guidance in its 2017 update to the Strategy for military components to consider key attributes of successful performance measures during metric development for their improvement initiatives. Military components followed the guidance and provided high-level summary metrics updates. DOD has taken steps to monitor asset visibility by incorporating into after-action reports, as appropriate, information relating to performance measures.
In 2014, we also sent a letter to DOD identifying the 16 actions and outcomes needed to address the area, and solicited DOD’s feedback. These actions and outcomes, which DOD generally agreed with, were updated and communicated with DOD in periodic check-ins over the years. This back and forth focused both on what DOD needed to do as well as its progress in addressing the agreed upon actions and outcomes identified in the 2014 management letter and our recommendations in our reports. For example, one action item recommended that DOD make progress in developing its suite of distribution performance metrics, improving the quality of data underlying those metrics, and sharing metrics information among stakeholders.
In 2016, DOD issued a corrective action plan, the Materiel Distribution Improvement Plan, to address the department’s materiel distribution challenges. DOD has monitored materiel distribution by making progress in developing its suite of distribution performance metrics, improving the quality of their underlying data, and sharing metrics information with stakeholders.
Ongoing and collaborative communication through regular check-in meetings with GAO to discuss progress and receive feedback were key to our success in improving our efforts and ensuring we were addressing the right issues.
– Jan Mulligan, Director of Supply, Office of the Deputy Assistant Secretary of Defense for Logistics
Throughout the years when DOD Supply Chain Management was on our list, DOD met with us periodically to discuss progress on supply chain management issues. According to DOD officials, this open dialogue, sharing of interim documents, and quick turnaround evaluations of DOD’s progress allowed the department to adjust its actions as needed.
Congressional Actions Leading to Progress
The National Defense Authorization Act (NDAA) for Fiscal Year 2010 required the Secretary of Defense to submit to Congress a comprehensive plan for improving the inventory management systems of the military departments and DLA with the objective of reducing the acquisition and storage of secondary inventory that is excess to requirements. DOD submitted a corrective action plan to Congress in November 2010 that aimed at reducing excess inventory by improving inventory management practices.
The NDAA for Fiscal Year 2014 required DOD to submit to Congress a comprehensive strategy and implementation plans for improving asset tracking and in-transit visibility. DOD issued this strategy in 2014 with updates in 2015 and 2017. By creating a clear link between the goals and objectives in the strategy and implementation plans, DOD was better positioned to monitor progress toward the implementation of its initiatives and achievement of its overarching goals and objectives for asset visibility.
Benefits
Financial benefits to the federal government due to progress in addressing the DOD Supply Chain Management high-risk area from fiscal year 2006 through fiscal year 2019, when we removed the high-risk area, totaled nearly $3.7 billion or an average of about $262 million per year.
DOD improvements in asset visibility and materiel distribution eliminated more than $82 million in costs within the supply chain through fiscal year 2019. For example, DOD implemented a cost-saving initiative to use aircraft tankers to carry lower cost fuel for use on follow-on mission legs in lieu of buying higher cost fuel en-route.
Between 2005 and 2019, when we removed the high-risk area, we made 126 recommendations on inventory management, asset visibility, and materiel distribution. As of January 2022, DOD implemented 96 of them.
In addition to financial benefits, there were 86 other benefits to the federal government due to progress in addressing the DOD Supply Chain Management high-risk area from fiscal years 2006 through 2019. For example:
DOD implemented our recommendation to develop metrics guidance and then used these metrics to monitor the efficiency and effectiveness of its inventory management. In doing so, the department was able to monitor the effectiveness and efficiency of its inventory management practices across the services and DLA.
Additionally, in response to our recommendations, DOD updated its Strategy to make clear the linkage between its goals and objectives and its asset visibility initiatives. As a result, DOD’s corrective action plan better positioned the department for success and for ultimate removal of DOD supply chain management from the High-Risk List.
By 2019—with strong congressional support and oversight—the National Oceanic and Atmospheric Administration (NOAA) and the Department of Defense (DOD) had made sufficient progress to warrant removing Mitigating Gaps in Weather Satellite Data from our High-Risk List. Both agencies had made significant progress in establishing and implementing gap mitigation plans, and NOAA launched satellites with advanced technological capabilities that have helped forecast and track frequent severe weather events.
NOAA and DOD regularly acquire and launch new weather satellites to replace aging satellites before they reach the end of their life spans. A gap in satellite data would result in less-accurate and less-timely weather forecasts and warnings of extreme events—such as hurricanes and floods. Given the criticality of satellite data to weather forecasts, the likelihood of significant gaps in weather satellite data, and the potential impact of such gaps on the health and safety of the U.S. population and economy, we added mitigating gaps in weather satellite data to the High-Risk List in 2013.
Key Practices Leading to Progress
NOAA demonstrated leadership commitment by establishing and implementing a strong governance structure and by inviting us and the Department of Commerce’s Inspector General (IG) to monthly program management meetings. At these meetings, NOAA communicated progress updates and regularly demonstrated its ability to analyze and respond to program risks.
NOAA and DOD established and implemented action plans to mitigate potential gaps in weather satellite data.
NOAA demonstrated progress by successfully launching replacement satellites. Both agencies also established schedules for future launches to ensure satellite data continuity.
Congress appropriated funds to NOAA for weather satellite data gap mitigation activities through the Disaster Relief Appropriations Act, 2013.[16]
We included this area on the High-Risk List in 2013 due to concerns with NOAA’s efforts to mitigate potential gaps in two complementary weather satellite systems: polar-orbiting satellites that provide a global perspective every morning and afternoon, and geostationary satellites that maintain a fixed view of the United States. (See fig. 5.) At that time, NOAA officials acknowledged there was a substantial risk of a gap in polar satellite data, with the extent of the gap depending on how long the aging satellites lasted and how soon new satellites could be developed, launched, and made operational. While NOAA did not anticipate a gap in geostationary satellite observations, such a gap could occur if the satellites in orbit did not last as long as anticipated or if the major satellite acquisition underway encountered schedule delays.
Figure 5: Examples of Satellite-Provided Weather Information
Leadership commitment. By 2017, NOAA had made significant progress in mitigating gaps in polar-orbiting satellite data. The agency demonstrated strong leadership commitment by addressing risks in new satellite acquisition programs and making plans to leverage other data sources to try to fill potential data gaps. As an example of this leadership commitment, NOAA invited us and the IG to monthly program management meetings, which allowed the agency to demonstrate its successful handling of cost, schedule, and technical risks over time.
Action plan. NOAA also established and improved an action plan for addressing the risk of a polar-orbiting satellite data gap. The plan identified gap mitigation options as well as the specific technical, programmatic, and management steps the agency would take to ensure these options were viable. However, concerns remained that the plan was not comprehensive because it did not include key information on the cost and effects of the different mitigation options, nor did it establish timelines for testing them, an issue that was identified as a priority recommendation to the Secretary of Commerce.
Leadership commitment to program milestones and stable funding led to an improved risk posture and helped stay on schedule.
— Ajay Mehta, Director of the Office of Satellite Ground Services within NOAA's Satellite and Information Service.
Also in 2017, we both narrowed and expanded this high-risk area. We narrowed the area by removing the focus on geostationary satellites because NOAA had demonstrated strong leadership, strengthened its plans for mitigating gaps in satellite data, and was actively monitoring its satellites’ health. Moreover, together with NASA, NOAA had demonstrated progress by successfully launching its next geostationary satellite. As a result, the agency had a robust constellation of operational and backup satellites in orbit.
One factor that contributed to the program’s success was building a strong, integrated, and collaborative relationship with NASA. In particular, creating a relationship that went beyond pointing fingers at each other when something went wrong was critical. NASA and NOAA have been doing joint management council meetings where upper management from both agencies are informed of the programs’ status at the same time. If there are problems, the two agencies work together to solve them.
— Greg Mandt, Former Program Director of NOAA’s Joint Polar Satellite System and NOAA’s Geostationary Satellite program.
On the other hand, we expanded the high-risk area to include DOD’s efforts to establish a new polar-orbiting satellite program to replace its own aging satellites. DOD’s satellites provide data from an early-morning orbit and are part of the constellation of satellites supporting weather forecasts. The department had been slow to establish plans for its follow-on satellite program and was relying on an older satellite that was well past its expected life span.
Demonstrated progress. In 2019, we removed this area from our High-Risk List because—with strong congressional support and oversight—both NOAA and DOD made progress in establishing and implementing plans to mitigate potential satellite data gaps. Specifically, NOAA had continued to expand and improve its action plans, and had demonstrated success by launching a new polar-orbiting satellite and having plans and schedules for future launches.
Continued collaboration, both within the Department and with GAO, put us in a spot where we saw that real progress was possible.
— Brian Doss, NOAA Management Analyst/ Alternate Audit Liaison.
NOAA officials—including satellite program managers and the audit liaison—also made extraordinary efforts to communicate with us to better understand what was needed to address specific recommendations on the gap mitigation action plan and to transparently report on progress in addressing those recommendations. Additionally, DOD, pursuant to the national defense authorization acts for fiscal years 2015 and 2016, and language in accompanying congressional reports, established and began implementing plans for a follow-on satellite program and for addressing key requirements that were not included in that satellite program. Figure 6, below, shows a timeline of progress that led to the removal of this issue from the High-Risk List.
Figure 6: A Timeline of Progress on the Mitigating Gaps in Weather Satellite Data High-Risk Area
Congressional Actions Leading to Progress
Congressional actions were instrumental in removing this area from the High-Risk List. For example:
Between 2013 and 2017, congressional subcommittees held multiple hearings to provide oversight of NOAA’s progress on the major weather satellite acquisitions and the risk of gaps in satellite coverage.
Congress appropriated funds to NOAA for weather satellite data gap mitigation activities through the Disaster Relief Appropriations Act, 2013.[17]
Provisions of the Carl Levin and Howard P. “Buck” McKeon National Defense Authorization Act (NDAA) for Fiscal Year 2015 limited the availability of certain DOD funds until the Secretary of Defense submitted a plan to the congressional defense committees related to weather satellites.[18] Similarly, the NDAA for fiscal year 2016 limited the availability of certain DOD funds until the Secretary of Defense briefed the congressional defense committees on plans for key weather requirements, and the Chairman of the Joint Chiefs of Staff certified that the plan would meet DOD weather requirements without negatively affecting mission needs.[19] These provisions encouraged DOD to develop and implement plans to address weather satellite requirements.
Benefits
Our recommendations related to this high-risk area resulted in significant benefits. Specifically, there were 29 benefits to the federal government while this issue was on the High-Risk List. For example, NOAA and DOD took action to establish and improve polar-orbiting satellite mitigation plans. In addition, NOAA improved its geostationary satellite contingency plans, increased its outreach to external users of satellite data, improved executive visibility into geostationary satellite reserve funds, improved its assessments of potential satellite gaps, integrated and improved polar-orbiting satellite schedules, modified processes for updating and verifying changes to public-facing satellite timelines, and improved cybersecurity controls on the polar-orbiting satellite system.
Establishing Effective Mechanisms for Sharing and Managing Terrorism-Related Information to Protect the Homeland
Due to efforts by Congress and top government leaders, we removed terrorism-related information sharing from our High-Risk List in February 2017. These efforts included strengthening how terrorism, homeland security, and law enforcement information, as well as other information (collectively referred to as terrorism-related information) was being shared. We designated terrorism-related information sharing as high risk in 2005 because the government faced serious challenges in analyzing key information and disseminating it among federal, state, local, and private-sector partners in a timely, accurate, and useful way.
Following the terrorist attacks of September 11, 2001, Congress and the executive branch took numerous actions aimed explicitly at establishing a range of new measures to strengthen the nation’s ability to identify, detect, and deter terrorism-related activities. For example, the Information Sharing Environment (ISE) was established in accordance with the Intelligence Reform and Terrorism Prevention Act of 2004, as amended, to facilitate the sharing of terrorism-related information among federal, state, local, tribal, international, and private-sector partners.[20] In general, the ISE provided and facilitated the means for sharing terrorism-related information through the use of policy guidelines and technologies.
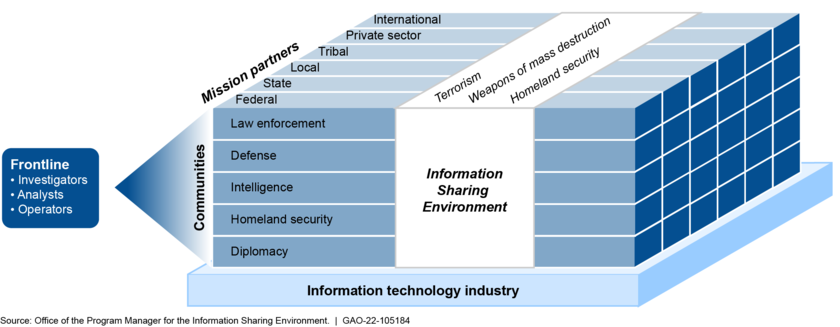
The Program Manager, the individual responsible for planning, overseeing, and managing the ISE, along with the key departments and agencies—the Departments of Homeland Security (DHS), Justice (DOJ), State, and Defense, and the Office of the Director of National Intelligence—were critical to implementing and sustaining the ISE. Figure 7 depicts the relationship between the various stakeholders and disciplines involved with the sharing and safeguarding of terrorism-related information through the ISE.
Figure 7: Elements of the Information Sharing Environment
Key Practices Leading to Progress
Key practices helped successfully address the terrorism-related information sharing issue and resulted in removal from our High-Risk List. For example:
Top leaders from across the federal government demonstrated commitment and support for addressing information sharing challenges, which helped ensure sustained, consistent progress.
The federal government established and largely executed an action plan, which marked a path for improved information sharing.
The Program Manager and key departments and agencies collaborated to strengthen how terrorism-related information is shared.
Leadership commitment. Top government leaders demonstrated commitment and support for addressing government-wide information sharing challenges. In December 2012, the President facilitated organizational changes by signing the National Strategy for Information Sharing and Safeguarding (National Strategy). This executive initiative provided guidance on implementing policies, standards, and technologies that promote secure and responsible national security information sharing. Also, the Program Manager clearly articulated a vision for the ISE that reflected the government’s terrorism-related information sharing priorities. Key departments and agencies also played important leadership roles by serving as stewards for priority information sharing initiatives.
Removing the area from the High-Risk List also required coordinated government efforts to strengthen how terrorism-related information is shared among federal, state, local, tribal, international, and private-sector partners. The federal government established an interagency policy committee to leverage the efforts of participating departments and agencies.
At the end of the day, I found that I needed to show people what good looks like and target a subset of the problem where I could rally a coalition of the willing across stakeholders.
— Kshemendra Paul, former program manager for the ISE
The Program Manager and key departments and agencies also collaborated to implement information sharing initiatives across all levels of government, including the Nationwide Suspicious Activity Reporting Initiative and expanding availability of a consolidated terrorist watch list. Further, the Program Manager promoted expanded collaboration on information sharing initiatives to state, local, tribal, territorial, and private-sector partners. This included the use of interoperable systems and disseminating best practices for sharing and safeguarding information.
Action plan. In a letter to the Program Manager in June 2011, we clarified the criteria and outcomes by which we would assess the government's progress in addressing the high-risk area. The letter summarized our characterization of progress made, as well as direction to the Program Manager for meeting the criteria. In subsequent annual reports to Congress, the Program Manager discussed progress made in addressing our criteria and remaining challenges.
GAO plays a key role with the High- Risk List for issues that are cross-cutting, in that it promotes finding ways to support innovation between agencies.
— Kshemendra Paul, former program manager for the ISE
The government developed and largely executed an action plan, the 2013 Strategic Implementation Plan (Implementation Plan), which included the overall strategy and more specific planning steps to implement the ISE. In addition to identifying key initiatives—such as those intended to control information access, safeguard information, increase a user’s ability to search for relevant information, and increase interoperability among data systems—the Implementation Plan addressed gaps in information sharing that ISE stakeholders identified and that we highlighted in our 2013 and 2015 high-risk reports.
For example, the plan established a priority objective dedicated to information sharing with the private sector. The government also used the Implementation Plan to track progress, address challenges, and substantially achieve the objectives in the National Strategy. The Implementation Plan contained 16 priority objectives, and by the end of fiscal year 2016, 13 of the 16 priority objectives were completed. The Program Manager transferred the remaining three objectives, which were all underway, to other entities with the appropriate technical expertise to continue implementation.
Congressional Actions Leading to Progress
The ISE was established in accordance with the Intelligence Reform and Terrorism Prevention Act of 2004, as amended, to facilitate the sharing of terrorism-related information among federal, state, local, tribal, international, and private-sector partners. The act also required the President to designate a Program Manager to plan, oversee, and manage the ISE.[21] The Program Manager submitted annual reports to Congress on the state of the ISE and information sharing across the federal government.
It was through congressional involvement and funding that the ISE was integrated more broadly in state and local law enforcement communities.
— Kshemendra Paul, former program manager for the ISE
OMB collaborated with the Program Manager of the ISE to plan and execute information sharing priorities across the government. This allowed departments and agencies to align budgets with ISE initiatives.
Strong and persistent support from OMB that spanned administrations aided in progressing the ISE.
— Kshemendra Paul, former program manager for the ISE
Financial benefits to the federal government due to progress in addressing the terrorism-related information sharing high-risk area totaled nearly $531 million for the 12 years when the area was on our High-Risk List (2005-2017). For example, in October 2008, we reported that DHS had yet to implement the full set of controls essential to effectively manage the acquisition of its Next Generation Homeland Security Information Network, which was to be a key system for sharing terrorism and related information.[22] DHS agreed with our recommendation that it strengthen its acquisition management controls before it started to implement the system. In October 2010, DHS terminated the program, which resulted in a cost reduction of $125,889,000 for fiscal years 2011 through 2015.
In addition, there were other benefits to the federal government due to progress made for the 12 years when the area was on our High-Risk List. For example, in April 2013, we reported that DHS, DOJ, and the Office of National Drug Control Policy did not hold field-based information sharing entities—including Joint Terrorism Task Forces, Field Intelligence Groups, Regional Information Sharing Systems centers, state and major urban area fusion centers, and High Intensity Drug Trafficking Area Investigative Support Centers—accountable for coordinating or assessing opportunities for further enhancing coordination to help reduce the potential for overlap and achieve efficiencies.[23] Federal agencies have since implemented our recommendations to (1) identify practices that could enhance the coordination and reduce unnecessary overlap across field-based information sharing entities, and (2) develop a mechanism that will allow them to hold field-based information sharing entities accountable for coordinating with each other.
Sustaining Progress
While progress in this former high-risk area is commendable, it does not mean the government has eliminated all risk associated with sharing terrorism-related information. It remains imperative that key departments and agencies continue their efforts to advance and sustain information sharing. Continued oversight and attention is also warranted given the issue’s direct relevance to homeland security, as well as the constant evolution of terrorist threats and changing technology. We continue to monitor this area, including the current status of the ISE, to ensure that the improvements are sustained.
As a result of progress made by agencies and actions taken by the Office of Management and Budget (OMB) and Congress, we removed the Management of Interagency Contracting from our High-Risk List in 2013.
Interagency contracting—where one agency either places an order using another agency’s contract or obtains acquisition assistance from another agency, usually for a fee—can help streamline the government procurement process. Further, it can take advantage of unique expertise in a particular type of procurement and achieve savings by leveraging the government’s buying power. Federal agencies’ use of interagency contracts grew rapidly in the late 1990s and early 2000s and we and various inspectors general noted problems related to their use. These problems included a lack of compliance with competition requirements, work being performed outside the scope of the contracts, and an inadequately trained acquisition workforce. We designated the management of interagency contracting as a high-risk area in 2005, due in part to the need for stronger internal controls, clearer definitions of roles and responsibilities, and training to ensure proper use of this contracting method.
Key Practices Leading to Progress
We removed the management of interagency contracting from the High-Risk List in 2013 based on (1) progress made by agencies in addressing previously identified deficiencies, (2) establishment of additional management controls, (3) creation of a policy framework for establishing new interagency contracts, and (4) steps taken to address the need for better data on these contracts. Key practices contributed to this progress.
Specifically:
Action plan: We were able to identify clear root causes of the problems that led to the high-risk designation and OMB was able to focus its planned actions on them.
Demonstrated progress: OMB and federal agencies demonstrated consistent progress in addressing the root causes of interagency contracting problems by acting on our prior recommendations and taking actions to ensure progress was sustained.
Congressional action and oversight: Congress passed legislation which required new management controls for interagency contracting as well as reporting requirements for agencies, OMB, and various agencies’ inspectors general.
OMB involvement: OMB issued key guidance documents designed to improve the use of interagency contracting across the government and regularly monitored agency efforts to implement management controls and other oversight mechanisms.
Action plans. According to the Associate Administrator for Federal Procurement Policy at OMB, our designation of interagency contracting as a high-risk area in 2005 was effective because it provided the federal contracting community with an incentive to act. The federal contracting community had come to prize the flexibility, efficiency, and cost saving potential of interagency contracting and the high-risk designation put that authority at risk unless the abuses we and others had identified were addressed. The desire to preserve this contracting authority also helped the federal contracting community achieve what the Associate Administrator called cultural acceptance of both the problems we highlighted in its high-risk designation and the resulting corrective actions.
After the high-risk designation, OMB’s Office of Federal Procurement Policy (OFPP) established a working group to improve the management and use of interagency contracts. The group’s initial efforts focused on reinforcing the proper use of interagency contracts through: (1) guidance to clarify the roles and responsibilities of interagency contract managers and their government customers; (2) program management reviews, including common metrics to benchmark results, quality assurance plans, and improved reporting on activities; and (3) training for the acquisition workforce to address the challenges associated with interagency contracting.
Demonstrated progress. OMB and federal agencies demonstrated progress in addressing the root causes of interagency contracting abuses by acting on our prior recommendations and monitoring the implementation of new guidance and management controls. For example, in June 2008, OMB issued guidance to clarify the roles and responsibilities for the agencies involved in these transactions in response to our recommendations.[24] This guidance helped ensure that federal agencies were only using interagency contracts when they were in the best interest of the government and that agencies adhered to sound contracting practices.
In June 2010, OMB surveyed agencies to assess their progress in implementing the June 2008 guidance and later summarized the results in a mandated report to Congress.[25] OMB conducted another survey in 2012 and found that most agencies had implemented management controls on interagency contracts and had oversight mechanisms to ensure their controls were operating properly. We cited this evidence of strengthened management controls as well as the mechanisms that OMB and federal agencies had in place to monitor and address interagency contracting issues as key reasons for removing the high-risk designation in 2013.
Further, the Associate Administrator for Federal Procurement Policy at OMB pointed to collaboration between OFPP, the Department of Defense (DOD), and the General Services Administration (GSA) as necessary and vital to demonstrating progress on the high-risk area. DOD and GSA were focal points because the former is the largest buyer in the federal government and the latter is the largest provider or manager of interagency contracts through its Multiple Award Schedules program. The Associate Administrator credited both DOD and GSA with playing a critical role in responding to congressional concerns about interagency contracting, developing and implementing new internal controls and agency guidance through mechanisms such as the Federal Acquisition Regulation Council, and getting the word out to their respective workforces about key corrective actions through memorandums and educational campaigns. See figure 8 for a timeline of key events for this high-risk area.
Figure 8: Key Events Related to the Management of Interagency Contracting High-Risk Area
Congressional Actions Leading to Progress
Congress took several key actions that complemented our recommendations and helped agencies sustain and demonstrate progress towards addressing the management of interagency contracting high-risk area. Specifically:
Congress mandated multiple revisions of federal procurement regulations to establish additional management controls for interagency acquisitions. In 2008, Congress strengthened requirements for interagency acquisitions performed on behalf of DOD as well as the competition rules for placing orders on multiple-award contracts. Congress also directed the revision of Federal Acquisition Regulation provisions on interagency acquisitions, which addressed two issues highlighted in our work. As originally implemented, the new regulations required agencies to (1) make a best procurement approach determination to justify the use of an interagency contract, and (2) prepare written interagency agreements assigning responsibility for the administration and management of the contract. The best procurement approach determination required that the requesting agency considered factors such as the suitability of the contract vehicle; cost effectiveness, including fees; and compliance with laws and policies.
Congress also required regular agency reporting to OMB and mandated that OMB (1) report on the use of interagency contracting, controls agencies use to manage them, their cost-effectiveness, and savings generated from their use; and (2) issue guidelines to help agencies improve their management of interagency contracting.
Congress required various agency inspectors general to review policies, procedures, and internal controls that were relevant to interagency acquisitions conducted on the behalf of DOD; their administration; and agencies’ compliance with defense procurement requirements. We consistently cited these and other inspectors general reports during the period that the management of interagency contracting was on the High-Risk List. They helped both us and the agencies involved demonstrate and monitor progress in addressing a variety of interagency contracting issues.
OMB Involvement
Because this was a government-wide high-risk area, OMB played a significant role in addressing the management of interagency contracting. Specifically, OMB:
convened a working group to improve the management and use of interagency contracting;
issued key guidance documents designed to improve the use of interagency contracting across the government, clarify the roles and responsibilities for the agencies involved in transactions, and govern the creation of new interagency contract vehicles; and
regularly monitored and reported on agency efforts to implement management controls and other oversight mechanisms.
Benefits
Financial benefits to the federal government due to our high-risk work on the Management of Interagency Contracts totaled nearly $5 billion during the 8-year period when the area was on our High-Risk List (2005-2013). For example:
GSA increased the use of preaward audits to negotiate reductions in contractors' proposed prices on its Multiple Award Schedules—the government's largest interagency contracting program—in response to recommendations we made in 2005. These audits helped reduce the proposed prices on the Multiple Awards Schedules program by nearly $4 billion.
DOD saved more than $13 million by reducing its use of the Department of the Interior to make purchases on its behalf. In 2005, we recommended that DOD monitor its use of other agencies’ contracting services, known as franchise funds, to ensure they were the best method for acquiring a particular good or service, considering the fees they charged.
There were also 76 other benefits to the federal government due to our work during the 8-year period when the area was on our High-Risk List (2005-2013). For example:
OMB developed guidance in response to our 2005 recommendation to help ensure interagency contracts were only used when they were in the best interest of the government and roles and responsibilities were clearly defined for all parties.
DOD put in place stricter contracting rules, which we recommended in 2004, to help promote competition and ensure DOD was receiving the best value for its money.
OMB took actions to help federal agencies avoid potential duplication and make better use of existing contracts by issuing guidance on the creation of new interagency contracts and implementing a searchable database based on our 2010 recommendations.
Due to efforts by Congress, the Office of Management and Budget (OMB) and two dozen major federal agencies, the U.S. avoided major national failures during the century-change rollover period. As a result, we removed The Y2K Computing Challenge from our High-Risk List in 2001. Prior to the year 2000, computer systems worldwide had typically used the last two digits to represent the year, rather than four digits. As such, leading up to the year 2000 rollover, computer systems were at risk of interpreting “00” as the year 1900 instead of the year 2000, “01” as 1901, and so on. The resulting miscalculations involving dates and the computation of elapsed time could have cascaded through all kinds of activities, such as loans, mortgages, pensions, tax records, and benefit payments. Because of its urgent nature and potentially devastating effect on critical government operations, in February 1997, we designated the Y2K problem a high-risk area for the federal government.
Key Practices Leading to Progress
By December 1999, the 24 major federal agencies named in the Chief Financial Officers Act of 1990 had increased their Y2K compliance (i.e. systems accurately process date and time data from, into, and between the 20th and 21st centuries) from 21 percent in May 1997 to 99.9 percent. Key actions that contributed to this progress included the following:
Bipartisan and bicameral congressional leadership and oversight played a key role in addressing the Y2K challenge by holding agencies responsible for demonstrating progress and by heightening public awareness of the problem.
In 1998, the President established the President’s Council on Year 2000 Conversion. This type of leadership commitment played an essential role in providing executive leadership in the government’s response to Y2K.
Congress, the administration, federal agencies, state and local governments, and the private sector worked collaboratively to take the necessary steps to remediate computer systems, and to partner on common issues, such as contingency planning and critical services.
As a result, in January 2001, we removed this area from the High-Risk List.
Key practices helped successfully address the Y2K challenge and resulted in removal from our High-Risk List.
Leadership commitment. Actions by the Chief Information Officers (CIO) Council, the President’s Council on Year 2000 Conversion, and OMB demonstrated the value of central leadership commitment and coordination. In November 1996, the federal CIO Council established a Year 2000 Committee, which met monthly and addressed important issues, such as acquisition and Y2K product standards, data exchange issues, telecommunications, and international issues.
In addition, the President’s Council on Year 2000 Conversion played an essential role in providing executive leadership in the government’s response. The President’s Council was responsible for (1) ensuring that federal systems were ready for the date change, (2) coordinating Y2K efforts with interface partners (primarily states) for important federal services, and (3) promoting action on the Y2K problem among businesses and other governments. The President also set the goal that no system critical to the federal government’s mission would experience disruption because of Y2K and charged agency heads with ensuring that this issue received the highest priority.
Collaboration and partnerships between the public and private sector and among federal, state, local, and international entities were key to addressing issues such as data exchanges and the coordination of business continuity planning for entire industrial sectors. Shortly after the President’s Council was established, we recommended that it use a sector-based approach and establish the effective public-private partnerships necessary to address this issue.[26]
Agencies’ implementation of nearly 100 percent of GAO’s recommendations was essential to the success of the effort. We made recommendations, they took action.
— Joel Willemssen, former Managing Director, Information Technology Team, GAO
The President’s Council subsequently established more than 25 sector-based working groups— led by one or more federal entities that established partnerships with more than 250 organizations—to gather information critical to the nation’s Y2K efforts and to address issues such as contingency planning. These partnerships also paid dividends during the century date rollover period when 11 private-sector organizations, designated as National Information Centers, provided information on the status of critical sectors, such as electric power and telecommunications. In addition, according to the former chair of the President’s Council on Year 2000 Conversion, public and private entities had a strong incentive to work together because they understood the potential consequences of not acting to address the issue.
Capacity. When agencies reported challenges in hiring and retaining personnel with the technical expertise needed to accomplish Y2K conversions, the federal government implemented initiatives that helped ensure that necessary staff and financial resources would be available to agencies. For example, the Office of Personnel Management, among other things, authorized agencies to reemploy federal retirees to work specifically on the Y2K conversion without the usual required reduction in the retiree’s salary or military annuity.
As a result of the government’s efforts, the 24 major federal departments and agencies increased their Y2K compliance from 21 percent in May 1997 to 99.9 percent by December 1999. Accordingly, during the century change and leap day rollover period, most Y2K-related errors reported by the federal government were minor and did not have an effect on operations nor on the delivery of services. See figure 9 for a timeline of key actions taken to address the Y2K high-risk area.
Figure 9: Timeline of Key Actions Taken to Address the Year 2000 Conversion Challenge
Congressional Actions Leading to Progress
Sustained bipartisan and bicameral congressional leadership played a key role in addressing the Y2K challenge by holding agencies accountable for demonstrating progress and by heightening public awareness of the problem. Congressional committees and subcommittees actively monitored progress by holding more than 100 hearings within 4 years to obtain information on the Y2K readiness of federal agencies, states, localities, and other important nonfederal entities, such as the securities industry.
The key turning point was when Congress passed, with unanimous consent, the Year 2000 Information and Readiness Disclosure Act which opened up the free flow of information in the private sector.
— John Koskinen, Chair of the President’s Council on Year 2000 Conversion and former Deputy Director of Management of the Office of Management and Budget from 1994 to 1997.
Key actions taken by Congress also included the 1996 development of a report card system for periodically grading agencies’ progress. The Subcommittee on Government Management, Information and Technology of the House Committee on Government Reform developed this system.
In 1998, the Senate established a Special Committee on the Year 2000 Technology Problem, which held numerous hearings on the readiness of key economic sectors, including power, health care, telecommunications, transportation, financial services, and emergency services.
In addition, the October 1998 enactment of the Year 2000 Information and Readiness Disclosure Act provided limited exemptions and protections for the private sector to facilitate the sharing of information on Y2K readiness. According to the President’s Council on Year 2000 Conversion, the act paved the way for more disclosures about Y2K readiness and experiences with individual products and fixes.
OMB Involvement
OMB played an important role in leading, coordinating, and monitoring federal Y2K efforts. Among its accomplishments, OMB
directed the major departments and agencies to submit quarterly reports beginning on May 15, 1997, to monitor individual agency progress;
designated lead agencies in March 1999 for the government’s 42 (later updated to 43) high-impact programs, such as food stamps, Medicare, and federal electric power generation and delivery; and
adopted the GAO Business Continuity and Contingency Guide for federal use and, in May 1999, required agencies to submit high-level business continuity and contingency plans.[27]
Benefits
We issued more than 160 reports detailing specific findings and made more than 100 recommendations to agencies and to the President’s Council on Year 2000 Conversion for improving the government’s readiness. Our Y2K recommendations were almost always adopted and, as a result, there were at least 167 benefits to the federal government.[28]
For example, we recommended that the President’s Council on Year 2000 Conversion require agencies to develop contingency plans for all critical core business processes.[29] Accordingly, OMB clarified its contingency plan instructions and, along with the CIO Council, adopted our business continuity and contingency planning guide for federal use, thus reducing the risks of disruption to major programs and services.[30] During the century-change rollover period, the U.S. did not experience major national system failures. Most Year 2000-related errors reported by the federal government were minor and did not have an effect on operations or the delivery of services. Even those that were significant (that resulted in degraded service or, if not corrected, would have so resulted) were mitigated by quick action to fix the problem or by implementing contingency plans.
Due to actions taken by the General Services Administration (GSA), Congress and other federal agencies, we have been able to recognize improvements for the overall high-risk area of Managing Federal Real Property, including narrowing the issue twice—in 2011 and 2021.[31] The federal government’s real estate portfolio is vast and diverse—including about 130,000 domestic civilian buildings as of fiscal year 2019 that cost billions of dollars annually to operate and maintain. We placed the management of federal real property on our High-Risk List in 2003 because we found that federal agencies had excess and underutilized real property; rapidly deteriorating facilities; unreliable real property data for strategic asset management; an overreliance on costly leasing in situations where ownership would be more efficient; and insufficient security.[32]
As federal agencies made progress, we twice narrowed the overall high-risk area. We found in 2011 and 2021, respectively, that managing deteriorating conditions of facilities and costly leasing were no longer high-risk issues because GSA and other agencies had addressed the criteria for these issues to be removed from the High-Risk List.
Key Practices Leading to Progress
The following key practices contributed to the improvements we recognized in the managing federal real property high-risk area:
GSA showed leadership commitment by implementing the Lease Cost Avoidance Plan and developed an action plan by creating a prioritized list for ownership investments in leased spaces.
Further, GSA leadership has consistently communicated its efforts to address costly leasing and regularly sought constructive and specific feedback through regular, quarterly meetings with us since 2013.
Congress enacted two real property reform bills to help address the long-standing problem of federal excess and underutilized property.
Leadership commitment and action plan. In 2021, we removed the Costly Leasing segment from the high-risk area because federal agencies and GSA exercised leadership commitment and action plan criteria by developing and implementing a Lease Cost Avoidance Plan that included the following initiatives directly related to reducing leasing and the costs of leasing: (1) moving leased tenants to federally owned space, (2) negotiating more competitive leases with longer terms, (3) reducing the size of leases, and (4) backfilling vacant leased space.
To implement our recommendations, GSA established criteria to prioritize leased spaces that would benefit from federal ownership; developed strategies for better managing leases; and drafted a proposal to loan agencies funds to improve newly leased spaces that could save tenant agencies millions of dollars in private sector loan interest charges. As of November 2021, according to a GSA official, Congress has not provided GSA with the authority to implement the proposal. GSA also improved its monitoring efforts through its Lease Cost Avoidance Plan that aggregates cost avoidance estimates and tracks instances of cost avoidance, such as leases negotiated below market costs.
Demonstrated progress. GSA leveraged the high-risk designation and the opportunity to narrow this designation as a motivator to seek constructive and specific feedback from us at regular quarterly meetings and implement changes in how the federal government manages its real property. For example, through quarterly meetings with us, GSA has been able to provide regular details about how it addressed the challenges that caused Managing Federal Real Property to remain high risk and answer questions. For example, at a quarterly meeting with us in 2018, GSA staff first laid out its Lease Cost Avoidance Plan and answered questions about its methods for tracking progress and estimating cost savings.
GAO’s dedication has truly made a difference in saving billions of dollars in GSA leasing. This gives us great incentive to continue improving in leasing and many other areas of our business.
– Deputy Commissioner, Public Buildings Service, Allison Azevedo
GSA demonstrated progress by reducing the number and costs of its leases, resulting in a downward trend in leased square footage over the last 6 years, as shown in figure 10.
Figure 10: Number of Square Feet Owned versus Number of Square Feet Leased (in Millions) by the General Services Administration as of June 2020
GSA’s efforts also resulted in more owned than leased space under the custody and control of GSA for the first time since 2007. In fiscal year 2019, GSA also reported that it avoided about $324 million in costs by moving tenants from previously leased space to federally owned space.
Congressional Actions Leading to Progress
In December 2016, Congress enacted two real property reform bills to help address the long-standing problem of federal excess and underutilized property. The Federal Assets Sale and Transfer Act of 2016 established the Public Buildings Reform Board to identify and recommend federal buildings for disposal.[33] Additionally, the Federal Property Management Reform Act of 2016 codified the Federal Real Property Council (FRPC) for the purpose of ensuring efficient and effective real property management while reducing costs to the federal government.[34] FRPC established a real property management plan template, which includes performance measures, strategies, and goals to reduce surplus property or to achieve better utilization of underutilized property. In addition, federal agencies are required to annually provide FRPC a report on all excess and underutilized property and identify leased space that is not fully used or occupied.
OMB Involvement
The Office of Management and Budget (OMB) has demonstrated an ongoing commitment to improving the federal government’s management of its real property though its Deputy Director for Management’s role as Chair of the FRPC. The council is made up of senior real property officers from 25 federal agencies. To promote reform efforts OMB has
helped develop the Federal Real Property Profile, a centralized database of federal real property assets that allows OMB to measure progress government-wide; and
issued several key guidance documents, including the 2015 National Strategy for the Efficient Use of the Real Property that provides a strategic framework to guide agencies' real property management, increase efficient real property use, control costs, and reduce real property holdings.
Benefits
Financial benefits to the federal government due to progress in addressing the management of the federal real property high-risk area over the past 16 years (fiscal year 2006 through fiscal year 2021) totaled nearly $3.6 billion. In addition, as noted in our 2019 High-Risk Report, GSA estimated that its Lease Cost Avoidance Plan in 2018 would reduce leasing costs by $4.7 billion by fiscal year 2023.
Most notably, based on our 2013 recommendation, GSA successfully implemented its plan to prioritize properties for ownership investments by purchasing the Department of Transportation’s headquarters building in 2020, which it had previously leased. GSA estimated that this move to owned space will save taxpayers more than $409 million in lease costs over 30 years. (See fig. 11.)
Figure 11: Department of Transportation’s Newly Purchased Headquarters Building
In addition, there were 220 other benefits to the federal government due to progress in addressing the Managing Federal Real Property high-risk area over the past 16 years. For example, in 2017, GSA implemented our September 2013 recommendation to develop a strategy to increase ownership investments for a prioritized list of high-value leases. These leases were for properties where it would be less expensive in the long run to own. That prioritized list later led to the successful purchase of the Transportation Headquarters discussed above.
In addition, in 2018, OMB proposed the creation of a capital revolving fund designed to facilitate ownership over operating leases for large-dollar buildings. An OMB staff member said that the legislative proposal to establish a capital fund was similar to an option we identified in a 2014 report. On maintenance, agencies increased transparency in their repair needs by prioritizing the most important projects.
What Remains to Be Done
We continue to monitor all areas of managing federal real property to ensure that the progress is sustained. In addition, we determined in our 2021 High-Risk series report that the federal government could better manage its real property portfolio by effectively disposing of unneeded buildings, collecting reliable real property data, and improving the security of federal facilities. Specifically, we recommended that the following actions be taken to continue progress in the Federal Real Property high-risk area.
To reduce the number of excess and underutilized properties, GSA in conjunction with the Public Buildings Reform Board should complete the sale of OMB-approved, high-value assets, per the Federal Assets Sale and Transfer Act of 2016.
To improve the reliability of real property data, GSA should better encourage federal agencies to implement action plans to assess, track, and correct data before submitting it to the Federal Real Property Profile—the government-wide database of federal real property assets.
To improve facility security, the Federal Protective Service should fully implement its guard training and tracking systems and ensure they are working as intended.
Continued progress is needed in three of the five criteria for removal from the High-Risk List. Each of these criteria are rated as partially met.
Congress and the Department of Defense (DOD) have taken actions over the years to make significant progress in the DOD Weapon Systems Acquisition high-risk area. This area was added to the High-Risk List in 1990 because DOD’s systems had been consistently costing more, taking longer to develop, and performing at lower levels than anticipated. DOD Weapon Systems Acquisition represents one of the largest and most complex areas of federal spending—in June 2021, we reported that DOD planned to spend more than $1.8 trillion to acquire 107 of its costliest weapon systems.
DOD implemented several key practices demonstrating progress in this high-risk area, including the following examples.
DOD implemented the Weapons Systems Acquisition Reform Act of 2009 (WSARA) and in doing so improved requirements setting and cost and schedule estimating. We subsequently identified substantial cost avoidances in programs that started development after DOD implemented this act.
DOD developed and implemented a series of reforms it referred to as Better Buying Power from 2010 to 2015, which included measures consistent with our past recommendations, such as setting and enforcing affordability constraints and eliminating duplication within portfolios of weapon systems.
DOD also cancelled or delayed investments in programs that we identified as having high-risk acquisition strategies or technical challenges that needed to be addressed, resulting in cost savings. For example, DOD realized savings from terminating the Army’s Future Combat System program in 2009, saving approximately $14.9 billion between 2010 and 2014.
Key Practices Leading to Progress
DOD implemented key practices to improve weapon systems acquisition, including some resulting in significant financial benefits. We have consistently reported that top DOD leadership remains committed to reforming the acquisition process for major weapon systems. For example, we noted in several updates to the High-Risk List that senior leaders championed reforms and policy updates that aligned with our recommendations and leading acquisition practices.
In 2006 and 2008, we found that DOD had adopted a framework for applying leading acquisition practices into a knowledge-based acquisition process in line with our recommendations. However, these practices were not applied consistently and cost and schedule overruns persisted. Subsequently, Congress, in the 2009 WSARA, enacted legislation that addressed many of our recommendations that DOD had not consistently implemented.
In 2013, we reported that DOD’s implementation of WSARA helped to reinforce the importance of developing key elements of a solid, executable business case—a justification for a proposed project or undertaking—including cost estimating, systems engineering, and testing. We found in 2012 that DOD’s implementation efforts had a significantly positive influence on programs in the 3 years since the act was enacted, particularly in areas such as requirement setting, cost and schedule estimating, testing, and system reliability planning—all past challenges. However, we also observed that more needed to be done to sustain the changes made.
Subsequently, we found in 2017 and 2019 that DOD’s efforts to reform its business case and cost estimation practices had resulted in DOD avoiding $36 billion in development costs from fiscal year 2011 to 2015 and $136 billion in procurement costs from fiscal year 2013 to 2017.[35] These savings were largely driven by DOD’s implementation of WSARA, which codified a number of leading acquisition practices we first recommended. See figure 12 for estimated procurement cost growth rates.
Figure 12: Annual Estimated Procurement Cost Growth Rate for Major Defense Acquisition Programs (2000-2017)
Leadership commitment. In 2017, we reported that during the previous 6 years, DOD had implemented a series of efforts for acquisition reform through its Better Buying Power initiative. These efforts included
setting and enforcing affordability targets,
instituting a long-term investment plan for portfolios of weapon systems,
implementing a new program management requirement to analyze detailed elements of program cost,
eliminating redundancies within portfolios, and
growing and training the acquisition workforce.
We noted these actions signaled progress, as DOD prescribed a number of concrete changes consistent with our past findings and recommendations. We also reported that DOD was making progress in decreasing overall cost growth of its major weapon systems, although the decrease was due primarily to reductions in a few programs.
Currently, DOD is implementing significant changes to its acquisition system in an effort to further improve weapon system outcomes. For example, in 2020, DOD issued guidance establishing the Adaptive Acquisition Framework, which includes six acquisition pathways based on the characteristics and risk profile of the system being acquired. DOD’s new framework has many potential benefits for weapon system acquisitions, including a more modern approach to software acquisition and an emphasis on cybersecurity throughout the acquisition life cycle. Moving forward, DOD will need to complete implementation of the framework and address other challenges to meet its goal of quickly delivering capabilities to the warfighter.
Congressional Actions Leading to Progress
Since 1990, Congress passed numerous laws related to reforming DOD’s process for acquiring weapon systems.[36] WSARA included several key aspects of acquisition reform:
generally requiring independent reviews and assessments of technology maturity before a program enters product development;
generally requiring preliminary design reviews before a program enters product development;
establishing a new director of cost assessments and program evaluations to, among other things, conduct independent cost estimates and cost analyses for certain programs;
requiring DOD to ensure the development and implementation of mechanisms to require consideration of trade-offs among cost, schedule, and performance objectives when developing requirements; and
requiring the designation of an official to conduct and oversee performance assessments of major defense acquisition programs, including a review of the program’s cost, schedule, and performance.
Benefits
In a series of reports we first issued in 1998 and continued for more than 2 decades, we identified leading acquisition practices DOD could use to improve the way it develops and acquires weapon systems. By 2016, DOD had implemented several recommendations related to these practices, including a number enacted in WSARA. At that time, we found evidence that selected programs started after the act’s implementation had less cost growth than those begun prior to the act.
Over the past 16 years (fiscal year 2006 through fiscal year 2021), we calculated almost $269 billion in financial benefits for DOD Weapon Systems Acquisition due to DOD’s continuing improvements and progress in this high-risk area, with an average of nearly $17 billion a year. A large portion of this total includes the costs we estimated DOD avoided, totaling $36 billion in development and $136 billion in procurement over 5-year periods resulting from the department’s implementation of WSARA.
In addition, the federal government realized 379 other benefits due to progress in addressing the DOD Weapons Systems Acquisition high-risk area over the past 16 years. These benefits include changes to DOD’s weapon systems acquisition policies and practices. For example, in 2020 DOD issued its software acquisition pathway guidance, which requires continuous engagement with users and incorporation of their feedback for programs developed using the pathway.
What Remains to Be Done
The operational environment and DOD’s approach to weapon systems continue to evolve, bringing new challenges and opportunities. For example, these systems face expanding global cybersecurity threats. A number of other issues could also affect DOD’s ability to keep pace with evolving threats, such as the capability to develop innovative technologies and the capacity of the defense industrial base to meet DOD’s needs.
Continued progress is needed in four of the five criteria for removal from the High-Risk List. Each of these criteria are rated as partially met. Based on our 2020 and 2021 annual assessments of DOD’s weapon systems, DOD needs to demonstrate further progress through consistent implementation of knowledge-based acquisition practices, even among its newer programs.
DOE’s Contract and Project Management for the National Nuclear Security Administration and Office of Environmental Management
Due to sufficient progress by the Department of Energy (DOE) over the years, we were able to narrow the DOE contract management high-risk area twice—in 2009 and 2013.
DOE is one of the largest contracting agencies in the federal government and primarily relies on contractors to carry out its programs and projects. DOE spends 80 to 90 percent of its annual budget on contracts and large capital asset projects.
We first designated DOE’s contract management as a high-risk area in 1990. Contract management—which includes both contract administration and program and project management—is a high-risk area because of DOE’s record of inadequate management and oversight of its contractors. We found that DOE had allowed its management and operating contractors extensive latitude in spending billions of dollars annually and had not required contractors to have financial audits despite continuing disclosures of abuse and poor management. Further, the department’s inadequate contract oversight had resulted in project cost and schedule overruns. In addition, we found that DOE had not developed clear management oversight processes to monitor contractors’ work.
In 2009, we narrowed the focus of DOE’s high-risk designation to two DOE program elements—the National Nuclear Security Administration (NNSA) and the Office of Environmental Management (EM). We did this to recognize the progress that one program office, DOE’s Office of Science, had made in overseeing its projects. In 2013, we further narrowed the focus of this high-risk area to NNSA’s and EM’s major contracts and projects—those with an estimated cost of $750 million or greater—to acknowledge progress NNSA and EM had made in managing smaller efforts.
Key Practices Leading to Progress
Several key practices contributed to DOE’s progress in the high-risk area, including:
Top leadership in DOE—such as the Deputy Secretary of Energy—demonstrated continuing support for addressing agency-wide contract and project management challenges. Leadership commitment to improving project management within the Office of Science particularly contributed to scoping the office out of the high-risk area.
DOE officials cited past collaborative meetings with the Office of Management and Budget (OMB) and us as being particularly helpful in making progress on the high-risk area as these meetings resulted in a root cause analysis and action plan.
DOE continued to improve its project monitoring efforts, such as by establishing metrics of success. The Office of Science demonstrated this effort particularly well, developing its own explicit guidelines in addition to DOE’s overall guidance.
Congress passed legislation establishing a Director of Cost Estimating and Program Evaluation within NNSA to conduct cost estimation and program evaluation. In response to this legislation, NNSA established the Office of Cost Estimating and Program Evaluation. According to NNSA, the analyses provided by the office have led to better project planning and performance.
Leadership commitment. DOE officials attributed many of their successes in addressing the high-risk area to direct involvement by top-level leadership. For example, one official discussed key project management meetings in 2007 and 2010, sponsored by the Deputy Secretary of Energy, that led to identifying the root causes for inclusion on the High-Risk List and ideas for addressing the causes. Additionally, with leadership support, DOE revised its project management order in 2010 to establish clearer requirements for identifying and documenting project scope at critical project decision points and has continued to revise this order to reflect project management best practices.
The number one thing you need in an agency to make concerted efforts to improve is leadership support. It is because of the leadership support I had early on that we were able to make some improvements.
— Paul Bosco, Director of DOE’s Office of Project Management
Key practices that leveraged the high-risk leadership commitment criterion led to removing the Office of Science from the high-risk area. Shortly after assuming the position in 2002, the Under Secretary of Science issued a memorandum to Office of Science staff articulating his commitment to achieving project cost and schedule targets, and that senior-level managers and project staff would be held accountable for doing so. The Under Secretary demonstrated sustained attention to this commitment in a 2007 testimony before Congress.
The most important thing is having agency leadership want to make the improvements that we believed we could make. This work has happened over the terms of several Secretaries. Continued leadership support is necessary to generate progress.
— Bob Raines, Associate Administrator of NNSA’s Office of Acquisition and Project Management
A DOE official also credited meetings with OMB and us as the impetus for DOE leadership to convene the project management meetings that occurred in 2007 and 2010. OMB’s Deputy Director encouraged these meetings between DOE, OMB, and us, which contributed to determining the definition of success in addressing the high-risk area. DOE officials noted that those meetings were helpful in ensuring OMB officials understood the challenges the department faced and what the department would need to address those challenges.
Monitoring. More broadly, DOE officials attributed their success in making progress in the project management area to establishing metrics of success. Specifically, DOE’s goal over a 3-year period is to deliver 90 percent of capital asset projects at their original scope and within 110 percent of original cost. DOE measures its progress against this goal and reports on it annually. Additionally, the Office of Science not only followed DOE’s overall guidance but developed more explicit guidelines, including convening review panels of technical and management experts from other Office of Science field sites and contractor laboratories, to monitor its projects.
[Providing regular reports on our progress against our goals] helped keep us on task and helped make sure we knew we were held accountable.
—Ingrid Kolb, Director of DOE’s Office of Management
DOE also now monitors its major capital asset construction projects through its Project Management Risk Committee, which provides advice on technical, cost, and schedule issues experienced by capital asset projects with a total project cost of $100 million or more, and other projects, as needed. Further, since its establishment in fiscal year 2014, NNSA’s Office of Cost Estimating and Program Evaluation has provided independent analysis of various aspects of the nuclear security enterprise, which, according to NNSA, has contributed to improvements in project planning and performance.
In addition, in response to a May 2015 recommendation, NNSA revised its performance evaluation guidance to specify that oversight activities now include evaluating the effectiveness of the systems contractors use to report on and assure their performance so that they can better be relied upon for federal oversight purposes. Further, in response to a March 2019 recommendation, DOE improved and updated its Procurement Evaluation and Re-Engineering Team Program, better positioning DOE to both identify and recover unallowable costs. See figure 13 for a summary of actions DOE has taken that contributed to the narrowing of the high-risk area.
Figure 13: Timeline of Actions Leading up to the Narrowing of the DOE Contract and Project Management High-Risk Area
Congressional Actions Leading to Progress
Congress has taken a number of actions to address DOE’s contract management challenges and communicate how seriously Congress views the issue. For example:
Congress directed NNSA to develop a series of cost reports in the Conference Report on the Energy and Water Development Appropriation Act for Fiscal Year 2002. The reports helped provide more transparency over the cost of NNSA’s life extension projects.
Congress passed the National Defense Authorization Act for Fiscal Year 2014, which established the position of Director for Cost Estimating and Program Evaluation within NNSA. Among other responsibilities, the office established under this Director conducts independent cost estimates, as directed by the NNSA Administrator, and independently reviews cost estimates and evaluates performance baselines for certain programs. According to NNSA, the analyses provided by the office have led to better mission planning and performance.
Numerous congressional committees have held hearings to hold DOE—and DOE’s program elements, such as the Office of Science—accountable for contract and project performance. Such hearings encourage DOE to continue its focus on making progress in the area.
OMB Involvement
In 2009, we found that OMB asked DOE to develop a detailed corrective action plan for its high-risk area. DOE obtained input from DOE headquarters and field officials with contract and project management expertise to develop a root-cause analysis of its weaknesses. DOE then used this analysis to develop a corrective action plan and performance measures to assess progress.
Benefits
Financial benefits to the federal government associated with actions DOE has taken to address contract and project management-related recommendations over the past 16 years (fiscal year 2006 through fiscal year 2021) totaled nearly $14.5 billion. For example, according to DOE and NNSA officials, our past work resulted in identifying cost growth that ultimately led to NNSA terminating a key facility in 2018 and resulted in a nearly $13 billion financial benefit. (See fig. 14.)
In addition, there were 121 other benefits to the federal government due to progress in addressing the DOE Contract and Project Management high-risk area over the past 16 years. For example,
In response to our May 2015 recommendation, NNSA revised its performance evaluation guidance to specify that oversight activities now include evaluating the effectiveness of the systems contractors use to report on and assure their performance so that they can better be relied upon for federal oversight purposes.
In response to our March 2019 recommendation, DOE improved and updated its Procurement Evaluation and Re-Engineering Team Program, better positioning DOE to both identify and recover unallowable costs.
Figure 14: Partially Completed NNSA Construction Project Cancelled in 2018 Following Adoption of New Project Management Practices
What Remains to Be Done
DOE has made progress in managing its contracts and projects since being placed on the High-Risk List. NNSA and EM have partially met five out of the five criteria that we track for high-risk areas, but, as we reported in our 2021 High-Risk Report, they still have room to improve.
For example, both NNSA and EM could take actions to improve their capacity. Specifically, NNSA does not have a process to determine the number of acquisition professionals it needs to award and oversee contracts. In November 2020, we found that EM had significant staffing shortages at its site office responsible for the Waste Isolation Pilot Plant in New Mexico.
In addition, both offices could improve their monitoring efforts. NNSA has not developed a full set of program management tools to monitor schedule performance for some program activities, as required by its program execution guidance. EM does not accurately track or report whether cleanup milestones are met, missed, or postponed, and sites continually renegotiate milestones they are at risk of missing.
Actions taken by Congress and IRS have resulted in significant progress over the years in the Enforcement of Tax Laws high-risk area. IRS Enforcement of Tax Laws has been on the High-Risk List since 1990 and originally focused on collection of tax debt. As enforcement risks evolved, we expanded the scope of the high-risk area to include addressing the tax gap—the $441 billion difference each year between taxes owed and taxes paid on time. In 2015, we expanded the area to include IRS’s efforts to address identity theft refund fraud, which occurs when an identity thief files a fraudulent tax return using a legitimate taxpayer’s identifying information to claim a refund, costing the government millions of dollars every year.
IRS has made changes to improve the Enforcement of Tax Laws. For example, IRS:
Established the National Research Program (NRP) in 2002 to obtain data to better understand compliance and improve the effectiveness of its programs.
Instituted the Withholding Compliance (WHC) Program starting in 2005, which increased tax collections by hundreds of millions of dollars by instituting minimum withholding for certain noncompliant taxpayers.
Took multiple actions over time to improve and implement programs to promote voluntary compliance from taxpayers at differing income levels and in different financial situations.
Improved its ability to use Forms W-2 to verify information and identify discrepancies reported on tax returns before issuing refunds, beginning efforts in 2015 that have reduced the risk of fraud and noncompliance.
Key Practices Leading to Progress
Leadership commitment and monitoring. IRS, with support from Congress, has taken a number of notable actions to improve its understanding of compliance, improve withholding compliance, promote compliance among different groups of taxpayers, and strengthen its fraud detection and prevention capabilities. These actions have produced benefits in terms of cost savings, revenue protection, and improved enforcement.
IRS’s establishment of NRP and efforts to use compliance data represent significant progress in the Enforcement of Tax Laws area and demonstrate strong leadership commitment to reducing the tax gap. Launched in 2002, NRP is an ongoing effort that provides IRS with more current and useful information about compliance while minimizing taxpayer burden. IRS used early NRP data to update its estimate of the tax gap and revise the formulas used to select individual income tax returns for examination. These updated formulas led to increased tax assessments and collections, thereby increasing revenue and better focusing IRS resources on noncompliant taxpayers.
In 2003, we reported on weaknesses in IRS’s Questionable Form W-4 Program. This program maintained data about taxpayers who claimed more than 10 withholding allowances and taxpayers who claimed exemption from federal income tax withholding. We identified concerns about the reliability of the information IRS maintained and recommended that IRS assess the value of the program to determine whether it should continue. As a result of our recommendation, IRS pilot tested the WHC Program in 2005. The new program increased collections by hundreds of millions of dollars in its first 5 years.
IRS has addressed compliance issues for taxpayers in different segments of the population, including recipients of the earned income tax credit and those using offshore accounts to evade taxes. For example, IRS took steps to make it easier for low-income taxpayers to comply with earned income credit requirements. Based on our 2002 recommendations, IRS revised its earned income credit forms and clarified its guidance on the documentation needed to support recertification claims. To promote voluntary compliance among higher income taxpayers using offshore accounts for tax evasion, in 2009, IRS developed the Offshore Voluntary Disclosure Program (OVDP). Through the program, 56,000 taxpayers with undisclosed offshore accounts paid a total of $11.1 billion in back taxes, interest, and penalties. In 2013, we recommended changes IRS could make to OVDP that resulted in millions of dollars in additional collections.
IRS has made significant strides in its ability to identify fraud and noncompliance before it issues refunds. In the past, IRS struggled to conduct prerefund compliance checks because it did not receive information from employers on taxpayers’ income (Forms W-2, Wage and Tax Statement) that it could use to check against tax returns until after it issued most refunds. In 2015, IRS assessed the costs and benefits of an earlier filing deadline for forms W-2 and presented its findings to Congress, as we recommended. Congress accelerated W-2 filing deadlines, giving IRS access to W-2 data to identify potential fraud and noncompliance before issuing refunds.[37] IRS has prevented billions of dollars in invalid refunds since the new filing deadline was implemented.
Congressional Actions Leading to Progress
Congress has passed numerous pieces of legislation contributing to IRS’s ability to enforce tax laws, many influenced by our work in this area. Together, these laws have reduced costs and enhanced revenues by billions of dollars. For example:
Legislative action has increased electronic filing of returns. The Worker, Homeownership, and Business Assistance Act of 2009 included an electronic filing mandate for certain paid preparers, as we suggested in 2006.[38] We estimated that this change saved IRS $17.2 million in processing costs the first year it went into effect. The Taxpayer First Act of 2019 allowed IRS to further lower the electronic filing threshold for information return filers.[39]
Legislation has also increased third-party information reporting. The Housing and Economic Recovery Act of 2008 required new information reporting on merchants’ income obtained from transactions involving payment cards, such as credit and debit cards, or third-party payment networks, such as PayPal.[40] Our body of work on tax compliance issues and the costs and benefits of information reporting contributed to Congress’s consideration and passage of this requirement. The Joint Committee on Taxation estimated that these new requirements would have a positive revenue effect of $9.5 billion over a 10-year period.
Additional legislation improved IRS’s ability to audit large partnerships efficiently. The Bipartisan Budget Act of 2015 established a new partnership audit regime that allowed IRS to make adjustments to taxes owed at the partnership level.[41] This change was driven by a matter for congressional consideration that we made in 2014. The law allowed IRS to save resources, collect taxes owed by partners more easily, and improve its audit efficiency. The Joint Committee on Taxation estimated that the partnership audit adjustment changes would have a positive revenue effect of more than $9.3 billion through 2025.
Benefits
Financial benefits to the federal government due to progress in addressing the enforcement of tax laws high-risk area over the past 16 years (fiscal year 2006 through fiscal year 2021) totaled more than $34.4 billion. For example:
Eliminating the Questionable W-4 program and instituting the WHC program resulted in significant increases in collections. Our work identified concerns about the value and fairness of using the Questionable W-4 program database for compliance purposes because of uncertainties about the extent to which the data were complete and current. In addition to addressing these issues, we estimated that the WHC program resulted in $987 million in additional income tax collections in its first 5 years.
Our recommendation that IRS assess the costs and benefits of accelerating W-2 deadlines led to substantial financial benefits. By improving its ability to conduct compliance checks before issuing refunds, IRS prevented more than $3 billion in invalid refunds in the first 3 years since the new deadline for filing forms W-2 was implemented.
In addition to financial benefits, there were 289 other benefits (nonfinancial) to the federal government due to progress in addressing the Enforcement of Tax Laws high-risk area over the past 16 years. These benefits include improved research, systems, and delivery of benefits for qualified taxpayers.
For example, the development of NRP was a significant achievement for IRS. Data gathered by the program has improved IRS’s understanding of compliance and helped the agency make improvements to its programs.
In addition, IRS has implemented recommendations to improve and expand the Return Review Program, the system IRS uses to screen returns for fraud and noncompliance before issuing refunds.
In 2020, as part of our review of the Economic Impact Payments (EIP)—direct payments first mandated by the CARES Act to address pandemic-related financial stress—we identified several challenges that delayed the receipt of those payments to some eligible recipients.[42] The actions that IRS took to address the challenges encountered by some federal beneficiaries with qualifying child dependents allowed more recipients to receive the full amount for which they were eligible in a timelier manner.
What Remains to Be Done
Although IRS has made progress to address the Tax Law Enforcement high-risk issue, it remains on our High-Risk List because of continuing risks and challenges. Continued progress is needed in four of the five criteria for removal from the High-Risk List. Each of these criteria are rated as partially met.
IRS’s workload has grown more complex as the tax code has grown more complex. IRS’s capacity to implement new initiatives, carry out ongoing enforcement and taxpayer service programs, and combat identity theft refund fraud remain a challenge.
Given the persistence of the tax gap, as shown in figure 15, reducing it will require continued IRS action to improve audit effectiveness and resource investments coupled with targeted legislative actions. We have made numerous recommendations and matters over the years that we believe would enhance revenue and produce cost savings in this area. For example, we have previously reported that expanding third-party information reporting to include certain payments rental real estate owners make to service providers and for payments businesses make to corporations for services could increase revenue by billions of dollars.
Figure 15: Despite IRS and Congressional Actions, the Tax Gap Remains a Persistent Problem
The Centers for Medicare & Medicaid Services (CMS) and Congress have reduced costs by billions of dollars and strengthened the Medicare program by addressing the majority of our recommendations, particularly with respect to provider payments, program integrity, and beneficiary protections.
Medicare, one of the largest entitlement programs in the federal budget, is estimated to have spent about $926 billion in 2020—more than $2.5 billion per day—to provide health care services for approximately 63 million elderly and disabled beneficiaries. About 60 percent of these beneficiaries (about 37.6 million) are enrolled in Medicare’s traditional fee-for-service (FFS) program while about 40 percent (about 25 million) are enrolled in Medicare Advantage—private plans offered under Medicare. In fiscal year 2020, Medicare contractors that pay FFS claims processed more than 1 billion claims from more than 1 million health care providers enrolled in the program.
We first designated Medicare as a high-risk program in 1990 due to its size, complexity, and effect on both the federal budget and the health care sector, as well as its susceptibility to mismanagement given the large volume of claims processed annually. The Medicare program is subject to frequent legislative updates to provider payments and other policies, which establish the parameters within which CMS administers the program. (See fig. 16.)
Figure 16: President Lyndon B. Johnson Signing the Medicare Program into Law on July 30, 1965
Key Practices Leading to Progress
Provider payments. To be a prudent purchaser of health care services, Medicare’s provider payment rates must be set at a level that maintains beneficiary access to care while also covering providers’ reasonable costs and encouraging efficient resource use. CMS has shown the leadership commitment to help achieve this goal by refining Medicare’s fees paid to providers under the traditional FFS program—including to physicians, suppliers, and hospitals—as well as for certain types of high-cost services. Examples of these key practices include:
In 2005, consistent with our 2001 recommendation, Medicare reduced its fees for certain outpatient prescription drugs provided in physicians’ offices to reflect significantly lower market-based prices. These refinements have more closely aligned fees with market-based prices and costs, resulting in about $4.3 billion in savings over a 10-year period, based on estimates from CMS.
Consistent with several of our recommendations, Medicare also refined fees for physician and other outpatient services to recognize cost efficiencies that occur when such services are provided together. For example, starting in 2013, Medicare reduced payments for certain types of therapy services that are provided by the same physician to the same beneficiary on the same day—as had been done for imaging and other tests—which would save about $1.8 billion from fiscal years 2013 through 2022, according to the Congressional Budget Office (CBO). Similarly, in 2011, Medicare refined the bundled per-treatment rate for dialysis and related services to better reflect the actual costs and utilization of injectable drugs, resulting in estimated savings of about $2.1 billion from fiscal years 2014 through 2018. Further, in 2019, Medicare bundled some payments for groups of common laboratory tests generally provided together, rather than paying separately for each component test, which we estimated would save about $6.7 billion from 2019 through 2020.
From fiscal years 2018 to 2020, CMS implemented our 2016 recommendation to base hospital payments for uncompensated care—services provided to uninsured and other low-income individuals—on hospitals’ actual uncompensated care costs rather than other proxy estimates, resulting in estimated savings of about $7.2 billion from 2018 through 2021.
Program integrity. Medicare faces a significant risk of improper payments—payments that were either incorrectly made or should not have been made at all—with estimated improper payments reaching $43 billion in fiscal year 2020. CMS has continued to demonstrate the leadership commitment and capacity needed to ensure the integrity of the Medicare program in response to our continued reporting and focus on improper payment rates.
For example, CMS has reduced improper payment rates by implementing greater prepayment control efforts and using its Fraud Prevention System.
CMS implemented many of our recommendations related to prepayment edits—edits that are programmed into claims processing systems to compare claims data to Medicare requirements—which allow the agency to approve or deny claims or flag them for further review prior to payment. For instance, CMS centralized the development of automated edits and created at least 90 edits to ensure Medicare only pays for covered services that meet its designated requirements, according to agency officials.
CMS implemented its Fraud Prevention System in July 2011 to conduct investigations of potentially fraudulent claims. As of August 2017, CMS had addressed all four of our 2012 recommendations to better determine the benefits and effectiveness of the system. For example, in response to our recommendations, CMS defined actual amounts of claims payments denied and costs avoided, and implemented capabilities that automatically stopped payments of certain improper and non-payable claims. CMS estimated that the system has generated almost $2 billion in savings from June 2011 through September 2016. CMS also recently developed a Vulnerability Collaboration Council that will use our Fraud Risk Framework to identify and mitigate vulnerabilities that can lead to fraud, waste, and abuse.
As a result of these and other efforts, CMS estimated that improper payment rates for the FFS program have generally declined between fiscal years 2010 and 2020 (from 10.5 to 6.3 percent), resulting in estimated financial savings of about $8.6 billion during this period. (see fig. 17.)
Figure 17: Medicare Fee-for-Service Improper Payment Rate, Fiscal Years 2010–2020
CMS also made progress in addressing our recommendations to evaluate and continue its prior authorization programs for high-cost items that tend to be overused.[43] For example, based on our recommendation, CMS extended through 2020 a demonstration for non-emergent ambulance transportation that it had launched between 2014 and 2018. Total savings from this demonstration over the 6-year period were projected to be more than $895 million, based on agency estimates.[44] In addition, in 2018, CMS added 31 items—such as standard power wheelchairs—to its prior authorization list. Financial savings are unknown, but may be in the tens of millions of dollars for 2018 through 2023. Further, prior authorization pilots resulted in dollar savings without affecting beneficiary access to medically necessary care. More recently, CMS implemented additional prior authorization efforts for hospital outpatient services that had increased in volume. For example, in July 2020, CMS began prior authorization of certain cosmetic surgeries and in July 2021, CMS added certain spine surgical procedures.
Beneficiary protections. CMS has shown leadership commitment to protecting beneficiary rights and taken several actions. Medicare beneficiaries have the right to, among other things, have access to doctors, specialists, and hospital services, and to have their personal and health information kept private. CMS has taken actions to protect these rights. For example:
To help protect beneficiaries from identity theft and minimize burden for providers, beneficiaries, and the agency, in 2012 we recommended that CMS remove beneficiaries’ Social Security numbers from their Medicare cards. CMS implemented our recommendation, consistent with the Medicare Access and CHIP Reauthorization Act of 2015, and replaced Social Security numbers with unique, randomly generated Medicare Beneficiary Identifiers, which are now used for all Medicare transactions, including billing and eligibility status.[45]
Misuse of prescription opioids can lead to overdose and death. In response to our recommendations, CMS has taken steps to identify Medicare beneficiaries who are at risk of harm from and receiving high doses of opioids, and providers who may be inappropriately prescribing high amounts of these drugs. CMS’s actions allow the agency to have better data to assess how opioid prescribing patterns are changing over time, and meet agency goals in protecting beneficiaries from the harmful effects of potential opioid misuse.
Congressional Actions Leading to Progress
Congress has provided extensive oversight of the program and enacted several pieces of key legislation over the years that addressed concerns we have raised since the 1990s about Medicare. For example:
Addressing excessive payments for durable medical equipment (DME)—such as wheelchairs and orthotics. Medicare traditionally paid DME suppliers fee schedule amounts based on suppliers’ historical charges to Medicare. Key legislation included (1) the Balanced Budget Act of 1997, which required testing whether a DME competitive bidding program would produce savings; and (2) the Medicare Prescription Drug, Improvement, and Modernization Act of 2003, which required phased implementation of the program.[46] CMS estimates that these actions would generate about $25.7 billion in savings from 2013 through 2022.
Combatting fraud and improper payments. Key legislation included (1) the Health Insurance Portability and Accountability Act of 1996, which (i) established the Health Care Fraud and Abuse Control Program—a national effort to coordinate federal, state, and local law enforcement resources to prevent fraud in public and private sectors; and (ii) established the Medicare Integrity Program and increased funding for program integrity efforts; (2) the Improper Payments Information Act of 2002 (IPIA), and its subsequent amendments, which required agencies to annually assess their programs, estimate and report improper payments, and report corrective actions; and (3) the Improper Payments Elimination and Recovery Act of 2010 (IPERA), which required inspectors general to annually determine and report on whether executive branch agencies complied with specified criteria, such as conducting risk assessments, and publishing and demonstrating improvements toward meeting improper payment reduction targets.[47]
Reducing excessive payments to Medicare Advantage (MA) plans—private plans offered under Medicare. Key legislation that reflected our concerns included (1) the Health Care and Education Reconciliation Act of 2010, which changed the way MA plans are paid, and required minimum increases in the annual adjustment for diagnostic coding differences starting in 2014 and continued adjustments in subsequent years until the agency implements risk adjustment based on diagnostic, cost, and use data from MA plans;[48] (2) the American Taxpayer Relief Act of 2012, which subsequently increased the statutory minimum for the annual adjustment; and (3) the 21st Century Cures Act, which includes several changes to further improve risk adjustment.[49] Based on CBO estimates, these actions generated about $19.3 billion in savings from 2012 through 2021.
Lowering payments for certain hospital-based services. In 2015, we recommended that Congress consider equalizing payment rates that were higher for certain types of services if they were provided in a hospital outpatient department rather than a physician’s office. Key legislation that partially addressed our concern included (1) the Bipartisan Budget Act of 2015, which limited certain providers from billing at higher hospital outpatient payment rates, effective January 1, 2017 (which would save about $9.3 billion from fiscal years 2016 through 2025, according to CBO); and (2) the 21st Century Cures Act of 2016, which excluded new hospital outpatient departments (that existed or were under construction after 2015) from receiving the higher payment rates (which we estimated would save about $4.4 billion from fiscal years 2017 through 2021).[50]
Benefits
CMS’s progress in implementing our recommendations and Congress’s actions have resulted in more accurate and efficient payments, as well as both financial and other benefits to the program and its beneficiaries. Financial benefits to the federal government due to progress in addressing the Medicare Program and Improper Payments high-risk area over the past 16 years (fiscal years 2006 through 2021) totaled more than $66 billion.[51] In addition, there were 209 other benefits to the federal government due to CMS’s efforts and Congress’s actions over the past 16 years.
What Remains to Be Done
Since 1990, we have made more than 770 recommendations to strengthen the Medicare program. As of November 2021, 87 recommendations still needed to be addressed to make further progress in this high-risk area.
Specifically, to better prevent, identify, and recover improper payments in the Medicare program, CMS should fully implement our open recommendations related to Medicare program integrity.[52] Even small reductions in Medicare’s improper payments—which were about $43 billion in fiscal year 2020—could result in program savings of billions of dollars. For example, CMS should
conduct fraud risk assessments through its Vulnerability Collaboration Council and implement an antifraud strategy for Medicare. This would allow CMS to better ensure it is addressing the full portfolio of risks and strategically targeting the most significant fraud; and
seek legislative authority to allow recovery auditors to conduct prepayment claims reviews in addition to postpayment reviews to further prevent improper payments.[53]
CMS should also implement our recommendation to continue improving the accuracy of Medicare Advantage diagnostic coding adjustments by, for example, accounting for additional beneficiary characteristics such as sex and health status.
In addition, CMS needs to take further action to address Medicare’s financial and oversight challenges. For example, as Medicare transitions from a payment system that rewards providers solely based on the volume and complexity of services delivered to a value-based payment system that increasingly ties payments to the quality and efficiency of care provided, it will be important for CMS to use reliable quality and efficiency measures and methodological approaches to assess provider performance and determine payment rates.
NASA has made significant progress over the years since we designated its acquisition management as high risk in 1990 due to NASA’s history of persistent cost growth and schedule delays for the majority of its major projects.
Over the decades, we found that NASA has taken steps to improve the management of its major projects. For example, NASA:
implemented new policies and procedures, such as new requirements for cost and schedule estimating;
developed and updated a corrective action plan with key initiatives as a framework for change; and
enhanced tools, including a management tool to monitor project progress.
Key Practices Leading to Progress
Leadership commitment. Since designating NASA’s acquisition management as high risk, we have made numerous recommendations to reduce acquisition risk, with which NASA leaders have generally agreed and in many cases implemented changes. For example, to help reduce the cost and schedule growth in its portfolio and improve transparency, NASA implemented a new key policy and has enhanced it over time. (See fig.18.) While generating a project’s development cost and schedule estimates, NASA uses a Joint Cost and Schedule Confidence Level (JCL), which assigns a likelihood of a project meeting its cost and schedule estimates.
In March 2012, we reported a lack of uniformity in creating JCLs. In line with opportunities we identified to improve the JCL process, NASA instituted new guidance and policies aimed at providing increased insight into the JCL process. As a result, by 2017, we found that NASA’s major projects developed JCL estimates as required.
However, NASA policy did not require its major projects to update their JCLs, which we noted could affect the quality of risk data available to management. As a result, in 2019, NASA established new requirements, which help ensure that the most expensive projects more frequently update their cost and schedule estimates.
Figure 18: NASA Joint Cost and Schedule Confidence Level Policy Changes
Further, we have previously highlighted concerns about the lack of transparency into the long-term costs of NASA’s human exploration programs. In response to recommendations we made in May and July 2014, NASA recently committed to establishing cost and schedule baselines for additional capabilities of the Space Launch System, the Orion Multi-Purpose Crew Vehicle, and Exploration Ground Systems that will help to improve visibility into long-term costs of human space exploration programs. (See fig. 19.)
Figure 19: Images of Human Space Exploration Capability Upgrades—Space Launch System Block 1B and Mobile Launcher-2
Corrective action plan. To improve the effectiveness of its project management, increase transparency, and mitigate risk, NASA developed, and has updated, its high-risk corrective action plan. NASA also instituted a process for monitoring progress and evaluated the effectiveness of the corrective action plan.
In 2007, NASA developed a corrective action plan that contained seven initiatives, and identified metrics to assess implementation progress, including cost and schedule performance indicators for NASA’s major development projects. After NASA implemented this plan, we found that NASA’s performance metrics generally reflected improved performance.
However, after several of its highest-profile missions experienced cost and schedule growth, NASA developed a new corrective action plan, which the agency finalized in 2018. The plan included nine initiatives to strengthen the agency’s project management efforts and improve transparency of external reporting. NASA updated the plan again in 2020, and reported completing six of nine initiatives from the 2018 plan, while adding four new initiatives. One of the four new initiatives is to create a schedule repository, which would allow for the continuous improvement of schedule management guidance and best practices. NASA’s efforts to update and execute the plan are positive steps and will continue to help NASA improve the effectiveness of its project management. However, assessing the impact of the initiatives will take time.
Monitoring. NASA also made progress to increase its capacity by embracing tools to support better cost and scheduling practices. For example, earned value management (EVM)—a key project management tool that integrates information on a project’s cost, schedule, and technical efforts for management and decision makers to help monitor progress—is part of NASA’s efforts to understand project development needs and to reduce cost and schedule growth. We reported in 2012 that EVM had not been fully and consistently implemented by NASA’s major projects and, as a result, many projects lacked reliable data for monitoring contractor performance. In response, NASA modified its acquisition policy to strengthen requirements for EVM and improve its use.
Additionally, in response to our recommendations to improve the use of EVM, in 2013 NASA conducted an analysis to determine whether NASA centers had the workforce skills to effectively use EVM and as a result, developed an EVM training plan in 2014. More recently, NASA included an EVM initiative in its 2018 corrective action plan and subsequently reported that its four centers with the most EVM projects have achieved sufficient capability and plan to further expand in-house EVM surveillance capabilities. In 2019, NASA senior leadership also began requiring EVM metrics to be reported at an agency-level performance review, which officials said have become a helpful tool for assessing project performance.
Congressional Actions Leading to Progress
Congress has taken action to promote increased transparency in NASA acquisition management. For example, as a result of a matter for congressional consideration we made in 2017, the House Committee on Appropriations included language in a 2019 report directing NASA to establish (1) cost and schedule baselines for the Space Launch System and Exploration Ground Systems, and (2) separate cost and schedule baselines for each additional capability of Space Launch System, Orion, and the Exploration Ground Systems that encompass all life-cycle costs.
In June 2020, NASA rebaselined both Space Launch System and Exploration Ground Systems. Also, in August 2020, the agency committed to establishing separate cost and schedule baselines for the additional capabilities of Space Launch System, Orion, and Exploration Ground Systems.
Benefits
NASA’s implementation of our recommendations and best practices guidance in this high-risk area led to various financial benefits. Financial benefits to the federal government due to progress in addressing the NASA acquisition management high-risk area over the past 16 years (fiscal years 2006 through 2021) totaled nearly $10.3 billion. For example:
In the fiscal year 2011 budget request, NASA canceled the $8 billion Constellation program influenced in part by our prior reports that questioned the program’s affordability and recommended that NASA develop a sound business case before moving forward with the program; and
In response to a February 2005 recommendation, NASA directed the Prometheus project to complete an analysis of alternatives, which led to NASA reducing funding for the program by nearly $2.4 billion.
In addition, there were 62 other benefits, including program and operation improvements, to the federal government due to progress in addressing the NASA acquisition high-risk area over the past 16 years. For example:
In response to two recommendations from December 2019, NASA agreed to develop a solid business case for its mission to return U.S. astronauts to the moon and also agreed to produce a full cost estimate for the mission.
NASA evaluated its Technology Readiness Assessment (TRA) process after we issued a best practices guide. Using our TRA guide, NASA identified gaps in its internal TRA process and potential improvements to it. This action increases the likelihood of NASA producing high-quality, evidence-based TRAs that provide managers and decision makers with the information needed to make technical and resource allocation decisions about whether a technology is sufficiently mature for use.
What Remains to be Done
Continued progress is needed in two of the five criteria for removal from the High-Risk List. Each of these criteria are rated as partially met.
In the coming years, NASA plans to invest billions of dollars in its human spaceflight projects, the majority of which are in early stages of development and face cost, schedule, and technical risks. Although NASA has demonstrated progress in its acquisition management, it continues to face significant challenges in its ability to manage and oversee its most expensive and complex projects, most notably its human spaceflight development programs. Additionally, cost and schedule performance has deteriorated over the past 5 years, largely due to the historical challenges faced by the James Webb Space Telescope and Space Launch System.
To continue reducing acquisition risk and demonstrating progress, NASA should continue to implement our recommendations to improve transparency into the long-term costs and affordability of human spaceflight programs; build the capacity of its workforce to balance an aggressive goal of returning astronauts to the lunar surface no earlier than 2025 with supporting its increasing portfolio of nonlunar projects; and demonstrate sustained improvement in cost and schedule performance for new, large, complex programs entering the portfolio.
Recent laws, including the American Rescue Plan Act of 2021 (ARPA), have mitigated certain financial risks facing the Pension Benefit Guaranty Corporation (PBGC), the federal government corporation responsible for insuring pension benefits for millions of American workers and retirees in private sector pension plans. As a result of provisions in ARPA regarding special financial assistance for certain struggling plans, PBGC’s multiemployer insurance program has, for the first time since 2002, a net positive financial position (about $0.5 billion) for fiscal year 2021. In addition, PBGC projects that the program will likely remain solvent about 30 years later than was projected prior to ARPA’s enactment. Additionally, the financial condition of the single-employer insurance program has improved from deficit to surplus in recent years ($30.9 billion in fiscal year 2021) and is projected to remain in surplus through at least fiscal year 2030. Still, PBGC continues to face the potential for large claims that could put stress on the programs’ long-term financial condition.
We added PBGC to the original High-Risk List in 1990 because weaknesses in the minimum funding rules for pension plan sponsors threatened the long-term ability of PBGC’s single employer insurance program to pay statutory guarantees to beneficiaries of plans in which employers could not fund promised benefits. (See fig. 20.) We added the multiemployer program to the 2009 High-Risk List due to the worsening financial condition of that program. The financial position of both programs has fluctuated between surplus and deficit over the last 30 years (see fig. 21).
Figure 21: Pension Benefit Guaranty Corporation Net Financial Position since Being Placed on High-Risk Series (End of Fiscal Year 1990 through 2021)
Key Practices Leading to Progress
PBGC has limited authority or ability to take actions that would directly mitigate the risks to its pension insurance programs. Rules that determine how sponsors must fund their plans and the premiums these sponsors pay to PBGC are set in statute. PBGC’s financial condition is also subject to market conditions that affect not only plan funding but also the financial health of the companies that sponsor or participate in plans, and thus those companies’ ability to fund promised benefits.
Congressional Actions Leading to Progress
We have consistently noted the need for congressional action to address the challenges facing PBGC. This is because the major actions to mitigate financial risk to PBGC—such as strengthening the funding of pension plans PBGC insures or raising the premiums that plan sponsors pay to PBGC—require statutory changes. Some laws have been enacted that have mitigated certain risks, such as the Pension Protection Act of 2006, which followed two matters for congressional consideration in our 2005 report calling for broad pension funding reform. (See fig. 22.)
Also, the recently enacted ARPA will provide special financial assistance to certain struggling multiemployer plans, which is projected to postpone insolvency of the multiemployer program for many years. However, PBGC’s financial condition has fluctuated over time and still faces fundamental financial risks, such as underfunded plans sponsored by employers who have an elevated risk of bankruptcy; a wide range of projected financial outcomes for the multiemployer program despite the relief provided by ARPA; and premiums that do not completely reflect the risk a plan poses to PBGC’s finances.
Financial benefits to the federal government due to progress in addressing the PBGC high-risk area from fiscal year 2006 through fiscal year 2021 totaled $13.6 billion.
For example, since adding PBGC to the High-Risk List, financial savings have resulted from various statutory changes that raised the single-employer premiums that sponsors pay to PBGC. The variable-rate premium—a premium based on the amount of plan underfunding—as well as the flat-rate, or per participant, premium have both been raised. Our reports have also recommended that Congress better align PBGC’s premium structure with the risks posed to the pension system.
In addition, there were 20 other benefits to the federal government due to progress in addressing the PBGC high-risk area from fiscal year 2006 through fiscal year 2021. These benefits, among others, include improved service delivery, for example by increasing the transparency of plan statements given to participants and providing key appeals information to participants.
What Remains to Be Done
The Special Financial Assistance provided by the American Rescue Plan Act of 2021 is projected by PBGC to extend the date of multiemployer insolvency by at least 10 years (from fiscal year 2026 in prior-year projections to at least fiscal year 2036 in the most adverse of 500 scenarios projected by PBGC as of September 2021). The median projected year of insolvency is fiscal year 2055. While the creation of this program greatly reduces the risk of near-term multiemployer program insolvency, we will continue to monitor and evaluate the overall risk of PBGC’s insurance programs.
In the meantime, Congress could take further actions to improve the long-term stability of both programs. These include redesigning PBGC’s premium structure, strengthening plan funding requirements, and improving PBGC’s governance structure. We have long recommended that PBGC’s board—composed of the Secretaries of Labor, the Treasury, and Commerce—be expanded to broaden its expertise in areas such as strategic risk assessment and management, and to provide more stable leadership. Further, the board’s ability to provide stable leadership is limited by the turnover of cabinet officials with different administrations.
In 1990, we began a program to report on government operations that we identified as “high risk.” Since then, generally coinciding with the start of each new Congress, we have reported on the status of progress addressing high-risk areas and have updated the High-Risk List. Our last high-risk update was in March 2021.[54]
Overall, this program has served to identify and help resolve serious weaknesses in areas that involve substantial resources and provide critical services to the public. Since our program began, the federal government has taken high-risk problems seriously and has made long-needed progress toward correcting them. In a number of cases, progress has been sufficient for us to remove the high-risk designation. A summary of changes to the High-Risk List over the past 32 years is shown in table 1. The 2021 update identified 36 high-risk areas, and we added one high-risk area out of cycle this year in 2022, bringing the total to 37 as of January 2022.[55]
Below is a summary of the 27 high-risk areas that have been removed from the High-Risk List since its inception in 1990. We describe when the high-risk area was added to the High-Risk List, the reasons it was added, the year it was removed, and the actions that led to the area’s removal.
High-Risk Area
Year Added
Year Removed
Department of Defense (DOD) Support Infrastructure Management
1997
2021
Why It Was Added: We designated this area as high risk in 1997 because of challenges DOD faced in reducing excess infrastructure, more efficiently using underutilized facilities, and reducing base support costs.
Why It Was Removed: We removed this area in 2021 because, among other things, DOD had more efficiently used military installation space; reduced its infrastructure footprint and use of leases, reportedly saving millions of dollars; and improved its use of installation agreements, reducing base support costs. For example, under an Office of Management and Budget (OMB) program to restrict the growth of excess or underutilized federal properties, DOD’s facility square footage reductions were 68 percent of total government-wide office and warehouse space reductions and 75 percent of other government-wide property reductions.
High-Risk Area
Year Added
Year Removed
Mitigating Gaps in Weather Satellite Data
2013
2019
Why It Was Added: Given the criticality of satellite data to weather forecasts, the likelihood of significant gaps in weather satellite data, and the potential effect of such gaps on the health and safety of the U.S. population and economy, we designated this area as high risk in 2013.
Why It Was Removed: With strong congressional support and oversight, the National Oceanic and Atmospheric Administration and DOD made significant progress in establishing and implementing plans to mitigate potential gaps in weather satellite data to warrant removal from our High-Risk List in 2019.
High-Risk Area
Year Added
Year Removed
DOD Supply Chain Management
1990
2019
Why It Was Added: We added this area to our High-Risk List in 1990, starting with inventory management, because of inefficient and ineffective management practices leading to excess inventory (this segment was removed in 2017 due to key improvements). In 2005, we added asset visibility and materiel distribution due to weaknesses identified during operations in Iraq and Afghanistan, including backlogs of hundreds of pallets and containers at distribution points.
Why It Was Removed: We removed this area in 2019 due to significant progress made by DOD in managing its inventory, maintaining visibility of supplies, and delivering supplies and equipment.
High-Risk Area
Year Added
Year Removed
Establishing Effective Mechanisms for Sharing and Managing Terrorism-Related Information to Protect the Homeland
2005
2017
Why It Was Added: We designated this area as high risk in 2005 because, after the 9/11 terrorist acts, the government faced serious challenges in analyzing key terrorism-related information and disseminating it among federal, state, local, and private partners in a timely, accurate, and useful way.
Why It Was Removed: We removed this area in 2017 due to efforts by Congress and top government leaders to strengthen the sharing of terrorism, homeland security, law enforcement, and other information (which we collectively refer to as terrorism-related information).
High-Risk Area
Year Added
Year Removed
Management of Interagency Contracting
2005
2013
Why It Was Added: We designated this area as high-risk in 2005 due in part to the need for stronger internal controls, clearer definitions of roles and responsibilities, and training to ensure proper use of this contracting method.
Why It Was Removed: We removed this area in 2013 as a result of congressional oversight and leadership from OMB’s Office of Federal Procurement Policy and agency progress in addressing previously identified deficiencies, establishment of additional management controls, creation of a policy framework for establishing new interagency contracts, and steps taken to address the need for better data on these contracts.
High-Risk Area
Year Added
Year Removed
IRS Business Systems Modernization (BSM)
1995
2013
Why It Was Added: In 1995, we identified serious management and technical weaknesses in the multi-billion dollar IRS tax returns processing modernization program that jeopardized its successful completion. We also added the agency’s financial management to our High-Risk List due to long-standing and pervasive problems, which hampered the effective collection of revenues and precluded the preparation of auditable financial statements. We combined the two issues into one high-risk area in 2005 since resolution of the most serious financial management problems depended largely on the success of the BSM program.
Why It Was Removed: We removed this area in 2013 because IRS made progress in addressing significant weaknesses in IT and financial management capabilities. IRS began the daily processing and posting of individual taxpayer accounts in January 2012, which enhanced tax administration and improved service by enabling faster refunds for more taxpayers, allowing more timely account updates and faster issuance of taxpayer notices. In addition, IRS put in place close to 80 percent of the practices needed for an effective investment management process, including all of the processes needed for effective project oversight.
High-Risk Area
Year Added
Year Removed
The 2010 Census
2008
2011
Why It Was Added: We added this area to our High-Risk List in 2008 because we noted that, with little time remaining until Census Day, April 1, 2010, (1) long-standing weaknesses in the Census Bureau's IT acquisition and contract management function, (2) problems with the performance of handheld computers use to collect data, and (3) uncertainty over the ultimate cost of the census, jeopardized a cost-effective enumeration.
Why It Was Removed: We removed this area in 2011 because the Bureau generally completed its peak census data collection activities consistent with its operational plans; released the state population counts used to apportion Congress on December 21, 2010, several days ahead of the legally mandated end-of-year deadline; and showed that remaining activities appeared to be on track.
High-Risk Area
Year Added
Year Removed
DOD Personnel Security Clearance Program
2005
2011
Why It Was Added: We designated this area as high risk in 2005 because of delays in completing hundreds of thousands of background investigations and adjudications (a review of investigative information to determine eligibility for a security clearance).
Why It Was Removed: We removed this area in 2011 because of DOD’s improvements in the timeliness of investigations and adjudications and the development of tools and metrics to assess quality.[56]
High-Risk Area
Year Added
Year Removed
Federal Aviation Administration (FAA) Air Traffic Control Modernization
1995
2009
Why It Was Added: We designated this area as high risk in 1995 because of the program’s estimated $36 billion cost, its complexity, its criticality to FAA’s mission of ensuring safe and efficient air travel, and its problem-plagued past. In our 1997 high-risk update, we again included the modernization, not only for the reasons cited in 1995, but also because our subsequent work found pervasive and fundamental problems in FAA’s approach to managing the modernization.
Why It Was Removed: We removed this area in 2009 because of the agency’s progress in addressing most of the root causes of its past problems and its commitment to sustaining progress in the future. FAA (1) improved management capabilities on major projects and worked to extend these improvements to new projects; (2) continued to develop and refine its enterprise architecture; (3) implemented a cost estimating methodology and a cost accounting system; (4) implemented a comprehensive investment management process; and (5) assessed its human capital challenges and identified plans to address critical staff shortages. FAA also put multiple new systems into operation throughout the country, including new air traffic displays, runway safety systems, and weather processing systems.
High-Risk Area
Year Added
Year Removed
U.S. Postal Service Transformation Efforts and Long-Term Outlook
2001
2007
Why It Was Added: In 2001, we designated the U.S. Postal Service’s (Service) transformation efforts and long-term outlook as high risk because the Service’s financial outlook had deteriorated significantly. The Service had a projected deficit of $2 billion to $3 billion, severe cash flow pressures, debt approaching the statutory borrowing limit; cost growth outpacing revenue increases; and limited productivity gains. We were also concerned that the Service had no comprehensive plan to address its financial, operational, or human capital challenges.
Why It Was Removed: We removed this area in 2007 because the Postal Service’s management had demonstrated a commitment to implementing a Transformation Plan and addressed many of the financial and human capital challenges it faced. At the end of fiscal year 2005, the Service had paid off its debt. In addition, as of the end of fiscal year 2006, it had achieved 7 consecutive years of productivity gains, positive net income for fiscal years 2003 through 2006, and more than $5 billion in cost savings since 2001. Significant progress was also made when Congress passed and the President signed comprehensive postal reform legislation in December 2006, which gave the Service additional pricing flexibility and allowed it to retain earnings among other things.[57]
High-Risk Area
Year Added
Year Removed
Housing and Urban Development (HUD) Single-Family Mortgage Insurance and Rental Housing Assistance Programs
1994
2007
Why It Was Added: In 1994, we designated HUD as high risk because of fundamental management and organizational problems that put billions of dollars in insured mortgages and housing and community development assistance at risk. In 2001, we narrowed the high-risk designation to HUD’s single-family mortgage insurance and rental housing assistance programs because progress was made overall, but significant and persistent problems in these two program areas remained.
Why It Was Removed: We removed this area in 2007 because HUD continued to demonstrate a commitment to and capacity for resolving risks, developed corrective action plans, instituted programs to monitor and evaluate the effectiveness of corrective measures, and demonstrated progress in implementing corrective measures. For example, HUD continued to take actions to address long-standing problems in its single-family mortgage insurance program and addressed more recently identified problems. In addition, HUD made progress on human capital, acquisition management, and IT issues that in previous years we cited as major management challenges contributing to HUD’s high-risk designation.
High-Risk Area
Year Added
Year Removed
FAA Financial Management
1999
2005
Why It Was Added: We designated FAA financial management as high risk in 1999 because the agency lacked accountability for billions of dollars in assets and expenditures due to serious weaknesses in its financial reporting, property, and cost accounting systems. These problems continued through fiscal year 2001, when FAA’s financial management system required 850 adjustments totaling $41 billion to prepare FAA’s annual financial statements. In addition, at that time, FAA could not accurately and routinely account for property totaling a reported $11.7 billion, and lacked the cost information necessary for decision-making as well as to adequately account for its activities and major projects, such as the air traffic control modernization program.
Why It Was Removed: We removed this area in 2005 because, in fiscal year 2004, FAA implemented its new Delphi general ledger system, including an integrated property accounting system. FAA also prepared financial statements for fiscal year 2004 using these new systems, and FAA’s auditors gave FAA an unqualified opinion on these financial statements.
High-Risk Area
Year Added
Year Removed
Forest Service Financial Management
1999
2005
Why It Was Added: We added this area to our High-Risk List in 1999 because the U.S. Department of Agriculture (USDA) lacked accountability over billions of dollars in its two major assets—fund balance with the Department of the Treasury and property, plant, and equipment. Since the Forest Service is a major component of USDA, the lack of accountability over these two major assets contributed to disclaimers of opinions on USDA’s consolidated financial statements. In addition, the Forest Service continued to have material weaknesses in its accounting and reporting of accounts receivable and accounts payable.
Why It Was Removed: The Forest Service resolved material deficiencies related to its fund balance with Treasury and in property, plant, and equipment, thus increasing accountability over its billions of dollars in assets, and USDA and the Forest Service received unqualified opinions on their fiscal year 2004 financial statements. These actions enabled us to remove this area from our High-Risk List in 2005.
High-Risk Area
Year Added
Year Removed
Student Financial Aid Programs
1990
2005
Why It Was Added: In 1990, we designated student financial aid programs as high risk. We reported various problems, including poor financial management and weak internal controls, fragmented and inefficient information systems, and inadequate attention to program integrity as evidenced by high default rates and the numbers of ineligible students participating in the programs.
Why It Was Removed: We removed this area in 2005 as the Department of Education sustained improvements in the financial management of student financial aid programs and took additional steps to address our concerns about systems integration, reporting on defaulted loans, and human capital management. Furthermore, Education demonstrated a strong commitment to addressing risks; developed and implemented corrective action plans; and, through its annual planning and reporting processes, monitored the effectiveness and sustainability of its corrective measures.
High-Risk Area
Year Added
Year Removed
Supplemental Security Income (SSI)
1997
2003
Why It Was Added: We designated this area high risk in 1997 after several years of reporting on specific instances of abuse and mismanagement, increasing overpayments, and poor recovery of outstanding SSI overpayments.
Why It Was Removed: We removed this area in 2003 due to Social Security Administration (SSA) actions including (1) developing a major SSI legislative proposal with numerous overpayment deterrence and recovery provisions; (2) obtaining separate legislative authority to recover overpayments from former SSI recipients who, at that time, received Social Security benefits; (3) increasing the number of SSI financial redeterminations that it conducted and the level of resources and staff in the Office of Inspector General devoted to investigating SSI fraud and abuse; and (4) revising its field office work credit and measurement system to better reward staff for time spent developing fraud referrals. In fiscal year 2002, SSA increased its collection of overpayments by $150 million over the prior fiscal year.
High-Risk Area
Year Added
Year Removed
Asset Forfeiture Programs
1990
2003
Why It Was Added: We designated asset forfeiture programs operated by the Departments of Justice and the Treasury as high risk in 1990 because of shortcomings in the management of and accountability for seized and forfeited property and the potential for cost reduction through administrative improvements and consolidation of the programs’ postseizure management and disposition of noncash seized property.
Why It Was Removed: We removed this area in 2003 because of actions taken by Treasury’s Customs Service and Justice’s Marshals Service to address our recommendations that improved the management of and accountability for seized and forfeited property. We also reported that Justice’s Drug Enforcement Administration and FBI had taken many actions to address our recommendations to improve physical safeguards over drugs and firearms evidence and strengthen accountability for such evidence. In addition, the Treasury Forfeiture Fund and Justice's Asset Forfeiture Fund and Seized Asset Deposit Fund strengthened their financial management and accountability over seized and forfeited property.
High-Risk Area
Year Added
Year Removed
The Year 2000 (Y2K) Computing Challenge
1997
2001
Why It Was Added: We added this area to our High-Risk List in 1997 to draw greater attention to assessing the government’s exposure to Y2K risks and to strengthen planning for achieving Y2K compliance for mission-critical systems. This was necessary because the public faced a high risk that critical services provided by the government and the private sector could be severely disrupted by the Y2K problem.
Why It Was Removed: Due to efforts by Congress, OMB, and two dozen major federal agencies, the U.S. avoided major national failures during the century-change rollover period, enabling us to remove this area from our High-Risk List in 2001.
High-Risk Area
Year Added
Year Removed
The 2000 Census
1997
2001
Why It Was Added: We added this area to our High-Risk List in 1997 due to challenges the Bureau faced in building a complete and accurate master address file, motivating the public to participate in the census by returning their census questionnaires, meeting field staffing goals in a tight labor market, and collecting timely and accurate data from nonrespondents.
Why It Was Removed: With respect to the 2000 Census, the Bureau generally completed its peak data collection activities consistent with its operational plans, and remaining activities appeared to be on track. As a result, we no longer considered the operation of the 2000 Census to be high risk and removed it from our High-Risk List in 2001.
High-Risk Area
Year Added
Year Removed
National Weather Service (NWS) Modernization
1995
2001
Why It Was Added: We added NWS’ Modernization to our High-Risk List in 1995 because of several issues, including NWS’ lack of a systems architecture to guide the modernization effort and problems in developing its Advance Weather Interactive Processing System (AWIPS)—the centerpiece of the modernization.
Why It Was Removed: We removed this area in 2001 because the agency established an architecture and used it to guide its systems’ future evolution; improved its radar availability; strengthened its software development and testing processes; and completed an independent cost estimate of AWIPS. Further, NWS overcame major obstacles in developing AWIPS such as operating in field offices across the country and deploying radar and infrastructure enhancements in phased releases.
High-Risk Area
Year Added
Year Removed
Farm Loan Programs
1990
2001
Why It Was Added: We added Farm Loan Programs to our High-Risk List in 1990 because of significant problems, primarily with direct loans. The farm loan programs had experienced a high rate of defaults on repayments, billions of dollars of losses had occurred and were likely to occur, and USDA had evolved into a continuous source of subsidized credit for thousands of borrowers.
Why It Was Removed: We removed this area in 2001 because Congress and USDA acted on our matters and recommendations to address the underlying causes of past program weaknesses. For example, the 1996 farm bill contained numerous provisions aimed at improving the solvency of USDA’s farm loan programs, including prohibiting certain high-risk loans.[58]
High-Risk Area
Year Added
Year Removed
Superfund Program
1990
2001
Why It Was Added: We designated this area as high risk in 1990 because we found that (1) the Environmental Protection Agency (EPA), USDA, and the Departments of Defense, Energy, and the Interior were not giving priority for limited cleanup funds to those sites that posed the relatively highest risk to human health and the environment; (2) EPA was not recovering billions of dollars in indirect costs it had spent in cleanup costs from the parties responsible for contaminating the sites; and (3) EPA was not effectively controlling the costs of the contractors it used to conduct cleanups.
Why It Was Removed: We removed this area in 2001 because these agencies, in response to our concerns and recommendations, made improvements including setting funding priorities based on a consideration of the health and environmental risks posed by sites, implementing a new process to help EPA recover more cleanup costs from responsible parties, and taking steps to better control contractor costs.
High-Risk Area
Year Added
Year Removed
Customs Service Financial Management
1991
1999
Why It Was Added: We designated this area as high risk in 1991 due to major weaknesses in Customs Service’s management and organizational structure that diminished the agency’s ability to detect trade violations on imported cargo; collect applicable duties, taxes, fees, and penalties; control financial resources; and report on financial operations.
Why It Was Removed: We removed this area in 1999 because the Customs Service had made major financial management strides, including several important improvements in its ability to assess and collect duties and excise taxes and receiving unqualified opinions on its financial statements for the prior 2 fiscal years.
High-Risk Area
Year Added
Year Removed
Bank Insurance Fund
1991
1995
Why It Was Added: We put the Bank Insurance Fund (Fund) on our High-Risk List in 1991 because unprecedented numbers of bank failures and insurance losses in the late 1980s and early 1990s had depleted the Fund’s reserves. These failures resulted from the banking industry’s shift to increasingly risky lending activities in response to a shrinking customer base and increased competition. Banks’ lending risks were exacerbated by weak internal controls, flawed corporate governance systems, and lax regulatory supervision. By year-end 1991, the Fund was in a deficit position.
Why It Was Removed: We removed this area in 1995 because, in response to our recommendations, Congress passed and the President signed several pieces of legislation that aided progress. Section 2002 of the Omnibus Reconciliation Act of 1990 removed caps on premium increases and gave the Federal Deposit Insurance Corporation (FDIC) increased flexibility to set premium rates.[59] The Federal Deposit Information Corporation Improvement Act of 1991 provided for rebuilding the depleted deposit insurance fund and required significant corporate governance, regulatory, and accounting reforms.[60] The rapid rebuilding of the Fund’s reserves, which stood at $17.5 billion at June 30, 1994, had substantially reduced the Fund’s risks.
High-Risk Area
Year Added
Year Removed
Federal Transportation Administration (FTA) Grant Management
1990
1995
Why It Was Added: We added this area to our High-Risk List in 1990 because FTA focused more on awarding grants than on ensuring their proper use. Oversight was superficial and inconsistent, and FTA seldom used its enforcement powers to compel grant recipients to fix problems, even long-standing ones.
Why It Was Removed: We removed this area in 1995 because FTA made substantial improvements in its process to oversee its $4.6 billion grants program, including organizational changes, increased oversight staff levels, and better training. FTA made a concerted effort to change the attitudes of its oversight staff and grantees toward safeguarding federal funds. FTA went from relying primarily on grantee certifications of compliance to implementing various initiatives and systems that instilled a more proactive approach to its grants management, oversight, and enforcement responsibilities. FTA also began withholding funds to sanction grantees who mismanaged their programs.
High-Risk Area
Year Added
Year Removed
Pension Benefit Guaranty Corporation (PBGC)
1990
1995
Why It Was Added: We added this area to our High-Risk List in 1990 because weaknesses in the minimum funding rules for pension plan sponsors threatened the long-term ability of PBGC’s single- employer insurance program to pay statutory guarantees to beneficiaries of plans in which employers could not fund promised benefits.
Why It Was Removed: We removed this area in 1995 because PBGC improved its internal controls and 1994 legislation strengthened pension plan funding rules.[61]
High-Risk Area
Year Added
Year Removed
Resolution Trust Corporation (RTC)
1990
1995
Why It Was Added: Although original estimates indicated that RTC would need $50 billion to close known failed thrifts, cost estimates escalated rapidly. By May 1990, the number of known failed thrifts had increased and RTC’s most conservative cost estimates had grown to nearly $90 billion. In addition, RTC faced significant risks associated with contracting out the management and disposition of failed thrift assets worth hundreds of billions of dollars. As a result, RTC was added to our High-Risk List in 1990.
Why It Was Removed: Congress passed and the President signed several laws that provided RTC with additional funding, mandated that RTC implement specific management reforms, and required the establishment of an interagency transition task force with specific responsibilities to facilitate the transfer of RTC’s workload, personnel, and operations to FDIC by January 1996. RTC also made numerous improvements in its estimating processes, internal controls, and financial management systems to provide more reliable, auditable cost data. As a result, we were able to attest to the accuracy of RTC’s balance sheet beginning in 1991 and its financial statements since that time. RTC had also fully implemented most of the congressionally mandated reforms and no longer posed the risk it once did. Therefore, we removed it from our High-Risk List in 1995.
High-Risk Area
Year Added
Year Removed
State Department’s Management of Overseas Real Property
1990
1995
Why It Was Added: We designated this area as high risk in 1990 because of insufficient maintenance of facilities, lax oversight of overseas post operations, inadequate information systems, and poor planning. These problems had resulted in deteriorated facilities, increased costs, and questionable managerial decision-making.
Why It Was Removed: We removed this area in 1995 because State's subsequent actions included establishing priorities for construction projects based on specific criteria, better evaluating contractors’ performance, hiring additional qualified staff, surveying the maintenance conditions of posts, streamlining and updating housing standards, and improving information systems.
Allison Azevedo Deputy Commissioner Public Buildings Service General Services Administration
Paul Bosco Director Office of Project Management Department of Energy (DOE)
Brian Doss Management Analyst, Audit and Information Management Office of the Chief Administrative Officer National Oceanic and Atmospheric Administration (NOAA)
Clay Johnson, III Former Deputy Director of Management, 2003 to 2009 Office of Management and Budget (OMB)
Ingrid Kolb Director DOE’s Office of Management DOE
John Koskinen Former Assistant to the President and Chair of the President’s Council on the Year 2000 Conversion President’s Council on the Year 2000 Conversion
Greg Mandt Former Program Director Joint Polar Satellite System, 2017 to 2022 Geostationary Satellite program, 2007-2016 NOAA
Ajay Mehta Director Office of Satellite Ground Services, 2021 to present NOAA
Jan Mulligan Director of Supply Office of the Deputy Assistant Secretary of Defense for Logistics, 2012 to present U.S. Department of Defense
Kshemendra Paul Former Program Manager Information Sharing Environment, 2010 to 2017 Office of the Director of National Intelligence
Bob Raines Associate Administrator Office of Acquisition and Project Management National Nuclear Security Administration
Robert Shea Former Associate Director, 2002 to 2008 OMB
Joel Willemssen Former Managing Director Information Technology Team, 2000 to 2017 U.S. GAO
Appendix IV: Additional Sourcing Information for Icons and Images
This appendix contains credit, copyright, and other source information for images, tables, or figures in this product when that information was not listed adjacent to the image, table or figure.
Key Practices Icons
GAO is the source for the icons used in the Key Practices Facilitate Agencies' Progress on High-Risk Areas.
GAO is the source for the icons used in the Case Illustrations
Case Illustration Photo Headers
DOD Supply Chain Management, Source: j.mel/stock.adobe.com.
Mitigating Gaps in Weather Satellite Data, Source: Andrey Armyagov/stock.adobe.com.
Establishing Effective Mechanisms for Sharing and Managing Terrorism-Related Information to Protect the Homeland, Source: Flashmovie/stock.adobe.com.
Management of Interagency Contracting, Source: Maksym Dykha/stock.adobe.com.
The Year 2000 (Y2K) Computing Challenge, Source: Profit image/stock.adobe.com.
Managing Federal Real Property, Source: Department of Transportation.
DOD Weapon Systems Acquisition, Source: U.S. Air Force/Senior Airman Alexander Cook/Defense Visual Information Distribution Service.
DOE's Contract and Project Management for the National Nuclear Security Administration and Office of Environmental Management, Source: National Nuclear Security Administration.
Enforcement of Tax Laws, Source: Gary L./stock.adobe.com.
Medicare Program & Improper Payments, Source: Valeri Luzina/stock.adobe.com.
NASA Acquisition Management, Source: NASA.
Pension Benefit Guaranty Corporation Insurance Programs, Source: Brian Jackson/stock.adobe.com.
[1]GAO, High-Risk Series: Dedicated Leadership Needed to Address Limited Progress in Most High-Risk Areas, GAO-21-119SP (Washington, D.C. Mar. 2, 2021); High-Risk Series: Key Actions to Make Progress Addressing High-Risk Issues, GAO-16-480R (Washington, D.C.: Apr. 25, 2016); Organizational Transformation: Implementing Chief Operating Officer/Chief Management Officer Positions in Federal Agencies, GAO-08-34 (Washington, D.C.: Nov.1, 2007); Comptroller General’s Forum: High-Performing Organizations: Metrics, Means, and Mechanisms for Achieving High Performance in the 21st Century Public Management Environment, GAO-04-343SP (Washington, D.C.: Feb. 13, 2004); Insights for U.S. Agencies from Other Countries’ Succession Planning and Management Initiatives, GAO-03-914, (Washington, D.C.: Sept. 15, 2003); and Results-Oriented Cultures: Implementation Steps to Assist Mergers and Organizational Transformations, GAO-03-669 (Washington, D.C.: Jul. 2, 2003).
[2]Pub. L. No. 108-458, § 1016(b), 118 Stat. 3638, 3665-3666 (2004), codified, as amended, at 6 U.S.C. § 485. See also 6 U.S.C. § 482 (requiring the establishment of procedures for the sharing of homeland security information). We use the term “terrorism-related information” to refer to terrorism, homeland security, and law enforcement information, as well as other information shared within the scope of ISE.
[3]Pub. L. No. 114-287, 130 Stat. 1463 (2016). The act excludes properties on military installations among other specified types of properties.
[4]Pub. L. No. 114-318, § 3(a), 130 Stat. 1608, 1609-1611 (2016), codified at 40 U.S.C. § 623. The Federal Real Property Council develops guidance on and ensures the implementation of an efficient and effective real property management strategy and also identifies opportunities for the federal government to better manage its property and assets.
[6]GAO, Information Technology and Cybersecurity: Significant Attention Is Needed to Address High-Risk Areas, GAO-21-422T (Washington, D.C.: Apr. 16, 2021), Human Capital: Improving Federal Recruiting and Hiring Efforts, GAO-19-696T (Washington, D.C.: July 30, 2019 ); Cybersecurity Workforce: Agencies Need to Accurately Catgorize Positions to Effectively Identify Critical Staffing Needs, GAO-19-144 (Washington, D.C.: Mar. 12, 2019); Defense Health Care: Additional Assessments Needed to Better Ensure an Efficient Total Workforce,GAO-19-102 (Washington, D.C.: Nov. 27, 2018); GAO-16-480R;Human Capital: Key Principles for Effective Strategic Workforce Planning,GAO-04-39 (Washington, D.C.: Dec. 11, 2003); and A Model of Strategic Human Capital Management, GAO-02-373SP (Washington, D.C.: Mar.15, 2002).
[7]Financial Institutions Reform, Recovery, and Enforcement Act of 1989, Pub. L. No. 101-73, § 501(a), 103 Stat. 183, 369–376 (1989).
[8]See GAO-21-119SP; MANAGING FOR RESULTS: Agencies Need to Fully Identify and Report Major Management Challenges and Actions to Resolve them in their Agency Performance Plans, GAO-16-510, (Washington, D.C.: June 15, 2016). GAO-16-480R; and Determining Performance and Accountability Challenges and High Risks. GAO-01-159SP, (Washington, D.C.: Nov. 1, 2000).
[9]National Defense Authorization Act for Fiscal Year 2008, Pub. L. No. 110-181, § 801, 122 Stat. 3, 202–206 (2008); Duncan Hunter National Defense Authorization Act for Fiscal Year 2009, Pub. L. No. 110-417, §§ 863, 865, 122 Stat. 4356, 4547–4548, 4550–4551 (2008).
[11]GAO, Data-Driven Performance Reviews Show Promise But Agencies Should Explore How to Involve Other Relevant Agencies, GAO-13-228 (Washington, D.C.: Feb. 13, 2013).
[12]Evidence-building activities involve assessing existing evidence and identifying any need for additional evidence; determining which new evidence to generate, when, and how (i.e., prioritizing new evidence); generating that evidence; and using evidence in decision-making. GAO, Evidence-Based Policymaking: Selected Agencies Coordinate Activities, but Could Enhance Collaboration, GAO-20-119 (Washington, D.C.: Dec. 14, 2019).
[13]Pub. L. No. 111-84, § 328, 123 Stat. 2255–2256 (2009); Pub. L. No. 113-66, § 326, 127 Stat.672, 735–736 (2013).
[16]See Disaster Relief Appropriations Act, 2013, Pub. L. No. 113-2, div. A, 127 Stat. 4, 19 (2013) (supplemental appropriations enacted to provide assistance for relief of Hurricane Sandy).
[17]See Disaster Relief Appropriations Act, 2013, Pub. L. No. 113-2, div. A, 127 Stat. 4, 19 (2013) (supplemental appropriations enacted to provide assistance for relief of Hurricane Sandy).
[18]Carl Levin and Howard P. “Buck” McKeon National Defense Authorization Act for Fiscal Year 2015, Pub. L. No. 113-291, § 1612, 128 Stat. 3292, 3628 (2014).
[19]National Defense Authorization Act for Fiscal Year 2016, Pub. L. No. 114-92, § 1615, 129 Stat. 726, 1105 (2015).
[20]See Pub. L. No. 108-458, tit. I, subtit. A, § 1016(b), 118 Stat. 3638, 3665-3666 (2004) (codified, as amended, at 6 U.S.C. § 485). We use the term “terrorism-related information” to refer to terrorism, homeland security, and law enforcement information, as well as other information that might be shared within the scope of the ISE. The Homeland Security Information Sharing Act required the establishment of procedures for the sharing of homeland security information, one of the types of information within the scope of the ISE. See Pub. L. 107‑296, tit. VIII, subtit. I, § 892, 116 Stat. 2135, 2252, 2253-2255 (2002) (codified, as amended, at 6 U.S.C. § 482).
[21]Beginning on December 20, 2019, the Director of National Intelligence has the authority to designate the Program Manager of the ISE. See 6 U.S.C. § 485(f)(1).
[22]GAO, Information Technology: Management Improvements Needed on the Department of Homeland Security's (DHS) Next Generation Information Sharing System, GAO-09-40 (Washington, D.C.: Oct. 8, 2008).
[23]GAO, Information Sharing: Agencies Could Better Coordinate to Reduce Overlap in Field-Based Activities, GAO-13-471 (Washington, D.C.: Apr. 4, 2013).
[24]OMB, Office of Federal Procurement Policy, Improving the Management and Use of Interagency Acquisitions (Washington, D.C.: June 6, 2008).
[25]OMB, Report on the Use of Interagency Contracting (Washington, D.C.: Aug. 26, 2010). National Defense Authorization Act for Fiscal Year 2009, Pub. L. No. 110-417, § 865(a) (2008).
[26]GAO, Year 2000 Computing Crisis: Potential for Widespread Disruption Calls for Strong Leadership and PartnershipsGAO/AIMD-98-85 (Washington, D.C., April 30, 1998).
[27]GAO, Year 2000 Computing Crisis: Business Continuity and Contingency Planning, GAO/AIMD-10.1.19 (Washington, D.C.: August 1998).
[28]These benefits are defined as those that cannot be measured in dollars, but led to program and operational improvements across the government.
[30]Office of Management and Budget, Memorandum for the Heads of Selected Agencies: Business Continuity and Contingency Planning for the Year 2000, OMB Memorandum M-99-16 (Washington, D.C.: May 13, 1999).
[31]GAO, High-Risk Series:Dedicated Leadership Needed to Address Limited Progress in Most High-Risk Areas,GAO-21-119SP (Washington, D.C.: Mar. 2, 2021); and High-Risk Series: An Update,GAO-11-278 (Washington, D.C.: February. 2011).
[32] GAO, High-Risk Series: Federal Real Property,GAO-03-122 (Washington, D.C.: January 2003).
[33]Pub. L. No. 114-287, 130 Stat. 1463 (Dec. 16, 2016). The act excludes properties on military installations among other types of properties.
[34]Pub. L. No. 114-318, 130 Stat. 1608 (Dec. 16, 2016).
[35]We calculated financial benefits over a period of 5 fiscal years (2011 to 2015 and 2013 to 2017), per our policy manual.
[36]In subsequent legislation, Congress amended some of the statutes that WSARA added or modified.
[37]Consolidated Appropriations Act, 2016, Pub. L. No. 114-113, div. Q, Protecting Americans from Tax Hikes Act of 2015, § 201(a), 129 Stat. 2242, 3076 (2015), codified at 26 U.S.C. § 6071(c).
[38]Pub. L. No. 111-92, § 17, 123 Stat. 2984, 2996 (2009), codified at 26 U.S.C. § 6011(e)(3).
[39]Pub. L. No. 116-25, § 2301, 133 Stat. 981, 1012–1013 (2019) codified at 26 U.S.C. § 6011(e)(2), (5).
[40]Pub. L. No. 110-289, § 3091, 122 Stat. 2654, 2908–2911 (2008), codified at 26 U.S.C. § 6050W.
[41]Pub. L. No. 114-74, § 1101, 129 Stat. 584, 625–638 (2015), codified at 26 U.S.C. §§ 6221–6223, 6225–6227, 6230–6235, 6241.
[42]Pub. L. No. 116-136, § 2201, 134 Stat. 281, 335–340 (2020). Subsequent rounds of EIP were mandated by the Consolidated Appropriations Act, 2021, and the American Rescue Plan Act of 2021. Pub. L. No. 116-260, § 272, 134 Stat. 1182, 1965–1976 (2020); Pub. L. No. 117-2, § 9601, 135 Stat. 4, 138–144 (2021).
[43]Prior authorization is a payment approach that generally requires health care providers and suppliers to first demonstrate compliance with coverage and payment rules before (rather than after) certain items or services are provided to patients.
[44]CMS’s demonstration uses prior authorization to reduce ambulance transports that do not meet the Medicare criteria. The demonstration included eight states and the District of Columbia. In September 2020, CMS announced that it would expand the demonstration nationwide.
[47]Pub. L. No. 104-191, §§ 201-202 110 Stat. 1936, 1992 (1996); Pub. L. No. 107-300, § 2, 116 Stat. 2350, 2350 (2002); Pub. L. No. 111-204, § 3, 124 Stat. 2224, 2232 (2010). In 2020, IPIA and IPERA were repealed, and substantially similar provisions were instead enacted as a new subchapter of Title 31 of the U.S. Code. Payment Integrity Information Act of 2019, Pub. L. No. 116-117, 134 Stat. 113 (2020), codified at 31 U.S.C. §§ 3351-3358.
[48]Pub. L. No. 111-152, § 1102, 124 Stat 1029, 1040 (2010). CMS pays MA plans a predetermined amount per beneficiary adjusted for health status. To make this adjustment, CMS calculates a risk score, a relative measure of expected health care expenditures for each beneficiary. Risk scores should be the same among all beneficiaries with the same health conditions and demographic characteristics. However, differences in diagnostic coding between MA plans and Medicare fee for service have led to inappropriately high MA risk scores and payments to MA plans.
[51]These estimates reflect net benefits—that is, estimates that have been reduced by the estimated costs of taking the action that we recommended—and are limited to a 5-year period in which we may claim benefits based on a single agency or congressional action. Thus, our estimates reported here may be lower than those reported by CMS and the Congressional Budget Office which may span a longer period.
[52]Improper payment rates do not yet take into account the potential for improper payments that may result from inappropriate use of flexibilities given to providers and patients during the COVID19 public health emergency. These flexibilities included such things as the use of program waivers for certain telehealth and provider enrollment requirements, such as certain background checks.
[53]Recovery auditors are CMS contractors who review claims at high risk for improper payments and pose the greatest financial risk to Medicare. These auditors generally conduct postpayment reviews, but from 2012 through 2014, conducted prepayment reviews for certain services through a CMS demonstration.
[54]GAO, High-Risk Series: Dedicated Leadership Needed to Address Limited Progress in Most High-Risk Areas, GAO-21-119SP (Washington, D.C.: Mar. 2, 2021).
[55]On January 27, 2021, we added Department of Health and Human Services' leadership of public health emergencies to our High-Risk List. See GAO, COVID-19: Significant Improvements Are Needed for Overseeing Relief Funds and Leading Responses to Public Health Emergencies, GAO-22-105291 (Washington, D.C.: Jan. 27, 2022).
[56]We added back a revised version of this high-risk area, Government-wide Personnel Security Clearance Process, on our High-Risk List in January 2018 because it faced significant challenges related to (1) the timely processing of clearances, (2) measuring investigation quality, and (3) ensuring IT security, among other things. The area is currently on our High-Risk List.
[57]Postal Accountability and Enhancement Act, Pub. L. No. 109-435, 120 Stat. 3198 (2006). We added back a revised version of this high-risk area, USPS Financial Viability, on our High-Risk List in 2009 due to the need for action to address USPS’s poor financial condition. USPS cannot fund its current level of services and financial obligations from its revenues, and this area is currently on our High-Risk List.
[58]Federal Agriculture Improvement and Reform Act of 1996, Pub. L. No. 104-127, 110 Stat. 888 (1996).
[61]Retirement Protection Act of 1994, Pub. L. No. 103-465, title VII, §§ 750–781, 108 Stat. 4809, 5012–5050 (1994). We identified the Pension Benefit Guaranty Corporation’s (PBGC) single-employer insurance program as a high-risk area again in 2003 because termination of large underfunded pension plans created a $3.6 billion accumulated deficit for fiscal year 2002. In 2009, we added the multiemployer program to this high-risk area due to the worsening financial condition of the program and the need for Congress to take action to reform the structure of the program. The PBGC Insurance Programs high-risk area is currently on our list.
Contact information has been updated as appropriate
Congressional Relations
A. Nicole Clowers, Managing Director, clowersa@gao.gov, (202) 512-4400 U.S. Government Accountability Office 441 G Street NW, Room 7125, Washington, DC 20548
Public Affairs
Chuck Young, Managing Director, youngc1@gao.gov, (202) 512-4800 U.S. Government Accountability Office 441 G Street NW, Room 7149, Washington, DC 20548
Strategic Planning and External Liaison
Stephen J. Sanford, Managing Director, spel@gao.gov, (202) 512-4707 U.S. Government Accountability Office 441 G Street NW, Room 7814, Washington, DC 20548
Obtaining Copies of GAO Reports and Testimony
The fastest and easiest way to obtain copies of GAO documents at no cost is through our website. Each weekday afternoon, GAO posts on its website newly released reports, testimony, and correspondence. You can also subscribe to GAO’s email updates to receive notification of newly posted products.
Order by Phone
The price of each GAO publication reflects GAO’s cost of production and distribution. Pricing and ordering information is posted on our website.
To Report Fraud, Waste, and Abuse in Federal Programs
The Government Accountability Office, the audit, evaluation, and investigative arm of Congress, exists to support Congress in meeting its constitutional responsibilities and to help improve the performance and accountability of the federal government for the American people. GAO examines the use of public funds; evaluates federal programs and policies; and provides analyses, recommendations, and other assistance to help Congress make informed oversight, policy, and funding decisions. GAO’s commitment to good government is reflected in its core values of accountability, integrity, and reliability.
Copyright
This is a work of the U.S. government and is not subject to copyright protection in the United States. The published product may be reproduced and distributed in its entirety without further permission from GAO. However, because this work may contain copyrighted images or other material, permission from the copyright holder may be necessary if you wish to reproduce this material separately.