


Highlights
What GAO Found
The data that banks report to regulators have characteristics that make determining how community banks' small business lending changed since 2010 difficult. However, GAO's analysis found that the regulatory environment likely had a generally modest effect on various aspects of community banks and their small business lending.
Regulators data on small business lending. The data community banks report to regulators do not accurately capture lending to small businesses because the data exclude some loans to small businesses. Specifically, the definition of small business loans used for banks' reporting excludes loans greater than $1 million and has not been adjusted for inflation since 1992. In addition, the data capture loans by their size rather than the size of the borrowing entity, and therefore could include small loans to large businesses. These limitations hamper regulators' and policymakers' ability to assess actual changes in banks' small business lending, including any effect of regulation.
Amount of lending . GAO's analysis used alternative measures of small business lending and found that community banks' lending likely declined following the financial crisis but then increased from 2013 through 2017. After adjusting regulators' data to account for community bank mergers and other exits, remaining banks' small business lending increased by 5 percent from 2013 through 2017, and total business lending by all community banks grew to exceed 2010 levels. GAO's econometric models also found that community banks' small business lending since 2010 can be explained largely by macroeconomic, local market, and bank characteristics, and that the potential effect of regulatory changes was likely modest.
Lending processes. Based on our nationally representative survey of community banks, GAO estimates that most community banks made changes to their small business lending processes since 2010. Most banks cited the regulatory environment as the primary reason for these changes, which included seeking more documentation from borrowers and taking longer to make loans. Representatives of entities that assist small businesses were mixed on whether these changes affected small businesses’ ability to obtain loans.
Number of community banks. From 2010 through 2017, the population of community banks decreased by about 24 percent, largely due to mergers among community banks and a decline in the rate of new bank formations. However, GAO's econometric model found that macroeconomic, local market, and bank characteristics explained the majority of these trends, but changes in the regulatory environment and other factors may have also played a small role.
Community bank financial performance. Although many institutions reported increasing or reallocating staff and other resources to assist with regulatory compliance since 2010, GAO's analysis suggests that the effect of these changes on profitability and customer service were likely modest.
As regulatory changes do not occur in isolation and their cumulative effect cannot be easily quantified, these results should be interpreted with caution.
Why GAO Did This Study
Community banks—generally small and locally focused institutions—are important sources of credit to small businesses. Since the 2007–2009 financial crisis, regulators have made significant changes to the regulatory environment. While intended to increase institution soundness and better protect consumers, regulations and supervision can also have effects that Congress or regulators may not have intended. In particular, questions arose as to whether regulatory changes reduced community banks’ ability to make small business loans.
GAO was asked to assess the effect of regulatory changes since 2010 on community banks and small business lending. GAO examined the data regulators use to measure small business lending, as well as the extent of any regulatory effects on the amount of community banks’ small business lending and their lending processes, changes in bank populations, and financial performance. GAO analyzed community bank lending and financial data from 2001 through 2017, built econometric models using these and other data, and surveyed a nationally representative sample of over 450 community banks. GAO also interviewed staff from community banks (selected to ensure a range of sizes and geographic regions), small business advisers, banking and consumer advocacy groups, and financial regulators.
What GAO Recommends
GAO makes three recommendations to banking regulators to reevaluate and modify, as needed, the data they collect to measure small business lending. They agreed to the recommendations.
Recommendations
Recommendations for Executive Action
We are making a total of three recommendations, one each to the Federal Reserve, FDIC, and OCC.
| Number | Agency | Recommendation |
|---|---|---|
| 1 | Federal Reserve System: Board of Governors | The Chairman of the Board of Governors of the Federal Reserve System should collaborate with FDIC and OCC to reevaluate, and modify as needed, the requirements for the data banks report in the Consolidated Reports of Condition and Incomes to better reflect lending to small businesses. (Recommendation 1) |
| 2 | Federal Deposit Insurance Corporation | The Chairman of the Federal Deposit Insurance Corporation should collaborate with the Federal Reserve and OCC to reevaluate, and modify as needed, the requirements for the data banks report in the Consolidated Reports of Condition and Incomes to better reflect lending to small businesses. (Recommendation 2) |
| 3 | Department of the Treasury: Office of the Comptroller of the Currency | The Comptroller of the Currency should collaborate with the Federal Reserve and FDIC to reevaluate, and modify as needed, the requirements for the data banks report in the Consolidated Reports of Condition and Incomes to better reflect lending to small businesses. (Recommendation 3) |
Introduction
August 6, 2018
Dear Mr. Chairman:
Financial regulators have implemented many new regulations in the aftermath of the 2007–2009 financial crisis. The Dodd-Frank Wall Street Reform and Consumer Protection Act (Dodd-Frank Act) of 2010 included numerous reforms to strengthen practices and oversight of financial institutions.[1] Although community banks and credit unions were exempt from several provisions of this act, they have had to respond to additional regulatory requirements as a result of it and other regulatory efforts. These institutions have historically played an important role in serving their local customers, including providing credit to small businesses. Because small businesses are important to the economic well-being of the United States, questions have been raised about the effect of regulations on their ability to access credit from smaller depository institutions. According to Census Bureau data, businesses with less than 500 employees accounted for about 48 percent of U.S. total employment in 2015. A 2017 Small Business Administration (SBA) report indicated that small businesses annually contribute almost 40 percent of the U.S. private nonfarm output, but noted that these businesses typically faced challenges accessing credit, a key element of small business survival and growth.[2]
You asked us to examine the effects of changes in the regulatory environment on community banks and credit unions and their ability to meet the needs of small businesses. Changes in the regulatory environment encompass changes to specific laws and regulations as well as changes in how existing requirements are implemented and enforced. This report examines, for the period 2010 through 2017, the effect of the regulatory environment on community banks and credit unions, including (1) the data regulators use to measure the volume of small business lending and how and why small business lending volumes changed, (2) how and why small business lending processes changed among these institutions, and (3) how and why the number of institutions and their financial performance changed, as well as (4) actions regulators took to identify and mitigate the effects of changes in the regulatory environment on these institutions and their small business customers.[3] In response to your request, we also provided you with a report in February 2018 that addressed which regulations institutions viewed as most burdensome and what actions financial regulators had been taking to reduce this burden.[4]
To identify how and why community banks' and credit unions' small business lending, number of institutions, and financial performance changed, we took the following steps:
- Analyzing available data. We analyzed bank and credit union regulatory data on the level of small business lending; mergers, failures, and new institution formation; and the market shares, resource costs, profitability, and operational efficiency of these institutions from 2001 through 2017.[5] Because of limitations with regulators' data, we also used two alternative measures—(1) business loans of $1 million or less made by survivor community banks (that is, community banks that did not become or merge with a large bank, voluntarily exit the market, or fail during the period we examined) and (2) community banks' total business loans—as proxy measures of small business lending. We believe that these measures, identified through our internal analyses and our conversations with bank regulators, were suitable as alternative measures of small business lending.
- Econometric modeling. We developed econometric models to better understand how many of the changes in community bank trends (such as small business lending, mergers, and new bank formations) could potentially be attributable to changes in the regulatory environment since 2010. Because measuring the cumulative effect of changes in the regulatory environment is difficult, we used a two-stage approach that did not involve estimating regulatory effects directly. First, we developed models that used data on macroeconomic, local market, and bank characteristics (factors represented by variables we could measure) from 2003 through 2009 to forecast community bank trends from 2010 through 2016. Second, by comparing the observed trends that actually occurred during the period to the trends forecasted by the models, we drew conclusions about the influence of "other factors," which could include the influence of changes in the regulatory environment since 2010, changes in demand for small business loans, technological advancements, and incentives for banks to achieve economies of scale, among other things. However, because we cannot distinguish the components of the "other factors" category from one another, we cannot know with certainty the effect of changes in the regulatory environment on community bank trends.
- Surveying community banks and credit unions. We surveyed generalizable samples of more than 450 community banks and 450 credit unions (selected to represent urban and rural areas, geographic regions, and a range of size categories) to identify why they may have made changes to their operations from January 2010 through August 2017.[6]
- Interviewing key stakeholders. We interviewed 18 banks and credit unions, selected to represent a range of asset sizes and geographic regions; consumer groups and financial services advocacy groups chosen because of their familiarity with community banks and credit unions and changes in the regulatory environment; and entities that advocate on business issues or that provide advice to businesses on lending issues.
To determine how regulators identified the effects of regulatory changes, we interviewed staff from the Board of Governors of the Federal Reserve System (Federal Reserve), the Bureau of Consumer Financial Protection (BCFP), the Federal Deposit Insurance Corporation (FDIC), the National Credit Union Administration (NCUA), and the Office of the Comptroller of the Currency (OCC).[7] We also analyzed studies by these entities and other researchers and academics on trends in banking and lending. In addition, we interviewed staff from SBA. Appendix I provides more detail on our scope and methodology, and appendix II provides the structure and specifications of the econometric modeling and the data we used as inputs.
We conducted this performance audit from November 2016 to August 2018 in accordance with generally accepted government auditing standards. Those standards require that we plan and perform the audit to obtain sufficient, appropriate evidence to provide a reasonable basis for our findings and conclusions based on our audit objectives. We believe that the evidence obtained provides a reasonable basis for our findings and conclusions based on our audit objectives.
Background
Community banks are generally smaller banks that provide relationship banking services to local communities and have management and board members who reside in the communities they serve. Regulators and others have observed that community banks tend to differ from larger banks in their relationships with customers. Large banks are more likely to engage in transactional banking, which focuses on highly standardized products that require little human input and are underwritten using statistical information. In contrast, community banks are more likely to engage in what is known as relationship banking, in which banks consider not only data and statistics but also nonquantifiable information acquired primarily by working with the banking customer over time. Using this banking model, community banks may be able to extend credit to customers, such as small business owners, who might not be considered for a loan from a larger bank that engages in transactional banking.
Small business lending is a significant activity by community banks. As of June 2017, community banks had over $292 billion outstanding in business loans with original principal balances under $1 million (which is how small business loans are defined in regulatory reports), which represented about 19 percent of these institutions’ total lending. In that same month, large banks held about $390 billion outstanding in business loans with original principal balances under $1 million, representing 5 percent of their total lending.
Credit unions are nonprofit, member-owned institutions that take deposits and make loans. Unlike banks, credit unions are subject to limits on their membership because members must share a “common bond”—for example, working for the same employer or living in the same community. In addition to providing consumer products to their members, credit unions are also allowed to make loans for business activities subject to certain restrictions. These "member business loans" are defined as a loan, line of credit, or letter of credit that a credit union extends to a borrower for a commercial, industrial, agricultural, or professional purpose.[8]
Regulators Overseeing Community Banks and Credit Unions
The regulator responsible for overseeing a community bank or credit union varies depending on how the institution has been chartered and whether it is federally insured (see table 1). Federal depository institution regulators are responsible for ensuring the safety and soundness of the institutions they oversee, protecting federal deposit insurance funds, promoting stability in financial markets, and enforcing compliance with applicable consumer protection laws. All depository institutions that are covered by federal deposit insurance have a federal prudential regulator that oversees the safety and soundness of the institution and may issue regulations and take enforcement actions against institutions within its jurisdiction.
Other federal agencies also impose regulatory requirements on banks and credit unions. These include rules issued by BCFP, which was created by the Dodd-Frank Act and implements and, where applicable, enforces federal consumer financial laws.[9] BCFP has supervisory and enforcement authority for federal consumer financial laws for insured depository institutions with more than $10 billion in assets and their affiliates. The federal depository institution regulators—FDIC, the Federal Reserve, OCC, and NCUA—examine how federally insured institutions with $10 billion or less in assets comply with consumer protection requirements. Although community banks and credit unions with less than $10 billion in assets would not typically be subject to examinations by BCFP, they are generally required to comply with the rules related to consumer protection issued by this agency.
In addition, the Financial Crimes Enforcement Network (FinCEN) issues regulations that financial institutions, including banks and credit unions, must follow. FinCEN is a component of the Department of the Treasury’s Office of Terrorism and Financial Intelligence, and it supports government agencies by collecting, analyzing, and disseminating financial intelligence information to combat money laundering. It is responsible for administering the Bank Secrecy Act, which, with its implementing regulations, generally requires banks, credit unions, and other financial institutions, among others, to collect and retain various records of customer transactions, verify customers’ identities in certain situations, maintain anti-money laundering programs, and report suspicious and large cash transactions.[10] FinCEN relies on financial regulators and other entities to conduct examinations of U.S. financial institutions across a variety of financial sectors to determine compliance with these regulations.
Impact of the 2007–2009 Financial Crisis
Assessing the effect of changes in the regulatory environment in the period following the 2007–2009 crisis is complicated by the severity of the crisis’s economic impact on the United States. In a January 2013 report, we reviewed academic and other sources and found that the 2007–2009 financial crisis, like past financial crises, was associated with a steep decline in output and the most severe economic downturn since the Great Depression of the 1930s.[11] The U.S. economy entered a recession in December 2007 that lasted until June 2009, with U.S. real gross domestic product falling by nearly 5 percent and not regaining its pre-recession level until the third quarter of 2011. Some studies noted that the impacts of the crisis could persist beyond 2018 or be permanent.
The 2007–2009 crisis was also associated with large declines in employment, household wealth, and other economic indicators that could have affected the rate of new business formations and demand for small business loans. The monthly unemployment rate peaked at around 10 percent in October 2009 and remained above 8 percent for over 3 years, the longest such stretch since the Great Depression. Between 2005 and 2011, households collectively lost about $9.1 trillion (in constant 2011 dollars) in national home equity in part because of the decline in home prices. The Federal Reserve’s Survey of Consumer Finances found that median household net worth fell by $49,100 per family, nearly 39 percent, from 2007 through 2010. Such dramatic declines in net worth, combined with an uncertain economic outlook and reduced job security, can cause consumers to reduce spending, and lower the financial health of businesses and their willingness to seek credit. Reduced consumption, all else being equal, further reduces aggregate demand and real gross domestic product. However, our 2013 report noted that analyzing the peak-to-trough changes in certain measures, such as home prices, can overstate the impacts associated with the crisis, as valuations before the crisis may have been inflated and unsustainable.[12]
Changes to Financial Regulations since 2010
In response to the 2007–2009 financial crisis, Congress passed the Dodd-Frank Act, which became law on July 21, 2010. The act included numerous reforms to strengthen oversight of financial services firms, including consolidating consumer protection responsibilities within BCFP, which the act created. The Dodd-Frank Act also directed or granted authority to federal financial regulatory agencies to issue hundreds of regulations to implement the act’s reforms. Many of the act's provisions target the largest and most complex financial institutions, and regulators have noted that much of the act is not meant to apply to community banks or credit unions.
Although the Dodd-Frank Act exempts small institutions, such as community banks and credit unions, from several of its provisions and authorizes federal regulators to provide small institutions with relief from certain regulations, it also contains provisions that impose additional restrictions and compliance costs on these institutions. As we reported in 2012, federal regulators, state regulatory associations, and industry associations collectively identified provisions within 7 of the act’s 16 titles that they expected to affect community banks and credit unions.[13]
In addition to regulations resulting from the Dodd-Frank Act, other regulations have created potential burdens for community banks. For example, depository institution regulators also revised the capital requirements applicable to banking organizations, including community banks. These requirements were to implement the Basel III framework, a comprehensive set of reforms to strengthen global capital and liquidity standards issued by an international body consisting of representatives of various countries’ central banks and regulators. These new requirements significantly changed the risk-based capital standards for banks and bank holding companies and introduced new leverage and liquidity standards. As we reported in November 2014, officials interviewed from community banks did not anticipate any difficulties in meeting the new U.S. capital requirements but expected to incur additional compliance costs.[14]
Although a number of provisions may ultimately affect lending by smaller institutions, we noted in our 2012 report that officials from federal agencies, state regulatory associations, and industry associations identified only one provision in the Dodd-Frank Act that was directly related to small business lending.[15] This provision was section 1071 of the Dodd-Frank Act, which amended the Equal Credit Opportunity Act to require financial institutions to compile, maintain, and report information concerning credit applications made by women-owned, minority-owned, and small businesses in accordance with regulations issued by BCFP. The purpose of the provision was to facilitate the enforcement of fair lending laws and enable communities, governmental entities, and creditors to identify the business and community development needs and opportunities of women-owned, minority-owned, and small businesses. In May 2017, BCFP issued a request for information to seek public comments to inform its efforts to implement this additional reporting.[16]
However, some Dodd-Frank Act provisions have also likely resulted in reduced costs for community banks. For example, revisions to how deposit insurance premiums are calculated reduced premiums by 33 percent for banks with less than $10 billion in assets between the first and second quarters of 2011. Another change reduced the audit-related costs that some banks were incurring in complying with provisions of the Sarbanes-Oxley Act.
Potential Benefits of Financial Regulation
Financial regulations can also provide significant benefits. For example, a primary objective of banking regulations is to promote the safety and soundness of banks and the banking system.[17] Effective regulation and supervision can safeguard against future financial crises and provide an important source of confidence to the market about the general health and resiliency of the banking sector. Past banking-related crises have demonstrated the need for federal banking regulators to respond proactively to problems developing in the banking system. In February 2018, we reported that staff of federal regulators and consumer groups noted various benefits of regulations related to mortgage activities and requirements to report suspicious banking activities.[18] For example, they said that collecting data on a mortgage applicant’s demographic characteristics (such as an applicant's race, ethnicity, and sex) has helped address discriminatory lending practices and are essential for the enforcement of fair lending laws and regulations.[19] Similarly, regulators have reported that requirements for institutions to report large cash deposits help ensure that the U.S. financial sector is not used to aid illicit activity, including the sale of illegal narcotics, terrorism, and human trafficking.[20]
Major Findings
IN THIS SECTION
- Small Business Lending Data Have Substantial Limitations, but the Effect of the Regulatory Environment on Lending Volumes Appears Modest
- Community Banks Reported That the Regulatory Environment Was a Primary Reason for Changing Lending Processes
- Factors Other Than Regulatory Environment Explain Most Changes in the Number and Financial Performance of Community Banks
- Regulators Have Taken Steps to Analyze and Mitigate the Effects of Regulatory Changes on Small Business Lending
Small Business Lending Data Have Substantial Limitations, but the Effect of the Regulatory Environment on Lending Volumes Appears Modest
Limitations in the data banks report to bank regulators make it difficult to determine how small business lending by community banks changed after 2010. However, alternative proxies that partially address these limitations suggest that such lending has increased since the financial crisis. In addition, our econometric analysis indicates that changes in the regulatory environment likely had a modest effect on community banks' small business lending volumes from 2010 through 2016.[21] Further, small business lending by credit unions, which accounts for a small share of total small business lending, increased considerably from 2010 through 2017.[22]
Measuring Small Business Lending Using Call Report Data Poses Challenges
The data banks report to bank regulators on their lending do not provide a fully accurate measure of loans to small businesses. Specifically, in Consolidated Reports of Condition and Income (Call Reports)—financial reports that banks provide to regulators—banks are required to report any loans they make to businesses with original principal balances of $1 million or less.[23] These data, which bank regulators use as a proxy to measure small business lending, appear to show that community bank lending to small businesses declined after the financial crisis. Specifically, community banks' total business loans with original principal balances of $1 million or less decreased by 16 percent from 2010 through 2017, from $347 billion in outstanding loans to $292 billion.
However, using business loans with original principal balances of $1 million or less is not an accurate measure of small business lending for two reasons:[24]
- The measure is based on loan size rather than size of the business obtaining the loan. As a result, a loan for more than $1 million obtained by a small company is not reported as a small business loan. In November 2017, FDIC presented preliminary results of a survey indicating that banks with less than $1 billion in total assets (a population that includes most community banks) made about $93 million in commercial and industrial loans—one type of business loan included in the Call Report data on small business lending—as of December 31, 2015, that were not counted under this measure because the loans to small businesses exceeded the $1 million threshold.[25] In addition, banks would also report as part of this measure loans obtained by a large company for less than $1 million, which further distorts its use as a measure of lending to small businesses.
- Inflation distorts the accuracy of the measure over time. The loan thresholds for Call Report data on small business lending—$1 million for businesses and $500,000 for loans to farms—are not adjusted for inflation and have not changed since 1992. As a result, the number of loans that fall under these thresholds decreases over time due to inflation alone, which averaged about 2 percent annually from 1992 through 2017.[26] Therefore, the data this measure captures have likely significantly underestimated banks' lending to small businesses since 1992. As shown in figure 1, if the measure's $1 million threshold had been indexed to inflation, banks would have reported loans with original principal balances under around $1.6 million as small business loans in 2017. A $1 million loan in 2017 was equivalent to a loan of about $625,000 in 1992 terms.
Figure 1: Effect of Inflation on Bank Regulators' $1 Million Threshold for Small Business Lending, 1992–2017
Another factor affecting the use of these data for assessing community banks' lending to small businesses is that the population of these banks changes over time. Thus, the amount of lending captured by the data can decline as a result of banks exiting the population, rather than as a result of banks decreasing their lending. A bank exits the population of community banks when the bank:
- no longer meets the definition of a community bank (for example, by merging or growing to become a large bank),
- voluntarily exits (for example, by becoming a credit union), or
- fails without being acquired by another community bank.[27]
As a result, these exits can overstate the extent to which small business lending as captured in the Call Report data appear to decrease over time.
Alternative Measures Addressing Some Small Business Lending Data Limitations Suggest That Lending May Have Increased in Recent Years
To address some of the limitations of the Call Report data on small business lending, we examined two alternative measures of community bank small business lending. These alternative measures suggest that community banks' small business lending likely increased from 2013 through 2017 after decreasing from 2010 through 2012 following the financial crisis. Our first alternative measure adjusted the Call Report data to account for exits by banks leaving the population of community banks. To account for the effect of these departures, we identified as "survivor" community banks those community banks that existed or formed since 2001 and remained in existence through 2017, and we excluded banks that exited the population of community banks at any time from 2001 through 2017.[28] Analyzing the lending by these survivor community banks allowed us to capture changes in bank lending levels rather than changes resulting from banks leaving the population of community banks.
When we adjusted the Call Report data on small business lending to account for exits from the community bank population, we found that survivor community banks' volume of loans outstanding decreased by 6 percent from 2010 through 2012, but increased by 5 percent from 2013 through 2017 (see fig. 2).[29] This analysis suggests that exits explain some portion of the 16 percent decline shown by the Call Report data on small business lending from 2010 through 2017.
Figure 2: Volume of Community Banks' Outstanding Business Loans with Original Principal Balances of $1 Million or Less, 2001–2017, by Bank Population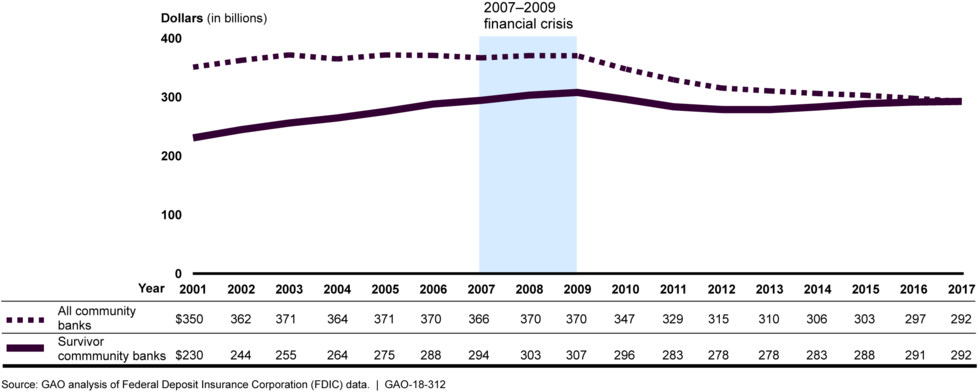
Adjusting the Call Report data for exits from the community bank population does not address all the limitations of these data discussed above. Specifically, examining Call Report data for survivor community banks also does not capture small business loans larger than $1 million, and they may include loans under $1 million made to large businesses. In addition, this analysis does not overcome the limitation of the $1 million small business loan threshold not being adjusted for inflation. Finally, restricting the population of banks for analysis may also introduce some bias by excluding information on changes in small business lending by the institutions that exited.
A second alternative measure we used to try to overcome the limitations of the Call Report data on small business lending was to examine community banks' total loans to businesses, which banks also report to regulators and includes business loans of all sizes. Because data on total business lending includes loans of any size, inflation does not cause a growing proportion of small business loans to be excluded from the data over time. FDIC officials said they typically use the Call Report total business lending measure as a proxy measure for community banks' small business lending activity. FDIC officials noted that the preliminary results of their recent small business lending survey confirm that many community bank business loans are small business loans. According to this survey, 86 percent of banks with assets less than $250 million and 77 percent of banks with assets between $250 million and $1 billion said that "largely all" of their commercial and industrial lending is to small businesses.[30] However, measuring community banks' small business lending using data on these institutions' total business lending overestimates these institutions' small business lending by including loans to large businesses.
We found that community banks' total business lending increased from 2010 through 2017 (see fig. 3).[31] Specifically, we found that community banks' total business lending dipped slightly after the financial crisis, but exceeded precrisis levels by 2017 (similar to lending by survivor community banks, which also began to increase in the years following the financial crisis). Without accounting for exits from the community bank population, community banks' total business loans outstanding increased from about $689 billion 2010 to about $765 billion in 2017, or approximately 11 percent.[32] When we accounted for exits from the community bank population, the increase was even larger. Specifically, survivor community banks’ total business lending increased by about 36 percent, from $563 billion in outstanding loans in 2010 to $765 billion in 2017. These results again suggest that some portion of the decline shown by the Call Report data on small business lending for the full population of community banks from 2010 through 2017 is likely due to the limitations of that measure rather than actual changes in banks' lending activities.
Figure 3: Volume of Community Banks' Outstanding Business Loans with Original Principal Balances of $1 Million or Less and Total Business Loans, 2001–2017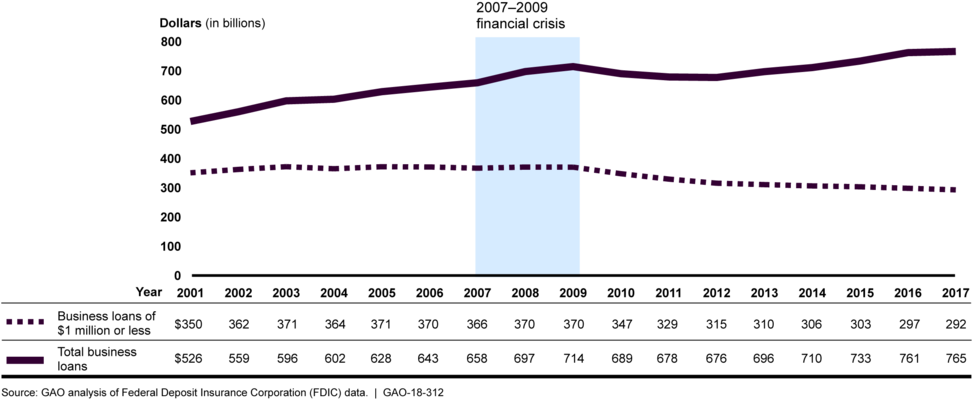
Regulators Have Not Taken Steps to Address the Limitations in the Call Report Measure of Small Business Lending
As previously discussed, the data that banks report to regulators do not reflect the full range of their lending to small businesses because they are based on loan rather than firm size and have not been adjusted for inflation. The use of Call Report data on business loans with original principal balances of $1 million or less as a measure of small business lending was established as a result of the Federal Deposit Insurance Corporation Improvement Act of 1991 (FDIC Improvement Act). The act requires FDIC, the Federal Reserve, and OCC to collect information from insured depository institutions that is sufficient to assess the availability of credit to small businesses and small farms.[33]
FDIC officials said they recognize that the data they use for community banks' small business lending have some flaws, but they define small business loans as they do to minimize the reporting burden for banks. When establishing the reporting requirements in 1992, bank regulators considered categorizing loans as small business loans based on the total sales volume of borrowing businesses and farms. However, they did not adopt that definition after receiving a large number of comments that it would be burdensome to implement.[34] FDIC officials also said that banks would likely find continually adjusting the loan threshold in their reporting systems for inflation to be difficult and potentially burdensome. In addition, Federal Reserve officials told us that bankers and other stakeholders often express concerns about the burden of collecting data on small business lending, noting that community banks often use basic systems and sometimes rely on paper record keeping.[35]
Officials from FDIC, the Federal Reserve, and OCC told us their agencies have not reevaluated the reporting requirements since they were established in 1992, except for mandated reviews in which bank regulators must determine whether each Call Report item should remain in place.[36] FDIC and OCC officials also said they were not aware of their agencies making or considering any formal proposals to alter the requirements, but officials from the Federal Reserve said they have proposed changing the definition so that it is based on the size of the borrowing firm. When bank regulators established the existing requirements for reporting on small business loans, they cited a 1989 survey that found a correlation between business size and loan size, but bank regulators told us they have not reexamined this correlation because they have no reason to believe it does not still hold true.
Some evidence suggests that basing the reporting requirements for small business lending on firm size and adjusting them for inflation may not be as burdensome as bank regulators and others once thought. For example, a 2016 survey found that community banks already use a borrowing firm's total revenue as the top factor in defining small business loans.[37] In addition, technological changes since 1992 may facilitate banks' ability to collect these data without creating additional undue burden on banks.
Because the reporting requirements for small business loans likely exclude a significant portion of loans to small businesses, bank regulators are hindered in their ability to assess the availability of credit to small businesses and small farms, as required by the FDIC Improvement Act. Moreover, the Federal Reserve recently began a new survey on small business lending because, officials told us, existing data are not sufficient for understanding and addressing related policy issues, which further underscores the limitations of available data.[38] Federal internal control standards also state that entities should obtain relevant data from reliable internal and external sources to achieve their objectives.[39] Without reporting requirements that better reflect banks' lending to small businesses, bank regulators and policymakers may be limited in their ability to assess the effects of regulation and other factors on the availability of credit to these firms.
Macroeconomic, Local Market, and Bank Characteristics Largely Explain Community Bank Small Business Lending since 2010, but the Regulatory Environment Also May Have Played a Small Role
Our econometric analysis suggests that the effect of changes in the regulatory environment on small business lending, if any, was relatively small from 2010 through 2016. To examine influences on community banks' small business lending from 2010 through 2016, we developed econometric models of each of our two alternative measures of small business lending—survivor community banks' business loans of $1 million or less and all community banks' total business lending. Because measuring the cumulative effect of changes in the regulatory environment is difficult, each model attempts to determine the extent to which macroeconomic, local market, and bank characteristics—factors we can measure—explained community banks' small business lending compared to all other factors:[40]
- Macroeconomic, local market, and bank characteristics. Macroeconomic conditions include growth in gross state product and interest rates. Local market demographics and competition include unemployment rates, population density and growth, changes in house prices, and the extent of market competition among all banks and credit unions. Bank characteristics include bank size, whether a bank is geographically diversified, the extent of performing and nonperforming loans, and the level of equity capital.
- Other factors. This category includes all factors that may have affected small business lending volumes other than those listed above. We did not include data for these factors directly in our model. These factors may include changes in the regulatory environment after 2010, changes in demand for small business loans, technological changes, and lending by nonbank competitors, among others.[41]
To examine the cumulative effect of the regulatory environment on small business lending, we estimated each model using data on macroeconomic, local market, and bank characteristics from 2003 through 2009. We then used these results to forecast the small business lending trends that would have occurred from 2010 through 2016 given the macroeconomic, local market, and bank characteristics that prevailed during this later period.[42] We then compared the lending levels our model forecasted to those that actually occurred. To the extent these differed, a greater difference between actual and forecasted lending indicates a greater influence by the set of factors that includes the regulatory environment.[43]
Our models found that macroeconomic, local market, and bank characteristics explained the majority of community banks’ outstanding small business lending from 2010 through 2016, leaving a relatively small portion of lending volumes that could potentially be explained by changes in the regulatory environment.[44] Because macroeconomic, local market, and bank characteristics forecasted small business lending trends that closely resembled the actual trends, we were able to conclude that the influence of other factors, such as changes in the regulatory environment after 2010 and changes in demand for small business loans, was likely relatively small. Because the extent to which any of these other factors actually influenced lending levels is unknown, our analysis does not provide definitive conclusions about the effect of changes in the regulatory environment on small business lending. Rather, it provides reasonable information on the potential role of regulation (see app. II for a more complete discussion of our model's approach and limitations).
Specifically, as shown in figure 4, we found the following:
- Survivor community banks' business loans of $1 million or less. Our model of survivor community banks' outstanding business loans with original principal balances of $1 million or less found that the actual volume of these loans was on average 2 percent less than forecasted from 2010 through 2016, based on the macroeconomic, local market, and bank characteristics in place during this period.[45] Although the difference between the forecasted and actual volume of business loans with original principal balances of $1 million or less these banks made was relatively small throughout the period, this difference peaked a few years after the financial crisis (our model forecasted that the volume of outstanding business loans with original principal balances of $1 million or less would be 11 percent higher in 2013 than it actually was) before returning to a difference of 3 percent or less in 2014.
- All community banks' total loans to businesses. Our model of community banks' total outstanding business loans found that the actual volume of these loans was on average 16 percent more than our model forecasted from 2010 through 2016 given the macroeconomic, local market, and bank characteristics that prevailed during that period. Specifically, actual lending levels consistently exceeded the levels our model forecasted each year during this period, with actual loan balances ranging from 6 percent to 23 percent higher than forecasted from 2010 through 2016.
Figure 4: Actual Outstanding Amounts of Survivor Community Banks' Business Loans with Original Principal Balances of $1 Million or Less and All Community Banks' Total Business Loans Compared to Amounts Expected Based on Macroeconomic, Local Market, and Bank Characteristics, 2003–2016
Although our models found that the influence of factors other than macroeconomic, local market, and bank characteristics on small business lending was small, the direction of this influence (i.e., the extent to which these other factors contributed to actual lending that was higher or lower than what our models forecasted) varied.[46] Specifically, our model of survivor community banks' business loans of $1 million or less found that the actual volume of outstanding lending was lower in some years than our model forecasted. This difference in small business lending volumes was attributable to factors we did not include directly in our model, which may include the effect of post-2010 regulatory changes. However, lower-than-forecasted lending could also have been the result of changes in the demand for small business loans, or it could have been affected by some other factor for which we did not include data in our model.
In contrast, our model of community banks' total loans to businesses found that the actual volume of outstanding business loans was consistently higher than what our model forecasted given the macroeconomic, local market, and bank characteristics in place from 2010 through 2016. This difference may be the result of increasing demand for loans over $1 million (which were excluded from the Call Report data on small business lending) as compared to demand for loans under that amount. However, because the data banks report on their lending do not include information on specific loans or average loan amounts, the extent to which increased demand for larger loans affected our results is unknown.
Credit Unions Have Increased Small Business Lending since 2010
Although credit unions account for a small share of total bank and credit union small business lending, their lending to small businesses increased considerably from 2010 through 2017.[47] Our analysis of NCUA data found the following:
- Dollar amount of small business lending. Small business lending by credit unions increased by 109 percent from 2010 through 2017, from $12 billion in outstanding loans in 2010 to $25 billion in 2017.
- Number of small business loans. The number of small business loans by credit unions increased by about 85 percent, from about 79,000 outstanding loans in 2010 to about 146,000 outstanding loans in 2017.
As shown in figure 5, small business lending by credit unions increased each year from 2002 through 2017, indicating sustained growth. However, we cannot conclude that changes in the regulatory environment had no effect on credit union small business lending, because we do not know how credit union small business lending would have trended in the absence of such changes.[48]
Figure 5: Dollar Amount of Credit Union Small Business Loans Outstanding, 2001–2017
Community Banks Reported That the Regulatory Environment Was a Primary Reason for Changing Lending Processes
We found, based on our generalizable survey, that the majority of community banks changed their small business lending processes from January 2010 through August 2017, including increasing documentation requirements and processing time, and most cited the regulatory environment as the primary reason for these changes. A smaller proportion of credit unions also changed their small business lending processes, and the regulatory environment was the reason they cited most frequently.
Community Banks
We estimated, based on our survey results, that 79 percent of community banks increased documentation requirements for small business borrowers from January 2010 through August 2017.[49] As shown in figure 6, the regulatory environment was the top factor community bank representatives cited as the reason for this increase. Specifically, according to our survey, an estimated 97 percent of the community banks that reported increasing the amount of documentation they required borrowers to provide as part of obtaining a loan cited the regulatory environment as a factor that affected the increase to a moderate or great extent.[50] However, we estimated that about 50 percent of the community banks that increased documentation requirements also indicated that economic conditions affected this increase to a moderate or great extent.[51]
Figure 6: Survey Estimates of Factors Affecting the Increase in Documentation Required for Community Bank Small Business Loans, January 2010–August 2017
To obtain perspectives on the potential effect of changes to bank lending processes, we interviewed a judgmentally selected sample of small business advisers from six states' Small Business Development Centers as well as representatives of six small business advocacy groups.[52] A few of these small business advisers agreed that the amount of required documentation for obtaining loans had increased after the financial crisis, but the types of additional documentation sought by banks varied. One adviser said banks sought documentation they had not previously required, such as student loan information, appraisals, and personal asset verification. Representatives of one community bank also said they had introduced additional documentation requirements for small business loans beyond what was required by regulation—such as additional years of financial statements—to preempt any questions from bank examiners about borrowers' creditworthiness.
We also estimated, based on our survey results, that 69 percent of community banks increased the time they took to process small business loans from January 2010 through August 2017.[53] As shown in figure 7, almost all community banks that reported an increase in processing time attributed the increase to changes in the regulatory environment, among other factors. Community banks we interviewed also discussed reasons that processing time had increased. For example, one community bank said that the TILA-RESPA Integrated Disclosure, a requirement related to residential mortgage lending, increased the time needed to close loans that use residential real estate as collateral, which may include small business loans.[54] Although, according to FDIC officials, the TILA-RESPA Integrated Disclosure rule would likely not apply to these loans, as we have previously reported some compliance burdens arose from misunderstandings of the requirements.[55]
Figure 7: Survey Estimates of Factors Affecting the Increase in Time Needed to Make Community Bank Small Business Loans, January 2010–August 2017
Our survey also found that community banks changed their lending processes in other ways, including increasing fees, raising minimum credit criteria, or making other changes, and a majority of banks attributed these actions to changes in the regulatory environment (see table 2). However, as previously discussed, we found that the effect of the regulatory environment on the volume of community banks' small business lending appeared to be relatively modest, which suggests that changes to community banks' lending processes may not have significantly affected small business' ability to obtain loans.
Notes: We defined community banks using the Federal Deposit Insurance Corporation's definition, which takes into account institutions’ assets, foreign interests, specializations, and geographic characteristics. Community banks include banks with up to $39.5 billion in assets in 2017. We conducted a survey of the chief executive officers of 466 community banks from July 10, 2017 through August 25, 2017. Survey results are generalizable to the population of community banks. Confidence intervals are given at the 95 percent level of confidence.
Representatives of some community banks told us that they perceived a generally stricter regulatory environment, which could explain the decisions to make changes to their lending processes. A few community bank representatives we spoke with said their small business lending processes were affected by increased scrutiny of their lending activities during examinations, and several community bank representatives said they changed their processes in anticipation of increased scrutiny. For example, representatives of one community bank reported testing all potential commercial customers—including small businesses—to assess how they would react to different financial situations, although no regulation requires them to do so. In addition, some institutions could perceive a stricter regulatory environment because of fines imposed for regulatory infractions. Although not specifically related to small business lending, since 2010 federal agencies have collected billions of dollars in settlement payments and penalties from financial institutions for alleged violations of regulations related to mortgage loan origination and servicing and Bank Secrecy Act/anti-money laundering activities.[56]
Small business advisers had mixed views on the extent to which changes to banks' lending processes affected small businesses' ability to obtain loans. According to several advisers we interviewed, tightened credit standards since 2010 have made obtaining small business loans more difficult, and a few advisers said that meeting documentation requirements and higher credit standards was harder for newer small businesses. As a result, some advisers said small businesses were increasingly turning to alternative lenders for their credit needs. In contrast, other advisers said they did not think changes to lending processes affected the availability of credit for small businesses. For example, one small business adviser said he did not think increased fees would discourage small businesses from applying for loans.
Although few of the regulatory changes that have taken effect since 2010 directly relate to small business lending, community banks' small business lending processes may have been affected by regulatory changes in other areas. For example, a few community bank representatives we interviewed said that increased regulation related to residential mortgage lending had spillover effects into their small business lending activities, such as when a customer seeking a business loan used personal real estate as collateral.[57]
However, regulatory changes since 2010 may have also benefited community banks' small business lending and consumers. For example, FDIC officials told us that because regulatory changes have required community banks to hold more capital their safety and soundness has improved. In addition, some changes community banks made to their documentation requirements may have improved bank institution's safety and soundness. For example, as we reported in August 2010, origination features such as low or no documentation of income or assets may be associated with an increased likelihood of default.[58] Similarly, a few community bank representatives we interviewed said regulatory changes have helped community banks return to good business practices, and representatives from one small business advocacy group stated that regulatory changes have helped protect consumers.
Credit Unions
Our survey found that the majority of credit unions increased documentation requirements for small business loans from January 2010 through August 2017, and some credit unions also made other changes to their small business lending processes (see table 3).[59] Representatives of credit unions that changed their lending processes often cited changes in the regulatory environment as the reason, although few of the regulatory changes since 2010 directly relate to small business lending by credit unions.[60] In written comments provided in response to our survey, some credit union representatives cited increased regulatory scrutiny of their lending decisions, including examiners' requests for additional documentation of lending decisions, as affecting their small business lending.
Notes: We conducted a generalizable survey of 470 credit union chief executive officers of credit unions from July 17, 2017 through August 25, 2017. Our analysis considered only small and medium credit unions, which accounted for about 95 percent of all credit unions as of June 2017. We excluded large credit unions with total assets above an annual threshold (equal to $201 million in 2001 and $994 million in 2017). Confidence intervals are given at the 95 percent confidence level.
Factors Other Than Regulatory Environment Explain Most Changes in the Number and Financial Performance of Community Banks
Long-term community bank trends and macroeconomic, local market, and bank characteristics—rather than changes in the regulatory environment—appeared to explain most changes in the number of community banks and their market shares since 2010. In addition, although many institutions reported in our survey that they increased or reallocated staff and other resources to assist with regulatory compliance from 2010 through 2017, our analysis suggests that the effect of these changes on community banks' financial performance, if any, was minimal.
Regulatory Environment Likely Had a Relatively Small Effect on the Decline in Community Bank Numbers
The number of community banks declined by about 24 percent from 2010 through 2017, from about 7,000 to about 5,300.[61] Similarly, the number of credit unions declined by 22 percent during this period. However, these declines are similar to those that occurred prior to 2010: from 2001 through 2009, the number of community banks declined by 16 percent, while the number of credit unions declined 24 percent.
Figure 8: Number of Community Banks, Credit Unions, and Large Banks, 2001–2017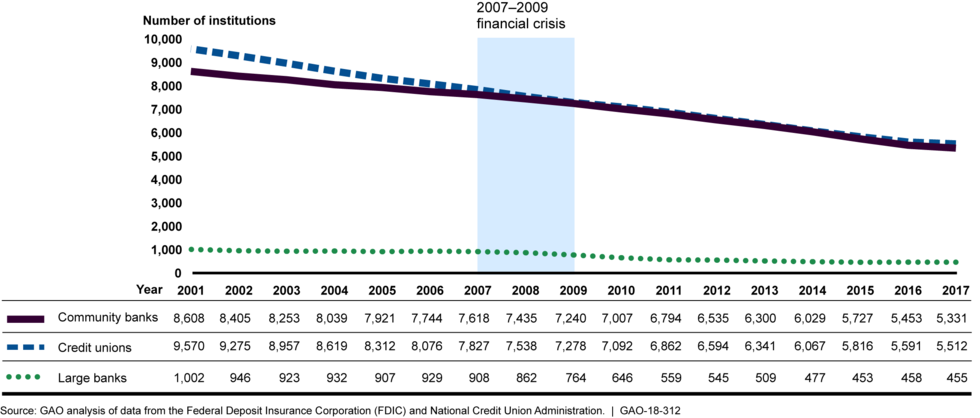
The decline in the total number of community banks since 2010 has been most pronounced among small community banks—those with less than $300 million in assets in 2016 dollars—which declined by 31 percent from 2010 through 2017 (see fig. 9). These banks made up the majority—approximately 74 percent (about 5,200 banks)—of all community banks in 2010, but by 2017 their proportion of the total community bank population had declined to 67 percent. Conversely, the number of larger community banks—those with $1 billion or more in assets in 2016 dollars—increased by 6 percent during this period.[62]
Figure 9: Number of Community Banks, 2001–2017, by Community Bank Size Category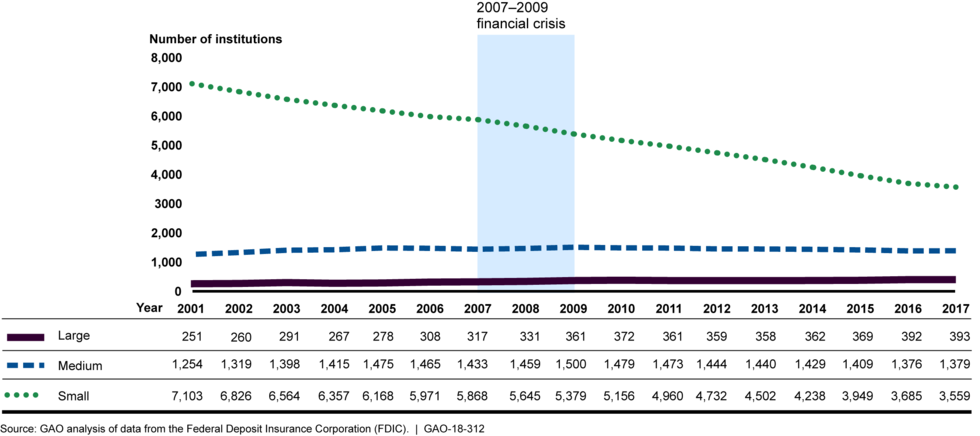
Our analysis indicates that from 2010 through 2017, approximately 1,800 community banks exited the population by merging, consolidating, or failing (see table 4):[63]
- Mergers. The majority of the exits from the community bank population—approximately 64 percent (1,181)—resulted from mergers and about 72 percent of these mergers were between community banks. A similar portion of exits—about 66 percent—resulted from mergers from 2001 through 2009, the period before and during the financial crisis. The majority of credit union exits from 2010 through 2017 were also due to mergers.
- Consolidations. Consolidations of related banks under one charter accounted for about 14 percent of community bank exits from 2010 through 2017.[64]
- Failures. Failures represented about 18 percent of community bank exits from 2010 through 2017.[65] Over two-thirds of these failures were in 2010 and 2011, the 2 years immediately after the 2007–2009 financial crisis.
Notes: We defined community banks using FDIC's definition, which takes into account institutions’ assets, foreign interests, specializations, and geographic characteristics. Community banks include banks with up to $39.5 billion in assets in 2017. We excluded large credit unions (those with total assets above an annual threshold equal to $201 million in 2001 and $994 million in 2017) from this analysis. Mergers are generally a means by which banks or credit unions can expand their size and geographic reach by combining with or acquiring other institutions that previously had different owners. Consolidations occur when an existing bank holding company combines related institutions holding separate charters. According to NCUA officials, no legal provision allows credit unions to consolidate. Institutions generally fail when their financial conditions have deteriorated to the point that they are unable to meet their obligations to depositors and others and they are closed by a federal or state regulator. Other exits include voluntary liquidations and unexplained closings. Percentages may not add up to 100 percent due to rounding.
Our econometric model estimated that macroeconomic, local market, and bank characteristics explained the majority of community bank mergers from 2010 through 2016. However, other factors—which could include changes in the regulatory environment, the availability of banks for mergers, and incentives to achieve economies of scale, among other things—likely had some effect.[66] The actual numbers of mergers for this period were, on average, 20 percent higher than our model forecasted, based on macroeconomic, local market, and bank characteristics at the time (see fig. 10).[67] This difference between actual and forecasted mergers indicates that other factors likely had some effect, although the effect was relatively small. This effect was most pronounced from 2013 through 2016 where the difference ranged from 23 to 31 percent.
Figure 10: Actual Number of Community Bank Mergers Compared to Number Expected Based on Macroeconomic, Local Market, and Bank Characteristics, 2003–2016
Banks may choose to merge in order to achieve economies of scale—that is, to increase their size to generate additional revenues at lower costs.[68] Although the existence of economies of scale in banking has been the subject of debate, some research suggests that banks can lower their costs by expanding.[69] Some community bank representatives we spoke with said banks consider merging to increase profitability and operational efficiency by becoming larger institutions. In response to changes in the regulatory environment since 2010, representatives of one community bank told us that their bank merged as a way to increase resources and staff, while maintaining profitability. In addition, FDIC analysis found that the number of banks, including community banks, has been declining since the 1980s, when federal and state legislative changes began relaxing geographic restrictions on banking activities and allowed banks to operate across multiple states under a single charter, resulting in mergers that reduced the number of banks.[70] For example, FDIC researchers found that bank numbers were steady for several decades prior to the 1980s, but declined by around 66 percent from 1980 through 2013.
The overall decline in the number of community banks and credit unions is also related to the rate at which new institutions form, which was lower from 2010 through 2017 than in prior periods.[71] According to bank regulator data, only 10 new community banks formed during this period—a rate of approximately one new community bank per year (see fig. 11). In contrast, 814 new community banks formed from 2001 through 2009—a rate of 90 per year. Similarly, according to our analysis of NCUA data, 19 new credit unions formed from 2010 through 2017 (a rate of about 2 per year), while 62 new credit unions formed from 2001 through 2009 (about 7 per year).
Figure 11: Number of New Community Banks and Credit Unions, 2001–2017, by Type of Institution
Our econometric analysis found that macroeconomic and local market characteristics were the primary factors affecting the rate of new community bank formations from 2010 through 2016. Specifically, our model forecast that the prevailing macroeconomic and local market characteristics would result in relatively few new community bank formations (no more than three markets with new bank formations in any one year) from 2010 through 2016; the actual number of new community bank formations that did occur exceeded this model's forecast, but only slightly (see fig. 12).[72] The similarity between the actual and forecasted numbers of new bank formations suggests that the effect of changes in the regulatory environment on new community bank formation was relatively small. This result was similar to a 2014 Federal Reserve study that found that economic conditions explained the majority of the decline in new banks.[73]
Figure 12: Actual Number of Markets with New Community Bank Formations Compared to Number Expected Based on Macroeconomic and Local Market Characteristics, 2003–2016 
Number and Geographic Location of Community Bank Branches
From 2010 through 2017, the number of community bank branches—which are defined as all locations that accept deposits—declined, and our survey results and interviews suggest that these changes were due to various factors. According to our analysis of FDIC data, the number of community bank branches decreased by 15 percent from 2010 through 2017, from about 35,000 to about 30,000. This decrease reversed the previous trend of increasing numbers of branches leading up to the 2007–2009 financial crisis: according to FDIC data, from 2001 through 2009, the number of branches increased 6 percent, from about 33,000 to about 35,000.
Based on our survey results, we estimated that 20 percent of community banks closed one or more branches from January 2010 through August 2017.[74] Our survey results suggest that multiple factors, including changes in the regulatory environment, economic conditions, and technological advances, influenced these closures.[75] Representatives from some community banks we interviewed said branch opening and closing decisions are often based on branch profitability and growth opportunities, which stem from economic conditions, and that closures did not have major effects on customers. In contrast, our prior work found that compliance with Bank Secrecy Act/anti-money laundering regulations along with other factors, including demographic factors, contributed to bank branch closures.[76]
The number of community bank branches in about half of U.S. counties increased or remained the same in 2010 and 2017, while the number decreased in the other half of counties (see fig. 13). Additionally, although small, the percentage of counties with no community bank branches increased slightly in 2017 as compared with 2010.[77]
Figure 13: Changes in the Number of Community Bank Branches at the County Level, in 2010 and 2017
The distribution of community bank branches between urban and rural areas appears to have remained largely unchanged from 2010 through 2017. The majority of community bank branches are located in urban areas—about 70 percent in 2017—and declines in the number of branches were largest in urban areas (see table 5).[78]
Notes: We defined community banks using FDIC's definition, which takes into account institutions’ assets, foreign interests, specializations, and geographic characteristics. Community banks include banks with up to $39.5 billion in assets in 2017. We define "urban" and "rural" areas using the Department of Agriculture's Rural-Urban Commuting Area codes. These codes classify all census tracts in the United Sates on a 10-tier continuum from rural to urban based on daily commuting patterns, urbanization, and population density. For our analysis, we collapsed the 10 tiers into 4, where 2 tiers are considered rural and the other 2 are considered urban. The totals in this table exclude 15 community bank branches in 2010 and 9 in 2017, because we were unable to classify the branch locations as urban or rural.
Our analysis of NCUA data shows that from 2012 (the first year for which reliable data are available) through 2017, the number of credit union branches decreased by 5 percent, from about 16,000 to about 15,000. Based on our survey results, we estimated that 22 percent of credit unions closed one or more branches from January 2010 through August 2017 or were in the process of closing a branch. [79] Some credit union representatives we interviewed said credit unions make decisions about branch openings and closings based on the profitability of individual branches or member needs.
Market Share of Bank Activities
Along with decreases in the number of community banks, their market shares of banking activities—total banking assets, deposits, and loans and leases—decreased from 2010 through 2017.[80] For example, their share of total assets declined from 15 percent in 2010 to 13 percent in 2017, and their share of total deposits declined from 20 percent in 2010 to 15 percent in 2017.
Figure 14: Community Banks' Market Share of Total Assets, Deposits, and Loans and Leases, 2001–2017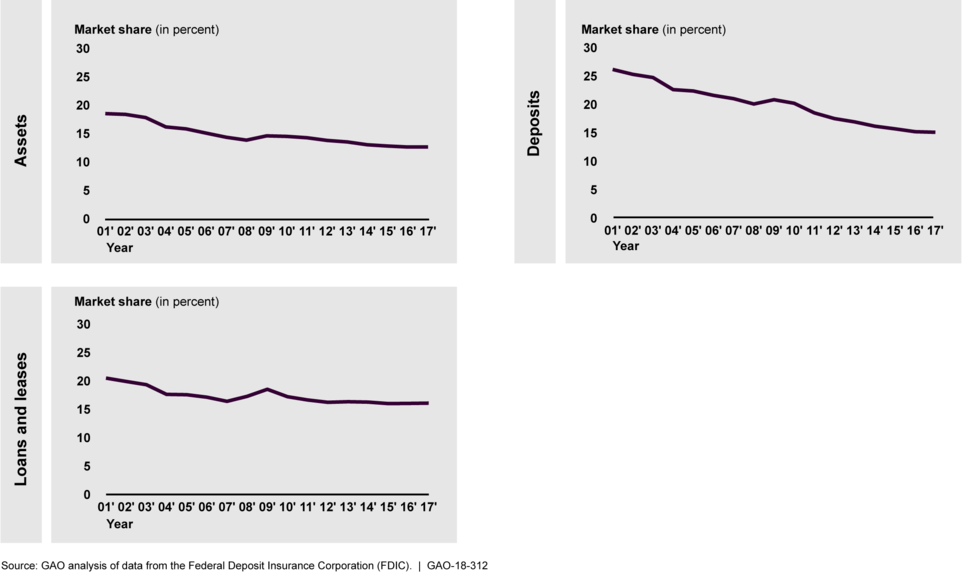
These declines appear to be part of longer-term trends to some degree. As figure 14 shows, although community banks’ market shares rose during the 2007–2009 financial crisis, their slight declines since then continued an overall downward trend in community bank market shares from at least 2001. According to FDIC officials, the loss of market shares by community banks may, in part, be the result of the Federal Reserve expanding its balance sheet and providing hundreds of billions in additional balances into the banking system in response to the financial crisis.
Credit unions' market shares of total assets, deposits, and loans and leases were largely unchanged.[81] From 2010 through 2017, their market shares of total assets, deposits, and loans and leases each changed by less than 1 percentage point.
The Effect of Regulatory Changes on Community Bank Financial Performance Is Likely Modest
In response to changes in the regulatory environment, community banks and credit unions may hire additional staff or outside consultants, invest in new software, or take other actions to help comply with new requirements. As a result, the number of employees and the administrative and personnel costs are likely to increase, and profits and performance are likely to decrease, all else being equal. However, while our survey results suggest many community banks and credit unions made such changes in response to regulations, these changes appear to have had minimal effects on community banks' and credit unions' total employment levels, expenses, and financial performance. Additionally, our econometric analysis suggests that the effects of changes in the regulatory environment on community bank profitability were likely small.
Changes in Employment
Our survey results indicated that most community banks and credit unions increased or reallocated staff from January 2010 through August 2017 to assist with changes in the regulatory environment, but FDIC and NCUA data for banks and credit unions showed no increases in total employment for these institutions.[82] Based on our survey, an estimated 73 percent of community banks hired additional staff and 86 percent reallocated existing staff to assist with changes in the regulatory environment.[83] However, our analysis of FDIC data found that total employment levels at these institutions decreased slightly from 2010 through 2017 (see fig. 15).[84] Based on our survey of credit unions, we estimated that most credit unions (61 percent) did not hire additional staff from January 2010 through August 2017, but that 61 percent of credit unions reallocated existing staff to assist with changes in the regulatory environment.[85] Similarly, our analysis of NCUA data shows that the median numbers of full-time and part-time credit union employees decreased during this period.
Figure 15: Median Number of Employees per $1 Million in Assets, 2001–2017 for Community Banks and Credit Unions, by Type of Institution
Our survey results suggest that institutions’ decisions to reallocate existing staff to assist with changes in the regulatory environment were driven or offset by other changes. For example, to help mitigate the negative effects of changes in staffing, institutions may have made greater use of technology. Of the community banks that decreased the time staff spend engaging directly with individual customers (an estimated 18 percent of community banks overall), an estimated 87 percent attribute that decision to technological advances.[86] Furthermore, an estimated 89 percent of community banks and 92 percent of credit unions increased their investments in customer-facing technologies, such as online or mobile banking.[87] Shifts in staffing allocations may also have resulted in decreased availability of products and services; however, our survey results found that most community banks and credit unions did not decrease the time staff spend engaging with customers or identifying new and innovative products. Based on our survey, we estimated that 83 percent of community banks and 82 percent of credit unions increased or did not change the time staff spend engaging directly with individual customers during this period.[88] Similarly, an estimated 91 percent of community banks and 97 percent of credit unions increased or did not change the time staff spend identifying new or innovative products.[89]
Changes in Operating Expenses
Many survey respondents reported spending on outside services to help assist with changes in the regulatory environment, but our analysis found that noninterest expenses—a measure that includes these and other regulatory compliance costs, as well as salaries, employee benefits, and consulting and advisory expenses—decreased overall. According to our survey results, an estimated 96 percent of community banks and 78 percent of credit unions hired a third party or purchased additional software or automated systems to assist with changes in the regulatory environment from January 2010 through August 2017.[90] As figure 16 shows, median noninterest expenses as a percentage of assets for community banks increased prior to and during the 2007–2009 financial crisis but then declined through 2017.[91] Similarly, credit unions' median noninterest expenses as a percentage of assets increased leading up to the financial crisis but have since declined to below precrisis levels.
Figure 16: Median Noninterest Expenses, 2001–2017 for Community Banks and Credit Unions, by Type of Institution
Community bank and credit union financial performance also improved from 2010 through 2017. In the prior period from 2001 through 2009, community banks' median efficiency ratio—a measure of operating expenses as a proportion of income—increased from 66 percent to 74 percent (see fig. 17), suggesting a decline in efficiency.[92] However, the ratio for these institutions has since decreased to 69 percent in 2017, indicating slightly greater efficiency. Similarly, from 2001 through 2009, credit unions' median efficiency ratio increased from about 85 percent to about 92 percent; however, it then improved to about 90 percent in 2017.
Figure 17: Median Efficiency Ratio, 2001–2017 for Community Banks and Credit Unions, by Type of Institution
Changes in Profitability
Our analysis of FDIC data suggests that community bank profitability is increasing and that regulatory environment has likely not negatively affected profitability significantly. Specifically, the median pretax return on assets—a measure of profitability—for the population of all community banks decreased leading up to and during the 2007–2009 financial crisis (see fig. 18).[93] From 2010 through 2017, however, the median return on assets for the population increased, although it remains below precrisis levels.[94] Similarly, credit unions’ median return on assets decreased during the financial crisis but increased from 2010 through 2017.
Figure 18: Median Return on Assets, 2001–2017 for Community Banks and Credit Unions, by Type of Institution 
Our econometric analysis found that community bank profitability was higher from 2010 through 2016 than would have been expected based on macroeconomic, local market, and bank characteristics at the time.[95] Specifically, our model found that, on average, community banks’ actual return on assets was 40 basis points higher than our model forecasted given the macroeconomic, local market, and bank characteristics in place during the post-crisis period from 2010 through 2016 and despite any change in the regulatory environment.[96] This effect was most pronounced in 2010 (immediately after the crisis), when the actual return on assets did not dip as low as our model forecasted, and in 2012 and 2013—community banks’ return on assets was 70 basis points higher than would have been expected. From 2014 through 2016, actual return on assets continued to be higher than our model forecasted, but the difference was smaller.
Figure 19: Actual Community Bank Pretax Return on Assets Compared to Returns Expected Based on Macroeconomic, Local Market, and Bank Characteristics, 2003–2016
The difference between actual community bank return on assets and what the model forecasted is attributable to the influence of the “other factors” category, which could include the influence of weaker banks exiting from the population. For example, FDIC reported that from 2009 through 2012 (during and following the crisis), many weaker banks exited, which may have contributed to an upturn in overall community bank profitability.[97] In addition, FDIC found that banks acquired during a merger from 2010 through 2016 had lower profitability than their peers—removing these weaker institutions from the population of community banks could also explain the higher-than-forecasted return on assets.[98] However, the individual influence of the other factors is unknown, which limits our ability to determine the cumulative effect of these other factors on community bank return on assets.
Finally, the influence of changes in the regulatory environment on the number and financial performance of community banks and credit unions is not necessarily an indication of undue burden; such changes could also result in benefits to individual institutions and the overall financial system. A change in a bank's or credit union's behavior may be the appropriate result of the regulators addressing weak business practices, and federal oversight serves, in part, to help ensure that these institutions do not take excessive risks that could undermine their safety and soundness.
Regulators Have Taken Steps to Analyze and Mitigate the Effects of Regulatory Changes on Small Business Lending
In response to the 2007–2009 financial crisis, the financial banking regulators—the Federal Reserve, FDIC, and OCC—have taken various actions to identify and mitigate effects of changes in the regulatory environment on community banks and small business lending. In a policy statement published in February 2010, regulators underscored the importance of ensuring that financial institutions, including community banks, continued to make credit available to small businesses.[99] In particular, the policy stated that supervisory policies or actions should not inadvertently curtail the availability of credit to sound small businesses.[100]
Federal Reserve and FDIC officials told us that to help assess the extent to which credit has continued to reach small businesses following the crisis, they have regularly monitored small business lending trends, including external data sources that assess small business demand for credit. For example, Federal Reserve officials analyzed data published by the National Federation of Independent Business on small business owners' perceptions of credit market conditions.[101] Similarly, FDIC officials told us that to monitor the effect of changes in the regulatory environment on small business lending, FDIC compared community banks' total business loan growth (as a measure of small business lending) to growth in gross domestic product and found that community banks' lending outpaced overall economic output. In addition, in December 2017, the Federal Reserve took steps to help strengthen its ability to monitor small business lending activity through a new quarterly survey of banks.[102] This initiative is designed to collect information on the availability and cost of loans to small businesses, the role of community banks in providing loans to small businesses, and small businesses' access to credit in their local communities.
To complement their data analysis, Federal Reserve and FDIC officials told us they have also gathered information directly from community banks to help identify any potential effects of changes in the regulatory environment on small business lending activities. For example, the Federal Reserve has met twice yearly since 2013 with an advisory council of community bank and other representatives, where they ask for information on changes in the availability of small business loans and the effects of examination practices on access to credit, among other issues.[103] Additionally, in 2017 FDIC issued preliminary results of a survey of banks' small business lending products and processes.[104] According to FDIC officials, this survey was designed to help improve their understanding of the types of small business loans provided by banks, including community banks.
Although OCC officials told us that they have not analyzed the effects of changes in the regulatory environment on community banks' small business lending, they are considering analyzing the cumulative effect of regulatory changes on the overall performance and activities of smaller banks in 2018 or 2019. OCC officials said that the scope and methodology of this study, including the extent to which it will include specific analysis of the effect of regulatory changes on small business lending activities, have not yet been determined.
The Federal Reserve and FDIC have also taken steps to assess the effects of changes in the regulatory environment on the number and performance of community banks. For example, Federal Reserve researchers assessed the effects of regulatory changes on the formation of new community banks and found that the effect was relatively small.[105] In addition, a 2016 FDIC study analyzed the effects of changes in macroeconomic factors relative to core profitability (a measure that includes the regulatory environment) on the overall profitability of community banks and found that macroeconomic shocks, such as unemployment levels and interest rates, explained the majority of the change.[106] A Federal Reserve study and a survey conducted by FDIC also analyzed how changes in the regulatory environment affected community banks' compliance costs, performance, and operations.[107] According to Federal Reserve officials, the results of their study were largely inconclusive. Similarly, FDIC's survey of the factors affecting regulatory compliance costs at nine community banks found that data limitations prevented them from identifying any specific effects.[108]
Banking regulators have also taken steps to try to mitigate potential effects of changes in the regulatory environment on small business lending. For example, to reduce the time and resources community banks use for compliance activities, Federal Reserve, FDIC, and OCC officials said they made changes to the duration of examinations and provided technical assistance related to regulatory compliance and bank management.[109] Community bank representatives and policy and advocacy groups have also suggested that the cost of complying with new capital rules reduced the ability of community banks to lend to small businesses. In response, regulators proposed changes to certain capital rules, adopted in 2013, for institutions with total assets under $1 billion.[110]
Similar to community bank regulators, NCUA has also taken steps to monitor and assess the effects of changes in the regulatory environment on credit unions' activities, including small business lending.[111] According to NCUA officials, they monitor trend data, conduct 3-year rolling reviews of their regulations, and convene special working groups to monitor implementation of new rules.
- Data monitoring. NCUA officials told us that to identify any potential effects of changes in the regulatory environment on credit unions' small business lending, they monitor institutions' small business lending activities.[112] NCUA officials found that credit unions' small business lending has steadily increased since 2001 and was the fastest growing segment of credit unions' loan portfolio.
- Review of regulations. In addition, NCUA conducts an annual retrospective review of its regulations, whereby credit union representatives, other stakeholders, and the public are invited to identify opportunities to reduce the burden of NCUA's regulations.[113] According to NCUA officials, credit union and industry group representatives use this process to help identify unintended consequences of regulatory changes. For example, NCUA's updated small business lending rule went into effect in January 2017, and NCUA officials said they plan to use the annual retrospective review process to identify any unexpected effects on credit unions' small business lending from this change.[114]
- Monitor implementation. Finally, NCUA officials told us that in 2017, following the issuance of NCUA's updated small business lending rule, they created a working group of credit union representatives, state regulators, and NCUA staff to discuss the implementation of the new rule, including how credit unions are adapting to the new requirements. Among other things, the group is intended to increase understanding of supervisory expectations, identify concerns with interpretation and enforcement of the regulation, and identify opportunities to improve NCUA's guidance related to the regulation.
Conclusions
Financial regulation helps ensure the safety and soundness of the financial system but can also have unintended effects. Although recent regulatory changes have generally targeted larger institutions, these changes have the potential to affect community banks' small business lending as well. It is therefore important for regulators to understand how regulation may be affecting community banks and their small business customers. However, the data banks are required to report to regulators do not accurately capture community banks' lending to small businesses because they exclude a portion of these loans and may include loans to large businesses. Federal internal control standards require regulators to obtain relevant and reliable data from external sources. Bank regulators have not reassessed the reporting requirement since 1992 (when it was established as mandated by Congress), but technological changes since then may allow regulators to change the requirement to better reflect lending to small businesses without unduly increasing reporting burdens on banks. Without data that better reflect community banks’ lending to small businesses, regulators and policymakers are limited in their ability to assess the availability of credit to small businesses as Congress envisioned and to understand how regulation may be affecting these institutions.
Agency Comments and Our Evaluation
We provided a draft of this report to the Federal Reserve, BCFP, FDIC, NCUA, OCC, and SBA for review and comment. We received written comments from the Federal Reserve, FDIC, and OCC, which we have reprinted in appendixes V through VII. The Federal Reserve, BCFP, and FDIC also provided technical comments, which we incorporated as appropriate.
In their written comments, the Federal Reserve, FDIC, and OCC agreed with the recommendation made to each regulator to collaborate to reevaluate and modify (as needed) the requirements for the data banks report in the Call Reports to better reflect lending to small businesses. Each agency stated its intent to coordinate through the Federal Financial Institution Examination Council to reassess and potentially modify the reporting requirements. The regulators also noted that in considering revisions to the reporting requirements they would attempt to balance the importance of maximizing information collection with the potential burden changes would place on banks. In addition, OCC noted that any changes to the reporting requirements would be issued for public comment prior to taking effect.
As agreed with your office, unless you publicly announce the contents of this report earlier, we plan no further distribution until 30 days from the report date. At that time, we will send copies to the Federal Reserve, BCFP, FDIC, NCUA, OCC, and SBA, and other interested parties. In addition, this report will be available at no charge on the GAO website at http://www.gao.gov.
If you or your staff have any questions about this report, please contact Lawrance Evans, Jr. at (202) 512-8678 or Oliver Richard at (202) 512-8424. You may also reach us by email at evansl@gao.gov or richardo@gao.gov. Contact points for our Offices of Congressional Relations and Public Affairs may be found at the end of this report. Key contributors to this report are listed in appendix VIII.
Sincerely yours,

Lawrance L. Evans, Jr.
Managing Director
Financial Markets and Community Investment

Oliver Richard
Director, Center for Economics
Applied Research and Methodology
Congressional Addressees
The Honorable Steve Chabot
Chairman
Committee on Small Business
House of Representatives
Appendixes
Appendix I: Objectives, Scope, and Methodology
This report examines the effect of changes in the regulatory environment on community banks and credit unions and their ability to meet the credit needs of small businesses. It examines, for the period from 2010 through 2017, the effect of changes in the regulatory environment, including (1) the data regulators use to measure the volume of small business lending and how and why small business lending volumes changed, (2) how and why small business lending processes changed among these institutions, and (3) how and why the number of institutions and their financial performance changed, as well as (4) actions regulators took to identify and mitigate the effects of changes in the regulatory environment on these institutions and their small business customers.[115]
Data Used for Our Analysis
To address these four objectives, we compiled regulator data on community banks and credit unions from January 2001 through June 2017.
Data on Banks
For this report, we defined community banks using the Federal Deposit Insurance Corporation's (FDIC) definition, which takes into account a bank’s business activities, asset size, office structure, and geographic scope of operations to determine the extent to which it focuses on traditional lending and deposit gathering.[116] Specifically, to identify community banks, FDIC:
- Aggregates all charter-level data reported under each holding company into a single banking organization.
- Excludes any banking organization with (a) no loans or no core deposits; (b) foreign assets greater then or equal to 10 percent of total assets; or (c) more than 50 percent of assets in certain specialty banks, including credit card specialists and industrial loan companies, among others.
- Includes all remaining banking organizations that engage in basic banking activities as measured by a total loans-to-asset ratio greater than 33 percent and a ratio of core deposits to assets greater than 50 percent.
- Includes all remaining banking organizations that operate within a limited geographic scope. This is measured as having: (a) at least one branch and not more than an indexed maximum number of branches (the indexed maximum was 75 branches in 2010), (b) no more than the indexed maximum level of deposits for any one branch (the indexed maximum was $5 billion in 2010), (c) branches in no more than two large metropolitan statistical areas, and (d) branches in no more than three states.
- Includes all banking organizations (even those previously excluded due to limited banking activities or geographic scope) under an indexed maximum asset size threshold (the indexed maximum was $1 billion in 2010).
To identify community banks from 2001 through 2017, we used the community bank indicator in FDIC's Statistics on Depository Institutions and their Historical Community Banking Reference Data.[117] In total, we identified 9,914 unique community banks from the first quarter of 2001 through the second quarter of 2017 for analysis. We assessed the reliability of these data for the purposes of identifying community banks by reviewing relevant documentation; interviewing knowledgeable officials; and electronically testing the data for missing values, outliers, and invalid values, and we found the data to be sufficiently reliable for that purpose.
We subsequently compiled quarterly bank-level data on both community banks and large banks (that is, all banks that were not community banks), including information on their loans and leases, assets, deposits, employment, return on assets, and other characteristics from FDIC's Statistics on Depository Institutions. These data are submitted quarterly by all FDIC-insured banks through the Federal Financial Institution Examination Council's Consolidated Reports of Condition and Income (Call Reports) and, prior to March 2012, from Thrift Financial Reports.[118] We compiled these data for every quarter from the first quarter of 2001 through the second quarter of 2017. We assessed the reliability of these data by reviewing relevant documentation; interviewing knowledgeable officials; and electronically testing the data for missing values, outliers, and invalid values, and we found the data to be sufficiently reliable for the purpose of identifying community banks and constructing indicators associated with compliance costs and business lines for banks.
In addition, we used FDIC's Community Banking Study Structure data to determine, from the first quarter of 2001 through the second quarter of 2017, the number of exits from the pool of community banks each year, the reason for the exit, and, for mergers, whether the acquiring bank was a community bank.[119] We assessed the reliability of these data by reviewing relevant documentation; interviewing knowledgeable officials; and electronically testing the data for missing values, outliers, and invalid values, and we found the data to be sufficiently reliable for the purpose of identifying bank mergers, failures, and other exits.
To identify the number of new community banks formed each year, we used the Board of Governors of the Federal Reserve System's (Federal Reserve) National Information Center Bulk Structure data, which contain a variable indicating the date on which each community bank became active. Specifically, we matched these data with our data set of community banks using the Federal Reserve's identification number for each bank to count the number of new community bank formations in each year.[120] We assessed the reliability of these data by reviewing relevant documentation and electronically testing the data for missing values, outliers, and invalid values, and we found the data to be sufficiently reliable for the purpose of identifying new banks.
To identify the number of bank branches and their locations, we used FDIC's Summary of Deposits data from 2001 through 2017. Banks submit information on each of their branches annually to FDIC. These data are available as of June of each year. For our purposes, we defined a branch as any bank branch or location that accepts deposits. We assessed the reliability of these data by reviewing relevant documentation and electronically testing the data for missing values, outliers, and invalid values, and we found the data to be sufficiently reliable for the purpose of determining the number and location of bank branches.
Finally, we placed community banks into four size categories based on total assets (measured in 2016 dollars) in a given year. We defined micro community banks as having less than $100 million in assets, small community banks as having at least $100 million but less than $300 million in assets, medium community banks as having at least $300 million but less than $1 billion in assets, and large community banks as all community banks having $1 billion or more in assets.
Data on Credit Unions
We also assembled data on credit unions that we obtained from regulators' public websites and directly from the National Credit Union Administration (NCUA). We analyzed small and medium (based on total assets) natural person credit unions and excluded large credit unions from our analysis.[121] To identify large credit unions, we used a methodology similar to that used by FDIC to define community banks.[122] Mirroring FDIC’s approach, we used NCUA Call Report data to determine that the largest 5 percent of credit unions had total assets greater than about $100 million in 1994 and $900 million in 2016. We used these thresholds—$100 million and $900 million—to exclude the largest credit unions in 1994 and 2016, respectively. Moreover, we calculated that growth from $100 million in 1994 to $900 million in 2016 represented an approximately 10.5 percent annual growth rate. To determine which credit unions to exclude in the years from 1994 through 2016, we applied this annual growth rate to our 1994 base of $100 million, which allowed us to calculate asset-size thresholds for 1994 through 2017. To identify the credit unions for our analysis, we applied these asset-size thresholds to all federally, state-, and privately insured credit unions that filed an NCUA Call Report in each quarter from the first quarter of 2001 through the second quarter of 2017. The remaining credit unions included in our population represented approximately 95 percent of all credit unions as of June 2017. To better ensure the validity of this methodology, we shared our approach with officials from NCUA and incorporated their comments into our methodology.
We then compiled quarterly Call Report data on these credit unions' loans and leases, assets, deposits, employment, return on assets, and other characteristics from the first quarter of 2001 through the second quarter of 2017. We assessed the reliability of these data by reviewing relevant documentation; interviewing knowledgeable officials; and electronically testing the data for missing values, outliers, and invalid values. We found the data to be sufficiently reliable for the purpose of identifying small and medium credit unions and constructing indicators of the number of institutions, their lending activities, and financial performance.
To identify the number of new credit unions and credit union mergers, for each year in the period, we obtained data from NCUA. These data identify the name of the new, acquiring, and acquired credit unions and the date the event occurred. We assessed the data for reliability by electronically testing these data for missing values, outliers, and invalid values, and found the data to be sufficiently reliable for the purpose of constructing indicators on credit union mergers and new entrants. Finally, we used the Federal Reserve's National Information Center Bulk Structure data to count the number of credit unions that failed each year.[123] As noted previously, we determined that these data were sufficiently reliable for identifying credit union failures.
Finally, to facilitate our comparison of bank and credit union data across multiple years, we adjusted dollar figures for inflation using the Bureau of Economic Analysis's Gross Domestic Product Implicit Price Deflator. All dollar figures in the report are in 2016 dollars.
Data on Small Business Lending
While conducting our analyses, we found that the reported regulatory measure of community banks' small business lending using bank regulators' data on "loans to small businesses" had limitations for accurately measuring small business lending. For example, the $1 million threshold that defines small business loans and the $500,000 threshold that defines small business farm loans are not indexed to inflation. As a result, the number of loans that fall under these thresholds decreases over time due to inflation alone, regardless of any actual changes in lending levels, which may cause the data to underestimate the volume of small business lending. In addition, these data include small loans to large businesses and exclude larger loans to small businesses, which may result in an over- or underestimation of the volume of small business lending. To further explore the limitations of these data, we reviewed regulator analyses that used these data, including Federal Reserve reports to Congress.[124] We also used the Bureau of Economic Analysis's Implicit Price Deflator to show how the value of the small business loan threshold would have changed over time if it had been indexed to inflation when it was established. Although the data were limited in their ability to measure small business lending, we determined that the data were generally a reliable measure of business loans with original principal balances of $1 million or less.
As we were unable to measure banks' small business lending directly, we identified two additional proxy measures of small business lending (business loans with original principal balances of $1 million or less made by survivor community banks and total business lending) and used these measures together to analyze community banks' small business lending. We identified these alternative measures based on our internal analyses and conversations with bank regulators and believe these are suitable alternative measures of small business lending. Specific information on our methodology follows:
Survivor community banks' business loans of $1 million or less. Our first measure used as its basis the data regulators collected from institutions on small business lending defined as commercial real estate loans and commercial and industrial loans with original principal balances of $1 million or less and farm loans with original principal balances of $500,000 or less, regardless of the size of the borrowing business or farm. These data were available through FDIC's Statistics on Depository Institutions annually (as of the second quarter of each year) from 2001 through 2009, quarterly from 2010 through 2016, semi-annually for banks with less than $1 billion in assets in 2017, and quarterly for banks with $1 billion or more in assets in 2017.[125]
To help ensure that our analysis of trends in Call Report data on business loans of $1 million or less captured lending levels rather than changes in the population of community banks, we adjusted the data regulators collected on small loans to business to account for the effect of exits from the population of community banks.[126] Exits occur due to a community bank becoming a large bank or merging with a large bank, voluntarily exiting the market, or failing during the period we examined. To account for these exits, we identified those banks that were in operation through the entire period from 2001 through June 2017 and were community banks in June 2017, were new entrants during this period and were community banks in June 2017, or merged with another community bank where the merged entity continued to exist until June 2017 and was a community bank at that time. This population is known as "survivor" community banks. To identify these survivor community banks, we first started with the quarterly Statistics on Depository Institutions data for all community and large banks from the first quarter of 2001 through the second quarter of 2017. We then matched these data with FDIC's Community Banking Structure data and (1) eliminated all institutions that exited for some reason other than a merger (such as from a failure, a voluntary exit, or an unexplained exit) and (2) replaced the FDIC identification numbers of institutions that exited due to a merger or consolidation with the identification numbers of their ultimate owner at the end of the study period (the second quarter of 2017). We considered an institution to be a community bank for our entire study period if it or its ultimate owner met FDIC's definition of a community bank in the second quarter of 2017. We then calculated the annual amount of outstanding business loans of $1 million or less for the survivor population of community banks as of the second quarter of each year from 2001 through 2009, the fourth quarter of each year from 2010 through 2016, and the second quarter of 2017 and analyzed changes for these institutions for the periods from 2001 through 2017.[127] To address the potential for survivor bias with this measure, we also analyzed total business lending without adjusting for exits from the population of institutions.
Total business lending. Our second proxy measure of small business lending used data collected from community banks on all commercial real estate, commercial and industrial, and farm loans. These data are collected in the quarterly Call Reports and are available through FDIC's Statistics on Depository Institutions. This alternative measure of small business lending also has limitations. In particular, it overestimates small business lending by community banks by including loans to large businesses. As large businesses are more likely than small businesses to obtain large business loans, the small number of large business loans could be disproportionally represented in data on total business lending by community banks.
Although both of these proxies for measuring community banks' small business lending have limitations, we determined that these data, used in combination, are appropriate measures for providing perspective on community banks' small business lending.
For credit unions, the Call Report definition of a member business loan includes any loan, line of credit, or letter of credit where the proceeds will be used for a commercial, corporate, or agricultural purpose and the net balance is $50,000 or greater. For the purpose of our review, all member business loans made by credit unions are considered small business loans. Because loans for less than $50,000 are not included in this definition of business loans, this approach likely underestimates small business lending by credit unions. Additionally, we analyzed data on Small Business Administration (SBA) section 7(a) loans from 1992 through 2017, which were provided to us by SBA. We assessed the community bank, credit union, and SBA data for reliability by electronically testing these data for missing values, outliers, and invalid values, and we found the data to be sufficiently reliable for the purpose of analyzing community banks' and credit unions' small business lending.
Changes in Community Banks' and Credit Unions' Small Business Lending, Number of Institutions, and Financial Performance
To identify how and why community banks' and credit unions' small business lending, the number of institutions, and financial performance changed from 2001 through 2017, we conducted a literature review; interviewed key stakeholders; analyzed data we compiled on banks and credit unions, including developing and estimating econometric models; and conducted generalizable surveys of community bank and credit union representatives.[128]
Literature Review
We conducted a literature review to identify (1) potential indicators and data sources to analyze and describe the number of community banks and credit unions and these institutions' small business lending and financial performance and (2) analysis, research, and other statements made by researchers, market participants, stakeholders, and agency officials about factors, including the effects of changes in the regulatory environment, which could influence changes in community bank and credit union activities since 2010. To identify existing research, analysis, and statements, we conducted searches of various databases, such as ProQuest, Scopus, Public Affairs Information Service, Policy File, Econlit, and the Harvard Kennedy School's Think Tank and federal agency websites. Our literature review primarily covered sources from 2010 onward. From these sources, we identified studies and articles that appeared in journals or were published by federal agencies, stakeholders, universities, or public policy organizations that were relevant to our research. We performed these searches and identified articles from November 2016 to April 2017. We reviewed the methodologies of these studies and determined that they were sufficiently reliable for identifying indicators and data sources for our analysis and potential explanations for trends in community bank and credit union activities since 2010. We used the results of this literature review to help inform our analysis of trends in community banks' and credit unions' activities, including by identifying data sources and indicators of bank and credit union performance used in these analyses. To supplement our identification of potential indicators and data sources, we also asked regulators (Bureau of Consumer Financial Protection (BCFP), the Federal Reserve, FDIC, NCUA, and the Office of the Comptroller of the Currency (OCC)) and SBA officials about the indicators and data sources they use to monitor the number of institutions and activities of banks and credit unions.
We also used the results of this literature review to develop a list of potential effects of changes in the regulatory environment on community banks and credit unions, including effects on lending products and services (e.g., changes in the time to make loans, the products offered, the cost of these products, the availability of these products to certain types of borrowers); the number of institutions (e.g., decisions to merge, close branch offices, open branch offices); and services provided to customers (e.g., time to serve customers, develop new products and services, innovate). We also used the literature review to identify alternative explanations for changes in the number and activities of community banks and credit unions, such as changes in the economic environment, competition, and technological changes in the industry. To further inform the initial list of potential effects, we also included a question about the effects of changes in the regulatory environment on community banks and credit unions during five focus groups held with community bank and credit union representatives as part of GAO's work on a related engagement assessing which regulations created the most burden for community banks and credit unions.[129]
Interviews
We also conducted semi-structured interviews with a range of market participants and regulators to obtain additional information about the effects of changes in the regulatory environment, as well as other factors that may influence small business lending, the number of community banks and credit unions, and the financial performance of these institutions and to help inform our survey questions. Specifically, we interviewed representatives of 10 community banks and 8 credit unions, selected to include in our sample institutions with a range of asset sizes, geographic locations, and urban and rural locations. We also interviewed representatives of one of the largest U.S. banks (based on total asset size) with significant small business lending. To supplement our interviews with financial institutions, we interviewed representatives of 4 consumer groups and 3 financial services advocacy groups, selected because of their familiarity with community banks and credit unions and changes in the regulatory environment. In addition, we interviewed officials from the Federal Reserve, BCFP, FDIC, NCUA, and OCC. To obtain the perspective of small businesses on changes in the availability and cost of small business credit, we interviewed a judgmentally selected sample of small business advisers from six states' Small Business Development Centers, including at least one state from each of the four Census regions and representatives of six small business advocacy groups.[130] To select small business advocacy groups to interview, we judgmentally chose organizations representing a range of membership types (e.g., start-ups, established businesses, organizations serving minority- or women-owned businesses). Finally, we interviewed SBA officials about changes in the availability of small business lending and the factors that may have affected any changes.
Analysis of Bank and Credit Union Data
In addition, we analyzed trend data on banks' and credit unions' small business lending, the number of these institutions, and their financial performance from 2001 through 2017, and we developed econometric models to describe the extent to which changes in the regulatory environment may have contributed to these trends for community banks.[131] To analyze changes in community banks' small business lending, we analyzed data on their business loans of $1 million or less and total business lending both before and after adjusting for exits. Specifically, for Call Report data on business loans of $1 million or less, we calculated the total number and dollar amount (adjusted for inflation) of community banks' loans as of the second quarter of each year from 2001 through 2009, the fourth quarter of each year from 2010 through 2016, and the second quarter of 2017. We also calculated the amount of business loans of $1 million or less for survivor community banks and by community bank size category. For total business lending, we calculated the dollar amount (adjusted for inflation) of community banks' total business lending both for all community banks and survivor community banks. Finally, for credit unions, we calculated the total number and dollar amount (adjusted for inflation) of small business loans. We then analyzed how these trends changed over the period from 2001 through 2017 (including the changes during the period from 2010 through 2016, which we identified because they represent periods of key changes in the operating and regulatory environment for financial institutions). We also compared community banks' trends in the amount and number of loans to small businesses and amount of all business loans to those of large banks,and compared community banks' amount of loans to small businesses to that of credit unions.[132]
To further analyze the trends in small business lending, we also analyzed the lending of small business loans guaranteed by SBA. Specifically, we calculated the total dollar amount (adjusted for inflation) of SBA-guaranteed loans that community banks disbursed each year from January 1992 through December 2017 using loan-level data provided by SBA. These data contained the FDIC certification number of the lending bank for each bank loan. Using this number, we were able to identify banks and calculate their amount of SBA-guaranteed lending from 1992 through 2017.
To analyze changes in the number of banks and credit unions and the financial performance of banks and credit unions from 2001 through 2017, we compared trends occurring during this period. Specifically, for community banks, large banks, and credit unions, we calculated the percentage change in the number of institutions from 2001 through 2009, and from 2010 through 2017, and compared trends for these two periods and also compared trends between community banks and large banks. To better understand the extent to which institutional growth, mergers, failures, and new entrants contributed to changes in the number of institutions,we counted the number of community bank and credit union exits annually by reason (consolidations, mergers with an existing community bank, mergers with a large bank, failures, and other unexplained exits) and the number of new entrants for the period from 2001 through 2017.[133] We then calculated the percentage change in the number of institutional exits (by exit reason) and entrances for the two periods and compared the results.
To complement our analysis of changes in the number of institutions, we also analyzed changes in the number of bank and credit union branches and their locations. To identify the number of bank branches and their locations, we used FDIC's Summary of Deposits data from 2001 through 2017 to count the number of community and large bank branches in each year. We then compared trends in the number of community bank branches for the periods from 2001 through 2009, and 2010 through 2017. To determine how many counties had no community bank branches in 2010 and 2017, we combined FDIC's data with county-level unemployment data from the Bureau of Labor Statistics for these years, which allowed us to identify all U.S. counties, including those without community bank branches. This allowed us to determine whether the number of counties with no community banks had increased or decreased during this period. We assessed the reliability of these data by reviewing relevant documentation and electronically testing the data for missing values, outliers, and invalid values, and determined they were sufficiently reliable for purposes of counting and identifying the geographic location of community bank offices.
Using FDIC data and MapInfo, we also calculated the percentage changes in the number of community banks in each county between 2010 and 2017 and determined the number and portion of counties that gained community banks, had no change in the number of community banks, declined by no more than 10 percent, declined by more than 10 percent but not more than 25 percent, and declined by more than 25 percent.
For our analysis of community bank branch data, we categorized branches as rural or urban based on their physical addresses in 2010 and 2017 using the Department of Agriculture's Rural-Urban Commuting Area codes. The codes classify all Census tracts in the United States into 10 tiers from rural to urban based on daily commuting patterns, urbanization, and population density. For ease of presentation, we consolidated these 10 tiers into two categories where "rural" consists of loans in large rural towns and small towns and isolated rural areas and "urban" consist of loans in urban and suburban areas. We assessed the reliability of these data by reviewing relevant documentation and electronically testing the data for missing values, outliers, and invalid values, and we found the data to be sufficiently reliable for the purpose of categorizing institutions as urban or rural. We then analyzed how the number and percentage of community bank offices in urban and rural areas changed during this period. To identify the number of credit union offices, we used NCUA's Call Report data to count the number of credit unions in each year from 2012 through 2016, the only years for which reliable data were available.[134] We then analyzed the percentage change in the number of credit union offices during this period. We did not analyze the location of credit union offices because of the limited number of years for which the data were available.
We also analyzed the financial performance of community banks and credit unions by identifying key indicators of financial institution performance and comparing trends in these indicators for the period from 2001 through 2017 (we calculated these indicators as of the fourth quarter of each year from 2001 through 2016 and as of the second quarter of 2017).[135] To identify indicators of financial performance, we used the results of our literature review (described previously) to identify indicators used by researchers, market participants, and other stakeholders to describe the financial performance of community banks and credit unions. We also considered indicators used in our prior work analyzing the financial performance of community banks and credit unions.[136] We selected indicators for analysis that provided information on key community bank and credit union performance measures that our literature review and interviews with stakeholders identified as potentially affected by changes in the regulatory environment or other changes following the crisis. For example, in response to changes in the regulatory environment, community banks and credit unions may have hired additional staff or outside counsel or consultants, invested in new software, or taken other actions that may have increased the number of employees and the cost of resources and also, potentially, decreased institutions' profits and performance. To measure these changes, we selected indicators of the market shares of financial institution activities (including total assets, deposits, and loans and leases); cost of resources (using the median ratio of noninterest expenses to assets); employment (using the median number of employees per $1 million assets); profitability (measured by the median pretax return on assets); and institutional efficiency (measured as the median proportion of net operating expenses that are absorbed by overhead expenses).[137] We then analyzed how these indicators changed over the period from 2001 through 2017.
Finally, to help determine the extent to which changes in the regulatory environment may have affected changes in community banks' small business lending, the number of institutions, and their financial performance, we constructed econometric models. These models considered the extent to which macroeconomic, local market, and bank characteristics or other factors (including changes in the regulatory environment, demand for small business loans, and technological changes) affected changes in community bank small business lending; merger activities; new bank formation; and return on assets. For more information about our econometric modeling, including model specifications, data sources, and results, see appendix II.
National Survey of Community Banks and Credit Unions
To obtain information on the changes community banks and credit unions made to their small business and residential mortgage lending products and management activities since the 2007–2009 financial crisis and the factors that influenced those changes, we administered web-based surveys to nationally representative samples of community bank and credit union chief executive officers.
Community Bank Survey. We administered our community bank survey to a generalizable sample of 466 community bank chief executive officers from July 10, 2017, to August 25, 2017. We used publicly available FDIC Call Report data to build our population frame. We then stratified by three different asset size categories and a two-level urban/rural categorization. This resulted in 6 sampling strata. We then sorted the banks geographically by Census division within each stratum and selected a systematic random sample within each stratum to ensure that our selection of banks was geographically representative. The asset size categories we used were small (less than $100 million in total assets), medium (between $100 million and $300 million in total assets), and large (more than $300 million in total assets). To designate community banks as urban or rural, we used Rural-Urban Commuting Area codes. We excluded community banks without Rural-Urban Commuting Area codes and community banks that conducted no business lending in 2016 from our sample. FDIC provided contact information for selected community banks so that we could request their participation in our survey.
We allocated sufficient sample size to the 6 strata to support estimation for an attribute measure with a margin of error no greater than plus or minus 10 percentage points at the 95 percent level of confidence for small, medium, large, urban, and rural banks. We then adjusted the initial stratum sample size allocations upward further for an assumed response rate of 60 percent. Our original sample size was 474; however, 6 banks had gone out of business or been acquired between the time the 2016 FDIC Call Reports were filed and when we contacted FDIC for the bank representative information and, in their survey responses, an additional 2 banks indicated that they had not originated any small business or residential mortgage loans since 2010. We treated these 8 banks as out-of-scope. In addition, 19 of the banks selected in our sample had already been selected to receive a survey for another GAO engagement running concurrently with ours. These 19 banks were not contacted as part of our survey to minimize respondent burden and subsequently were treated as nonrespondents for this survey. Our community bank survey had a weighted response rate of 68 percent. Because our survey instrument subdivided respondents into banks that answered "increased," "decreased," or "no change" to top-level check questions, we were not able to report survey results by all subpopulations. For information on the specific questions asked in the survey, see appendix III.
Credit Union Survey. We administered our credit union survey to a generalizable sample of 470 credit union chief executive officers from July 17, 2017, to August 25, 2017. We built our population frame from publicly available NCUA Call Report data. We stratified the credit unions that engaged in both business and residential mortgage lending in the first quarter of 2016 by two asset size categories and a two-level urban/rural categorization. This resulted in four strata. We then placed all credit unions that engaged in residential mortgage lending only in the first quarter of 2016 into a fifth stratum. We then sorted the credit unions geographically by Census division within each stratum and selected a systematic random sample within each stratum to ensure that our selection of credit unions was geographically representative. We used this stratified design to ensure that we would be able to collect information on residential mortgage lending as well as small business lending by credit unions. Given that credit unions are generally smaller institutions than community banks, the asset size categories we used to stratify the credit union sample were smaller than the categories we used to stratify the community bank sample. Specifically, the two asset size categories we used were small (less than $50 million in total assets) and large (more than $50 million in total assets). We also used Rural-Urban Commuting Area codes to designate credit unions as urban or rural. We excluded credit unions without Rural-Urban Commuting Area codes and credit unions that conducted no business or residential mortgage lending in the first quarter of 2016 from our sample. NCUA provided contact information for the selected credit unions so that we could request their participation in our survey.
We allocated sufficient sample size to the five strata to support estimation for an attribute measure with a margin of error no greater than plus or minus 10 percentage points at the 95 percent level of confidence for small, large, urban, and rural credit unions and credit unions that conducted only residential mortgage lending. We then adjusted the initial stratum sample size allocations upward further for an assumed response rate of 60 percent. Our original sample size was 513; however, 8 credit unions had gone out of business or been acquired between the time the 2016 NCUA Call Reports were filed and when the sample was fielded. We treated these 8 credit unions as out-of-scope. Finally, 35 credit unions indicated on the survey that they had not originated a small business loan or a residential loan since 2010. We treated these 35 credit unions as out-of-scope. Our credit union survey had a weighted response rate of 61 percent. Because our survey instrument subdivided respondents into credit unions that answered "increased," "decreased," or "no change" to top-level check questions, we were not able to report survey results by all subpopulations. For information on the specific questions asked in the survey, see appendix IV.
Both surveys included questions on small business lending activities, management decisions, and residential mortgage lending. Aside from some terminology, the survey questions were identical and included both multiple choice and open-ended questions.[138] To develop the survey questions, we considered information obtained from interviews and focus groups with community banks, credit unions, industry groups, and regulators; a literature review; a review of topical congressional hearings; and a review of regulators' strategic plans since 2010. To ensure that our questions were relevant and reasonable and that survey respondents could provide reliable and valid responses, we conducted pretests of both surveys with four banks and three credit unions. Our survey expert also reviewed both instruments and provided feedback. To encourage participation, we conducted follow-up efforts, including multiple email and phone call reminders, throughout the survey period. These reminders allowed us to encourage respondents to complete the survey and provide support in accessing the survey questionnaire.
To analyze the results of each survey, we examined responses to multiple choice and open-ended questions separately. For multiple choice questions, we constructed 95 percent confidence intervals around each estimate and examined the extent to which institutions cited a variety of factors, including the regulatory environment, as having contributed to changes in their small business lending, residential mortgage lending, and overall management. For open-ended questions, we categorized written comments by the topic(s) they addressed and examined which topics institutions addressed most frequently in their comments. For the community bank survey results, see appendix III. For the credit union survey results, see appendix IV.
Because we followed a probability procedure based on random selections, our sample is only one of a large number of samples that we might have drawn. Since each sample could have provided different estimates, we express our confidence in the precision of our particular sample's results as a 95 percent confidence interval (for example, plus or minus 7 percentage points). This is the interval that would contain the actual population value for 95 percent of the samples we could have drawn. Confidence intervals are provided along with each sample estimate in the report. All survey results presented in the report are generalizeable to the respective population of in-scope community financial institutions, except where otherwise noted.
In addition to the reported sampling errors, the practical difficulties of conducting any survey may introduce other types of errors, commonly referred to as nonsampling errors. For example, differences in how a particular question is interpreted, the sources of information available to respondents, or the types of people who do not respond can introduce unwanted variability into the survey results. We included steps in both the data collection and data analysis stages for the purpose of minimizing such nonsampling errors.
Regulators' Identification of the Effects of Changes in the Regulatory Environment and Mitigating Steps
To evaluate the extent to which regulators took steps to identify and address any effects of changes in the regulatory environment on community banks and credit unions, we reviewed regulators' collection and analysis of information on any effects and the steps they took to mitigate any effects. We then compared these actions with standards for using quality information to inform decision making.[139] To identify actions regulators took to assess the effects of changes in the regulatory environment on community banks and credit unions, we collected and reviewed regulators' research on effects; reviewed documentation of regulators' outreach activities with institutional representatives and other stakeholders; and interviewed regulators, community bank and credit union representatives, and other stakeholders. To identify regulators' research, we conducted a literature review to identify works published by regulators from 2010 through 2017 that assessed trends in the number of institutions, their financial performance, and their small business lending products and processes. To identify existing research, we conducted searches of the ProQuest database. We supplemented our search with a review of regulators' websites and confirmed our list of research papers with regulators. We then reviewed each research paper to assess the extent to which they evaluated trends in the number of institutions (e.g., decisions about acquiring or being acquired, branch closure or opening, changes in staff time and activities, profits); their financial performance; or institutions' lending activities (e.g., changes in the time period to make loans, number of lending products and services offered, minimum credit quality criteria, borrower documentation requirements, access to credit for certain types of borrowers) and the extent to which regulators considered the effects of changes in the regulatory environment as a factor affecting those trends.
To identify actions regulators took to collect and analyze information from community bank and credit union representatives and other stakeholders, we reviewed regulators' websites and interviewed regulators about efforts to collect information, including the extent to which they collected information on effects as part of the examination process. We analyzed (where available) the agendas, transcripts, and notes from outreach meetings with institutional representatives and other stakeholders to assess the extent to which regulators asked about the effects of changes in the regulatory environment on community banks' and credit unions' management decisions and lending activities and the extent to which participants highlighted challenges. Specifically, we analyzed documents associated with the Federal Reserve's Community Depository Institutions Advisory Council and FDIC's Advisory Committee on Community Banking; regulators' outreach meetings with industry representatives, including the Federal Reserve's, FDIC's, and OCC's Economic Growth and Regulatory Paperwork Reduction Act outreach meetings (the process used input from the public to identify ways to reduce regulatory burden on institutions); and the 2012–2016 comment letters NCUA received as part of its annual regulatory review process. For each of these documents, we used a data collection instrument to assess the extent to which regulators explicitly asked about the effects of changes in the regulatory environment on their activities and the extent to which participants or letter writers identified specific effects on institutions' management activities, financial performance, or lending activities.
To complement these reviews, we also interviewed institutional representatives and regulators. Specifically, we interviewed 10 community bank and 8 credit union representatives and asked about the extent to which regulators asked about any effects of changes in the regulatory environment on the number of institutions, their performance, and their small-business lending activities. As noted previously, these institutional representatives were selected to provide a mix of institutions of various size (based on total asset size) and geographic locations (both urban and rural and throughout the United States). We also interviewed Federal Reserve, FDIC, NCUA, and OCC officials about their efforts to identify any effects of changes in the regulatory environment on community banks and credit unions. Finally, we interviewed officials from BCFP and SBA about their efforts to identify and analyze any effects of changes in the regulatory environment, including BCFP's changes to rules governing residential mortgage lending, on the number and financial performance of community banks and credit unions and their small business lending.
To assess the extent to which regulators took steps to mitigate any effects from changes in the regulatory environment on community banks and credit unions, we interviewed regulators about the steps they took and reviewed related documentation. Specifically, we asked regulators to provide information and documentation of actions they took in response to concerns raised by institutions and their customers about the effects of changes in the regulatory environment, including the elimination of certain lending products or services and decreased staff time to engage with customers. We reviewed regulators' documents, such as notifications of policy change, to assess the extent to which regulators identified the effect of changes in the regulatory environment as motivating the adjustment to policies or processes.
We conducted this performance audit from November 2016 to August 2018 in accordance with generally acceptable government auditing standards. Those standards require that we plan and perform the audit to obtain sufficient, appropriate evidence to provide a reasonable basis for our findings and conclusions based on our audit objectives. We believe that the evidence obtained provides a reasonable basis for our findings and conclusions based on our audit objectives.
Appendix II: Description of GAO's Econometric Models of Factors Affecting Community Bank Outcomes since 2010
Introduction
The regulatory environment of banks has changed since the 2007–2009 financial crisis as Congress enacted new legislation and regulators have implemented additional regulatory requirements. In particular, the Dodd-Frank Wall Street Reform and Consumer Protection Act (Dodd-Frank Act) imposed new requirements on banks of all sizes, and although these requirements were directed primarily at large banks, questions exist over the extent to which this act and regulations implemented since then, such as new capital requirements, have affected community banks.[140] This appendix provides detail on our analysis of the effects of changes in the regulatory environment since 2010 on various community bank outcomes, specifically mergers, formation of new institutions or charters, small business lending, and pretax return on assets.[141]
It is generally difficult to determine the effects of changes in the regulatory environment on community banking outcomes for a number of reasons. First, the regulatory environment comprises changes in laws and their implementation, enforcement by supervisory agencies, and regulatory uncertainty on the part of community banks in the aftermath of the financial crisis. Second, apart from the financial crisis, concurrent events that could confound the effects of changes in the regulatory environment include changes in risk aversion on the part of community banks pertaining to credit, changes in technology such as innovations in online banking, and competition from alternative or nonbank lenders. Third, the ability to credibly identify the cumulative effect of regulation is limited by the data and available estimation methodologies.
Although it is difficult to determine a direct link between changes in the regulatory environment and subsequent community banking outcomes, regulations could impose compliance costs if they increase regulatory reporting and compliance requirements and likely reduce the profitability of community banks. We reported in 2012 that, although the Dodd-Frank Act reforms are directed primarily at large, complex U.S. financial institutions, regulators, industry officials, and others collectively identified provisions within the act that they expected to have both positive and negative effects on community banks.[142] At the same time, it is difficult to know for sure which provisions would affect community banks because the outcome would depend largely on how agencies have implemented certain provisions through their rules.[143] Furthermore, not all of the rules had been finalized at the time of our review, and others had probably not had sufficient time to materially influence bank activity.[144]
GAO's Econometric Models of Community Bank Outcomes
We used econometric models to examine, to the extent possible, potential effects of changes in the regulatory environment on community bank outcomes from 2010 through 2016, the period when the Dodd-Frank Act was enacted and other regulatory and supervisory changes were made. Because it is difficult to directly estimate the cumulative effects of changes in the regulatory environment on community banking outcomes, we focused on the role of nonregulatory factors (such as macroeconomic, local market, and bank characteristics) and inferred from that the potential role of regulations.
Description of Estimation Methodology
Our approach was developed under the premise that it is difficult to measure directly the cumulative effect of the regulatory environment. We developed econometric models to better understand the extent to which community bank outcomes (such as mergers, new bank formations, small business lending, and return on assets) could potentially be attributable to changes in the regulatory environment since 2010. Because measuring the cumulative effect of changes in the regulatory environment is difficult, we used a two-step approach that did not require us to estimate regulatory effects directly.
- First, we estimated models that used data on macroeconomic, local market conditions (consisting of local market demographics and local market competition), and bank characteristics, which represent factors that we could measure, prior to 2010 (from 2003 through 2009) to help forecast community bank outcomes from 2010 to 2016; that is, we forecasted the counterfactuals since 2010 based on the regression models in the absence of all the factors not included in the model ("other factors") that include the effects of the regulatory environment.
- Second, by comparing the actual outcomes that occurred during the period to the outcomes forecasted by the models, we drew conclusions about the influence of other factors that represent the difference between the actual and forecasted outcomes.[145] These other factors represent the combined effect of all the variables that we did not include in our model and would include changes in the regulatory environment since 2010, and depending on the model, factors such as demand for small business loans, credit standards applied by banks, innovations in online banking and competition from nonbank lenders, technological changes, and scale economies.[146]
In addition to the limitations of the models mentioned earlier, it is implicit in our approach that the preferences of the marketplace participants did not generally change between the two periods. More important, we could not determine the contribution of the regulatory environment that would be part of the other factors. We acknowledge this study's inherent weaknesses with respect to these aspects.
General Structure of Models Used
Following the existing literature, we hypothesized that the factors that could affect community bank outcomes and that we could adequately measure are macroeconomic conditions (MACRO), local market demographics (LDEMOG), local market competition (LCOMP), and community bank characteristics (BANKCHAR). In general, all these factors are intended to capture the role of nonregulatory factors.[147] The general specification of the models we used is as follows:
Y imt = B0 + MACRO t B1 + LDEMOG mt B2 + LCOMP mt B3 + BANKCHAR it B4 + e imt .
Y is the dependent variable representing the community bank outcome. It represents outcomes or trends of community bank (i) in market (m) in year (t). The parameters to be estimated are represented by the Bs (where B 0 is the constant term), and “e” is the regression error term.
The community banks are identified based on the Federal Deposit Insurance Corporation's (FDIC) methodology (see app. I).[148] We defined a local market to be a metropolitan statistical area (MSA) or a non-MSA county for an area that is not part of an MSA. All the variables were measured on an annual basis, and dollar values are in billions (unless indicated otherwise) and in 2016 dollars. We developed models for four community bank outcomes.
Mergers Model
We modeled whether a community bank (i) was acquired by another bank (community bank or large bank) in year (t).[149] The data are bank-year observations that equal 1 if a community bank was acquired and 0 if not acquired. The likelihood of a merger acquisition depends generally on the difference in perceived postmerger valuation of the target community bank between the acquirer community bank or large bank and the target community bank. Thus, factors affecting the current performance of the target community bank are important.[150] We identified two groups of community banks: those that were acquired (treatment banks) and those that were not acquired (control banks) during the sample period. We used matched pairs data where the control banks were randomly selected to match the number of treatment banks for each year. The explanatory variables are 1-year lags prior to the merger years because of potential endogeneity concerns and data limitation.[151] We estimated the model using a logistic regression technique.
New Bank Formations Model
We modeled whether new community banks were formed in market (m) in year (t).[152] The data are market-year observations that equal 1 if a market had new community banks formed and 0 if no new community banks were formed. The likelihood of new bank formation in a market generally depends on factors affecting the new bank’s expected profits upon entry, which would depend on local market conditions, including competition.[153] We identified two groups of markets: those where a new community bank was formed (treatment markets) and those where no new community banks were formed (control markets) during the sample period. We used matched pairs data where the control markets were randomly selected to match the number of treatment markets for each year. The explanatory variables are the average of the 2 years prior to the new bank formation because of potential endogeneity concerns and data limitation.[154] We estimated the model using a logistic regression technique.
Small Business Lending Model
We modeled small business lending by a community bank (i) in year (t). Small business loans are proxied by loans of $1 million or less at origination for commercial and industrial loans and for commercial real estate loans, and $500,000 or less at origination for farm loans (i.e., agricultural farmland or production finance loans). Small business lending by community banks tended to fall over time due to exits from failures or when a community bank becomes a large bank through growth or a merger, it does not capture lending to small businesses of loans over $1 million, and the thresholds as reported in the Call Reports are not adjusted for inflation. We therefore modeled loans within the threshold made by "survivor" community banks—community banks that existed or formed since 2001 and remained in existence through 2017, and we excluded banks that exited the population of community banks at any time from 2001 through 2017. We also modeled total business loans by community banks, which are not subject to the potential bias due to lack of inflation-adjustment of the threshold but have other limitations discussed in the body of this report. The volume of lending by community banks depends generally on factors affecting the supply of and demand for loans by businesses.[155] We estimated the models using an unbalanced panel consisting of data on bank-market-year observations. The explanatory variables are 1-year lags because of potential endogeneity concerns and data limitation.[156] We estimated the models using an ordinary least square regression technique.
Pretax Return on Assets Model
We modeled pretax return on assets of community bank (i) in year (t). It is the annualized pretax net income as a percentage of total assets. The profitability of community banks depends generally on macroeconomic conditions and structural factors such as business practices and competitive environment.[157] We estimated the models using an unbalanced panel consisting of data on bank-market-year observations. The explanatory variables are 1-year lags because of potential endogeneity concerns. We estimated the model using an ordinary least square regression technique.
List of Explanatory Variables Used
The list of the explanatory variables we used in the models is provided below.
The macroeconomic (MACRO) factors consist of the following variables:
- Federal funds rate: the effective federal funds rate (percent).
- Rate spread: the difference between the 10-year and 1-year Treasury notes (percent).
- Gross state product growth rate: percentage change in gross state product (percent).
The local market (LDEMOG) factors consist of the following variables: [158]
- Market size: the market in which a community bank operates is assigned to one of four categories based on the total assets of all the community banks in that market—1st (1), 2nd (2), 3rd (3), and 4th (4) quartiles (indicators).
- MSA markets: equals one for counties in MSAs and equals zero for non-MSA counties (an indicator).
- Income per capita growth rate in the market: percentage change in per capita income (ratio of personal income to population).
- Unemployment rate in the market (percent).
- Population growth rate in the market: percentage change in population.
- Population density in the market: ratio of population to land area (population per square mile).
- House price percentage change in the market: percentage change in house price index.
The local market competition (LCOMP) factors consist of the following variables:
- Market concentration of bank deposits: Herfindahl-Hirschman Index of market concentration of bank deposits.
- Market concentration of bank branches: Herfindahl-Hirschman Index of market concentration of bank branches.
- Credit union assets: credit unions' total market assets (in logs).
- Number of credit unions in the market.
The bank characteristics (BANKCHAR) consist of the following variables:[159]
- Community bank size: each bank is assigned to one of four categories based on the bank's total assets size—micro (less than $100 million), small (equal to or greater than $100 million and less than $300 million), medium (equal to or greater than $300 million and less than $1 billion), and large (equal to or greater than $1 billion), (indicators).
- Total equity capital: equity capital (percent of total assets).
- Nonperforming assets: net charge-offs (percent of total loans and leases).
- Core deposits: core or retail deposits (percent of total assets).
- Brokered deposits: brokered deposits (percent of total assets).
- Current loans: loans that are less than 90 days past due or accruing interest (percent of total loans and leases).
- Other real estate owned (REO) assets: other REO assets (percent of total assets).
- Loan concentration in residential real estate: residential, 1-4 family, real estate loans (percent of total assets).
- Geographic diversification: equals one if community bank has branches in multiple states and equals zero otherwise (an indicator).
- Subchapter S corporation (indicator): equals one if community bank is a subchapter S corporation and equals zero otherwise (an indicator).
Results of Analysis of Community Bank Outcomes
We analyzed community bank outcomes for mergers, new bank formations, small business lending, and pretax return on assets from 2010 through 2016. The analysis examined the relative contributions of nonregulatory factors—represented by macroeconomic conditions, local market conditions (consisting of local market demographics and local market competition), and bank characteristics—and all the factors not included in the models (other factors), which would include changes in the regulatory environment, to the community bank outcomes. We estimated our regression models using data from 2003 through 2009, the period before the post 2010 regulatory changes. Using the regression estimates from the model and the data for the factors that we were able to include in our models we forecasted community bank outcomes from 2010 through 2016. Our analysis indicated that for all the models the actual outcomes were within the 95 percent prediction intervals we constructed for the forecasted outcomes, except for 1 year in the mergers model and for 2 years in the return on assets model. This suggests that the net effect of factors that we included (i.e., macroeconomic, local market, bank characteristics) on community bank outcomes may not have fundamentally changed from the 2003–2009 period to the 2010–2016 period, and the effect of other factors that we did not include, such as the regulatory changes, on community bank outcomes were likely small over the 2010-2016 period.[160] It is important to note, our forecast of the influence of the other factors is combined and we could not decompose it to determine the cumulative effects of the changes in the regulatory environment since 2010.
Mergers
As shown in figure 20, our model forecasted that the contribution of the other factors to acquisition of community banks ranged between 6 percent and 31 percent from 2010 through 2016, implying that macroeconomic, local market, and bank characteristics explain most (that is, 69 to 94 percent) of the mergers for this period. Our analysis indicates that the actual number of mergers was higher than forecasted by the macroeconomic, local market, and bank characteristics, and this higher number is attributable to the effects of other factors. The other factors could include regulatory changes since 2010, as well as factors such as the availability of failed banks that attracted banks seeking to grow, the opportunity to expand in their existing markets or enter new markets, and incentives to achieve scale economies to lower costs of increased regulatory compliance. New regulations required by the Dodd-Frank Act entail significant compliance costs for banks above the $10 billion asset threshold and could have made banks approaching or just above the threshold more likely to engage in acquisitions to reduce such costs.[161] The individual contributions of these other factors is unknown, which limits our ability to determine the cumulative effects of changes in the regulatory environment on the acquisitions of community banks.
Figure 20: Actual Number of Community Bank Mergers Compared to Number Expected Based on Macroeconomic, Local Market, and Bank Characteristics, 2003–2016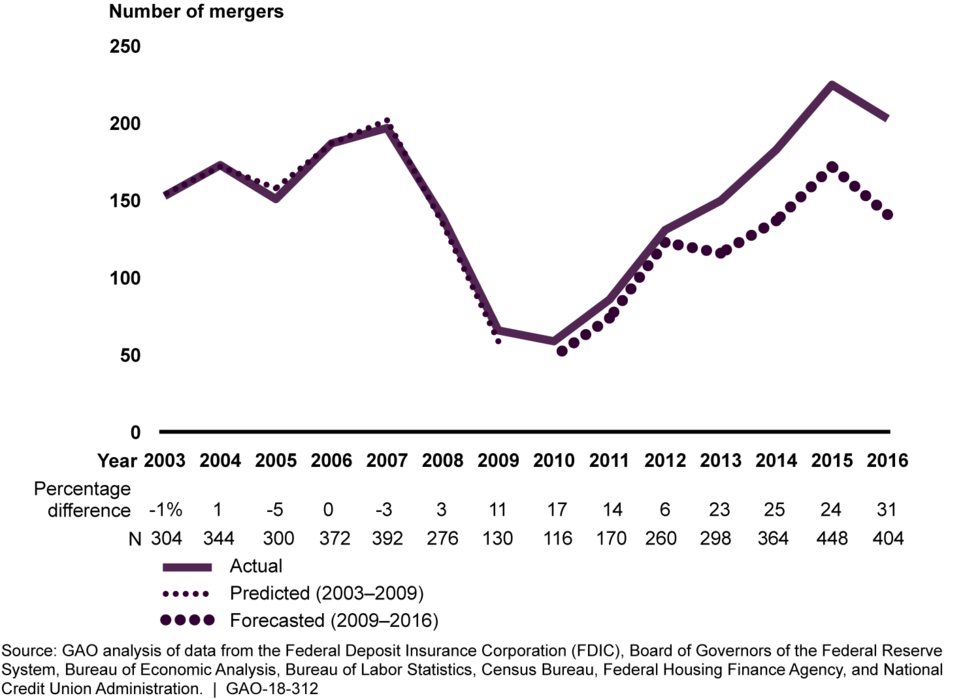
New Bank Formations
Although our model forecasted relatively few new community bank formations from 2010 through 2016, not exceeding 3 in any year, based on macroeconomic and local market conditions, the actual number of new community bank formations was only slightly higher, meaning that the difference that is attributable to the effects of other factors is small.[162] Furthermore, our model forecasted the sharp decline in the number of new community banks from 2010 through 2016, meaning that macroeconomic and local market conditions explained the majority of the decline in new bank formations.[163] Nonetheless, the other factors, which include regulatory changes since 2010, might have played a limited role. In particular, from 2009 through 2016, FDIC increased the required de novo period for newly organized, state nonmember institutions from 3 years to 7 years, which means new banks seeking deposit insurance are subject to a longer probationary period of examinations, capital requirements, and other requirements. Also, the low number of new bank formations from 2010 through 2016 could be because it was cheaper to buy a failed bank that had an existing charter than obtain a new charter for a bank. Again, the individual contributions of these other factors is unknown, which limits our ability to determine the cumulative effects of changes in the regulatory environment on the new community bank formations.
Figure 21: Actual Number of Markets with New Community Bank Formations Compared to Number Expected Based on Macroeconomic and Local Market Characteristics, 2003–2016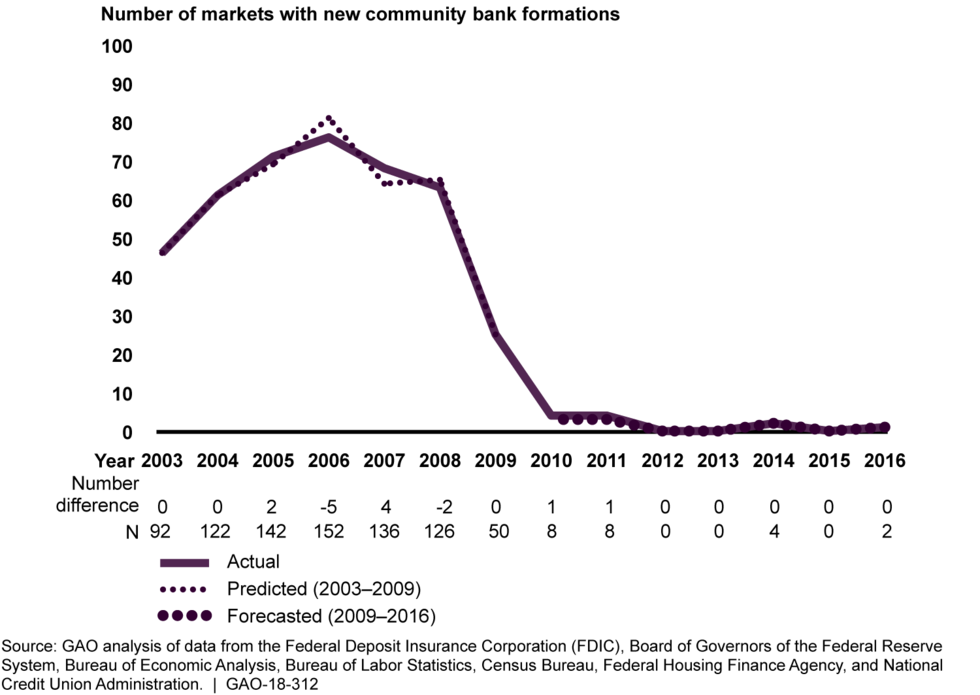
Small Business Lending
As shown in figure 22 (left panel), our model forecasted that the contribution of the other factors to total small business loans held by community banks was 11 percent or less from 2010 through 2016, implying that macroeconomic conditions, local market, and bank characteristics explain most of total small business loans held by community banks for this period, using data for "survivor" community banks—community banks that existed or formed since 2001 and remained in existence through 2017, excluding banks that exited the population of community banks at any time from 2001 through 2017.[164] Our analysis indicates that total small business loans were generally lower from 2010 through 2014 but higher in 2015 and 2016 than forecasted by the macroeconomic, local market, and bank characteristics, and the difference is attributable to the effects of other factors. The other factors could include regulatory changes since 2010, as well as factors such as low demand for small business loans, innovations in online banking and competition from nonbank lenders, technological changes, and tightened credit standards in the aftermath of the financial crisis, which more likely affected smaller loans. The right panel of figure 22 shows our results for total business lending, which includes loans over the small business loan threshold that are excluded from the left panel of figure 22. Our analysis indicates that total business loans were higher than forecasted by the macroeconomic, local market, and bank characteristics and the higher amount of loans is attributable to the effects of other factors, which is 23 percent or less. The difference between the results for the small business loans under the survivor community banks model and the total business loans model is likely because the small business loans model includes only loans under the $1 million threshold while the total business loans model includes loans of all sizes.[165] A possible reason is that after a merger (especially when a large bank acquired a small bank) the merged bank's small business lending would likely exceed the premerger lending of both the acquirer and the target resulting in more business lending postmerger.[166] The individual contributions of the other factors is unknown, which limits our ability to determine the cumulative effects of changes in the regulatory environment on business lending by community banks.
Figure 22: Actual Outstanding Amounts of Survivor Community Banks' Business Loans with Original Principal Balances of $1 Million or Less and All Community Banks' Total Business Loans Compared to Amounts Expected Based on Macroeconomic, Local Market, and Bank Characteristics, 2003–2016
Pretax Return on Assets
As shown in figure 23, the actual return on assets was higher than our model forecasted.[167] Our model forecasted that the contribution of the other factors to the pretax return on assets of community banks increased from 50 basis points to 70 basis points from 2010 through 2013, and fell below 50 basis points from 2014 through 2016. The other factors could include regulatory changes since 2010, the subsequent failure of numerous banks from 2009 through 2012 that eliminated many underperforming community banks with low pretax return on assets, and increased competition from other lenders that improved the performance of bank operations over time. The individual contributions of these other factors is unknown, which limits our ability to determine the cumulative effects of changes in the regulatory environment on the pretax return on assets of community banks.
Figure 23: Actual Community Bank Return on Assets Compared to Returns Expected Based on Macroeconomic, Local Market, and Bank Characteristics, 2003–2016
Regression Estimates of Community Bank Outcomes
The regression estimates using data from 2003 through 2009 are provided in tables 6 and 7. All the estimated models are highly significant based on the p-values of the tests of the models. We performed several robustness checks of the models, including using different sample data and estimation techniques. We obtained results similar to those we have reported.[168]
Mergers: In table 6, the regression estimates, which used data from 2003 through 2009 to obtain counterfactual of the effects of macroeconomic, local market, and bank characteristics from 2010 through 2016 in the absence of the other factors, indicate that several factors were associated with an increased likelihood of a community bank being acquired. These acquired community banks had lower equity capital and higher nonperforming assets, suggesting they were more likely to be underperforming. Also, the acquired community banks had lower core deposits but higher brokered deposits (which suggests a lower proportion of funding from stable sources), were the smallest community banks, or were more likely to operate in multiple states but not likely to be subchapter S corporations. The acquisitions were also more likely to be in markets with higher unemployment, higher population growth, faster house price growth, and in MSA markets.[169]
Notes: In this report, we define community bank using FDIC's definition, which takes into account institutions' assets, foreign interests, specializations, and geographic characteristics. Community banks include banks with up to $39.5 billion in assets in 2017. Community bank size (micro) is the omitted category for the community bank size variables. Market size (1st quartile) is the omitted category for the market size variable.
aThe reported coefficients are odds ratios and robust standard errors are in parentheses. ***, **, and * represents coefficients that are statistically significant at 1 percent, 5 percent, or 10 percent or less, respectively. We could not use fixed-effects estimation because the banks and markets predicted the outcomes perfectly, respectively; however, we randomly selected control banks or markets to match the treatments to help minimize any potential bias in the selection of the controls. For both the mergers and new bank formations models, we also estimated the effects of only macroeconomic factors and local market demographics because local market competition and bank characteristics could be affected by regulatory changes. We obtained similar results.
bMergers model: The mergers model is for community banks that are acquired (equals 1) and community banks that are not acquired (equals 0) in a year. The model used a random sample of nonacquired community banks as controls to match the number of acquired community banks for each year to create matched pairs of bank-year observations. We also estimated the model by market-year observations, and obtained similar results.
cNew bank formations model: The new bank formations model is for markets where any number of new community banks are formed (equals 1) and markets with no new community banks formed (equals 0) in a year. The model used a random sample of markets with no new community banks formed as controls to match the number of markets where new community banks were formed for each year to create matched pairs of market-year observations. We also estimated the model using an ordered logistic technique—we obtained results for the markets where only one new community bank was formed, which represented 75 percent of the markets with new community bank formations. We obtained similar results. Although the ordered logistic estimation imposed the assumption of proportional odds, we could not relax this assumption using a generalized ordered logistic estimation because the estimation did not converge.
New bank formations: In table 6, the regression estimates, which used data from 2003 through 2009 to obtain counterfactual of the effects of macroeconomic and local market characteristics from 2010 through 2016 in the absence of the other factors, indicate that several factors were associated with an increased likelihood of new community bank formation in markets. They include markets with a high presence of credit unions. New bank formations were more likely in MSA areas and markets with high population growth. Also new bank formations were more likely when interest rates and the rate spread were high.[170]
Lending: In table 7, the regression estimates, which used data from 2003 through 2009 to obtain counterfactual of the effects of macroeconomic, local market, and bank characteristics from 2010 to 2016 in the absence of the other factors, indicate that several community bank characteristics were associated with small business lending. Lending was higher for community banks with lower equity capital, higher current loans, lower nonperforming loans, lower core deposits but higher brokered deposits, lower concentration of residential loans, geographically diversified banks with branches in multiple states, and larger banks. Also, lending was higher in markets with higher personal income growth and lower house prices, in states with lower economic growth, when interest rates were lower, and when the rate spread was smaller. In general, the direction of the effects is similar for total business lending, but with slightly larger impacts.[171]
Notes: In this report, we define community bank using FDIC's definition, which takes into account institutions' assets, foreign interests, specializations, and geographic characteristics. Community banks include banks with up to $39.5 billion in assets in 2017. Community bank size (micro) is the omitted category for the community bank size variables.
aThe reported coefficients are marginal effects and the robust standard errors are in parentheses. ***, **, and * represent coefficients that are statistically significant at 1 percent, 5 percent, or 10 percent or less, respectively. We used bank and market fixed-effects estimation to control for possible unobserved heterogeneity across the banks and markets. For the small business lending and return on assets models, we also estimated the effects of only macroeconomic factors and local market demographics because local market competition and bank characteristics could be affected by regulatory changes. We obtained similar results.
bSmall business lending model: The small business model is for total loans (in billions of 2016 dollars) with origination amounts of $1 million or less for commercial and industrial loans or commercial real estate loans, or $500,000 for farm loans, for "survivor" community banks—community banks that existed or formed since 2001 and remained in existence through 2017, and we excluded banks that exited the population of community banks at any time from 2001 through 2017. Survivor community banks include community banks that merged with another community bank such that the resulting bank remained a community bank. The model was estimated with robust standard errors clustered at the bank level using data for the "survivor" community banks. We also estimated lending that was within the thresholds of the business loans with outstanding principal balances of $1 million or less for all community banks. We obtained similar results.
cTotal business lending model: The total business model is for total loans (in billions of 2016 dollars) for commercial and industrial loans, commercial real estate loans, or farm loans, for a community bank in a year. The model was estimated with robust standard errors clustered at the bank level. We also used a two-step Heckman selection procedure to account for the entry and exit of community banks over time, and estimated total business loans using data for only survivor community banks. We obtained similar results.
dPretax return on assets model: The pretax return on assets model, in percent, is for a community bank in a year. The model was estimated with robust standard errors clustered at the bank level. We also used a two-step Heckman selection procedure to account for the entry and exit of community banks over time, and used data for only survivor community banks. We obtained similar results.
eThe value is based on a model without the bank and market fixed-effects because the model F-value could not be computed due to lack of variation between some clusters in the model presented in the table, which is estimated with robust standard errors clustered at the bank level.
Pretax return on assets: In table 7, the regression estimates, which used data from 2003 through 2009 to obtain counterfactual of the effects of macroeconomic, local market, and bank characteristics from 2010 through 2016 in the absence of the other factors, indicate that several community bank characteristics factors were associated with pretax return on assets. Performance was higher for community banks with lower equity capital, higher current loans, lower nonperforming loans, higher core deposits but lower brokered deposits, lower real estate owned loans, and community banks that were not diversified in multiple states and were smaller. Community bank performance was higher in markets with higher state economic growth, lower personal income growth, higher unemployment rate, lower population growth, and faster house price growth. Also, performance was higher when interest rates and rate spread were larger.[172]
Data sources used for regression analysis
- Federal Deposit Insurance Corporation (FDIC) Community Banking Structure Reference Data: It contains data on the entrances and exits of banks (mergers and failed banks).
- FDIC Statistics of Depository Institutions: These data come primarily from the Consolidated Reports of Condition and Income (Call Reports) of all FDIC-insured depository institutions. They are organized by subject, e.g., assets and liabilities, income and expense, loans, and performance and conditions ratios (data for bank characteristics).
- FDIC Summary of Deposits: It is the annual survey of branch office deposits as of June 30 for all FDIC-insured institutions, including insured U.S. branches of foreign banks (data for bank branches).
- Board of Governors of the Federal Reserve System National Information Center: It is a central repository of data about banks and other institutions for which the Federal Reserve has a supervisory, regulatory, or research interest. It includes ownership relationships of the institution and changes to its structure over time (data for new bank formations).
- Board of Governors of the Federal Reserve System: Data for effective federal funds rate.
- National Credit Union Administration, Form 5300: Data for credit unions.
- Bureau of Economic Analysis: Data for gross state product; state, metropolitan statistical area (MSA), and county personal incomes; and county population.
- Bureau of Labor Statistics: Data for state, MSA, and county unemployment rates.
- Census Bureau: Data for state and MSA populations; MSA and county land areas.
- Federal Housing Finance Agency: Data for state, MSA, and county house price indexes.
Selected Previous Studies
To facilitate these analyses, we consulted the following prior studies.
General
- Adam Levitin, Fostering Economic Growth: The Role of Financial Institutions in Local Communities,Testimony before the Senate Committee on Banking, Housing, and Urban Affairs, June 8, 2017.
- Council of Economic Advisers, The Performance of Community Banks Over Time, Issue Brief, August 2016.
- Drew Dahl, Andrew Meyer, and Michelle Neely, "Scale Matters: Community Banks and Compliance Costs," The Regional Economist, July 2016.
- Federal Deposit Insurance Corporation (FDIC), FDIC Community Banking Study, December 2012.
- Hester Peirce, Ian Robinson, and Thomas Stratmann, How Are Small Banks Faring Under Dodd-Frank? George Mason University, Mercatus Center Working Paper No. 14-05, February 2014.
- James DiSalvo and Ryan Johnston, "How Dodd-Frank Affects Small Bank Costs: Do stricter regulations enacted since the financial crisis pose a significant burden?" Federal Reserve Bank of Philadelphia Research Department, First Quarter 2016.
- James Heckman, "Sample Selection Bias as a Specification Error," Econometrica, vol. 47, no. 1 (1979), 153-161.
- Marshall Lux and Robert Greene, The State and Fate of Community Banking, M-RCBG Associate Working Paper Series, No. 37 (Boston, Mass.: Mossavar-Rahmani Center for Business and Government, Harvard Kennedy School, Harvard University, February 2015).
- Martin Baily and Nicholas Montalbano, The Community Banks: The Evolution of the Financial Sector, Part III, Economic Studies at Brookings, The Brookings Institution, December 2015.
- Tanya Marsh and Joseph Norman, The Impact of Dodd-Frank on Community Banks, American Enterprise Institute, May 2013.
- The Economist, America’s Community Banks Hope for Lighter Regulation (Washington, D.C.: June 1, 2017), accessed on November 27, 2017, at https://www.economist.com/news/finance-and-economics/21722893-other-challenges-include-technology-staff-retention-succession-planning-and-thin.
Mergers
- Aigbe Akhigbe, Jeff Madura, and Ann Marie Whyte, "Partial Anticipation and the Gains to Bank Merger Targets," Journal of Financial Services Research, vol. 26, no. 1 (2004) pp. 55-71.
- Elena Becalli and Pascal Frantz, "The Determinants of Mergers and Acquisitions in Banking," Journal of Financial Services Research, vol. 43 (2013), pp. 265-291.
- Hailey Ballew, Michael Iselin, and Allison Nicoletti, "Regulatory Asset Thresholds and Acquisition Activity in the Banking Industry" (June 16, 2017). Accessed from SSRN: https://ssrn.com/abstract=2910440 (2/1/2018).
- Julapa Jagtiani, "Understanding the Effects of the Merger Boom on Community Banks," Federal Reserve Bank of Kansas City, Economic Review, Second Quarter, 2008, pp. 29-48.
- Michal Kowalik, Troy Davig, Charles Morris, and Kristen Regehr, "Bank Consolidation and Merger Activity Following the Crisis," Federal Reserve Bank of Kansas City, Economic Review, First Quarter, 2015, pp. 31-49.
- Robert Adams, "Consolidation and Merger Activity in the United States Banking Industry from 2000 through 2010," Finance and Economics Discussion Series, 2012-51, Federal Reserve Board, Washington, D.C.
- Timothy Hannan and Steven Pilloff, "Acquisition Targets and Motives in the Banking Industry," Journal of Money, Credit and Banking, vol. 41, no. 6 (September 2009), pp. 1167-1187.
New bank formations
- Allen Berger, Seth Bonime, Lawrence Goldberg, and Lawrence White, "The Dynamics of Market Entry: The Effects of Mergers and Acquisitions on Entry in the Banking Industry," The Journal of Business, vol. 77, no. 4 (October 2004), pp. 797-834.
- Robert Adams and Dean Amel, "The Effects of Past Entry, Market Consolidation, and Expansion by Incumbents on the Probability of Entry," Finance and Economics Discussion Series, 2007-51, Federal Reserve Board, Washington, D.C.
- Robert Adams and Jacob Gramlich, "Where Are All the New Banks? The Role of Regulatory Burden in New Charter Creation," Finance and Economics Discussion Series, 2014-113, Federal Reserve Board, Washington, D.C.
- Steven Seelig and Tim Critchfield, "Merger Activity as a Determinant of De Novo Entry into Urban Banking Markets," Working Paper 2003-01, April (2003).
- Yan Lee and Chiwon Yom, "The Entry, Performance, and Risk Profile of De novo Banks," FDIC CFR WP 2016-03, Federal Deposit Insurance Corporation, April (2016).
Lending
- Dean Amel and Traci Mach, "The Impact of the Small Business Lending Fund on Community Bank Lending to Small Businesses," Finance and Economics Discussion Series, 2014-111, Federal Reserve Board, Washington, D.C.
- Elizabeth Kiser, Robin Prager, and Jason Scott, "Supervisor Ratings and the Contraction of Bank Lending to Small Businesses," Finance and Economics Discussion Series, 2012-59, Federal Reserve Board, Washington, D.C.
- Elyas Elyasiani and Lawrence Goldberg, "Relationship Lending: A Survey of the Literature," Journal of Economics and Business, vol. 56 (2004), pp.315-330.
- Jose Berrospide and Rochelle Edge, "The Effects of Bank Capital on Lending: What Do We Know, and What Does it Mean?" Finance and Economics Discussion Series, 2010-44, Federal Reserve Board, Washington, D.C.
- Julapa Jagtiani, Ian Kotliar, and Raman Quinn Maingi, "Community Bank Mergers and the Impact on Small Business Lending," Journal of Financial Stability, vol. 27 (2016), pp. 106-121.
Return on assets
- Jared Fronk, "Core Profitability of Community Banks: 1985-2015," FDIC Quarterly, vol. 10, no. 4 (2016), pp. 37-46.
- Panayiotis Athanasoglu, Sophocles Brissimis, and Matthaios Delis, "Bank-Specific, Industry-Specific and Macroeconomic Determinants of Bank Profitability," Journal of International Financial Markets, Institutions, and Money 18 (2008) pp. 121-136.
- Dean Amel and Robin Prager, "Community Bank Performance: How Important Are Managers?" Finance and Economics Discussion Series, 2014-26, Federal Reserve Board, Washington, D.C.
Appendix III: Results of GAO's Survey of the Effects of Federal Financial Regulations on Community Banks and Their Small Business and Residential Mortgage Lending
From July 2017 through August 2017, we administered a web-based survey to a nationally representative sample of community bank representatives.[173] We received valid responses from 68 percent of our sample. All survey results presented in this appendix are generalizable to the population of community banks, and we express our confidence in the precision of our estimates at 95 percent confidence intervals. For a more detailed discussion of our survey methodology, see appendix I.
Survey Results
The web-based survey consisted of three multiple–choice sections: (1) business lending activities, (2) management decisions, and (3) residential mortgage lending activities. Opportunities for respondents to voice additional comments were also provided. Multiple-choice survey questions and their aggregate results are included in this appendix. Open-ended questions are not included in this appendix, but responses have been incorporated into the text of the report where relevant.
For multiple-choice questions, respondents were asked to report activities and decisions their institution implemented since January 2010 and then identify to what extent specific factors, which we identified and defined, affected those changes. Factors included the following:
- Competition from Other Financial Institutions or Alternative Lenders (Competition): Banks face competition from other institutions and increasingly from nonbank firms offering lending or payment services.
- Effect of Economic Conditions on Loan Demand (Economic conditions): Customer loan demand at banks varies based on local economic conditions, such as unemployment rates or housing prices.
- Low-Interest Rate Environment (Interest rate): Since the financial crisis interest rates have been at historic lows, making it less expensive to borrow money and finance investments, but lender profits may also have been affected.
- Technological Advances in the Finance Industry (Technological advances): The financial sector is experiencing rapid technological changes, including increased customer demand for online and mobile access to their financial institutions and electronic application and document submission.
- Compliance with Government Financial Regulations Implemented since 2010 (Regulatory environment): Changes to regulations and uncertainty around their interpretation, enforcement, and future extension can affect staffing, lending, and time and resource allocation at banks.
The following sections present tables containing the survey questions and resulting response data.
Small Business Lending Activities
In our web-based survey, we instructed participants to consider the following definition of small business lending: "For community banks, small business loans, as defined by the Consolidated Reports of Condition and Income (Call Report), are commercial real estate or commercial and industrial loans with original amounts of $1 million or less, and farm loans with original amounts of $500,000 or less."[174] We asked participants to consider the small business lending activities of their institution since 2010. Tables 8–13 present the survey questions related to small business lending and resulting response data.
Note: The time to make a small business loan is measured as the time from application to disbursement of funds.
Note: "Borrowers with atypical financial characteristics" are defined as the following: (i) borrowers generating income from self-employment (including working as "contract" or "1099" employees); (ii) borrowers anticipated to rely on income from assets to repay the loan; (iii) borrowers who rely on intermittent, supplemental, part-time, seasonal, bonus, or overtime income.
Management Decisions
In our web-based survey, we instructed participants to consider the following definition of management decisions: "Mergers, branch openings and closures, and decisions about time and resource allocation are management decisions that financial institutions make to strengthen and maintain their position in the market." We asked participants to consider management decisions made by their institution since 2010. Tables 14–21 present the survey questions related to management decisions and resulting response data.
For the following multiple-choice question, respondents were asked what actions they had taken in order to comply with federal regulations. Respondents were not asked to identify the extent to which the factors had affected these actions.
Residential Mortgage Lending Activities
In our web-based survey, we instructed participants to consider the following definition of residential mortgage lending: "Residential mortgage lending includes new mortgage loans, refinancing, and home equity lines of credit or home equity loans." We asked participants to consider the residential mortgage lending activities of their institution since 2010. Tables 22–27 present the survey questions related to residential mortgage lending and resulting response data.
Note: The time to make a residential mortgage loan is measured as the time from application to disbursement of funds.
Note: "Borrowers with atypical financial characteristics" are defined as the following: (i) borrowers generating income from self-employment (including working as "contract" or "1099" employees); (ii) borrowers anticipated to rely on income from assets to repay the loan; (iii) borrowers who rely on intermittent, supplemental, part-time, seasonal, bonus, or overtime income.
Appendix IV: Results of GAO's Survey of the Effects of Federal Financial Regulations on Credit Unions and Their Member Business and Residential Mortgage Lending
From July 2017 through August 2017, we administered a web-based survey to a nationally representative sample of credit union representatives. We received valid responses from 61 percent of our sample. All survey results presented in this appendix are generalizable to the population of small and medium credit unions, and we express our confidence in the precision of our estimates as 95 percent confidence intervals.[175] For a more detailed discussion of survey methodology, see appendix I.
Survey Results
The web-based survey consisted of three multiple choice sections: (1) member business lending activities, (2) management decisions, and (3) residential mortgage lending activities. Opportunities for respondents to voice additional comments were also provided. Multiple-choice survey questions and their aggregate results are included in this appendix. Open-ended questions are not included in this appendix, but responses have been incorporated into the text of the report where relevant.
For multiple-choice questions, respondents were asked to report activities and decisions their institution implemented since January 2010 and then identify to what extent specific factors, which we identified and defined, affected those changes. Factors included the following:
- Competition from Other Financial Institutions or Alternative Lenders (Competition): Credit unions face competition from other institutions and increasingly from nonbank firms offering lending or payment services.
- Effect of Economic Conditions on Loan Demand (Economic conditions): Member loan demand at credit unions varies based on local economic conditions, such as unemployment rates or housing prices.
- Low-Interest Rate Environment (Low interest rates): Since the financial crisis interest rates have been at historic lows, making it less expensive to borrow money and finance investments, but lender profits may also have been affected.
- Technological Advances in the Finance Industry (Technological advances): The financial sector is experiencing rapid technological changes, including increased member demand for online and mobile access to their financial institutions and electronic application and document submission.
- Compliance with Government Financial Regulations Implemented since 2010 (Regulatory environment): Changes to regulations and uncertainty around their interpretation, enforcement, and future extension can affect staffing, lending, and time and resource allocation at credit unions.
The following sections present tables containing the survey questions and resulting response data.
Member Business Lending Activities
In our web-based survey, we instructed participants to consider the following definition of member business lending: "Member business loans (as defined by the National Credit Union Administration) include any loan, line of credit, or letter of credit where the proceeds will be used for a commercial, corporate, or agricultural purpose and the total net member business loan balances are $50,000 or greater. Participation loans should not be included." We asked participants to consider the member business lending activities of their institution since 2010. Tables 28–33 present the survey questions related to member business lending and resulting response data.
Note: The time to make a member business loans is measured as the date of application to disbursement of funds.
Note: "Borrowers with atypical financial characteristics" are defined as the following: (i) borrowers generating income from self-employment (including working as "contract" or "1099" employees); (ii) borrowers anticipated to rely on income from assets to repay the loan; (iii) borrowers who rely on intermittent, supplemental, part-time, seasonal, bonus, or overtime income.
Management Decisions
In our web-based survey, we instructed participants to consider the following definition of management decisions: "Mergers, branch openings and closures, and decisions about time and resource allocation are management decisions that financial institutions make to strengthen and maintain their position in the market." We asked participants to consider management decisions made by their institution since 2010. Tables 34–41 present the survey questions related to management decisions and resulting response data.
For the following multiple-choice question, respondents were asked what actions they had taken in order to comply with federal regulations. Respondents were not asked to identify the extent to which the factors had affected these actions.
Residential Mortgage Lending Activities
In our web-based survey, we instructed participants to consider the following definition of residential mortgage lending: "Residential mortgage lending includes new mortgage loans, refinancing, and home equity lines of credit or home equity loans." We asked participants to consider the residential mortgage lending activities of their institution since 2010. Tables 42–47 present the survey questions related to residential mortgage lending and resulting response data.
Note: The time to make a residential mortgage loan is measured as the date of application to disbursement of funds.
Note: "Borrowers with atypical financial characteristics" are defined as the following: (i) borrowers generating income from self-employment (including working as "contract" or "1099" employees); (ii) borrowers anticipated to rely on income from assets to repay the loan; (iii) borrowers who rely on intermittent, supplemental, part-time, seasonal, bonus, or overtime income.
Appendix V: Comments from the Board of Governors of the Federal Reserve System
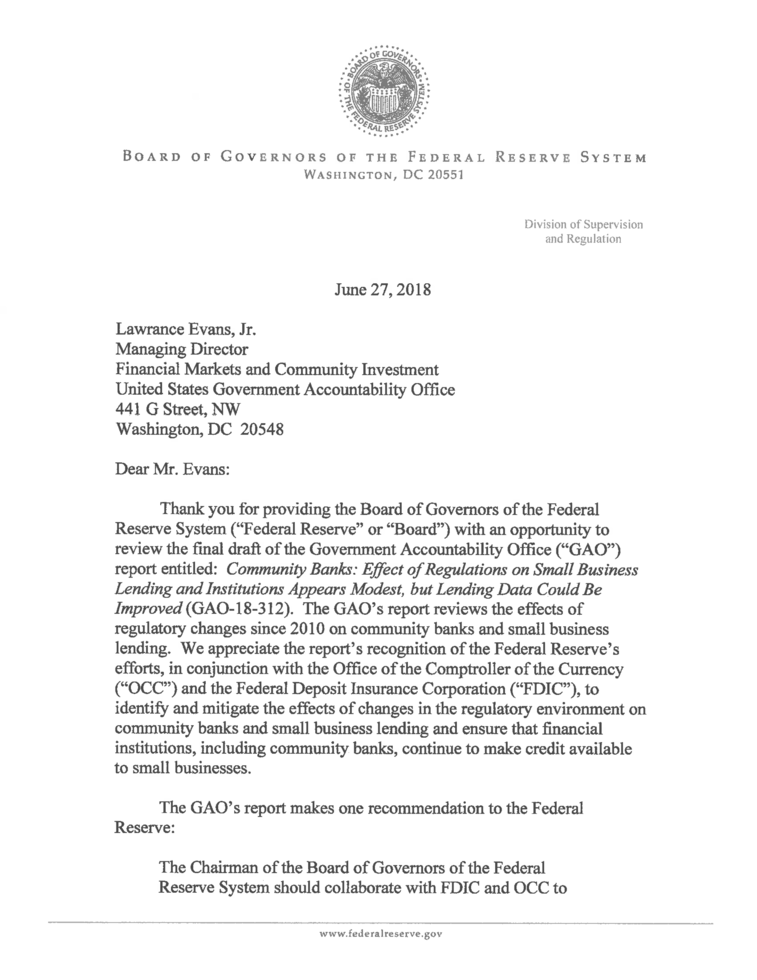
Appendix VI: Comments from the Federal Deposit Insurance Corporation

Appendix VII: Comments from the Office of the Comptroller of the Currency


Appendix VIII: GAO Contact and Staff Acknowledgments
GAO Contact
Lawrance L. Evans, Jr., (202) 512-8678 or evansl@gao.gov and Oliver Richard, (202) 512-8424 or richardo@gao.gov.
Staff Acknowledgments
In addition to the contacts named above, Cody J. Goebel (Assistant Director), Patricia A. MacWilliams (Analyst in Charge), Carl S. Barden, Bethany M. Benitez, Steven C. Campbell, Pamela R. Davidson, Kaitlan M. Doying, Joy L. Ishii, John A. Karikari, Anne A. Kruse, Risto Laboski, Jennifer W. Schwartz, Jena Y. Sinkfield, and Elizabeth W. Wood made key contributions to this report.
(101220)
References
Figures
- Figure 1: Effect of Inflation on Bank Regulators' $1 Million Threshold for Small Business Lending, 1992–2017
- Figure 2: Volume of Community Banks' Outstanding Business Loans with Original Principal Balances of $1 Million or Less, 2001–2017, by Bank Population
- Figure 3: Volume of Community Banks' Outstanding Business Loans with Original Principal Balances of $1 Million or Less and Total Business Loans, 2001–2017
- Figure 4: Actual Outstanding Amounts of Survivor Community Banks' Business Loans with Original Principal Balances of $1 Million or Less and All Community Banks' Total Business Loans Compared to Amounts Expected Based on Macroeconomic, Local Market, and Bank Characteristics, 2003–2016
- Figure 5: Dollar Amount of Credit Union Small Business Loans Outstanding, 2001–2017
- Figure 6: Survey Estimates of Factors Affecting the Increase in Documentation Required for Community Bank Small Business Loans, January 2010–August 2017
- Figure 7: Survey Estimates of Factors Affecting the Increase in Time Needed to Make Community Bank Small Business Loans, January 2010–August 2017
- Figure 8: Number of Community Banks, Credit Unions, and Large Banks, 2001–2017
- Figure 9: Number of Community Banks, 2001–2017, by Community Bank Size Category
- Figure 10: Actual Number of Community Bank Mergers Compared to Number Expected Based on Macroeconomic, Local Market, and Bank Characteristics, 2003–2016
- Figure 11: Number of New Community Banks and Credit Unions, 2001–2017, by Type of Institution
- Figure 12: Actual Number of Markets with New Community Bank Formations Compared to Number Expected Based on Macroeconomic and Local Market Characteristics, 2003–2016
- Figure 13: Changes in the Number of Community Bank Branches at the County Level, in 2010 and 2017
- Figure 14: Community Banks' Market Share of Total Assets, Deposits, and Loans and Leases, 2001–2017
- Figure 15: Median Number of Employees per $1 Million in Assets, 2001–2017 for Community Banks and Credit Unions, by Type of Institution
- Figure 16: Median Noninterest Expenses, 2001–2017 for Community Banks and Credit Unions, by Type of Institution
- Figure 17: Median Efficiency Ratio, 2001–2017 for Community Banks and Credit Unions, by Type of Institution
- Figure 18: Median Return on Assets, 2001–2017 for Community Banks and Credit Unions, by Type of Institution
- Figure 19: Actual Community Bank Pretax Return on Assets Compared to Returns Expected Based on Macroeconomic, Local Market, and Bank Characteristics, 2003–2016
- Figure 20: Actual Number of Community Bank Mergers Compared to Number Expected Based on Macroeconomic, Local Market, and Bank Characteristics, 2003–2016
- Figure 21: Actual Number of Markets with New Community Bank Formations Compared to Number Expected Based on Macroeconomic and Local Market Characteristics, 2003–2016
- Figure 22: Actual Outstanding Amounts of Survivor Community Banks' Business Loans with Original Principal Balances of $1 Million or Less and All Community Banks' Total Business Loans Compared to Amounts Expected Based on Macroeconomic, Local Market, and Bank Characteristics, 2003–2016
- Figure 23: Actual Community Bank Return on Assets Compared to Returns Expected Based on Macroeconomic, Local Market, and Bank Characteristics, 2003–2016
Tables
- Table 1: Federal Depository Institution Regulators and Their Functions
- Table 2: Survey Estimates of Factors Affecting Changes to Community Bank Small Business Lending Processes, January 2010–August 2017
- Table 3: Survey Estimates of Factors Affecting Changes to Credit Union Small Business Lending Processes, January 2010 –August 2017
- Table 4: Number and Percentage of Community Bank and Credit Union Exits, 2010–2017, by Type of Exit
- Table 5: Number and Percentage of Urban and Rural Community Bank Branches, 2010 and 2017
- Table 6: Logistic Regression Estimates of Community Bank Outcomes of Mergers and New Bank Formations, 2003–2009
- Table 7: Ordinary Least Squares Regression Estimates of Community Bank Outcomes of Business Lending and Pretax Return on Assets, 2003–2009
- Table 8: Reported Changes to the Time to Make Individual Small Business Loans and the Factors Affecting Those Changes, January 2010–August 2017
- Table 9: Reported Changes to the Number of Small Business Lending Products or Services Offered and the Factors Affecting Those Changes, January 2010–August 2017
- Table 10: Reported Changes to the Minimum Credit Quality Criteria Needed to Qualify for Small Business Loans and the Factors Affecting Those Changes, January 2010–August 2017
- Table 11: Reported Changes to the Documentation Borrowers Are Required to Provide for Small Business Loans and the Factors Affecting Those Changes, January 2010–August 2017
- Table 12: Reported Changes to the Availability of Small Business Loans to Individual Borrowers with Atypical Financial Characteristics and the Factors Affecting Those Changes, January 2010–August 2017
- Table 13: Reported Changes to Product or Service Fees for Small Business Loans and the Factors Affecting Those Changes, January 2010–August 2017
- Table 14: Reported Decisions Related to Opening One or More Branches and the Factors Affecting Those Decisions, January 2010–August 2017
- Table 15: Reported Decisions Related to Closing One or More Branches and the Factors Affecting Those Decisions, January 2010–August 2017
- Table 16: Reported Decisions Related to Acquiring Another Institution through a Merger and the Factors Affecting Those Decisions, January 2010–August 2017
- Table 17: Reported Decisions Related to Being Acquired by Another Institution and the Factors Affecting Those Decisions, January 2010–August 2017
- Table 18: Reported Changes to Customer-Facing Technology and the Factors Affecting Those Changes, January 2010–August 2017
- Table 19: Reported Changes to Time Staff Spend Engaging Directly with Individual Customers and the Factors Affecting Those Changes, January 2010–August 2017
- Table 20: Reported Changes to Time Staff Spend Identifying New or Innovative Products and the Factors Affecting Those Changes, January 2010–August 2017
- Table 21: Reported Actions by Community Banks to Comply with Federal Regulations, January 2010August 2017
- Table 22: Reported Changes to the Time to Make Individual Residential Mortgage Loans and the Factors Affecting Those Changes, January 2010–August 2017
- Table 23: Reported Changes to the Number of Individual Residential Mortgage Lending Products or Services Offered and the Factors Affecting Those Changes, January 2010–August 2017
- Table 24: Reported Changes to the Minimum Credit Quality Criteria Needed to Qualify for Individual Residential Mortgage Loans and the Factors Affecting Those Changes, January 2010–August 2017
- Table 25: Reported Changes to the Documentation Borrowers Are Required to Provide for Individual Residential Mortgage Loans and the Factors Affecting Those Changes, January 2010–August 2017
- Table 26: Reported Changes to the Availability of Individual Residential Mortgage Loans to Individual Borrowers with Atypical Financial Characteristics and the Factors Affecting Those Changes, January 2010–August 2017
- Table 27: Reported Changes to Product or Service Fees for Individual Residential Mortgage Loans and the Factors Affecting Those Changes, January 2010–August 2017
- Table 28: Reported Changes to the Time to Make Individual Member Business Loans and the Factors Affecting Those Changes, January 2010–August 2017
- Table 29: Reported Changes to the Number of Member Business Lending Products or Services Offered and the Factors Affecting Those Changes, January 2010–August 2017
- Table 30: Reported Changes to the Minimum Credit Quality Criteria Needed to Qualify for Member Business Loans and the Factors Affecting Those Changes, January 2010–August 2017
- Table 31: Reported Changes to the Documentation Borrowers Are Required to Provide for Member Business Loans and the Factors Affecting Those Changes, January 2010–August 2017
- Table 32: Reported Changes to the Availability of Member Business Loans to Individual Borrowers with Atypical Financial Characteristics and the Factors Affecting Those Changes, January 2010–August 2017
- Table 33: Reported Changes to Product or Service Fees for Member Business Loans and the Factors Affecting Those Changes, January 2010–August 2017
- Table 34: Reported Decisions Related to Opening One or More Branches and the Factors Affecting Those Decisions, January 2010–August 2017
- Table 35: Reported Decisions Related to Closing One or More Branches and the Factors Affecting Those Decisions, January 2010–August 2017
- Table 36: Reported Decisions Related to Acquiring Another Institution through a Merger and the Factors Affecting Those Decisions, January 2010–August 2017
- Table 37: Reported Decisions Related to Being Acquired by Another Institution and the Factors Affecting Those Decisions, January 2010–August 2017
- Table 38: Reported Changes to Customer-Facing Technology and the Factors Affecting Those Changes, January 2010–August 2017
- Table 39: Reported Changes to Time Staff Spend Engaging Directly with Individual Customers and the Factors Affecting Those Changes, January 2010–August 2017
- Table 40: Reported Changes to Time Staff Spend Identifying New or Innovative Products and the Factors Affecting Those Changes, January 2010–August 2017
- Table 41: Reported Actions by Credit Unions to Comply with Federal Regulations, January 2010- August 2017
- Table 42: Reported Changes to the Time to Make Individual Residential Mortgage Loans and the Factors Affecting Those Changes, January 2010–August 2017
- Table 43: Reported Changes to the Number of Individual Residential Mortgage Lending Products or Services Offered and the Factors Affecting Those Changes, January 2010–August 2017
- Table 44: Reported Changes to the Minimum Credit Quality Criteria Needed to Qualify for Individual Residential Mortgage Loans and the Factors Affecting Those Changes, January 2010–August 2017
- Table 45: Reported Changes to the Documentation Borrowers Are Required to Provide for Individual Residential Mortgage Loans and the Factors Affecting Those Changes, January 2010–August 2017
- Table 46: Reported Changes to the Availability of Individual Residential Mortgage Loans to Individual Borrowers with Atypical Financial Characteristics and the Factors Affecting Those Changes, January 2010–August 2017
- Table 47: Reported Changes to Product or Service Fees for Individual Residential Mortgage Loans and the Factors Affecting Those Changes, January 2010–August 2017
Abbreviations
| Acronym | Description |
|---|---|
| Federal Reserve | Board of Governors of the Federal Reserve System |
| BCFP | Bureau of Consumer Financial Protection |
| Call Report | Consolidated Reports of Condition and Income |
| Dodd-Frank Act | Dodd-Frank Wall Street Reform and Consumer Protection Act |
| FDIC | Federal Deposit Insurance Corporation |
| FDIC Improvement Act | Federal Deposit Insurance Corporation Improvement Act of 1991 |
| FinCEN | Financial Crimes Enforcement Network |
| MSA | metropolitan statistical area |
| NCUA | National Credit Union Administration |
| OCC | Office of the Comptroller of the Currency |
| SBA | Small Business Administration |
End Notes
Contacts
Lawrance L. Evans, Jr.
Managing Director, Financial Markets & Community Investments, EvansL@gao.gov, (202) 512-8678Oliver Richard
Director, Applied Research and Methods, RichardO@gao.gov, (202) 512-8424Congressional Relations
U.S. Government Accountability Office
441 G Street NW, Room 7125, Washington, DC 20548
Public Affairs
U.S. Government Accountability Office
441 G Street NW, Room 7149, Washington, DC 20548
Strategic Planning and External Liaison
U.S. Government Accountability Office
441 G Street NW, Room 7814, Washington, DC 20548
Download a PDF Copy of This Report
Obtaining Copies of GAO Reports and Testimony
Order by Phone
To Report Fraud, Waste, and Abuse in Federal Programs
Automated answering system: (800) 424-5454 or (202) 512-7470
Connect with GAO
GAO’s Mission
Copyright
(101220)