


Highlights
What GAO Found
Certain groups of students are overrepresented at alternative schools—public schools with a disciplinary or academic focus that serve students who have been expelled or suspended from school, or are at risk of educational failure—compared to their enrollment at nonalternative schools. Overall enrollment and discipline of students at these schools dropped between school years 2013-14 and 2015-16, according to GAO’s analysis of Department of Education (Education) data. Declines in White and Hispanic student enrollment accounted for most of the drop. Some groups, such as Black boys and boys with disabilities, were overrepresented in alternative schools, particularly those with a discipline focus, compared to their enrollment at nonalternative schools (see figure). While overall discipline dropped for students at alternative schools, school arrests and referrals to law enforcement went up by 33 and 15 percent, respectively, for Black boys and girls between school years 2013-14 and 2015-16.
Alternative schools have some of the most vulnerable students, but lower percentages of alternative schools have various types of support staff than nonalternative schools. Compared to nonalternative schools in 2015-16, a lower percentage of alternative schools had social workers, nurses, and counselors—support staff who serve different roles in addressing the health, behavioral, and emotional needs of students. For example, 47 percent of nonalternative schools had at least one social worker, compared to 26 percent of alternative schools. In every district GAO visited, officials said students had experienced multiple types of trauma, such as gang violence, death of schoolmates or parents, poverty, or homelessness—consistent with research linking trauma with educational and behavioral challenges—and described various strategies they used to meet student needs despite their staffing challenges.
Why GAO Did This Study
Students who attend public K-12 alternative schools may be at risk of educational failure for many reasons, including poor grades, disruptive behavior, mental health issues, and other life circumstances. Movement of students in and out of alternative schools can be fluid, with some students attending for a few days to a few years, and some cycling in and out of these schools repeatedly. Support staff, such as school psychologists and social workers, can play a role in supporting students’ health, behavioral, and emotional needs.
GAO was asked to review alternative schools. This report examines what is known about enrollment, discipline, and support staff in alternative schools, among other objectives. GAO analyzed data on alternative schools for school years 2013-14 and 2015-16 from Education’s Civil Rights Data Collection (most recent years available); visited selected school districts and alternative schools in Florida, Illinois, and Texas, selected for a mix of types (regular alternative, charter, and juvenile justice) and focuses (disciplinary or academic) of alternative schools; and interviewed federal officials.
In commenting on this report, Education expressed concern that GAO's analysis could confuse readers about whether race/ethnicity and other demographic variables are the cause of disproportionality or are simply correlated. GAO believes this concern is misplaced because the report clearly states that GAO's analysis is descriptive and does not imply causation or make inferences about disproportionality.
Introduction
Dear Mr. Chairman:
Students in public K-12 alternative schools are among some of the most vulnerable populations in schools. These schools serve students that have been expelled or suspended from school, or are at risk of educational failure because of poor grades, truancy, disruptive behavior, mental health issues, being a teen parent, and other life circumstances. Further, enrollment at alternative schools can be fluid, with some students attending anywhere from a few days to a few years, while others cycle in and out of these schools repeatedly. Alternative schools can be of various types—regular public schools, charter schools, and juvenile justice facilities (i.e., facilities where students are incarcerated). Alternative schools are public and can be operated by a school district or a private company under contract with a school district. They can also have different focuses, such as academic, disciplinary, or both. Alternative schools can vary significantly from school to school in how they operate and how information on students who attend these schools is reported by individual school districts—data that are required to be reported for federal oversight.
You asked us to report on the student population in alternative schools. This report examines what is known about (1) enrollment, discipline, and support staff, such as counselors and psychologists, in alternative schools; and (2) the ways selected school districts report data on alternative schools for federal oversight.
To determine what is known about enrollment, discipline, and support staff in alternative schools, we analyzed the Department of Education’s (Education) Civil Rights Data Collection (CRDC) for the two most recent collections, 2013-14 and 2015-16 school years.[1] CRDC collects a range of information on public schools nationwide, including student demographics (e.g., race, sex, disability), school type, discipline, and staffing. We used Education’s Office for Civil Rights (OCR) 2015-16 CRDC definition of an alternative school: “[A] public elementary or secondary school that addresses the needs of students that typically cannot be met in a regular school program. The school provides nontraditional education; serves as an adjunct to a regular school; and falls outside of the categories of regular education, special education, or vocational education."[2] Further, because juvenile justice facilities also address the educational needs of students that cannot be met in a regular school setting, we included in our study all juvenile justice facilities that are reported in the CRDC, whether or not they were identified as alternative schools. [3] For many of our analyses, we compared students at alternative schools with students at nonalternative schools.[4] Results of our analyses are associational and do not imply a causal relationship. We determined these data were sufficiently reliable for the purposes of this report by reviewing documentation, conducting electronic testing, and interviewing Education officials.
To gather information on what is known about the ways selected school districts report data on alternative schools for federal oversight, we visited seven school districts in three states, Florida, Illinois, and Texas. These states were selected to represent a mix of states with high numbers and proportions of alternative schools, the presence of alternative schools run under contract to private entities, and geographic diversity. We selected school districts and schools for a mix of alternative school type (regular alternative, charter alternative, juvenile justice facility), focus (academic, disciplinary, mixed academic and disciplinary), and location (urban, suburban, rural). Within each state, we visited at least two school districts; within each district, we visited up to four alternative schools. These site visits also served to supplement our CRDC data analysis to provide illustrative examples of schools and the students they serve. Although the results of these site visits are not generalizable to all states or school districts, they provide illustrative examples of how different states and school districts report data on alternative schools to Education as part of its CRDC. See appendix I for more information on our objectives, scope, and methodology.
We conducted this performance audit from April 2018 to June 2019 in accordance with generally accepted government auditing standards. Those standards require that we plan and perform the audit to obtain sufficient, appropriate evidence to provide a reasonable basis for our findings and conclusions based on our audit objectives. We believe that the evidence obtained provides a reasonable basis for our findings and conclusions based on our audit objectives.
Background
Overview of Alternative Schools
According to data from Education’s CRDC, fewer than 1 percent of all public school students attended alternative schools in school year 2015-16 (roughly 369,000 students). Yet these students are among the most vulnerable because they are often on the verge of dropping out, are incarcerated, or were expelled or suspended from their nonalternative schools. Some alternative schools have an academic focus and help students earn credits toward graduation if they are behind in school or if they need to graduate early in order to attend to other necessities, such as working or parenting. Other alternative schools—referred to by some districts as their discipline schools—have a disciplinary focus and serve students who have been suspended or expelled from their nonalternative school. Alternative schools may be operated by school districts themselves or by private for-profit or non-profit entities that contract with the public school districts. These entities are subject to specific contractual obligations. These contractual obligations could include requirements related to services the contractor must provide, performance and accountability standards, and record keeping requirements for purposes of reporting student-level data to the contracting school district. There are various types of alternative schools, including regular public schools (77 percent), charter schools (6 percent), and juvenile justice facilities (17 percent).[5]
Research on Discipline in Schools
In our 2018 report on discipline in K-12 schools, we found that Black students, boys, and students with disabilities experienced disproportionate levels of discipline in school year 2013-14 across all types of schools, including alternative schools.[6] As we reported in 2018, who gets disciplined and why is complex. Studies we reviewed for that report suggest that implicit bias—stereotypes or unconscious associations about people—on the part of teachers and staff may cause them to judge students’ behaviors differently based on the students’ race and sex.[7] The studies showed that these judgments can result in certain groups of students being more harshly disciplined than others. Further, the studies found that the types of offenses that Black children were disciplined for were largely based on school officials’ interpretations of behavior. For example, one study found that Black girls were disproportionately disciplined for subjective interpretations of what constitutes disobedience and disruptive behavior.
Further, a child’s performance and behavior in school may be affected by health and social challenges outside the classroom that tend to be more acute for poor children, including minority children who experience higher rates of poverty, and for those who have experienced trauma.[8] Research shows that experiencing trauma in childhood may lead to educational challenges, such as lower grades and more suspensions and expulsions; increased use of mental health services; and increased involvement with the child welfare and juvenile justice systems, according to the U.S. Department of Health and Human Services’ Substance Abuse and Mental Health Services Administration (SAMHSA).[9] Some research has found that youth in juvenile justice facilities report experiencing multiple types and instances of trauma, such as assault, family and community violence, and physical or sexual abuse.[10] For example, in one study of youth involved in the juvenile justice system in New Hampshire and Ohio, 94 percent reported having experienced at least one trauma in their lifetime, and the average number of traumas reported was about five.[11] Other research indicates that creating a positive school climate, including social and emotional learning programming, may lead to more positive academic and behavioral outcomes in schools.[12] Creating a positive school environment can include employing resources to help students develop the social, emotional, and conflict resolution skills needed to avoid and de-escalate problems, and targeting supports to help address underlying causes of misbehavior, such as trauma. School psychologists, social workers, nurses, and counselors can all play a role in supporting the health, behavioral, and emotional needs of students.
Education and Justice Enforcement Responsibilities
Education’s OCR and the Department of Justice’s (Justice) Civil Rights Division and its Office for Civil Rights for the Office of Justice Programs are responsible for enforcing a number of civil rights laws, which protect students from discrimination on the basis of certain characteristics.[13] As part of their enforcement responsibilities, both agencies conduct investigations in response to complaints or reports of possible discrimination.[14] Education may also seek to terminate federal funds if a recipient is determined to be in violation of the civil rights laws and the agency is unable to reach agreement with the parties involved.[15] Further, Justice has the authority to file suit in federal court to enforce the civil rights of students in public education.
Additionally, Justice’s Office of Juvenile Justice and Delinquency Prevention (OJJDP) supports local and state efforts to prevent delinquency and improve the juvenile justice system. OJJDP sponsors research, program, and training initiatives; develops priorities and goals and sets policies to guide federal juvenile justice issues; disseminates information about juvenile justice issues; and awards funds to states to support local programming. OJJDP supports prevention and intervention programs aimed at helping young people overcome the challenges in their lives and avoid involvement with the justice system. For example, in fiscal year 2015, OJJDP provided more than $77 million in discretionary funding to strengthen mentoring programs across the nation. These programs were focused on addressing the mentoring needs of underserved populations, including tribal youth, youth with disabilities, youth in foster care, and child victims of commercial sexual exploitation.
Education’s OCR also administers the CRDC, a biennial national survey that Education requires nearly all public school districts and schools to complete, and publishes the data and reports on its website.[16] The CRDC survey collects a variety of information on student enrollment, discipline, and staff (such as teachers, psychologists, and counselors), most of which is disaggregated by race/ethnicity, sex, limited English proficiency, and disability. Data for the CRDC are self-reported by school districts, and are based on two different points in the school year. The fall snapshot captures enrollment, student demographics, and school type data as of October 1 or the closest school day to October 1; and the cumulative end of the year count captures data such as school staff and all incidents of discipline for the entire school year. School districts report discipline under six broad categories in Education’s CRDC: (1) out-of-school suspensions, (2) in-school suspensions, (3) referrals to law enforcement, (4) expulsions, (5) corporal punishment, and (6) school-related arrests.
K-12 Student Enrollment
Of the more than 50 million students in public K-12 schools in school year 2015-16, about one-half were White and the other half fell into one of several minority groups, with Hispanic and Black students being the largest minority groups, according to CRDC data (see table 1). The number of boys and girls in public schools was almost evenly split. A larger percentage of boys were students with disabilities.
In our 2016 report, we found that schools with a relatively large proportion of students in poverty also tend to have a higher proportion of minority students.[17] As we have reported, over time, there has been a large increase in schools that are the most isolated by poverty and race, and the link between racial and ethnic minorities and poverty is longstanding, and also affects access to a quality education. We also reported in 2018 that students in relatively poor—where 80 percent of students are Black and Hispanic—and small schools had less access to high school courses that help prepare them for college.[18]
Major Findings
IN THIS SECTION
- Enrollment and Discipline Varied by Race, Sex, and Disability Status in Alternative Schools, a Lower Percentage of which Have Support Staff Compared to Nonalternative Schools
- Using Flexibility Afforded Them, Selected School Districts Differed in How They Reported Data on Alternative Schools to Education
Enrollment and Discipline Varied by Race, Sex, and Disability Status in Alternative Schools, a Lower Percentage of which Have Support Staff Compared to Nonalternative Schools
Certain Groups Are Overrepresented in Alternative Schools Compared to Nonalternative Schools
Enrollment
Enrollment at alternative schools declined by about 114,000 students, or about 25 percent, between school years 2013-14 and 2015-16, according to our analysis of Education’s most recent two school years of CRDC data (see fig. 1).[19] Steep drops in White and Hispanic student enrollment accounted for about 75 percent of this change (42 and 34 percent, respectively); that is, White boys (25 percent) and girls (17 percent) accounted for 42 percent of the drop, and Hispanic boys (19 percent) and girls (15 percent) accounted for 34 percent. The decline in enrollment was less steep for Black boys and girls, at 17 percent (11 and 6 percent, respectively). Enrollment for other student groups—boys and girls who are Asian American, American Indian/Alaska Native, and Multi-race—remained relatively constant, with each group accounting for no more than 2 percent of the decline over the same time period. These other student groups also made up a much smaller percentage of the overall enrollment at alternative schools. For boys and girls with disabilities, enrollment dropped 12 percent (9 and 3 percent, respectively).[20]
Figure 1: Enrollment Declines between School Years 2013-14 and 2015-16 and Over/Underrepresentation in School Year 2015-16 at Alternative Schools Compared to Nonalternative Schools by Demographic Group
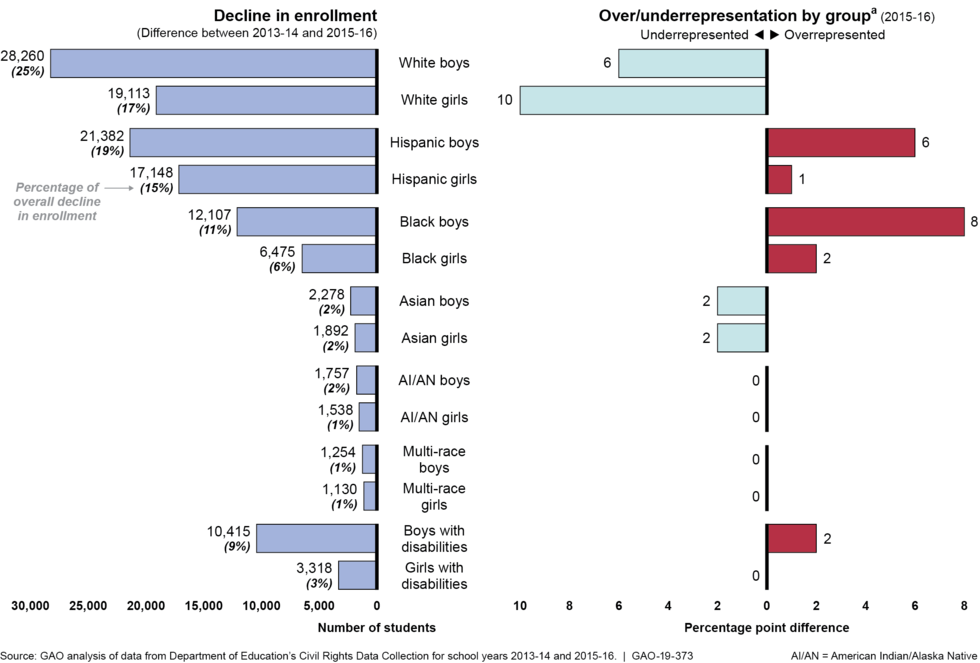
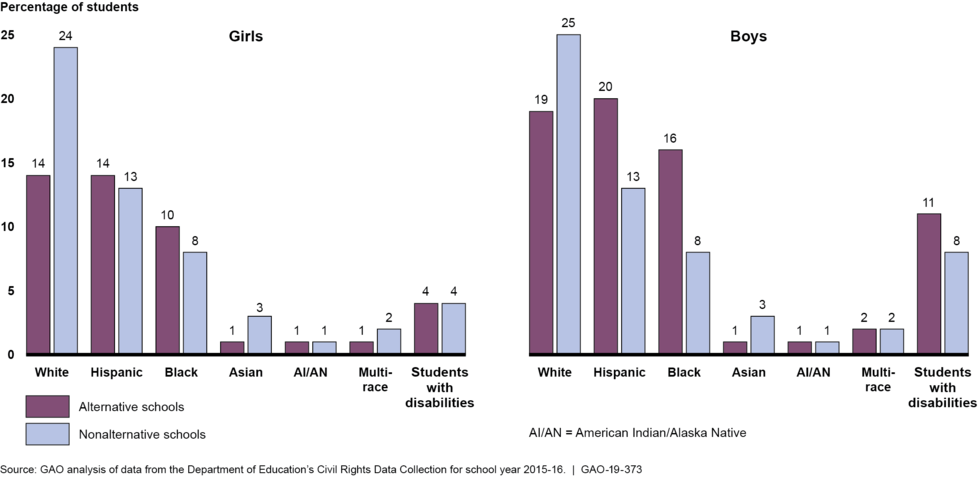
Black and Hispanic boys and girls, and boys with disabilities, were overrepresented at alternative schools in 2015-16, and White and Asian boys and girls were underrepresented, according to our analysis of Education’s CRDC data (see fig. 1).[21] The data also showed this for school year 2013-14. Further, these overrepresented groups also made up a larger proportion of enrollment at alternative schools than they did at nonalternative schools, according to our analysis of Education’s school year 2015-16 data (see fig. 2). For example, Black boys accounted for 8 percent of students at nonalternative schools and 16 percent of students at alternative schools. This was also true for Hispanic boys, who accounted for 13 percent of students at nonalternative schools and 20 percent of students at alternative schools. White and Asian boys and girls attended nonalternative schools in greater proportions than they did alternative schools.[22]
Figure 2: Student Enrollment in Alternative and Nonalternative Schools, by Demographic Group, School Year 2015-16
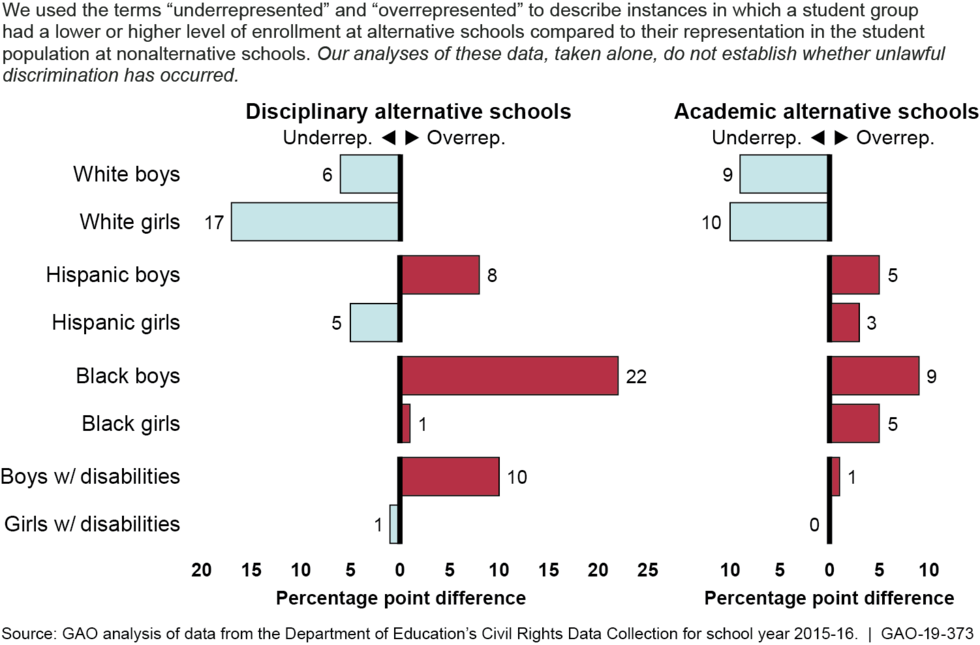
Our analysis of these data showed similar patterns of overrepresentation for Black boys and girls, Hispanic boys, and boys with disabilities at alternative schools when compared to these groups' representation at nonalternative schools, regardless of the type—regular alternative, charter alternative, and juvenile justice facility (see table 2). In juvenile justice facilities, Black boys were overrepresented by 28 percent, followed by boys with disabilities and Hispanic boys. In addition, when we analyzed these data by the focus of alternative schools—disciplinary, academic, or mixture of both—Black boys, in particular, but also boys with disabilities and Hispanic boys, were the most overrepresented in disciplinary schools. Specifically, Black boys were overrepresented by 22 percent, Hispanic boys by 8 percent, and boys with disabilities by 10 percent, as compared to these groups' representation in nonalternative schools.
Note: We used the term “overrepresented” to describe instances in which a student group had a higher level of enrollment at alternative schools compared to their representation in the overall student population at nonalternative schools. We used the term "underrepresented" to describe instances in which a student group had a lower level of enrollment at alternative schools compared to their representation in the overall student population at nonalternative schools. Our analyses of these data, taken alone, do not establish whether unlawful discrimination has occurred.
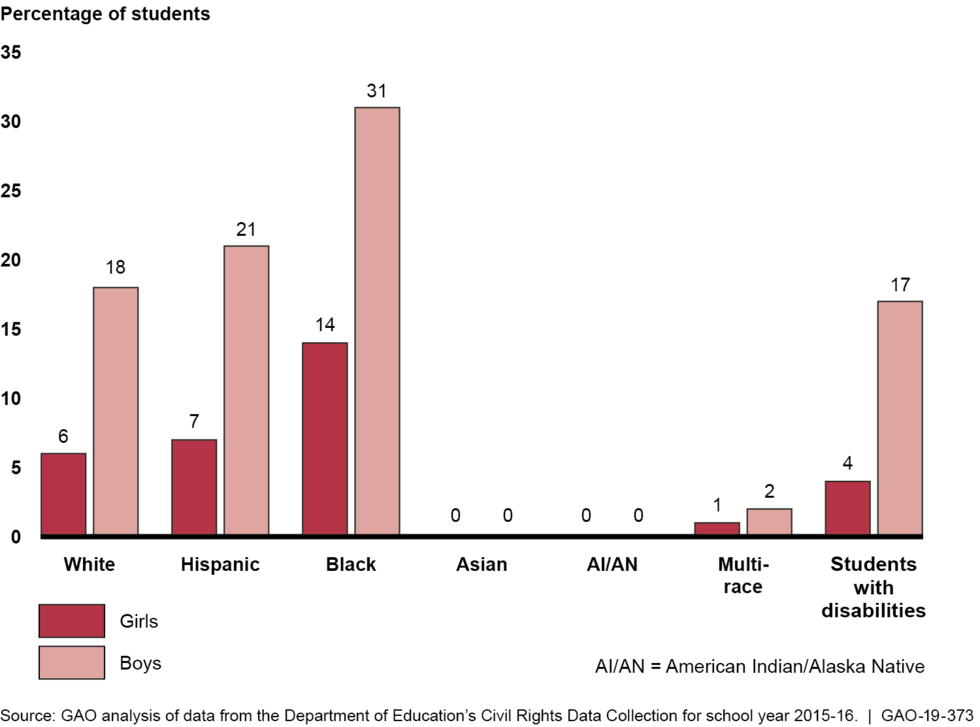
Further, nearly 75 percent of students who were transferred to alternative schools for disciplinary reasons in school year 2015-16 were Black or Hispanic (see fig. 3). Among boys, Black and Hispanic boys were transferred at higher rates than White and Asian boys. Among girls, Black girls (14 percent) were transferred at about twice the rates of Hispanic and White girls.
Figure 3: Percentage of Students Transferred to Alternative Schools for Disciplinary Reasons, School Year 2015-16
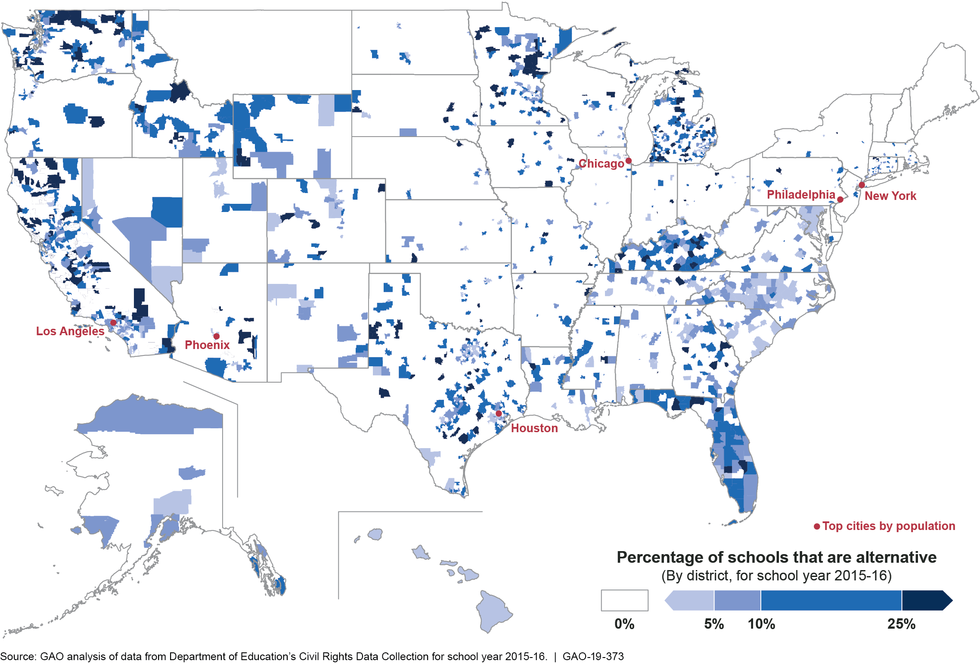
We also found geographic patterns with respect to the proportion of alternative schools by district (see fig. 4). In addition, according to our analysis of Education’s school year 2015-16 data, about 28 percent of students in nonalternative schools attended schools in urban areas, compared to 43 percent of alternative school students (see appendix I for more information).[23] Education officials suggested that this may be because in smaller rural districts, there may not be sufficient numbers of students to establish and operate a separate alternative school campus.
Discipline
The number of students disciplined in alternative schools dropped in 2015-16 compared to 2013-14 across most types of discipline for most groups of students. However, for some groups, such as Black boys and girls, rates for all of the types of discipline we examined either declined more modestly or went up, according to our analysis of CRDC data across those two school years (see table 3).[24] For example, from 2013-14 to 2015-16, declines for out-of-school suspensions were less steep for Black boys and girls than for White and Hispanic boys and girls. In addition, school-related arrests and referrals to law enforcement increased for Black boys and girls.[25]
Note: Numbers and percentages based on counts of fewer than 30 students are not presented in this table and instead are replaced with a “--” due to the small number of incidents. Our analyses of these data, taken alone, do not establish whether unlawful discrimination has occurred. "Any expulsion" refers to expulsions with and without educational services.
While the number of students disciplined generally dropped for boys and girls with disabilities from school year 2013-14 to 2015-16, they were overrepresented in alternative schools across most forms of discipline in 2015-16, compared to their enrollment at alternative schools.[26]
Lower Percentages of Alternative Schools Compared to Nonalternative Schools Reported Having Most Types of Support Staff
Compared to nonalternative schools in 2015-16, a lower percentage of alternative schools had social workers, nurses, and counselors—support staff who serve different roles in addressing the health, behavioral, and emotional needs of students (see table 4). [27]
Note: Schools were included for a given type of support staff if the number of Full-Time Equivalents (FTE) for that type of staff was greater than zero at that school. Support staff serve different roles in addressing the health, behavioral, and emotional needs of students. Note that levels for each type of support staff are calculated separately, and schools may have more than one type of support staff. We did not include juvenile justice facilities in this analysis because the Civil Rights Data Collection data for justice facilities represent only support staff who serve students who are in the educational program offered at the facility; therefore, it may not capture all support staff who work at the facility.
For example, nearly one-half of nonalternative schools had at least one social worker, compared to about one-quarter of alternative schools, according to our analysis of Education’s data for school year 2015-16.[28]
The largest differences between alternative and nonalternative schools were in the proportion of schools with nurses and counselors. A higher percentage of alternative schools than nonalternative schools had psychologists, another type of support staff, in 2015-16. (See table 5 for staff definitions.) Education officials suggested that school and district size, among other factors, may have an effect on staffing levels.
Across different types of alternative schools, charter alternative schools had lower rates of support staff compared to regular alternative schools, especially for social workers, nurses, and counselors. For example, 10 percent of charter alternative schools reported having one or more nurses, compared to 30 percent of regular alternative schools.
During our site visits, officials in every school district described the multiple types of trauma that students experienced—such as gang violence that affected students in and outside of school, the death of schoolmates or parents, poverty, or homelessness. District and school officials described the challenges they faced in providing the staff necessary to support their students, and various strategies they used to meet student needs. For example:
- Officials in one district that provides services to a largely Black male student population at juvenile justice facilities said most students have experienced trauma and many face mental health issues, such as mood disorders. These officials also said that in this district, almost 95 percent of girls in these facilities have been victimized in some way, including sexually. To address these issues, the district is providing professional development around being trauma-informed. District officials noted that due to budgetary issues, it took around 8 to 10 months to hire the required support staff to help address students’ needs.
- In an urban school district whose alternative school population is primarily Black and Hispanic, district officials told us that there has been an increased need to address trauma experienced by students. Staff at a number of the district’s alternative schools received trauma-informed professional development, and some schools located in areas with gang activity have a restorative justice practice coach on site twice a week to work with teachers and staff.[29] District officials reported that efforts are made to ensure students are placed in an environment that is conducive to their safety and learning and indicated that attendance is impacted by complex situations including physical and mental health problems, substance abuse, pre-existing trauma, and lack of transportation, among other things.
- At an alternative high school that predominantly serves White and Hispanic students who are at risk academically, officials told us that a large proportion of students had experienced the death of a parent or had some other trauma during middle school. In addition, an estimated 17 percent of students had attempted suicide in the past year. We spoke with one student whose brother died in a car accident moments after letting her out of the car. To help their current support staff meet their students’ academic, social, and emotional needs, the school also relies on two interns who are studying to become licensed social workers.
- In one school serving English language learners, many of whom are refugees, school officials told us that some students have post-traumatic stress disorder from the war and violence they witnessed in their home countries. Further, some students arrived in the country unaccompanied and do not have parents in the United States. School officials told us that when the school opened around 15 years ago, the school arranged to have its own dedicated social worker to support the students emotionally to help their learning.
- At a rural school that accepts suspended and expelled students and serves a largely low-income White population, school officials told us that their students are dealing with many issues in their lives that can take an emotional toll, such as drugs, foster care, physical abuse, and sexual abuse. In addition, their students come from families that are experiencing high unemployment. District officials told us that they had recently hired a crisis intervention specialist for the district because they had seen a “giant jump” in the number of students experiencing trauma. District officials further noted that the district would like to hire a counselor to help support alternative school students, but they do not have the resources. District officials also told us that due to budget cuts, they lacked resources to help support students as they transitioned back to their home school, which can be a challenging process.
- At an academically focused alternative school that serves mainly low income Black boys and girls, school officials noted that most of the students have social and emotional issues related to foster care, homelessness, or trauma. Officials told us that the school employs one social worker and one family counselor to help address these issues. According to school officials, the school needs an additional social worker and family counselor to fully address students’ needs.
Using Flexibility Afforded Them, Selected School Districts Differed in How They Reported Data on Alternative Schools to Education
Often citing a highly transitory student population, selected school district and school officials we interviewed said that they used the flexibilities Education affords them to determine how to report discipline incidents when students attend more than one school over the course of a school year. Specifically, for purposes of the CRDC, Education asks schools to take a count of students, or a snapshot, on or around October 1. At the end of the school year, Education also requires a count of all students disciplined, by type of discipline, for the entire year. To ensure all required data are reported for each student, and to prevent duplicative reporting, Education officials said they allow districts to assign those cumulative data to a “home school,” which can be a student’s alternative school or the school that referred the student to the alternative school. Selected school districts we visited made different choices in assigning a home school for reporting purposes. For example:
- In one large urban school district, officials said they assign discipline data for students to the school where the infractions took place. In this district, one privately run discipline-focused alternative school that we visited had the capacity to serve up to 100 students at a time. Officials said students typically stay in this school between one and two semesters. They told us discipline data reported for this school only reflect incidents that occurred at this school.
- In a large school district with 14 alternative schools, district officials said that a student's disciplinary incidents are reported wherever the student was enrolled around October 1. We visited a disciplinary school where officials said they have a highly mobile student body. They said that last year they served 1,156 students over the course of the year, although they served only about 200 students at any one time. They said students commonly stay for 30 days, but some stay for the remainder of their time in high school. Thus, discipline data reported for this school do not capture discipline for students transferring in after the October fall snapshot date.[30]
- A senior official in another large school district we visited said they do not generally assign student discipline data to those alternative schools that are considered temporary placements; instead, all discipline is assigned to the student’s permanent school, which they consider the home school. For example, at one school for suspended students in grades 7 through 12, they may be placed for 1 to 10 days as an alternative to suspension. Upon completing their stay, students return back to their home schools. This school does not capture discipline for these students.
- In the same school district, alternative schools that serve students more long term, such as those with an academic focus, are not considered temporary placements. Discipline data for these schools, according to a senior school district official, are reported based on where a student was enrolled at the end of the school year, even if the infractions occurred at another school where the student was previously enrolled.
- According to school district officials from another district, the district’s juvenile justice facilities, which can incarcerate students for longer periods, are considered the home school for purposes of reporting cumulative discipline data for students. Therefore, discipline incidents that occurred at these facilities would be reflected in the data.
In addition to differences in how the selected districts reflected incidents of discipline, we also found differences in how they reported the number of alternative schools. For example, one large urban school district we visited hired a private firm to run an academic alternative school that had three separate campuses, which were reported in the CRDC as one alternative school. According to school district officials, the data reported for these campuses were aggregated because they shared the same identification number for federal reporting purposes.[31] School district officials said they are working with their state educational agency to reduce the number of schools that share the same identification number. In another school district, an academic alternative school we visited had four separate campuses, but reported one alternative school in the CRDC. School district officials said these campuses will continue to be reported as one alternative school in the 2017-18 CRDC because they operate and report as one entity. Further, school district officials said another alternative school focused on discipline that shared a facility with a nonalternative elementary school was not separately reported in the CRDC. According to district officials, they plan to separately report on this alternative school going forward, beginning with the 2017-18 CRDC.
Agency Comments
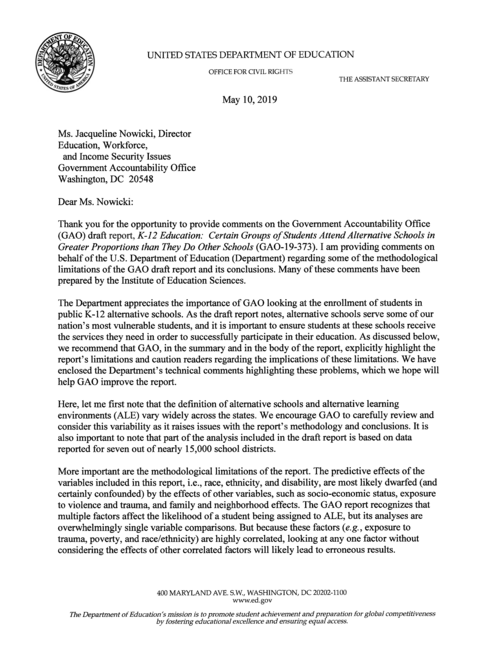
We provided a draft of this report to the Departments of Education (Education) and Justice (Justice) for review and comment. Education provided written comments that are reproduced in appendix III. Education and Justice provided technical comments, which we incorporated as appropriate.
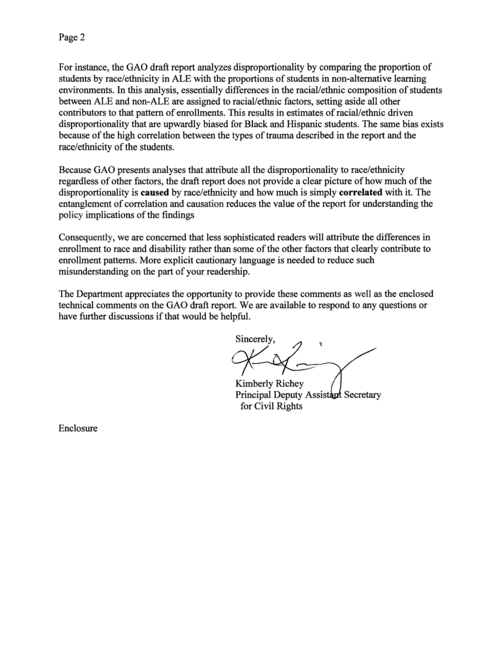
In its written comments, Education detailed what it considered to be limitations with the report’s methodology and conclusions. Specifically, Education said the effects of the demographic variables we used in our analysis─race/ethnicity, sex, and disability─to describe the population of students in alternative schools, are most likely not as powerful as other variables such as socioeconomic status, exposure to trauma and violence, and family and neighborhood characteristics. Education stated that looking at any one factor in the absence of others would likely lead to erroneous results, and could confuse readers about whether race/ethnicity is the cause of the disproportionality or is simply correlated with other causal factors.
We agree that factors correlated with an event do not necessarily cause that event. While limitations exist with any methodology, we believe the limitations related to causality that Education raised are misplaced; we do not imply causation for disproportionality observed within the data we analyzed or make inferences about disproportionality. Our descriptive analyses of these data are consistent with our goal of describing the condition by race/ethnicity, sex, and disability status. Our results showing overrepresentation of certain groups in enrollment and disproportionate discipline are associational and do not imply a causal relationship. While we make no conclusions about our findings, the findings themselves factually describe the enrollment and disciplinary patterns from that data. The approach we took to determining disproportionality is a commonly used, credible method in the literature we reviewed. Education similarly makes descriptive analyses of these data by race/ethnicity, sex and disability publicly available on its website in various publications.[32] For example, Education found that in school-year 2015-16, Black boys and girls made up 15 percent of student enrollment and 31 percent of students referred to law enforcement or arrested.[33]
Education’s Civil Rights Data Collection (CRDC) does not collect data on the variables that the agency proposed that GAO analyze, such as exposure to trauma or violence. Therefore, CRDC data do not allow us to examine the factors Education asserts are likely predictive of enrollment and discipline patterns found in their data. In the background of the report, we provide information from studies that met our standards for methodological rigor and that help explain disproportionate discipline, such as implicit bias and poverty. Nevertheless, to reduce any potential confusion about the descriptive approach to reporting data from the CRDC, we have added additional clarification about our analyses.
Education also noted that the definitions of alternative schools and alternative learning environments vary widely across states, and encouraged us to carefully review and consider this variability, as it raises issues with the report’s methodology and conclusions. We disagree. While there may be definitional differences across states, as Education notes, we used the definition that Education instructs school districts to use as they complete the CRDC to indicate whether or not their school is an alternative school. Further, because juvenile justice facilities also address the educational needs of students that cannot be met in a regular school setting, we included in our study all juvenile justice facilities that are reported in the CRDC, whether or not they were specifically identified as alternative schools.[34] Moreover, as discussed in the report and shown in Table 2, the CRDC data showed similar patterns of overrepresentation at alternative schools for Black boys and girls, Hispanic boys, and boys with disabilities, regardless of the type of school—regular alternative, charter, and juvenile justice facility.
Finally, Education suggested that part of our analysis is based on data reported for seven out of nearly 15,000 school districts. As stated in the draft report on which Education commented, our main analysis relied on data that nearly all school districts reported in the CRDC. Another objective of our study was to determine "the ways selected school districts report data on alternative schools for federal oversight.” For this objective, we visited seven school districts to provide, among other things, illustrative examples of the ways in which districts report data to the CRDC. In the draft report Education reviewed, we clearly state that these examples are not generalizable to all states and school districts.
As agreed with your office, unless you publicly announce the contents of this report earlier, we plan no further distribution until 30 days from the report date. At that time, we will send copies of this report to the appropriate congressional committees, the Secretary of Education, and the Attorney General. In addition, the report will be available at no charge on the GAO website at http://www.gao.gov.
If you or your staff have any questions about this report, please contact me at (617) 788-0580 or nowickij@gao.gov. Contact points for our Offices of Congressional Relations and Public Affairs may be found on the last page of this report. GAO staff who made key contributions to this report are listed in appendix IV.
Sincerely yours,

Jacqueline M. Nowicki, Director
Education, Workforce, and Income Security Issues
Congressional Addressees
Robert C. “Bobby” Scott
Chairman
Committee on Education and Labor
House of Representatives
Appendixes
IN THIS SECTION
Appendix I: Objectives, Scope, and Methodology
The objectives of this report were to examine what is known about (1) enrollment, discipline, and support staff in alternative schools, and (2) the ways selected school districts report data on alternative schools for federal oversight. To conduct this work we analyzed and compared federal civil rights data on public alternative and nonalternative schools; visited seven school districts in three states to provide illustrative examples of alternative schools and their students, and the ways in which school districts report data used for federal oversight; interviewed federal agency officials; reviewed agency documentation; and reviewed federal laws and regulations. To inform all of our work, we interviewed representatives of several nonprofit organizations that examine laws and policies related to alternative schools. We also met with subject matter experts to discuss issues related to alternative education and disparities in enrollment and discipline. The following sections contain detailed information about the scope and methodology for this report.
Analysis of National Data on Alternative Schools
To determine what is known about enrollment, discipline, and support staff in alternative schools, we analyzed the U.S. Department of Education’s (Education) Civil Rights Data Collection (CRDC) for school year 2015-16 (the most recent) and in some instances school year 2013-14 (the previous collection) to discern any changes that may have occurred in enrollment and discipline between the two most recent periods. We analyzed the public-use data file of the CRDC that was publicly available as of September 2018. The CRDC is a biennial survey that Education requires nearly every public school and district in the United States to complete; specifically, territorial schools (except for Puerto Rico, commencing for the 2017-18 CRDC collection), Department of Defense schools, and tribal schools are not part of the CRDC. Conducted by Education’s Office for Civil Rights (OCR), the survey collects data on the nation’s public schools (pre-K through grade 12), including disciplinary actions, enrollment, school and student characteristics, and types of school staff.
To analyze these data, we used OCR’s 2015-16 CRDC definition of an alternative school: “[A] public elementary or secondary school that addresses the needs of students that typically cannot be met in a regular school program. The school provides nontraditional education; serves as an adjunct to a regular school; and falls outside of the categories of regular education, special education, or vocational education."[35] CRDC data are self-reported by districts and certified by the Superintendent or his/her authorized designee; consequently, there is still potential for misreporting of information. Alternative schools can be of various types—regular alternative schools and charter alternative schools. Further, because juvenile justice facilities also address the educational needs of students that cannot be met in a regular school setting, we included in our study all juvenile justice facilities that are reported in the CRDC, regardless of whether they were identified as alternative schools.[36] We eliminated magnet schools and special education schools that had classified themselves as alternative schools, as they do not meet the definition of an alternative school. For many of our analyses, we compared students at alternative schools with students at nonalternative schools.[37]
For our analysis of alternative school enrollment and discipline, we analyzed key student demographics, such as race, sex, and disability status. There are various credible methodologies than can be used to analyze this type of data, and it is possible that different methods may produce different results. We used the composition index method—one of the more common methods used to calculate under- and overrepresentation—which compares each student group's representation at alternative schools to their representation at nonalternative schools to determine whether there are disparities. For example, using this method, if boys accounted for 50 percent of all nonalternative school students, but represented 75 percent of students at alternative schools, then boys would be overrepresented among alternative school students by 25 percentage points. Other researchers may choose to use other analytical techniques. For example, one alternate method focuses on the risk of a specific group falling into a category such as receiving a certain type of discipline, versus the risk of all other students falling into that category. We also compared the percentage that various groups represented among students transferred to disciplinary schools. Results of our descriptive analyses are associational and do not imply a causal relationship because, for example, the CRDC does not collect data on factors that may cause differences in student composition or school assignment, and CRDC data were not gathered by a randomized controlled trial, where students would be randomized to attend schools with certain characteristics. Our analyses of these data, taken alone, do not establish whether unlawful discrimination has occurred.
The 2013-14 and 2015-16 CRDC collected data on six broad types of disciplinary actions: (1) corporal punishment, (2) in-school suspensions, (3) out-of-school suspensions, (4) expulsions, (5) referrals to law enforcement, and (6) school-related arrests. The CRDC did not collect data on less severe forms of discipline, such as detentions, or removing privileges to engage in extracurricular activities, such as athletic teams or field trips. We used the following CRDC variables for the disciplinary actions we examined (see table 6).[38]
For alternative school enrollment and for each of the six discipline categories in our review, we examined discipline counts and rates both overall and disaggregated by student demographic characteristics, such as student sex (boy or girl), race or ethnicity (see table 7), and disability status (students with and without disabilities).[39] We also examined race and sex intersectionally, for example, disciplinary rates for White boys or Hispanic girls. We examined disability status and sex intersectionally, but not disability status and race.
In addition to analyzing data on enrollment and discipline, we also analyzed CRDC data on school staff. Specifically, we analyzed data on the proportions of alternative schools that had at least one support professional—counselors, psychologists, nurses, and social workers, and compared that to the proportion of nonalternative schools with such staff. For alternative schools, we also analyzed levels of these support staff by school type, including regular alternative schools and charter alternative schools. We did not analyze these staff at juvenile justice facilities because the CRDC data for justice facilities represent only support staff who serve students who are in the educational program offered at the facility; therefore, these data may not capture all support staff who work at the facility.
We analyzed enrollment, discipline, and staff by type of alternative school a student attended—regular alternative school, charter alternative school, and juvenile justice facility (see table 8).
We also conducted analyses by alternative school focus—academic, disciplinary, and mixture of both academic and disciplinary (see table 9).
In addition, to analyze alternative school enrollment by locale, we used the 2015-16 Common Core of Data (CCD) locale variable. The CCD is administered by Education’s National Center for Education Statistics, and annually collects nonfiscal data about all public schools in the nation. The locale variable in the CCD is primarily based on a school’s location relative to populous areas. To do this, we matched schools in the CRDC for school year 2015-16 to schools in the CCD for school year 2015-16, and excluded schools for which there was not a match. The locale variable is divided into four main types: city, suburb, town, and rural. For the purposes of our analyses, we combined the town and rural variables into one town/rural variable because they are defined similarly (see table 10). We attempted to use the free and reduced-price lunch variable from the CCD as a proxy for school poverty. However, because this variable was missing from a large number of alternative schools, we were unable to conduct this analysis.
Note: The locale variable is primarily based on a school’s location relative to populous areas.
We determined that the data we used from the CRDC and CCD were sufficiently reliable for the purposes of this report by reviewing technical documentation, conducting electronic testing, and interviewing officials from Education’s OCR and National Center for Education Statistics. Past releases of the CRDC have subsequently been updated by Education to correct errors and omissions in the data.
School District Site Visits
To provide illustrative examples of what is known about the ways selected school districts report data on alternative schools for federal oversight and to supplement the data we analyzed on enrollment, discipline, and support staff in alternative schools, we visited school districts and alternative schools in three states—Florida, Illinois, and Texas. To select these states, we considered a mix of states with high levels and proportions of public alternative schools based on CRDC data, geographic dispersion, and the number of alternative schools under contract by what we believe to be some of the largest private entities based on publicly available data for each state. The CRDC does not indicate whether an alternative school is run by a private entity. We reviewed publicly available data to determine if the school district contracted with a private entity.
To identify the alternative schools we visited, we considered CRDC data variables regarding the type (regular alternative, charter alternative, juvenile justice facility) and number of students enrolled in each alternative school, as well as the focus each school serves (academic, disciplinary, or a mixture of both) to identify schools of varying types and focuses. We also considered whether or not the alternative school was publicly or privately run on behalf of a school district, including charter schools. Within each state, we visited at least two school districts and up to four alternative schools in each district.
Although the results of these site visits are not generalizable to all states or school districts, they provide illustrative examples of the ways different states and school districts report data on alternative schools to Education.
We conducted this performance audit from April 2018 to June 2019 in accordance with generally accepted government auditing standards. Those standards require that we plan and perform the audit to obtain sufficient, appropriate evidence to provide a reasonable basis for our findings and conclusions based on our audit objectives. We believe that the evidence obtained provides a reasonable basis for our findings and conclusions based on our audit objectives.
Appendix II: Additional Data Tables
This appendix contains tables that show data based on analyses we conducted using the Department of Education’s Civil Rights Data Collection (CRDC) for school years 2013-14 and 2015-16. The following tables are included in this appendix:
- Table 11: Enrollment at Alternative Schools and Percent Change in Enrollment by State, School Years 2013-14 to 2015-16
- Table 12: Top 100 Districts Based on Alternative School Enrollment, School Year 2015-16
Appendix III: Comments from the Department of Education
Appendix IV: GAO Contact and Staff Acknowledgments
GAO Contact
Jacqueline M. Nowicki, (617) 788-0580, nowickij@gao.gov
Staff Acknowledgments
In addition to the contact name above, Sherri Doughty (Assistant Director), Cady S. Panetta (Analyst-in-Charge), Eve Weisberg, Holly Dye, Brian Egger, John Mingus, and James Rebbe made key contributions to this report. Also contributing were James Bennett, Deborah Bland, David Blanding, Kelsey Kreider, Sheila R. McCoy, Austin Sprinkles, and Daren Sweeney.
References
Figures
- Under/Overrepresentation at Alternative Schools, School Year 2015-16
- Figure 1: Enrollment Declines between School Years 2013-14 and 2015-16 and Over/Underrepresentation in School Year 2015-16 at Alternative Schools Compared to Nonalternative Schools by Demographic Group
- Figure 2: Student Enrollment in Alternative and Nonalternative Schools, by Demographic Group, School Year 2015-16
- Figure 3: Percentage of Students Transferred to Alternative Schools for Disciplinary Reasons, School Year 2015-16
- Figure 4: Percentage of Public Schools That Are Alternative by District, School Year 2015-16
Tables
- Table 1: Student Enrollment in K-12 Public Schools, by Race, Sex, and Disability Status, School Year 2015-16
- Table 2: Over/Underrepresentation in Enrollment at Alternative Schools Compared to Nonalternative Schools by Demographic Group by School Type and Focus, School Year 2015-16
- Table 3: Change and Percent Change in Number of Alternative School Students Disciplined by Demographic Group and Type of Discipline, School Years 2013-14 to 2015-16
- Table 4: Percentage of Nonalternative and Alternative Schools with Specific Types of Support Staff, School Year 2015-16
- Table 5: Definitions of Support Staff
- Table 6: Disciplinary Actions Used in Analysis of the Civil Rights Data Collection (CRDC)
- Table 7: Race and Ethnicity Variables Used in Analysis of the Civil Rights Data Collection (CRDC)
- Table 8: Types of Alternative Schools
- Table 9: Alternative Schools by Focus
- Table 10: Locale Variables Used from the Common Core of Data (CCD)
- Table 11: Enrollment at Alternative Schools and Percent Change in Enrollment by State, School Years 2013-14 to 2015-16
- Table 12: Top 100 Districts Based on Alternative School Enrollment, School Year 2015-16
Abbreviations
| Abbreviation | Description |
|---|---|
| CCD | Common Core of Data |
| CRDC | Civil Rights Data Collection |
| Education | U.S. Department of Education |
| Justice | U.S. Department of Justice |
| NCES | U.S. Department of Education, National Center for Education Statistics |
| OCR | U.S. Department of Education, Office for Civil Rights |
| OJJDP | U.S. Department of Justice, Office of Juvenile Justice and Delinquency Prevention |
| SAMHSA | Substance Abuse and Mental Health Services Administration |
End Notes
Contacts
Jacqueline M. Nowicki
Director, Education, Workforce, and Income Security Issues, nowickij@gao.gov, (617) 788-0580Congressional Relations
U.S. Government Accountability Office
441 G Street NW, Room 7125, Washington, DC 20548
Public Affairs
U.S. Government Accountability Office
441 G Street NW, Room 7149, Washington, DC 20548
Strategic Planning and External Liaison
U.S. Government Accountability Office
441 G Street NW, Room 7814, Washington, DC 20548
Download a PDF Copy of This Report
Obtaining Copies of GAO Reports and Testimony
Order by Phone
To Report Fraud, Waste, and Abuse in Federal Programs
Automated answering system: (800) 424-5454 or (202) 512-7470
Connect with GAO
GAO’s Mission
Copyright
(102775)