LIMB LOSS
Rehabilitation Services and Outcomes for Medicare Beneficiaries
Report to Congressional Requesters
October 2024
GAO-25-106406
United States Government Accountability Office
View GAO‑25-106406. For more information, contact Leslie V. Gordon at (202) 512-7114 or GordonLV@gao.gov.
Highlights of GAO‑25‑106406, a report to congressional requesters
October 2024
LIMB LOSS
Rehabilitation Services and Outcomes for Medicare Beneficiaries
Why GAO Did This Study
The loss of a limb—all or part of an arm or leg—is a life-altering event. It is estimated that over 2 million individuals in the United States live with limb loss. That number is expected to almost double by 2050, according to researchers. Individuals 65 and older are at the greatest risk of having amputation surgery.
GAO was asked to review the health care services for individuals with limb loss. This report describes (1) characteristics of traditional Medicare beneficiaries who lost a limb in 2016, (2) the percent of those who received rehabilitative services or prosthetic limbs, (3) the percent of those who experienced selected health outcomes, and (4) challenges to obtaining rehabilitative services and prosthetic limbs. The report also includes information about care for veterans with limb loss received from the Veterans Health Administration (VHA).
To do this work, GAO analyzed traditional fee-for-service Medicare claims and beneficiary enrollment data from the Centers for Medicare & Medicaid Services (CMS), for the years 2016 through 2019. GAO also reviewed VHA data and information. GAO also interviewed officials from CMS and VHA and representatives from 10 stakeholder groups representing health care providers, patients, and prosthetics and rehabilitation facility industry groups.
The Departments of Health and Human Services and Veterans Affairs reviewed a draft of this report and provided technical comments, which GAO incorporated as appropriate.
What GAO Found
Medicare data show that 50,202 beneficiaries enrolled in traditional Medicare lost a limb in 2016. Of these, most lost a lower limb (96 percent) and were White (66 percent). Black, Hispanic, and dual-eligible for Medicare and Medicaid beneficiaries were disproportionately affected by limb loss. For example, 21 percent of beneficiaries who lost a limb in 2016 were Black, while 8 percent of beneficiaries in traditional Medicare that year were Black. 2016 was the first full year of claims data available using current medical coding and 2019 was the last full year of claims data prior to the start of the COVID-19 pandemic.
Medicare covers services for beneficiaries with limb loss, such as rehabilitative services and prosthetic limbs, if medically necessary and after other conditions are met. Of beneficiaries in traditional Medicare who lost a limb in 2016, nearly all received at least one selected rehabilitative service and 30 percent received a prosthetic limb from 2016 through 2019 (see figure).
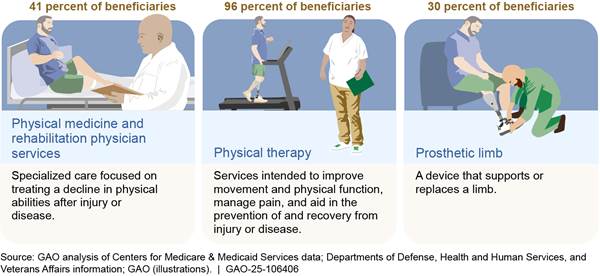
Note: Rehabilitative services and prosthetic limbs may not be medically necessary or appropriate for all beneficiaries who lost a limb. N=50,202 beneficiaries.
Most beneficiaries in traditional Medicare with limb loss in 2016 experienced adverse health outcomes within 4 years. For example, 61 percent of beneficiaries died within 4 years, compared to 20 percent of all beneficiaries in traditional Medicare. A stakeholder representing providers said beneficiaries who experience limb loss do not necessarily die as a direct result of losing a limb. Instead, underlying health conditions in individuals living with limb loss (e.g., diabetes and vascular disease) contribute to a beneficiary’s overall health and could lead to fatal events such as heart attacks, according to this stakeholder. For example, 71 percent of beneficiaries with limb loss in 2016 had diabetes compared to 24 percent of all beneficiaries in traditional Medicare.
The 10 stakeholders GAO interviewed reported challenges beneficiaries with limb loss face that could affect their ability to access care, such as issues with care coordination among health care providers and affordability of prosthetic limbs.
This is a work of the U.S. government and is not subject to copyright protection in the United States. The published product may be reproduced and distributed in its entirety without further permission from GAO. However, because this work may contain copyrighted images or other material, permission from the copyright holder may be necessary if you wish to reproduce this material separately.
Abbreviations
CMS Centers for Medicare & Medicaid Services
HCPCS Health Care Common Procedure Coding System
PMR physical medicine and rehabilitation
VHA Veterans Health Administration
October 23, 2024
Congressional Requesters
The loss of a limb—all or part of an arm or leg—is a life-altering event that can result in significant emotional, physical, and financial consequences. Individuals living with limb loss may have reduced mobility and can face challenges performing daily activities, such as cooking and bathing.
Estimates indicate there are over 2 million individuals in the United States living with limb loss.[1] This number is projected to increase to 3.6 million by 2050 driven by an aging population and high rates of vascular disease. Almost 200,000 individuals are estimated to experience limb loss each year. In most cases, individuals experience limb loss due to either the effects of disease or after sustaining a traumatic injury. For example, complications from diabetes, vascular disease, or traumatic injuries can lead to damage that is severe enough to require an amputation surgery.[2] Amputation surgeries remove all or part of a limb to prevent further spread and potentially prolong an individual’s life.
Research shows that the risk of experiencing limb loss increases with age, with individuals 65 and older at the greatest risk of medical conditions that require an amputation surgery.[3] The Medicare program, administered by the Centers for Medicare & Medicaid Services (CMS), offers health insurance coverage to seniors and other beneficiaries that includes help to pay for care following limb loss.[4] This care can include medical and surgical services; rehabilitation services, such as physical and occupational therapy; and prosthetic limbs that can help restore mobility and function.
You asked us to review the care received by Medicare beneficiaries who experienced limb loss and any challenges that may have limited their ability to obtain care.[5]
In this report, we focus on beneficiaries in the traditional fee-for-service Medicare program prior to the COVID-19 pandemic.[6] This report describes:
1. the characteristics of beneficiaries who lost a limb in 2016;
2. the percentage of beneficiaries who lost a limb in 2016 and received rehabilitative services or prosthetic limbs from 2016 through 2019;
3. the percentage of beneficiaries who lost a limb in 2016 who experienced selected health outcomes from 2016 through 2019; and
4. challenges beneficiaries with limb loss face in obtaining rehabilitative services and prosthetic limbs.
To address the first three objectives, we analyzed CMS Medicare fee-for-service claims and enrollment data from 2016 through 2019 for beneficiaries in traditional Medicare who lost a limb following an amputation surgery in 2016. We chose this time period because 2016 is the earliest full year when claims data were available using International Classification of Diseases 10th revision codes and 2019 was the last full year of claims data prior to the start of the COVID-19 pandemic, which significantly disrupted health care service delivery.[7]
We categorized limb loss by site (upper limb or lower limb) and by type of amputation (major or minor).[8] We analyzed beneficiary claims and enrollment data to determine characteristics such as race and ethnicity, age, dual-eligible status, geographic region, location in an urban or rural area, Medicare entitlement, and selected health conditions.[9] We analyzed claims data to determine which beneficiaries received certain rehabilitative services at least once—physical medicine and rehabilitation (PMR) physician services and physical and occupational therapies—and prosthetic limbs. We also analyzed claims data to determine Medicare and beneficiary expenditures for prosthetic limbs from 2016 through 2019. Using claims and enrollment data, we determined which beneficiaries experienced selected health outcomes—mortality, major amputation on the same limb following a minor amputation, or emergency department visits—from 2016 through 2019. We selected health outcomes from among those CMS monitors for access to durable medical equipment, prosthetics, orthotics, and supplies items.[10]
We assessed the reliability of CMS Medicare fee-for-service claims and enrollment data used for this report by reviewing relevant documentation and written responses from CMS officials. The data are used by the Medicare program as a record of payments to health care providers and are monitored by both CMS and the Medicare contractors that process, review, and pay claims. We also performed electronic data tests to check for missing data or obvious errors. Based on these steps, we determined the data were reliable for our purposes. For more information about our analysis of CMS’s Medicare data, see appendix III.
To describe any challenges beneficiaries in traditional Medicare may face to obtain rehabilitative services and prosthetic limbs, we interviewed representatives from a nongeneralizable sample of 10 stakeholder groups representing health care providers, patients, and prosthetics and rehabilitation facility industry groups with experience and knowledge in care for individuals with limb loss.[11]
To inform all our work, we reviewed relevant studies and reports about individuals with limb loss identified by the agency officials and stakeholder groups we interviewed, and searches we conducted in databases, including PubMed and SCOPUS, to identify research published from 2013 through 2023 on the characteristics of individuals with limb loss, their access to rehabilitative services and prosthetic limbs, and related adverse health outcomes.
We conducted this performance audit from November 2022 to October 2024 in accordance with generally accepted government auditing standards. Those standards require that we plan and perform the audit to obtain sufficient, appropriate evidence to provide a reasonable basis for our findings and conclusions based on our audit objectives. We believe that the evidence obtained provides a reasonable basis for our findings and conclusions based on our audit objectives.
Background
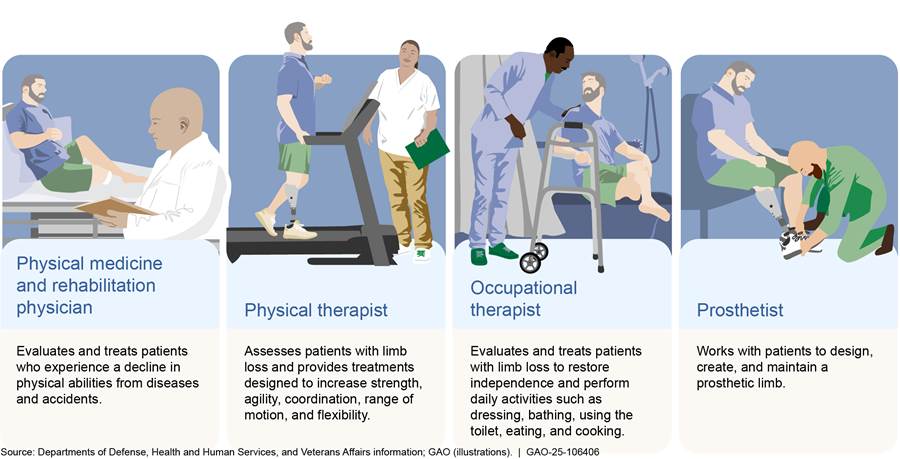
The loss of a limb can have significant short and long-term consequences for a person’s recovery and well-being. The care that is needed after limb loss may involve a range of health care providers and can involve years of treatment. Following limb loss, an individual may begin rehabilitation to help strengthen muscles, improve range of motion, and learn new ways to perform daily activities, such as personal hygiene. An individual may work with different types of health care providers depending on their circumstances (see fig. 1).
Some rehabilitative services—such as PMR physician services and physical and occupational therapies—may be prescribed by a health care provider after limb loss based on medical necessity and the individual’s health status, as determined by clinical assessments.
· PMR physician services include evaluation of a patient to guide treatments and prescriptions for therapies (e.g., physical therapy) and medications to improve physical function.
· Physical therapy includes treatments to improve movement and physical function, manage pain, and recover from and prevent injury and chronic disease.
· Occupational therapy includes treatments to support activities of daily living (e.g., bathing) through services to promote the physical and mental health of individuals.
Individuals living with limb loss may consider obtaining a prosthetic limb, a device that supports or replaces a limb or function. Prosthetic limbs may include prosthetic arms, legs, hands, and feet as well as other devices to replace a portion of a hand or foot. These devices can help to enhance the performance of social, professional, and leisure activities and improve the individual’s quality of life. A variety of health care providers can prescribe a prosthetic limb, including surgeons and primary care, family medicine, and physical medicine and rehabilitation physicians. If a health care provider determines a prosthetic limb is appropriate, and the individual chooses to be fitted for one, then various professionals, including PMR physicians, physical and occupational therapists, and prosthetists can help the individual learn how to use and care for a prosthetic limb.
Prosthetic limbs may include different types of technology; for example, joints with sensors that adjust in real-time to a wearer’s movement (e.g., microprocessor knee). Prosthetic limbs can be made of a variety of components with different capabilities depending on the needs of the individual. See figure 2 for examples of prosthetic limbs and their related components.
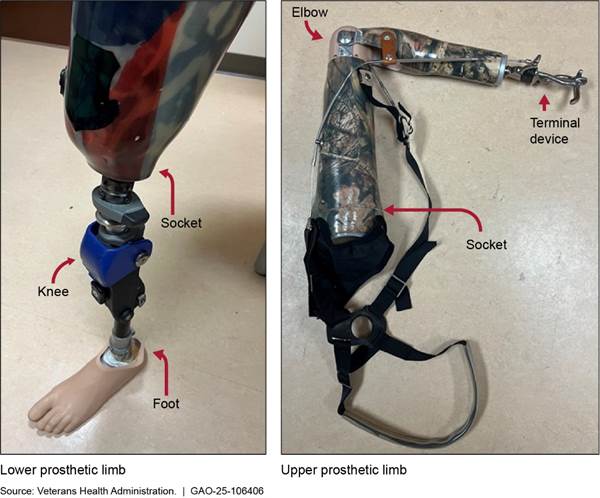
Basic types of components include the following:
· Sockets. Sockets are custom molded components that fit over an individual’s residual limb. They provide a connection to the rest of the limb components. Residual limbs can change in size and shape over time (e.g., changes in body weight or muscle atrophy), which may result in the need for a new socket. A poor fitting socket can cause pain or damage the wearer’s skin.
· Knee and elbow joints. These components allow the lower leg or forearm to move. For example, some prosthetic knee joints use hydraulic systems to control the movement of the lower leg while walking. Advanced components known as microprocessor knees use computer assistance to constantly adjust resistance in the knee. This technology can support more active lifestyles by improving the wearer’s balance over uneven ground.
· Feet, hands, and terminal devices. These components come in many forms. Some closely resemble typical feet or hands, while others are tailored to perform specialized tasks, such as hooks for heavy-duty work tasks. Advanced components known as myoelectric hands can move fingers in response to signals from muscles in the residual limb.
Most Beneficiaries with Limb Loss Had Lower Limb Amputations and Certain Groups with Limb Loss Were Disproportionately Affected
Medicare data show that 50,202 beneficiaries in traditional Medicare lost part or all of a limb following an amputation surgery in 2016.[12] About 96 percent of these beneficiaries had lower limb amputations, while about 4 percent had upper limb amputations. See figure 3 below for additional information.
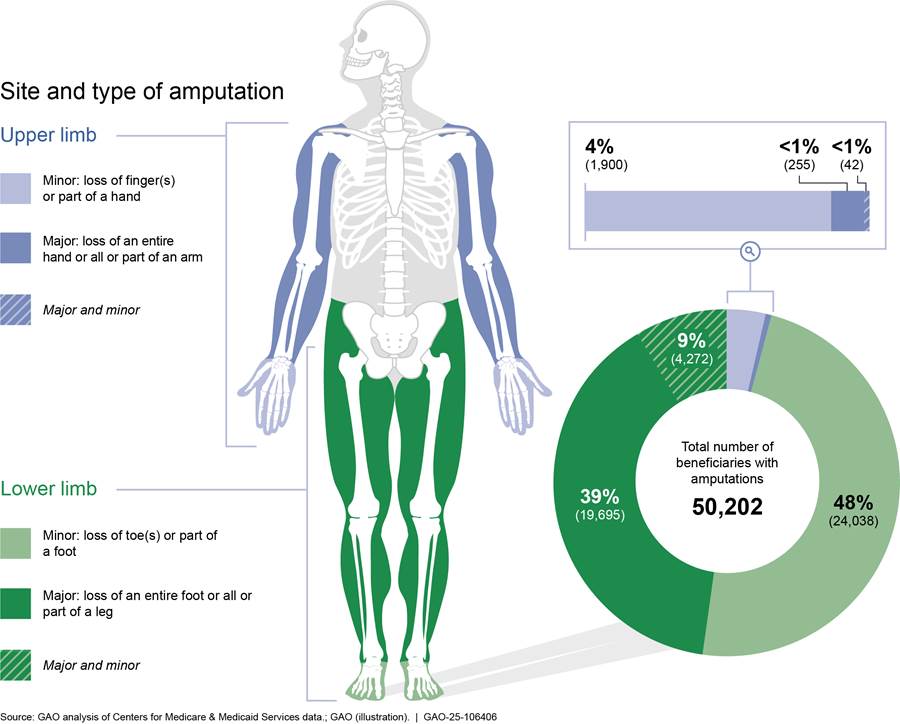
Note: The shaded areas of the body indicate the approximate area where an amputation may occur. A beneficiary who experienced limb loss in 2016 means a beneficiary in traditional Medicare who had an amputation surgery in 2016 based on our analysis of Medicare fee-for-service claims data. Beneficiaries were grouped based on amputation surgical procedure codes into minor or major amputations on one or both sides of the body. For example, left foot and right toe or right finger and left hand. Beneficiaries who had major and minor amputations could have lost, for example, a finger and hand or toe and foot in 2016.
Most beneficiaries in 2016 who experienced limb loss were White (66 percent), entitled to Medicare due to their age (68 percent), male (66 percent), lived in urban areas (71 percent) and the southern region of the U.S. (45 percent), and not eligible for Medicaid (62 percent). For more information, see table 1 below.
|
Category |
Number of beneficiaries |
Percent of beneficiaries |
|
Race and ethnicity |
||
|
White |
33,155 |
66.0 |
|
Black |
10,272 |
20.5 |
|
Hispanic |
4,687 |
9.3 |
|
American Indian/Alaska Native |
827 |
1.6 |
|
Other/Unknown |
657 |
1.3 |
|
Asian |
604 |
1.2 |
|
Total |
50,202 |
100.0 |
|
Medicare entitlementa |
||
|
Aged |
34,017 |
67.8 |
|
Disabled |
15,087 |
30.1 |
|
End stage renal disease |
1,098 |
2.2 |
|
Total |
50,202 |
100.0 |
|
Gender |
||
|
Male |
32,930 |
65.6 |
|
Female |
17,272 |
34.4 |
|
Total |
50,202 |
100.0 |
|
Rurality |
||
|
Rural |
14,353 |
28.6 |
|
Urban |
35,843 |
71.4 |
|
Total |
50,196 |
100.0 |
|
Region |
||
|
Northeast |
9,155 |
18.2 |
|
South |
22,542 |
44.9 |
|
Midwest |
10,807 |
21.5 |
|
West |
7,684 |
15.3 |
|
Total |
50,188 |
100.0 |
|
Dual-eligibleb |
||
|
Not eligible |
31,001 |
61.8 |
|
Eligible |
19,201 |
38.2 |
|
Total |
50,202 |
100.0 |
Source: GAO analysis of Centers for Medicare & Medicaid Services data. | GAO‑25‑106406
Note: A beneficiary who experienced limb loss in 2016 is defined as a beneficiary in traditional Medicare who had an amputation surgery in 2016 based on our analysis of Medicare fee-for-service claims data. The total number of beneficiaries (50,202) varied across each category due to missing data.
aMedicare is available to three groups of people: (1) aged: individuals aged 65 years or older; (2) disabled: individuals entitled to Social Security benefits due to disability; and (3) end stage renal disease: individuals with permanent kidney failure requiring dialysis or a transplant.
bDual-eligible beneficiaries are individuals who are enrolled in both Medicare and Medicaid, a joint federal-state program that provides health care coverage for individuals with low incomes.
While the majority of traditional Medicare beneficiaries who lost a limb in 2016 were White, certain other groups were disproportionately affected by limb loss. For example, 21 percent of beneficiaries who lost a limb in 2016 were Black, even though 8 percent of beneficiaries in traditional Medicare that year were Black. A greater percentage of beneficiaries (38 percent) were dual-eligible—individuals enrolled in Medicare and eligible for Medicaid, a joint federal-state program that provides health care coverage for individuals with low incomes—compared to all beneficiaries (18 percent). See table 2 below.[13]
|
Characteristic/category |
Percent of beneficiaries who experienced limb loss in 2016 |
Percent of all beneficiaries in 2016 |
|
Race and ethnicity |
||
|
White |
66.0 |
81.6 |
|
Black |
20.5 |
8.3 |
|
Hispanic |
9.3 |
5.1 |
|
American Indian/Alaska Native |
1.6 |
0.6 |
|
Other/Unknown |
1.3 |
2.0 |
|
Asian |
1.2 |
2.4 |
|
Total |
100.0 |
100.0 |
|
Medicare entitlementa |
||
|
Aged |
67.8 |
85.9 |
|
Disabled |
30.1 |
14.0 |
|
End stage renal disease |
2.2 |
0.2 |
|
Total |
100.0 |
100.0 |
|
Gender |
||
|
Male |
65.6 |
45.1 |
|
Female |
34.4 |
54.9 |
|
Total |
100.0 |
100.0 |
|
Rurality |
||
|
Rural |
28.6 |
28.0 |
|
Urban |
71.4 |
72.0 |
|
Total |
100.0 |
100.0 |
|
Region |
|
|
|
Northeast |
18.2 |
18.6 |
|
South |
44.9 |
39.6 |
|
Midwest |
21.5 |
22.7 |
|
West |
15.3 |
19.1 |
|
Total |
100.0 |
100.0 |
|
Dual-eligibleb |
||
|
Not eligible |
61.8 |
82.2 |
|
Eligible |
38.2 |
17.8 |
|
Total |
100.0 |
100.0 |
|
Diabetesc |
||
|
Yes |
71.0 |
24.0 |
|
No |
29.0 |
76.0 |
|
Total |
100.0 |
100.0 |
|
Vascular diseased |
|
|
|
Yes |
29.0 |
13.0 |
|
No |
71.0 |
87.0 |
|
Total |
100.0 |
100.0 |
Source: GAO analysis of Centers for Medicare & Medicaid Services data. | GAO‑25‑106406
Note: A beneficiary who experienced limb loss in 2016 means a beneficiary who had an amputation surgery in 2016 based on our analysis of Medicare fee-for-service claims data. The total number of beneficiaries across each characteristic varies due to missing data.
aMedicare is available to three groups of people: (1) aged: individuals aged 65 years or older; (2) disabled: individuals entitled to Social Security benefits due to disability; and (3) end stage renal disease: individuals with permanent kidney failure requiring dialysis or a transplant.
bDual-eligible beneficiaries are individuals who are dually enrolled in both Medicare and Medicaid, a joint federal-state program that provides health care coverage for individuals with low incomes.
cDiabetes is a disease that occurs when a person’s blood glucose is too high. Over time, having too much glucose in the blood can cause health problems, such as heart disease, nerve damage, and vascular disease, among other conditions.
dVascular disease includes any disease process affecting blood vessels in the body. Examples include peripheral artery disease—narrowing of the blood vessels outside the heart—and carotid artery disease—narrowing of vessels that supply blood to the head and brain.
Our findings are consistent with some published literature that shows some racial and demographic groups in traditional Medicare experience higher rates of limb loss. Specifically, the researchers of these published articles have observed racial and socioeconomic disparities among individuals who undergo amputation procedures.[14] For example, one study found that Blacks and those of lower socioeconomic status had higher rates of amputation procedures.[15]
Over Ninety Percent of Beneficiaries in Traditional Medicare Who Experienced Limb Loss Received at Least One Rehabilitative Service
Nearly all of the 50,202 beneficiaries in traditional Medicare who experienced limb loss in 2016 received at least one rehabilitative service—PMR physician services and physical and occupational therapies—from 2016 through 2019.[16] We found 30 percent of beneficiaries who experienced limb loss received a prosthetic limb from 2016 through 2019.[17] The percentage of beneficiaries who received each type of rehabilitative service or prosthetic limbs ranged from 30 to 96 percent.[18] Among those who received rehabilitative services or prosthetic limbs from 2016 through 2019, we observed differences by type of amputation and beneficiary characteristics, such as Medicare entitlement.
Beneficiaries are eligible to receive covered rehabilitative services or prosthetic limbs if a health care provider determines those services are medically necessary as a specific and effective treatment for a medical condition, after other conditions are met.[19] For example, a beneficiary may not have issues performing activities of daily living (e.g., bathing or using the bathroom)—therefore, a provider would not recommend occupational therapy because it would not be medically necessary. In another example, a beneficiary who is paralyzed below the waist may be unable to use a prosthetic limb and therefore, a prosthetic limb would not be considered nor prescribed.
Rehabilitative services. Nearly all 50,202 beneficiaries who lost a limb received at least one rehabilitative service, according to our analysis of CMS fee-for-service claims data from 2016 through 2019. Specifically, we found 41 percent received PMR physician services, 89 percent received occupational therapy, and 96 percent received physical therapy.[20] See figure 4 for the percent of beneficiaries who received at least one rehabilitative service by site of amputation.
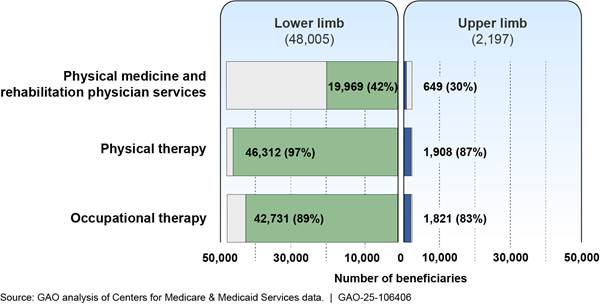
Note: A beneficiary who experienced limb loss in 2016 means a beneficiary who had an amputation surgery in 2016 based on our analysis of Medicare fee-for-service claims data. An upper limb amputation includes loss of all or part of a hand or arm. A lower limb amputation includes loss of all or part of a foot or leg. Rehabilitative services may not be medically necessary or appropriate for all beneficiaries who lost a limb. N=50,202 beneficiaries.
Over 90 percent of beneficiaries with limb loss received at least one physical or occupational therapy service in an institutional setting from 2016 through 2019, such as during a hospital or inpatient rehabilitation facility stay.[21] For example, services provided after an amputation surgery to help a beneficiary recover and gain strength. Fewer beneficiaries received physical and occupational therapies in non-institutional settings, such as outpatient clinics from 2016 through 2019.[22]
We observed minor differences by site of amputation among beneficiaries who received rehabilitative services from 2016 through 2019. For example, a greater percentage of beneficiaries who experienced lower limb loss received PMR physician services (42 percent) compared to those with upper limb loss (30 percent). Slightly more beneficiaries who experienced lower limb loss received physical therapy (97 percent) compared to those with upper limb loss (87 percent).
We also observed some beneficiary groups received rehabilitative services at higher rates than others from 2016 through 2019 (see appendix IV). For example, there was regional variation in the percentage of beneficiaries who received PMR physician services in 2016, ranging from 50 percent in the northeast region of the United States to 33 percent in the western region.[23] According to representatives from a provider group we interviewed, there are more PMR physicians located in the coastal areas of the United States, especially in the Mid-Atlantic states.
Prosthetic limbs. Thirty percent of the 50,202 beneficiaries in traditional Medicare who experienced limb loss in 2016 received a prosthetic limb at some point from 2016 through 2019, according to our analysis of CMS fee-for-service claims data.
We observed differences by site of amputation among beneficiaries who received prosthetic limbs from 2016 through 2019. For example, 31 percent of beneficiaries who experienced lower limb loss received a prosthetic limb compared to 4 percent who experienced upper limb loss (see figure 5 below).[24]
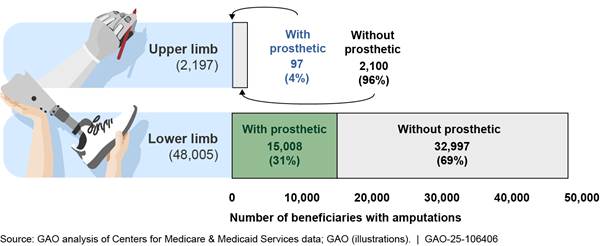
Note: A beneficiary who experienced limb loss in 2016 means a beneficiary who had an amputation surgery in 2016 based on our analysis of Medicare fee-for-service claims data. An upper limb amputation includes loss of all or part of a hand or arm. A lower limb amputation includes loss of all or part of a foot or leg. A prosthetic limb may not be medically necessary or appropriate for all beneficiaries who lost a limb. N=50,202 beneficiaries.
We observed some beneficiary groups received prosthetic limbs at higher rates than others from 2016 through 2019 (see appendix IV). For example, slightly more beneficiaries entitled to Medicare due to a disability (39 percent) received a prosthetic limb compared to those entitled to Medicare due to age (26 percent).
Most Beneficiaries in Traditional Medicare Experienced Adverse Health Outcomes After Their Limb Loss, including Death within 4 Years
Most beneficiaries in traditional Medicare who lost a limb in 2016 later experienced adverse health outcomes within 4 years, according to our analysis of Medicare claims data. Specifically, we found high mortality rates for beneficiaries who experienced limb loss in 2016 compared to all beneficiaries in traditional Medicare.[25] For example, 61 percent of beneficiaries who lost a limb in 2016 died by 2019 compared to 20 percent of all beneficiaries in traditional Medicare.
Among beneficiaries who experienced limb loss in 2016, 71 percent had diabetes and 29 percent had vascular disease, according to our analysis of CMS data. Such underlying health conditions are contributing factors to the beneficiary’s overall health and could lead to fatal events such as heart attacks, according to representatives from a provider group we interviewed. Beneficiaries who experience limb loss do not necessarily die as a direct result of losing a limb, these officials told us. (See appendix IV for more information on the prevalence of certain health conditions for Medicare beneficiaries who experienced limb loss in 2016.).
Our findings are similar to other studies that found high mortality rates among individuals who experienced limb loss and had certain underlying health conditions. For example, for beneficiaries who lost a limb in 2016, we found annual mortality rates from 2016 through 2019 ranging from 18 to 23 percent.[26] Two studies found annual mortality rates between 23 and 44 percent for individuals with vascular disease who experienced lower limb loss.[27] Another research study found an annual mortality rate of 13 percent for individuals with diabetes who had a lower limb amputation.[28]
Beneficiaries who lost a limb in 2016 also experienced other adverse health outcomes, based on our claims analysis. For example, we found the following:
· 92 percent of beneficiaries who lost a limb in 2016 had at least one emergency department visit from 2016 through 2019, which indicates a beneficiary in need of immediate medical care for a potential life-threating health condition.[29]
· 19 percent of beneficiaries who had a minor amputation in 2016 later had a major amputation on the same limb by 2019.[30] Beneficiaries with diabetes or vascular disease may develop complications from those diseases, such as chronic infections. These complications may require further amputations of the limb over time, indicating disease progression.
Stakeholders Identified Various Challenges Beneficiaries Faced to Obtain Certain Services
Beneficiaries in traditional Medicare face a variety of challenges obtaining rehabilitative services and prosthetic limbs according to stakeholder organizations.[31] Representatives from stakeholder organizations noted that care coordination, coverage policies for certain prosthetic limbs, and affordability of prosthetic limbs could limit access to rehabilitative services and prosthetic limbs.
Care Coordination Challenges
 Representatives
we interviewed from nine of 10 stakeholder organizations in our review
identified care coordination among health providers as a challenge experienced
by individuals with limb loss, including beneficiaries in traditional Medicare
(see text box).[32]
For example, representatives from one patient group said patients who have a
prescription for a prosthetic limb may experience challenges finding a
prosthetist because follow-up care is not well coordinated.
Representatives
we interviewed from nine of 10 stakeholder organizations in our review
identified care coordination among health providers as a challenge experienced
by individuals with limb loss, including beneficiaries in traditional Medicare
(see text box).[32]
For example, representatives from one patient group said patients who have a
prescription for a prosthetic limb may experience challenges finding a
prosthetist because follow-up care is not well coordinated.
Source: Agency for Healthcare Research and Quality. | GAO‑25‑106406
Representatives from two provider groups said the lack of care coordination may limit beneficiaries’ ability to receive rehabilitative services. For example, representatives from one group said health care providers, such as a primary care physician, may not have experience working with occupational therapists and therefore may not refer a beneficiary for occupational therapy after an amputation surgery.
Representatives from one provider group said coordinated care is essential, because navigating their health care needs after experiencing limb loss can be financially, physically, and emotionally overwhelming for patients.
Coverage for Certain Types of Prosthetic Limbs
Representatives from stakeholder organizations we interviewed described challenges beneficiaries experience due to Medicare’s coverage policies for secondary prosthetic limbs or those with advanced components.
Secondary limbs. Representatives from five of the 10 stakeholder organizations noted that beneficiaries may be unable to easily obtain more than one prosthetic limb at a time because Medicare does not cover it. For example, a representative said beneficiaries may benefit from additional activity-specific prosthetic limbs, such as for showering and swimming.[33] Representatives from a provider group said reductions in physical activity may result in worse overall health for individuals with limb loss. A representative from that provider group further stated that declines in health could be avoided if beneficiaries received a prosthetic limb to engage in recreational activities.
|
Medicare Functional Classification Level for Lower Prosthetic Limbs Medicare uses a beneficiary’s functional classification level to help determine if a prescribed limb type or technology is appropriate. The classification level is based on potential functional ability. A physician conducts a clinical assessment to determine a beneficiary’s potential functional ability and assign one of the following ratings: Level 0: No ability or potential to ambulate and a prosthetic limb does not enhance quality of life or mobility. Level 1: Ability or potential to use a prosthetic limb for ambulation on level surfaces typical of someone walking in their home. Level 2: Ability or potential to use a prosthetic limb across low level environmental barriers—curbs or uneven surfaces—typical of someone walking outside the home. Level 3: Ability or potential to use a prosthetic limb across most environmental barriers typical of someone walking outside of the home and may have the ability to engage in vocational, therapeutic, or exercise activity. Level 4: Ability or potential to use a prosthetic limb that exceeds basic walking skills, exhibiting high impact, stress, or energy levels typical of an active adult or athlete. Source: Centers for Medicare & Medicaid Services. | GAO‑25‑106406 |
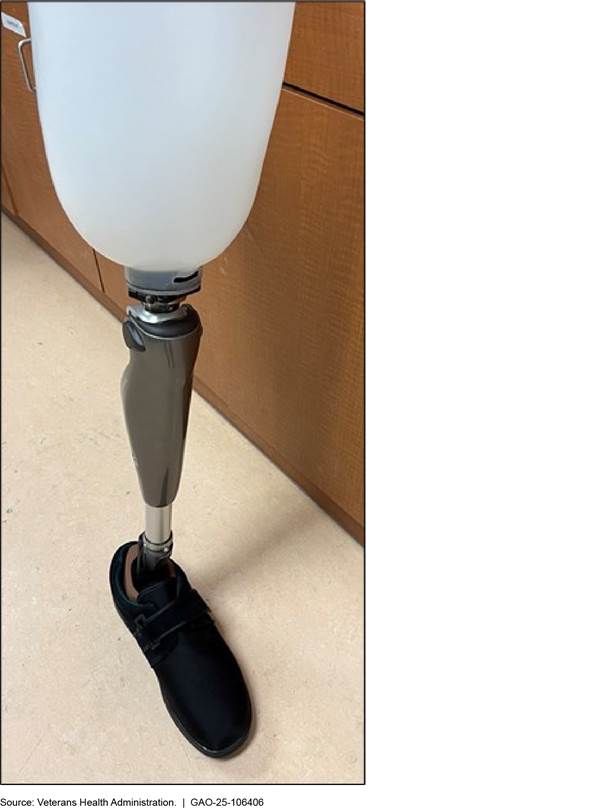
Microprocessor lower limbs. Representatives from five of the 10 stakeholder organizations said beneficiaries may face barriers obtaining a lower prosthetic limb powered by a microprocessor, an artificial joint that uses computer assistance to constantly adjust resistance. Specifically, Medicare’s coverage policies require a beneficiary to have a higher potential functional ability to receive this type of limb (see sidebar).[34]
Representatives from one stakeholder group stated that microprocessor lower prosthetic limbs could enhance mobility and increase safety by reducing falls in beneficiaries with limited rehabilitation potential and mobility.[35] In January 2024, CMS released a proposal seeking public comments on expanding coverage for microprocessor knees.[36] See figure 4 below for a photo of a lower prosthetic limb with a microprocessor knee.
Affordability of Prosthetic Limbs
Representatives from four of 10 stakeholder organizations said beneficiaries face high costs for a prosthetic limb including from Medicare’s 20 percent cost sharing requirement.[37] A representative of a provider organization said patients may struggle to pay for prosthetic limbs. The average amount a beneficiary paid from 2016 to 2019 in out-of-pocket costs for prosthetic limbs and associated components was $3,580 while the average Medicare expenditure per beneficiary was $13,546, according to our claims analysis.
Agency Comments
We provided a draft of this report to the Departments of Health and Human Services and Veterans Affairs. The Departments of Health and Human Services and Veterans Affairs provided technical comments, which we incorporated as appropriate.
We are sending copies of this report to the appropriate congressional committees, the Secretaries of Health and Human Services and Veterans Affairs, the Administrator for the Centers for Medicare & Medicaid Services, and other interested parties. In addition, the report is available at no charge on the GAO website at http://www.gao.gov. If you or your staff have any questions about this report, please contact me at (202) 512-7114 or GordonLV@gao.gov. Contacts points for our Offices of Congressional Relations and Public Affairs may be found on the last page of this report. GAO staff who made key contributions to this report are listed in appendix V.

Leslie V. Gordon
Director
Health Care
List of Requesters
The Honorable Bob Casey
Chairman
Special Committee on Aging
United States Senate
The Honorable Brett Guthrie
Chairman
Subcommittee on Health
Committee on Energy and Commerce
House of Representatives
The Honorable Marsha Blackburn
United States Senate
The Honorable Tammy Duckworth
United States Senate
Background
The Veterans Health Administration (VHA) offers health care services to eligible veterans who experience limb loss—the loss of all or part of an arm or leg—from any cause.[38] These include medical and surgical services, rehabilitative care, such as physical and occupational therapy, as well as prosthetic limbs. VHA provides these limbs at no out-of-pocket cost, according to agency officials. VHA directives define care for veterans with limb loss.[39] VHA also publishes guidance to enhance the quality of this care.[40]
VHA provides outpatient care to veterans with limb loss through what are known as Outpatient Amputation Specialty Clinics. Amputation Specialty Clinic teams coordinate care, develop and update treatment plans, prescribe prosthetic limbs and components, and support ongoing health management for veterans with limb loss, according to VHA. Outpatient Amputation Specialty Clinics were available at 103 locations within Department of Veterans Affairs Medical Centers nationwide as of September 2023.
In addition, VHA has equipped 25 other Department of Veterans Affairs Medical Centers to provide more advanced care to veterans with limb loss. For example, these locations offer inpatient rehabilitation facilities and have laboratories where providers can build prosthetic limbs.
In this appendix, we describe the number and characteristics of veterans with limb loss who received VHA care as well as the surgical, rehabilitative, and prosthetic limb services VHA provided from fiscal years 2016 through 2019.[41]
Characteristics of Veterans with Limb Loss
More than 90,000 veterans living with limb loss received VHA care each year from fiscal year 2016 to 2019, and the total number of veterans receiving care grew 2 to 3 percent each year, according to our analysis of VHA data. The average age of veterans with limb loss was 68 years old and nearly all of them were male (between 97 and 98 percent). More than two-thirds of these veterans were White, 18 percent were Black or African American, and around 3 percent belonged to other racial categories on average (see table 3).
|
Race |
Number of veterans |
Percent of veterans |
|
American Indian or Alaska Native |
835 |
0.9 |
|
Asian |
317 |
0.3 |
|
Black or African American |
16,714 |
18 |
|
Declined to answer |
3,154 |
3.4 |
|
Multiple races |
770 |
0.8 |
|
Native Hawaiian or other Pacific Islander |
739 |
0.8 |
|
Unknown |
2,365 |
2.5 |
|
White |
68,206 |
73.3 |
|
Total |
93,098 |
100 |
Source: GAO analysis of VHA data. | GAO‑25‑106406
Note: According to VHA officials, the total number of amputations includes both minor and major amputations.
Almost three-quarters of these veterans experienced the loss of a lower limb only. Just over 20 percent experienced upper limb loss only. Around 4 percent experienced both lower and upper limb loss (see table 4).
|
Site of Amputation |
Number of veterans |
Percent of veterans |
|
Lower limb |
68,946 |
74 |
|
Upper limb |
20,844 |
22 |
|
Upper and lower limb |
3,307 |
4 |
|
Total |
93,098 |
100 |
Source: GAO analysis of VHA data. | GAO‑25‑106406
Note: According to VHA officials, the total number of amputations includes both minor and major amputations.
 Most
veterans experience limb loss because of diseases such as diabetes or vascular
disease, according to VHA research.[42]
On average, 58 percent of veterans with limb loss had diabetes from fiscal year
2016 to 2019.[43]
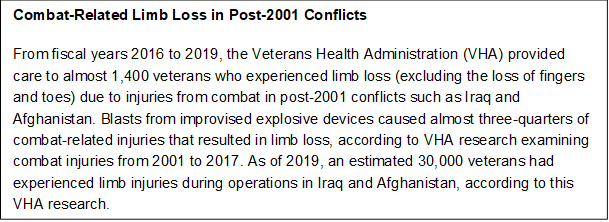
VHA told us it does not track the overall number of veterans who experienced
limb loss because of combat injuries. This is particularly true for veterans
who participated in conflicts before 2001. However, a VHA report states they
account for a relatively small percentage of the veterans under VHA care.[44] VHA collaborated with the Department
of Defense to better track limb loss in more recent conflicts (see text box).
Most
veterans experience limb loss because of diseases such as diabetes or vascular
disease, according to VHA research.[42]
On average, 58 percent of veterans with limb loss had diabetes from fiscal year
2016 to 2019.[43]
VHA told us it does not track the overall number of veterans who experienced
limb loss because of combat injuries. This is particularly true for veterans
who participated in conflicts before 2001. However, a VHA report states they
account for a relatively small percentage of the veterans under VHA care.[44] VHA collaborated with the Department
of Defense to better track limb loss in more recent conflicts (see text box).
Source: VHA data and Joseph B. Webster, “Lower Limb Amputation Care Across the Active Duty Military and Veteran Populations,” Physical Medicine and Rehabilitation Clinics of North America, vol. 30, no. 1 (February 2019): 89-109. | GAO‑25‑106406
Care and Outcomes for Veterans with Limb Loss
Amputation surgeries. As part of its health care for veterans, VHA offers amputation surgeries. Almost 7,000 veterans, on average, had amputation surgeries through VHA each year, based on fiscal year 2016 through 2019 data. Nearly all these surgeries were lower limb amputations—almost 95 percent (see table 5).
|
Site and type of amputation |
2016 |
2017 |
2018 |
2019 |
|
Upper limb |
|
|
|
|
|
Minor |
462 |
469 |
498 |
481 |
|
Major |
37 |
29 |
21 |
29 |
|
Subtotal |
499 (5.4 percent) |
498 (5.4 percent) |
519 (5.2 Percent) |
510 (5.1 Percent) |
|
Lower limb |
|
|
|
|
|
Minor |
5,407 |
5,360 |
6,052 |
6,332 |
|
Major |
3,263 |
3,371 |
3,333 |
3,231 |
|
Subtotal |
8,670 (94.6 percent) |
8,731 (94.6 percent) |
9,385 (94.8 percent) |
9,563 (94.9 percent) |
|
Total |
9,169 (100 percent) |
9,229 (100 percent) |
9,904 (100 percent) |
10,073(100 percent) |
Source: GAO analysis of VHA data. | GAO‑25‑106406
Note: Minor amputations include the loss either a toe or part of a foot (lower limb) or the loss of a finger or part of a hand (upper limb). Major amputations include the loss of either an entire foot or all or part of a leg (lower limb) or the loss of an entire hand or all or part of an arm (upper limb).
Outpatient Amputation Specialty Clinics. Around 62,000 veterans with limb loss visited Outpatient Amputation Specialty Clinics (clinic)—which offer a wide range of services—from fiscal year 2016 through 2019, according to VHA data. Clinic teams work with each veteran to set individual rehabilitation goals and define benchmarks for progress, according to VHA officials. Clinic teams educate veterans on rehabilitation options and the recommendations provided by team members, such as when a simpler or more advanced prosthetic limb would be a better option based on the veteran’s condition.
Clinic teams include core members and additional elective
members who provide support from a range of specialties as needed. Core team
members include a prescribing physician, a therapist, a prosthetist, and a
rehabilitation coordinator (see text box). Elective members can include social
workers, nurses, wound care specialists, podiatrists, vocational counselors,
mental health providers, and prosthetic representatives from 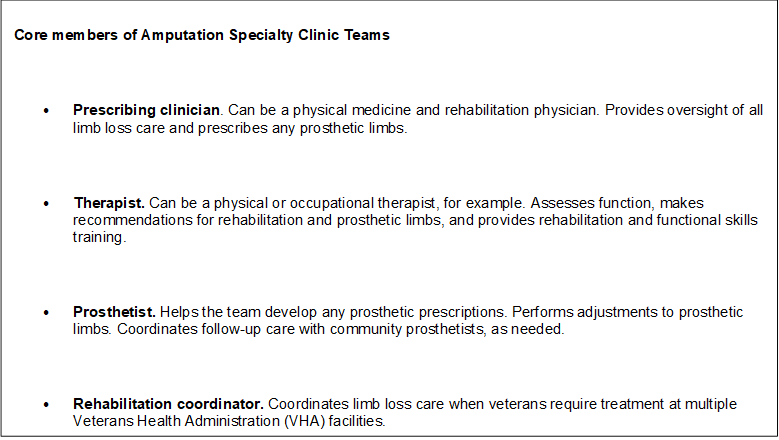 VHA’s
Prosthetic and Sensory Aids Services.[45]
VHA’s
Prosthetic and Sensory Aids Services.[45]
Source: GAO analysis of VHA policy directive 1173.3. | GAO‑25‑106406
Telehealth. VHA has used telehealth to provide care to veterans with limb loss. From 2009 to 2019, the annual number of telehealth visits for limb loss care grew from 44 to 3,905, according to one study.[46] In addition, clinics can use telehealth to provide veterans with access to specialist providers who work at more distant VHA clinic locations.[47]
Payments for prosthetic limbs and associated components. From fiscal year 2016 through 2019, roughly 30,000 veterans received a new prosthetic limb, replacement components for an older prosthetic limb, or a related service, according to our analysis of VHA data.[48] Most of these services involved lower prosthetic limbs (88 percent). On average, VHA spent about $7,600 per service. Overall, VHA spent $485 million to provide prosthetic limbs and associated components during our study period.
According to VHA, many of their facilities have contracts with community prosthetists to fabricate and fit prosthetic limbs for veterans. These prosthetists work with the clinic teams and may be invited to participate in clinic visits with the VHA teams.
Mortality rates. Between 7 and 8 percent of all veterans with limb loss who received VHA care died each year from fiscal year 2016 to 2019. Veterans with limb loss may experience potentially fatal cardiovascular conditions at higher rates than other veterans. For example, among World War II veterans, those with lower limb loss were up to 4 times more likely to die of cardiovascular disease, according to research cited in a VHA study.[49]
Data and Methods for Reviewing VHA Limb Loss Care
To describe the characteristics of veterans with limb loss and the care they received from VHA, we reviewed and analyzed summary data from VHA’s Amputee Data Repository and National Prosthetic Patient Database for fiscal years 2016 through 2019.[50] We selected this time period because 2016 is the earliest fiscal year when data were available with current International Classification of Diseases codes, according to VHA officials, and 2019 was the last full year prior to the COVID-19 pandemic.[51]
We reviewed the data dictionaries for these databases and met with cognizant VHA officials to identify appropriate variables. We assessed the reliability of Amputee Data Repository and National Prosthetic Patient Database data by reviewing relevant documentation, checking the data for any missing values or obvious errors, and interviewing VHA officials knowledgeable about the data. We determined that the data used in our analyses were sufficiently reliable for our reporting purposes.
To better understand the context within which we analyzed these data, we reviewed the VHA directives and guidance related to care for veterans with limb loss.[52] We also interviewed officials from several VHA offices responsible for this care. These offices included: the Amputation System of Care, Orthotic and Prosthetic Service, Patient Care Services, Physical Medicine and Rehabilitation, and the Prosthetic and Sensory Aids Service. To obtain veteran perspectives on limb loss and VHA care, we interviewed representatives from Disabled American Veterans, a veteran service organization.
Pediatric limb loss is the loss of all or part of an arm or leg in children under the age of 18 years old. Pediatric limb difference involves children who are born without a limb or part of a limb, or with differently formed limbs; it can also involve changes to a limb caused by disease or injury.
We analyzed peer-reviewed studies of pediatric limb loss and limb difference. This appendix provides examples from these studies relating to the incidence of pediatric limb loss and limb difference, challenges children may face following the loss of a limb, and factors affecting the use of prosthetic limbs among children.
Limb Loss
At least 25,000 children were estimated to be living with limb loss in the United States in 2005, according to a study.[53]
There are three main reasons children experience limb loss, according to a 2022 study:
· traumatic injuries that damage the limb (see text box);
· diseases (such as cancers and infections); and,
· limb differences, where removing a differently formed limb can lead to improved mobility or function.[54]
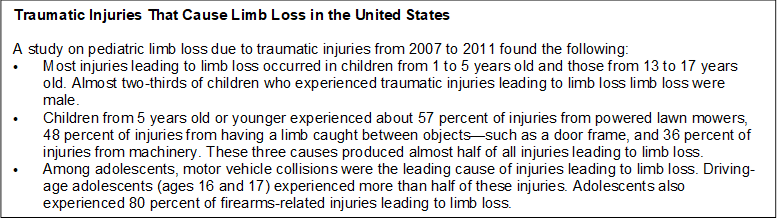 Source:
Allen Borne et al., “Pediatric Traumatic Amputations in the United States: A
5-Year Review,” Journal of Pediatric Orthopedics, vol. 37, no. 2 (March
2017): 104-107. | GAO‑25‑106406
Source:
Allen Borne et al., “Pediatric Traumatic Amputations in the United States: A
5-Year Review,” Journal of Pediatric Orthopedics, vol. 37, no. 2 (March
2017): 104-107. | GAO‑25‑106406
Limb Difference
According to one study, approximately 2,000 children were born in the United States each year from 2010 through 2014 with limb differences, specifically, missing all or part of one or more limbs or having one or more differently formed limbs.[55] For example, polydactyly, where a child is born with an extra digit on their hand.[56] Treatments for limb difference vary based on the shape of the limb and how it affects the child’s quality of life. For example, a child with a shorter limb may undergo a limb-lengthening surgery. This surgery involves splitting a limb bone into two pieces and promoting the growth of new bone tissue between these pieces to create a longer limb. In other cases, a child with limb difference may have an amputation surgery to remove a differently shaped limb. This may occur when removing part of the limb can help the child achieve better outcomes using a prosthetic limb.[57]
Challenges
Children with limb loss or limb difference may experience medical or psychological challenges, according to studies we reviewed. For example:
· Medical. Bone overgrowth is a medical complication where a bony spike forms at the end of the remaining limb bone and may cause irritation that can limit the use of a prosthetic limb.[58] Surgery may be necessary to correct bone overgrowth, according to studies we reviewed.[59]
· Psychological. Younger children with limb loss and limb difference can face social exclusion by their peers. Teenagers with limb loss and limb difference may experience stress and low self-esteem because of how their appearance differs from their peers.[60]
Prosthetic Limbs
Children with limb loss or limb difference may use prosthetic limbs to enhance their mobility, physical development, and quality of life. Young children may receive simple limbs for walking and transition to more complex and customized limbs as they grow, according to one study.[61] In addition, children may have more difficulty using prosthetic limbs and require more frequent changes.
· Ease of use. Some prosthetic limbs can be relatively heavy for children to wear. Children may also find limbs uncomfortable or dislike the lack of tactile sensation. These factors can cause discomfort and lead to children abandoning their use of prosthetic limbs.[62]
· Cost. As children grow, they may need changes and adjustments to their prosthetic limbs every 12 to 24 months, according to one study.[63] Furthermore, children may be more likely than adults to damage their prosthetic limbs, leading to more frequent replacement of limb components. These factors can increase costs. One study suggested that 3-dimensional printing could be used to produce more affordable components for short-term use on children’s prosthetic limbs.[64]
Pediatric Literature Review Methods and Limitations
To review academic literature on topics related to pediatric limb loss and limb difference, we conducted searches in databases including SCOPUS and Medline. These searches yielded 67 results. We reviewed abstracts to identify articles for full-text review. We reviewed the full text of 43 studies of pediatric limb loss and limb difference from scholarly and peer reviewed journals published in the last 10 years. We selected 11 studies from these searches that we determined addressed topics related to care and rehabilitation related to limb loss and limb difference, including the use of prosthetic limbs, in individuals under the age of 18. We also reviewed the full text of selected additional studies that provided further context.
The literature we reviewed noted gaps in current research. These included a lack of generalizable studies and the need for additional research on enhancing mobility and balance in children with limb loss and limb difference.[65]
Selected Literature Reviewed
Awad, Motaz, et al. “Pediatric Amputation,” in Pediatric Anesthesia: A Comprehensive Approach to Safe and Effective Care, ed. James S. Furstein (Springer Publishing Company, Incorporated, 2022), 593-595.
Battraw, Marcus A. et al. “A Review of Upper Limb Pediatric Prostheses and Perspectives on Future Advancements.” Prosthetics and Orthotics International, vol. 46, no. 3 (2022): 267-273.
Blank, Alan T. et al. “A Novel Method to Prevent Terminal Appositional Overgrowth Following Pediatric Below Knee Amputations: A Case Series and Review of the Literature.” Bulletin of the Hospital for Joint Diseases, vol. 77, No. 4 (2019): 269-274.
Borne, Allen et al. “Pediatric Traumatic Amputations in the United States: A 5-Year Review.” Journal of Pediatric Orthopedics, vol. 37, no. 2 (March 2017): e104-e107.
Burn, Matthew B., Anderson Ta, and Gloria R. Gogola. “Three-Dimensional Printing of Prosthetic Hands for Children.” The Journal of Hand Surgery, vol. 41, no. 5 (2016): e103-e109.
Calder, P. et al. “A Comparison of Functional Outcome Between Amputation and Extension Prosthesis in the Treatment of Congenital Absence of the Fibula with Severe Limb Deformity,” Journal of Children’s Orthopaedics, vol. 11 (2017): 318-325.
Ciocco, Roberta, Michelle Hsia, and Tami Konieczny. “Pediatric Hand Therapy—Prosthetics and Training,” in Pediatric Hand Therapy, eds. Joshua M. Abzug, Scott H. Kozin, and Rebecca Neiduski (Elsevier, 2020): 77-91.
Eshraghi, Arezoo et al. “Walking and balance in children and adolescents with lower-limb amputation: A review of literature.” Clinical Biomechanics, vol. 59 (2018): 181-198.
Hall, Michelle J. et al. “Essentials of Pediatric Prosthetics.” Journal of the Pediatric Orthopaedic Society of North America, vol. 2, no. 3 (November 2020): 1-15.
Le, Joan T. and Phoebe R. Scott-Wyard. “Pediatric Limb Differences and Amputations.” Physical Medicine and Rehabilitation Clinics of North America, vol. 26 (2015): 95-108.
Mai, Cara T. et al. “National Population-based Estimates for Major Birth Defects, 2010-2014.” Birth Defects Research, vol. 111 (2019): 1420-1435.
Murphy, Adrian D. et al. “The Use of Vascularized Bone Capping to Prevent and Treat Amputation Stump Spiking in the Paediatric Population.” Microsurgery, vol. 37 (2017): 589-595.
Socci, Adrienne R. et al. “What’s New in Pediatric Limb Lengthening and Deformity Correction?” Journal of Pediatric Orthopedics, vol. 40, no. 7 (August 2020): e598-e602.
Westberry, David E. “State of the Art: Amputation and Prosthetics.” Journal of Pediatric Orthopedics, vol. 37, No. 6 (September 2017): S22-S25.
Ziegler-Graham, Kathryn et al. “Estimating the Prevalence of Limb Loss in the United States: 2005 to 2050.” Archives of Physical Medicine and Rehabilitation, vol. 89 (March 2008): 422-429.
This appendix provides further detail regarding the Centers for Medicare & Medicaid Services’s (CMS) Medicare data and methods used in our study.
We obtained data from CMS’s Integrated Data Repository—a comprehensive data warehouse containing information key to operating CMS programs—for calendar years 2016 through 2019. Specifically, from this repository we analyzed Medicare beneficiary claims and enrollment data.[66] We chose this time period because 2016 is the earliest full year when claims data were available using International Classification of Diseases 10th revision medical codes and 2019 was the last full year prior to the start of the COVID-19 pandemic, which significantly disrupted health care service delivery.[67]
Beneficiaries in Traditional Medicare Who Experienced Limb Loss
To identify and select beneficiaries who experienced loss of a limb—all or part of an arm or leg—in 2016 (that is, had an amputation surgery in 2016), we analyzed claims including applicable amputation surgical procedure codes.[68] We also identified all beneficiaries in traditional Medicare in 2016. For both groups, we excluded beneficiaries that did not have continuous Part A and Part B enrollment from 2016 through 2019, unless they died while enrolled.[69] We excluded beneficiaries who enrolled at any point in Medicare Advantage from our review because we and others have reported gaps in the completeness and accuracy of Medicare Advantage encounter data.[70]
Beneficiary Characteristics
To describe the characteristics of traditional Medicare beneficiaries that experienced limb loss compared to the characteristics of all other beneficiaries, we used claims and enrollment data to examine age, gender, race and ethnicity, Medicare entitlement type, geographic location, dual-eligible status, site and type of amputation, and other health conditions.
· Age. Beneficiary age in 2016.
· Gender. Beneficiary gender reported in 2016.
· Race and ethnicity. Beneficiary race and ethnicity in 2016, as determined by a methodology developed by the Research Triangle Institute.[71]
· Medicare entitlement. Beneficiary entitlement to Medicare—aged, disabled, or end stage renal disease—in 2016.[72]
· Geographic location. We used CMS’s designation of urban or rural location based on a beneficiary’s mailing address in 2016. U.S. Census Bureau geographic region was determined by the state listed on the beneficiary’s mailing address at the beginning of 2016.[73]
· Dual-eligible status. Beneficiary eligibility for coverage by Medicare and Medicaid at the beginning of 2016.
· Site and type of amputation. We categorized beneficiaries as having lower or upper limb loss (site) and minor or major amputation (type) in 2016.[74]
· Selected health conditions. We identified health conditions beneficiaries had based on diagnoses included on their claims, such as diabetes and vascular disease, at the end of 2016.[75]
Rehabilitation Services and Prosthetic Limbs
We analyzed beneficiaries’ fee-for-service claims data for certain rehabilitation services and prosthetic limbs to determine utilization from 2016 through 2019.[76] Rehabilitation services we included in our review were physical therapy, occupational therapy, and physical medicine and rehabilitation (PMR) physician services.[77]
· Physical therapy. We determined which beneficiaries received physical therapy at least once by analyzing claims with Health Care Common Procedure Coding System (HCPCS) codes associated with a physical therapy treatment plan from 2016 through 2019 or revenue code for physical therapy.[78] We grouped claims for physical therapy into institutional and non-institutional settings based on type.[79]
· Occupational therapy. We determined which beneficiaries received occupational therapy at least once by analyzing claims with HCPCS codes associated with an occupational therapy treatment plan or revenue code for occupational therapy from 2016 through 2019. We grouped claims for occupational therapy into institutional and non-institutional setting based on type.[80]
· PMR physician services. We determined which beneficiaries received PMR physician services at least once by analyzing fee-for-service claims with a provider specialty code for physical medicine and rehabilitation from 2016 through 2019.[81]
· Prosthetic limbs. We determined which beneficiaries received prosthetic limbs by analyzing claims with prosthetic limb base HCPCS codes. These base HCPCS codes include the essential components of a prosthetic limb—for example, the combination of an artificial foot with a socket—according to the Veterans Health Administration.
· Time to receipt of prosthetic limb. To determine the amount of time it took for beneficiaries to receive a prosthetic limb, we calculated the time in months associated with the date of the beneficiary’s claim containing a prosthetic limb base HCPCS code (if applicable) from 2016 through 2019, and the date of the beneficiary’s first amputation surgery in 2016.
· Expenditures for prosthetic limbs. We determined Medicare expenditures for prosthetic limbs and associated components by analyzing fee-for-service claims with the relevant HCPCS codes to determine payments to providers made in traditional Medicare. We determined beneficiary expenditures (out-of-pocket costs) by analyzing claims with the relevant HCPCS codes and adding coinsurance and deductible amounts.
Health Outcomes
We analyzed enrollment and claims data in traditional Medicare to determine the extent to which beneficiaries who experienced limb loss also experienced certain health outcomes from 2016 through 2019. We selected health outcomes from among those CMS followed to monitor access to durable medical equipment, prosthetics, orthotics, and supplies items, as published in the most recent final rule updating payment and benefit policies at the time of our review.[82]
· Mortality. We analyzed beneficiary enrollment data to determine the year beneficiaries died and calculated mortality rates. We calculated annual mortality rates by determining the number of beneficiaries in traditional Medicare that died each year divided by the total number of beneficiaries in that same year. Four-year mortality rates were calculated by the dividing the total number of beneficiaries that died from 2016 through 2019 divided by the total number of beneficiaries in 2016.
· Emergency department visits. To determine the number of beneficiaries who had emergency department visits and the number of visits, we analyzed fee-for-service claims with procedure codes for emergency services from 2016 through 2019.[83]
· Major amputation after a minor amputation on the same limb. To determine which beneficiaries had a major amputation after a minor amputation on the same limb, we analyzed amputation procedure codes in the fee-for-service claims from 2016 through 2019.[84] We identified beneficiaries who had minor amputations in 2016 and then later had a major amputation on the same limb afterwards through 2019.
· Skilled nursing facility stays. To determine the number of beneficiaries that had skilled nursing facility stays and the number of stays, we identified fee-for-service claims with a stay greater than 1 day in a skilled nursing facility from 2016 through 2019.[85]
· Hospital stays over 30 days. We identified the number of beneficiaries in traditional Medicare that had an inpatient hospital stay of 30 days or more by reviewing beneficiary fee-for-service claims from 2016 through 2019.
We assessed the reliability of the enrollment and fee-for-service claims data used for this report by reviewing relevant documentation and written responses from CMS officials. The data are used by the Medicare program as a record of payment to health care providers and are monitored by both by CMS contractors that process, review, and pay claims. We also performed electronic data tests to check for missing data or obvious errors. Based on these steps, we determined the data were reliable for the purposes of our reporting objectives.
|
Characteristic/Category |
Number of beneficiaries |
Percent of beneficiaries |
|
Race and ethnicity |
||
|
White |
23,051,778 |
81.6 |
|
Black |
2,346,331 |
8.3 |
|
Hispanic |
1,433,117 |
5.1 |
|
Native American |
165,029 |
0.6 |
|
Other/Unknown |
567,896 |
2.0 |
|
Asian |
680,481 |
2.4 |
|
Total |
28,244,632 |
100 |
|
Medicare entitlementa |
||
|
Aged |
24,259,838 |
85.9 |
|
Disabled |
3,941,219 |
14.0 |
|
End stage renal disease |
43,575 |
0.2 |
|
Total |
28,244,632 |
100 |
|
Gender |
||
|
Male |
12,734,847 |
45.1 |
|
Female |
15,509,785 |
54.9 |
|
Total |
28,244,632 |
100 |
|
Rurality |
||
|
Rural |
7,881,407 |
28.0 |
|
Urban |
20,309,365 |
72.0 |
|
Total |
28,190,772 |
100 |
|
Region |
||
|
Northeast |
5,228,818 |
18.6 |
|
South |
11,159,972 |
39.6 |
|
Midwest |
6,403,875 |
22.7 |
|
West |
5,378,335 |
19.1 |
|
Total |
28,171,000 |
100 |
|
Dual-eligibleb |
||
|
Not eligible |
23,223,883 |
82.2 |
|
Eligible |
5,020,749 |
17.8 |
|
Total |
28,244,632 |
100 |
Source: GAO analysis of Centers for Medicare & Medicaid Services data. | GAO‑25‑106406
Note: Traditional or fee-for-service Medicare consists of Medicare Parts A and B. Medicare Part A covers hospital and other inpatient stays. Medicare Part B is optional insurance and covers physician, outpatient hospital, home health care, certain other services, and the rental or purchase of durable medical equipment, prosthetics, orthotics, and supplies. The total number of beneficiaries across each characteristic do not equal 28,244,632 due to missing data.
aMedicare is available to three groups of people: (1) aged: individuals aged 65 years or older; (2) disabled: individuals entitled to Social Security benefits due to disability; and (3) end stage renal disease: individuals with permanent kidney failure requiring dialysis or a transplant.
bDual-eligible beneficiaries are individuals who are dually enrolled in both Medicare and Medicaid, a joint federal-state program that provides health care coverage for individuals with low incomes.
|
Health condition |
Description |
Percent of beneficiaries who experienced limb loss |
Percent of all beneficiaries |
|
Diabetes |
A disease that occurs when a person’s blood glucose is too high. Over time, having too much glucose in the blood can cause health problems, such as heart disease, nerve damage, among other conditions. |
71 |
24 |
|
Congestive heart failure |
Failure of the heart to maintain adequate circulation which results in fluid accumulation in the lungs (pulmonary edema). |
38 |
11 |
|
Vascular disease |
A disease where blood vessels narrow over time, which reduces blood flow, including in areas of the body such as limbs. |
29 |
13 |
|
Chronic obstructive pulmonary disease |
A condition caused by damage to the airways or other parts of the lung that block airflow and makes it hard to breathe. |
25 |
12 |
|
Acute renal failure |
Loss of the kidneys’ ability to remove waste and help balance fluids and electrolytes in the body. |
17 |
4 |
|
Septic shock |
Sepsis is the body’s extreme response to an infection. Shock occurs due to disruptions in blood flow that may result in organ failure and eventually death. |
17 |
2 |
|
Dementia |
A type of cognitive impairment characterized by memory loss, confusion, and difficulty performing daily tasks where impairment becomes severe enough to disrupt daily functioning and independence. |
12 |
7 |
|
Acute myocardial infarction |
Decreased blood flow to the muscles of the heart leading to insufficient oxygen supply and disruptions in the heart’s ability to function. |
7 |
1 |
|
Traumatic amputations and complications |
Loss of all or part of limb due to an accident or injury followed by additional complications. |
6 |
0.3 |
Source: National Institutes of Health information; GAO analysis of Centers for Medicare & Medicaid Services data. | GAO‑25‑106406
Note: The table above provides data on beneficiaries in traditional Medicare who lost a limb following an amputation surgery in 2016 based on our analysis of Medicare fee-for-service claims data. Beneficiary health conditions are based on diagnoses included on claims and the Centers for Medicare & Medicaid Services’s categorization of those diagnoses into health conditions. Denominator for beneficiaries who experienced limb loss = 50,196. Denominator for all beneficiaries = 28,227,360.
|
Site and type of amputation |
Number of beneficiaries |
Physical medicine and rehabilitation physician services (%) |
Physical therapy (%) |
Occupational therapy (%) |
|
Upper limb |
|
|
|
|
|
Minor |
1,900 |
28.8 |
86.3 |
82.1 |
|
Major |
255 |
32.5 |
89.4 |
87.1 |
|
Major and minor |
42 |
45.2 |
97.6 |
92.9 |
|
Subtotal |
2,197 |
29.5 |
86.8 |
82.9 |
|
Lower limb |
|
|
|
|
|
Minor |
24,038 |
34.3 |
95.8 |
84.4 |
|
Major |
19,695 |
47.5 |
96.6 |
93.0 |
|
Major and minor |
4,272 |
55.2 |
99.3 |
96.7 |
|
Subtotal |
48,005 |
41.6 |
96.5 |
89.0 |
|
Total |
50,202 |
41.0 |
96.1 |
88.7 |
Source: GAO analysis of Centers for Medicare & Medicaid Services data. | GAO‑25‑106406
Note: A beneficiary who experienced limb loss in 2016 means a beneficiary who had an amputation surgery in 2016 based on our analysis of Medicare fee-for-service claims data. A major amputation includes the loss of either an entire foot or all or part of a leg (lower limb) or the loss of an entire hand or all or part of an arm (upper limb). Minor amputations include the loss of either a toe or part of a foot (lower limb) or the loss of a finger or part of a hand (upper limb). Both major and minor amputations can include loss of a finger and hand (upper limb) or loss of a toe and foot (lower limb). Denominator for each percentage is the number of beneficiaries listed in the row.
|
Characteristic |
Category |
Number of beneficiaries |
Physical medicine and rehabilitation physician services (%) |
Physical therapy (%) |
Occupational therapy (%) |
|
Race and ethnicity |
White |
33,155 |
40.0 |
96.2 |
89.0 |
|
Black |
10,272 |
45.5 |
96.6 |
91.0 |
|
|
Hispanic |
4,687 |
41.1 |
94.0 |
83.8 |
|
|
American Indian/Alaska Native |
827 |
30.5 |
95.6 |
85.0 |
|
|
Other/Unknown |
657 |
46.1 |
95.3 |
85.1 |
|
|
Asian |
604 |
34.4 |
96.7 |
85.9 |
|
|
Medicare entitlementa |
Aged |
34,017 |
39.3 |
96.2 |
89.7 |
|
Disabled |
15,087 |
44.7 |
95.6 |
86.7 |
|
|
End stage renal disease |
1,098 |
45.6 |
96.4 |
87.5 |
|
|
Gender |
Male |
32,930 |
41.7 |
95.8 |
88.0 |
|
Female |
17,272 |
39.9 |
96.6 |
90.1 |
|
|
Rurality |
Rural |
14,353 |
29.8 |
95.3 |
87.3 |
|
Urban |
35,843 |
45.6 |
96.3 |
89.3 |
|
|
Region |
Northeast |
9,155 |
50.0 |
95.7 |
87.0 |
|
South |
22,542 |
39.6 |
95.7 |
88.0 |
|
|
Midwest |
10,807 |
42.4 |
96.8 |
92.4 |
|
|
West |
7,684 |
32.8 |
96.4 |
87.9 |
|
|
Dual-eligibleb |
Not eligible |
31,001 |
43.3 |
96.0 |
88.2 |
|
Eligible |
19,201 |
37.4 |
96.2 |
89.7 |
Source: GAO analysis of Centers for Medicare & Medicaid Services data. | GAO‑25‑106406
Note: A beneficiary who experienced limb loss in 2016 means a beneficiary who had an amputation surgery in 2016 based on our analysis of Medicare fee-for-service claims data. Denominator for each percentage is the number of beneficiaries listed in the row.
aMedicare is available to three groups of people: (1) aged: individuals aged 65 years or older; (2) disabled: individuals entitled to Social Security benefits due to disability; and (3) end stage renal disease: individuals with permanent kidney failure requiring dialysis or a transplant.
bDual-eligible beneficiaries are individuals who are dually enrolled in both Medicare and Medicaid, a joint federal-state program that provides health care coverage for individuals with low incomes.
|
Site and type of amputation |
Number of beneficiaries |
Prosthetic limb (%) |
|
Upper limb |
||
|
Minor |
1,900 |
1.7 |
|
Major |
255 |
22.7 |
|
Major and minor |
42 |
16.7 |
|
Subtotal |
2,197 |
4.4 |
|
Lower limb |
||
|
Minor |
24,038 |
23.5 |
|
Major |
19,695 |
37.4 |
|
Major and minor |
4,272 |
46.7 |
|
Subtotal |
48,005 |
31.3 |
|
Total |
50,202 |
30.1 |
Source: GAO analysis of Centers for Medicare & Medicaid Services data. | GAO‑25‑106406
Note: A beneficiary who experienced limb loss in 2016 means a beneficiary who had an amputation surgery in 2016 based on our analysis of Medicare fee-for-service claims data. A major amputation includes the loss of either an entire foot or all or part of a leg (lower limb) or the loss of an entire hand or all or part of an arm (upper limb). Minor amputations include the loss of either a toe or part of a foot (lower limb) or the loss of a finger or part of a hand (upper limb). Both major and minor amputations can include loss of a finger and hand (upper limb) or loss of a toe and foot (lower limb). Denominator for each percentage is the number of beneficiaries listed in the row.
|
Characteristic |
Category |
Number of beneficiaries |
Prosthetic limb (%) |
|
Race and ethnicity |
White |
33,155 |
29.5 |
|
Black |
10,272 |
30.6 |
|
|
Hispanic |
4,687 |
32.0 |
|
|
American Indian/Alaska Native |
827 |
32.3 |
|
|
Other/Unknown |
657 |
36.2 |
|
|
Asian |
604 |
27.3 |
|
|
Medicare entitlementa |
Aged |
34,017 |
26.2 |
|
Disabled |
15,087 |
38.6 |
|
|
End stage renal disease |
1,098 |
33.0 |
|
|
Gender |
Male |
32,930 |
32.3 |
|
Female |
17,272 |
25.8 |
|
|
Rurality |
Rural |
14,353 |
31.1 |
|
Urban |
35,843 |
29.7 |
|
|
Region |
Northeast |
9,155 |
28.8 |
|
South |
22,542 |
30.1 |
|
|
Midwest |
10,807 |
31.0 |
|
|
West |
7,684 |
30.3 |
|
|
Dual-eligibleb |
Not eligible |
31,001 |
30.3 |
|
Eligible |
19,201 |
29.7 |
Source: GAO analysis of Centers for Medicare & Medicaid Services data. | GAO‑25‑106406
Note: A beneficiary who experienced limb loss in 2016 means a beneficiary who had an amputation surgery in 2016 based on our analysis of Medicare fee-for-service claims data. Denominator for each percentage is the number of beneficiaries listed in the row.
aMedicare is available to three groups of people: (1) aged: individuals aged 65 years or older; (2) disabled: individuals entitled to Social Security benefits due to disability; and (3) end stage renal disease individuals with permanent kidney failure requiring dialysis or a transplant.
bDual-eligible beneficiaries are individuals who are dually enrolled in both Medicare and Medicaid, a joint federal-state program that provides health care coverage for individuals with low incomes.
|
|
Medicare expenditures |
Average Medicare expenditures per beneficiary |
Beneficiary cost sharing amount |
Average cost sharing amount per beneficiary |
|
Upper prosthetic limbs and components |
$1,707,364 |
$14,719 |
$465,680 |
$4,014 |
|
Lower prosthetic limbs and components |
$246,323,187 |
$13,539 |
$65,085,650 |
$3,577 |
|
Total |
$248,030,551 |
$13,546 |
$65,551,330 |
$3,580 |
Source: GAO analysis of Centers for Medicare & Medicaid Services data. | GAO‑25‑106406
Note: The table above provides data on beneficiaries in traditional Medicare who lost a limb following an amputation surgery in 2016 based on our analysis of Medicare fee-for-service claims data. An upper limb amputation includes loss of all or part of a hand or arm. A lower limb amputation includes loss of all or part of a foot or leg. Beneficiary cost sharing amounts include expenditures for coinsurance and deductible amounts and do not include the cost of care for beneficiaries paid for by other sources, such as care paid for directly by beneficiaries, Medicaid, or private health insurance.
|
Type of amputation |
Number of beneficiaries |
Average time to receipt of a prosthetic limb (months) |
Range (minimum, maximum in months) |
|
Upper limb |
|
||
|
Minor |
29 |
14.4 |
3.4 to 38.8 |
|
Major |
57 |
8.3 |
1.4 to 32.7 |
|
Major and minor |
7 |
8.2 |
2.9 to 22.3 |
|
Subtotal |
93 |
10.2 |
1.4 to 38.8 |
|
Lower limb |
|
||
|
Minor |
5,266 |
14.2 |
0.2 to 48.5 |
|
Major |
6,970 |
7.8 |
0.2 to 48.3 |
|
Major and minor |
1,917 |
9.6 |
0.5 to 47.7 |
|
Subtotal |
14,153 |
10.4 |
0.2 to 48.5 |
|
Total |
14,246 |
10.4 |
0.2 to 48.5 |
Source: GAO analysis of Centers for Medicare & Medicaid Services data. | GAO‑25‑106406
Note: The data presented above provides the average time to receipt of a prosthetic limb for beneficiaries in traditional Medicare who lost a limb following an amputation surgery in 2016 based on our analysis of Medicare fee-for-service claims data. Time to prosthetic limb refers to the time (months) from the date of the first amputation surgery in 2016 to date of the first prosthetic limb claim. A major amputation includes the loss of either an entire foot or all or part of a leg (lower limb) or the loss of an entire hand or all or part of an arm (upper limb). Minor amputations include the loss of either a toe or part of a foot (lower limb) or the loss of a finger or part of a hand (upper limb). Both major and minor amputations can include loss of a finger and hand (upper limb) or loss of a toe and foot (lower limb).
|
Type of amputation |
Number of beneficiaries |
Percent of beneficiaries (%) |
|
Upper limb |
||
|
Minor |
1,900 |
94.1 |
|
Major |
255 |
82.4 |
|
Major and minor |
42 |
95.2 |
|
Subtotal |
2,197 |
92.8 |
|
Lower limb |
||
|
Minor |
24,038 |
92.9 |
|
Major |
19,695 |
89.7 |
|
Major and minor |
4,272 |
94.8 |
|
Subtotal |
48,005 |
91.7 |
|
Total |
50,202 |
91.8 |
Source: GAO analysis of Centers for Medicare & Medicaid Services data. | GAO‑25‑106406
Note: The table above provides data on beneficiaries in traditional Medicare who lost a limb following an amputation surgery in 2016 based on our analysis of Medicare fee-for-service claims data and had at least one emergency department visit from 2016 through 2019. A major amputation includes the loss of either an entire foot or all or part of a leg (lower limb) or the loss of an entire hand or all or part of an arm (upper limb). Minor amputations include the loss of either a toe or part of a foot (lower limb) or the loss of a finger or part of a hand (upper limb). Both major and minor amputations can include loss of a finger and hand (upper limb) or loss of a toe and foot (lower limb). Denominator for each percentage is the number of beneficiaries listed in the row.
|
Characteristic |
Category |
Number of beneficiaries |
Percent of beneficiaries (%) |
|
Race and ethnicity |
White |
33,155 |
90.8 |
|
Black |
10,272 |
94.3 |
|
|
Hispanic |
4,687 |
93.2 |
|
|
American Indian/Alaska Native |
827 |
94.0 |
|
|
Other/Unknown |
657 |
89.6 |
|
|
Asian |
604 |
91.2 |
|
|
Medicare entitlementa |
Aged |
34,017 |
90.7 |
|
Disabled |
15,087 |
94.0 |
|
|
End stage renal disease |
1,098 |
93.2 |
|
|
Gender |
Male |
32,930 |
91.5 |
|
Female |
17,272 |
92.3 |
|
|
Rurality |
Rural |
14,353 |
89.1 |
|
Urban |
35,843 |
92.8 |
|
|
Region |
Northeast |
9,155 |
92.6 |
|
South |
22,542 |
92.6 |
|
|
Midwest |
10,807 |
89.9 |
|
|
West |
7,684 |
90.8 |
|
|
Dual-eligibleb |
Not eligible |
31,001 |
90.3 |
|
Eligible |
19,201 |
94.1 |
Source: GAO analysis of Centers for Medicare & Medicaid Services data. | GAO‑25‑106406
Note: The table above provides data on beneficiaries in traditional Medicare who lost a limb following an amputation surgery in 2016 based on our analysis of Medicare fee-for-service claims data and had at least one emergency department visit from 2016 through 2019. Denominator for each percentage is the number of beneficiaries listed in the row.
aMedicare is available to three groups of people: (1) aged: individuals aged 65 years or older; (2) disabled: individuals entitled to Social Security benefits due to disability; and (3) end stage renal disease: individuals with permanent kidney failure requiring dialysis or a transplant.
bDual-eligible beneficiaries are individuals who are dually enrolled in both Medicare and Medicaid, a joint federal-state program that provides health care coverage for individuals with low incomes.
|
Type of amputation |
Number of beneficiaries |
Percent of beneficiaries (%) |
|
Upper limb |
||
|
Minor |
1,900 |
46.9 |
|
Major |
255 |
40.0 |
|
Major and minor |
42 |
54.8 |
|
Subtotal |
2,197 |
46.3 |
|
Lower limb |
||
|
Minor |
24,038 |
61.0 |
|
Major |
19,695 |
67.8 |
|
Major and minor |
4,272 |
74.0 |
|
Subtotal |
48,005 |
65.0 |
|
Total |
50,202 |
64.1 |
Source: GAO analysis of Centers for Medicare & Medicaid Services data. | GAO‑25‑106406
Note: The table above provides data on beneficiaries in traditional Medicare who lost a limb following an amputation surgery in 2016 based on our analysis of Medicare fee-for-service claims data and had at least one skilled nursing facility stay from 2016 through 2019. A major amputation includes the loss of either an entire foot or all or part of a leg (lower limb) or the loss of an entire hand or all or part of an arm (upper limb). Minor amputations include the loss of either a toe or part of a foot (lower limb) or the loss of a finger or part of a hand (upper limb). Both major and minor amputations can include loss of a finger and hand (upper limb) or loss of a toe and foot (lower limb). Denominator for each percentage is the number of beneficiaries listed in the row.
|
Characteristic |
Category |
Number of beneficiaries |
Percent of beneficiaries (%) |
|
Race and ethnicity |
White |
33,155 |
65.0 |
|
Black |
10,272 |
66.4 |
|
|
Hispanic |
4,687 |
56.3 |
|
|
American Indian/Alaska Native |
827 |
57.4 |
|
|
Other/Unknown |
657 |
55.4 |
|
|
Asian |
604 |
58.6 |
|
|
Medicare entitlementa |
Aged |
34,017 |
68.3 |
|
Disabled |
15,087 |
55.8 |
|
|
End stage renal disease |
1,098 |
50.8 |
|
|
Gender |
Male |
32,930 |
62.2 |
|
Female |
17,272 |
67.9 |
|
|
Rurality |
Rural |
14,353 |
63.1 |
|
Urban |
35,843 |
64.6 |
|
|
Region |
Northeast |
9,155 |
68.7 |
|
South |
22,542 |
60.4 |
|
|
Midwest |
10,807 |
68.0 |
|
|
West |
7,684 |
64.3 |
|
|
Dual-eligibleb |
Not eligible |
31,001 |
62.2 |
|
Eligible |
19,201 |
67.3 |
Source: GAO analysis of Centers for Medicare & Medicaid Services data. | GAO‑25‑106406
Note: The table above provides data on beneficiaries in traditional Medicare who lost a limb following an amputation surgery in 2016 based on our analysis of Medicare fee-for-service claims data and had at least one skilled nursing facility stay from 2016 through 2019. Denominator for each percentage is the number of beneficiaries listed in the row.
aMedicare, is available to three groups of people: (1) aged: individuals aged 65 years or older; (2) disabled: individuals entitled to Social Security benefits due to disability; and (3) end stage renal disease: individuals who receive dialysis on a regular basis or a kidney transplant.
bDual-eligible beneficiaries are individuals who are dually enrolled in both Medicare and Medicaid, a joint federal-state program that provides health care coverage for individuals with low incomes.
|
Type of amputation |
Number of beneficiaries |
Percent of beneficiaries (%) |
|
Upper limb |
1,942 |
2.3 |
|
Lower limb |
28,310 |
20.1 |
|
Total |
30,252 |
19.0 |
Source: GAO analysis of Centers for Medicare & Medicaid Services data. | GAO‑25‑106406
Note: The table above provides data on beneficiaries in traditional Medicare who lost a limb following a minor amputation surgery in 2016 and had a subsequent major amputation surgery on the same limb from 2016 through 2019 based on our analysis of Medicare fee-for-service claims data. A major amputation includes the loss of either an entire foot or all or part of a leg (lower limb) or the loss of an entire hand or all or part of an arm (upper limb). Minor amputations include the loss of either a toe or part of a foot (lower limb) or the loss of a finger or part of a hand (upper limb). Denominator for each percentage is the number of beneficiaries listed in the row.
|
Characteristic |
Category |
Number of beneficiaries |
Percent of beneficiaries (%) |
|
Race and ethnicity |
White |
20,450 |
15.6 |
|
Black |
5,519 |
28.7 |
|
|
Hispanic |
2,965 |
23.3 |
|
|
American Indian/Alaska Native |
522 |
24.1 |
|
|
Other/Unknown |
388 |
18.0 |
|
|
Asian |
408 |
20.8 |
|
|
Medicare entitlementa |
Aged |
20,292 |
16.9 |
|
Disabled |
9,271 |
22.7 |
|
|
End stage renal disease |
689 |
31.1 |
|
|
Gender |
Male |
20,522 |
20.0 |
|
Female |
9,730 |
16.8 |
|
|
Rurality |
Rural |
8,259 |
20.4 |
|
Urban |
21,990 |
18.4 |
|
|
Region |
Northeast |
5,973 |
17.0 |
|
South |
12,975 |
21.1 |
|
|
Midwest |
6,582 |
17.5 |
|
|
West |
4,713 |
17.6 |
|
|
Dual-eligibleb |
Not eligible |
19,517 |
17.2 |
|
Eligible |
10,735 |
22.2 |
Source: GAO analysis of Centers for Medicare & Medicaid Services data. | GAO‑25‑106406
Note: The table above provides data on beneficiaries in traditional Medicare who lost a limb following a minor amputation surgery in 2016 and had a subsequent major amputation surgery on the same limb from 2016 through 2019 based on our analysis of Medicare fee-for-service claims data. A major amputation includes the loss of either an entire foot or all or part of a leg (lower limb) or the loss of an entire hand or all or part of an arm (upper limb). Minor amputations include the loss of either a toe or part of a foot (lower limb) or the loss of a finger or part of a hand (upper limb). Denominator for each percentage is the number of beneficiaries listed in the row.
aMedicare is available to three groups of people: (1) aged: individuals aged 65 years or older; (2) disabled: individuals entitled to Social Security benefits due to disability; and (3) end stage renal disease: individuals with permanent kidney failure requiring dialysis or a transplant.
bDual-eligible beneficiaries are individuals who are dually enrolled in both Medicare and Medicaid, a joint federal-state program that provides health care coverage for individuals with low incomes.
|
Type of amputation |
Number of beneficiaries |
Percent of beneficiaries (%) |
|
Upper limb |
||
|
Minor |
1,900 |
10.8 |
|
Major |
255 |
14.9 |
|
Major and minor |
42 |
42.9 |
|
Subtotal |
2,197 |
11.9 |
|
Lower limb |
||
|
Minor |
24,038 |
10.0 |
|
Major |
19,695 |
13.5 |
|
Major and minor |
4,272 |
18.9 |
|
Subtotal |
48,005 |
12.3 |
|
Total |
50,202 |
12.3 |
Source: GAO analysis of Centers for Medicare & Medicaid Services data. | GAO‑25‑106406
Note: The table above provides data on beneficiaries in traditional Medicare who lost a limb following an amputation surgery in 2016 based on our analysis of Medicare fee-for-service claims data and had at least one hospital stay over 30 days from 2016 through 2019. A major amputation includes the loss of either an entire foot or all or part of a leg (lower limb) or the loss of an entire hand or all or part of an arm (upper limb). Minor amputations include the loss of either a toe or part of a foot (lower limb) or the loss of a finger or part of a hand (upper limb). Both major and minor amputations can include loss of a finger and hand (upper limb) or loss of a toe and foot (lower limb). Denominator for each percentage is the number of beneficiaries listed in the row.
|
Characteristic |
Category |
Number of beneficiaries |
Percent of beneficiaries (%) |
|
Race and ethnicity |
White |
33,155 |
10.1 |
|
Black |
10,272 |
17.4 |
|
|
Hispanic |
4,687 |
15.4 |
|
|
American Indian/Alaska Native |
827 |
12.9 |
|
|
Other/Unknown |
657 |
13.4 |
|
|
Asian |
604 |
16.7 |
|
|
Medicare entitlementa |
Aged |
34,017 |
10.7 |
|
Disabled |
15,087 |
15.3 |
|
|
End stage renal disease |
1,098 |
20.3 |
|
|
Gender |
Male |
32,930 |
12.0 |
|
Female |
17,272 |
12.8 |
|
|
Rurality |
Rural |
14,353 |
10.3 |
|
Urban |
35,843 |
13.0 |
|
|
Region |
Northeast |
9,155 |
12.9 |
|
South |
22,542 |
13.9 |
|
|
Midwest |
10,807 |
9.2 |
|
|
West |
7,684 |
11.0 |
|
|
Dual-eligibleb |
Not eligible |
31,001 |
11.2 |
|
Eligible |
19,201 |
13.9 |
Source: GAO analysis of Centers for Medicare & Medicaid Services data. | GAO‑25‑106406
Note: The table above provides data on beneficiaries in traditional Medicare who lost a limb following an amputation surgery in 2016 based on our analysis of Medicare fee-for-service claims data and had at least one hospital stay over 30 days from 2016 through 2019. Denominator for each percentage is the number of beneficiaries listed in the row.
aMedicare is available to three groups of people: (1) aged: individuals aged 65 years or older; (2) disabled: individuals entitled to Social Security benefits due to disability; and (3) end stage renal disease: individuals with permanent kidney failure requiring dialysis or a transplant.
bDual-eligible beneficiaries are individuals who are dually enrolled in both Medicare and Medicaid, a joint federal-state program that provides health care coverage for individuals with low incomes.
|
Site and type of amputation |
Number of beneficiaries |
4-year mortality rate (%) |
|
Upper limb |
||
|
Minor |
1,900 |
61.4 |
|
Major |
255 |
67.5 |
|
Major and minor |
42 |
88.1 |
|
Subtotal |
2,197 |
62.6 |
|
Lower limb |
||
|
Minor |
24,038 |
54.2 |
|
Major |
19,695 |
66.8 |
|
Major and minor |
4,272 |
69.2 |
|
Subtotal |
48,005 |
60.7 |
|
Total |
50,202 |
60.8 |
Source: GAO analysis of Centers for Medicare & Medicaid Services data. | GAO‑25‑106406
Note: The table above provides data on beneficiaries in traditional Medicare who lost a limb following an amputation surgery in 2016 based on our analysis of Medicare fee-for-service claims data. The 4-year mortality rate is the number of beneficiaries who lost a limb in 2016 that died by 2019 divided by the total number of beneficiaries who lost a limb in 2016. A major amputation includes the loss of either an entire foot or all or part of a leg (lower limb) or the loss of an entire hand or all or part of an arm (upper limb). Minor amputations include the loss of either a toe or part of a foot (lower limb) or the loss of a finger or part of a hand (upper limb). Both major and minor amputations can include loss of a finger and hand (upper limb) or loss of a toe and foot (lower limb). Denominator for each percentage is the number of beneficiaries listed in the row.
|
Characteristic |
Category |
Number of beneficiaries |
4-year mortality rate (%) |
|
Race and ethnicity |
White |
33,155 |
60.1 |
|
Black |
10,272 |
63.6 |
|
|
Hispanic |
4,687 |
61.0 |
|
|
American Indian/Alaska Native |
827 |
57.3 |
|
|
Other/Unknown |
657 |
54.2 |
|
|
Asian |
604 |
62.6 |
|
|
Medicare entitlementa |
Aged |
34,017 |
65.5 |
|
Disabled |
15,087 |
49.6 |
|
|
End stage renal disease |
1,098 |
69.2 |
|
|
Gender |
Male |
32,930 |
59.9 |
|
Female |
17,272 |
62.5 |
|
|
Rurality |
Rural |
14,353 |
58.9 |
|
Urban |
35,843 |
61.5 |
|
|
Region |
Northeast |
9,155 |
61.5 |
|
South |
22,542 |
62.0 |
|
|
Midwest |
10,807 |
59.9 |
|
|
West |
7,684 |
57.8 |
|
|
Dual-eligibleb |
Not eligible |
31,001 |
59.9 |
|
Eligible |
19,201 |
62.2 |
Source: GAO analysis of Centers for Medicare & Medicaid Services data. | GAO‑25‑106406
Note: The table above provides data on beneficiaries in traditional Medicare who lost a limb following an amputation surgery in 2016 based on our analysis of Medicare fee-for-service claims data. The 4-year mortality rate is the number of beneficiaries who lost a limb in 2016 that died by 2019 divided by the total number of beneficiaries who lost a limb in 2016. Denominator for each percentage is the number of beneficiaries listed in the row.
aMedicare is available to three groups of people: (1) aged: individuals aged 65 years or older; (2) disabled: individuals entitled to Social Security benefits due to disability; and (3) end stage renal disease: individuals with permanent kidney failure requiring dialysis or a transplant.
bDual-eligible beneficiaries are individuals who are dually enrolled in both Medicare and Medicaid, a joint federal-state program that provides health care coverage for individuals with low incomes.
GAO Contact
Leslie V. Gordon at (202) 512-7114 or GordonLV@gao.gov
Staff Acknowledgments
In addition to the contact named above, Stella Chiang (Assistant Director), Carl Potenzieri (Analyst-in-Charge), Todd Anderson, Leia Dickerson, Nicholas Graves, Deborah Healy, Diona Martyn, Ethiene Salgado-Rodriguez, Cathleen Whitmore, Jennifer Whitworth, and Chris Zakroff made key contributions to this report.
GAO’s Mission
The Government Accountability Office, the audit, evaluation, and investigative arm of Congress, exists to support Congress in meeting its constitutional responsibilities and to help improve the performance and accountability of the federal government for the American people. GAO examines the use of public funds; evaluates federal programs and policies; and provides analyses, recommendations, and other assistance to help Congress make informed oversight, policy, and funding decisions. GAO’s commitment to good government is reflected in its core values of accountability, integrity, and reliability.
Obtaining Copies of GAO Reports and Testimony
The fastest and easiest way to obtain copies of GAO documents at no cost is through our website. Each weekday afternoon, GAO posts on its website newly released reports, testimony, and correspondence. You can also subscribe to GAO’s email updates to receive notification of newly posted products.
Order by Phone
The price of each GAO publication reflects GAO’s actual cost of production and distribution and depends on the number of pages in the publication and whether the publication is printed in color or black and white. Pricing and ordering information is posted on GAO’s website, https://www.gao.gov/ordering.htm.
Place orders by calling (202) 512-6000, toll free (866) 801-7077,
or
TDD (202) 512-2537.
Orders may be paid for using American Express, Discover Card, MasterCard, Visa, check, or money order. Call for additional information.
Connect with GAO
Connect with GAO on Facebook, Flickr, Twitter, and YouTube.
Subscribe to our RSS Feeds or Email Updates. Listen to our Podcasts.
Visit GAO on the web at https://www.gao.gov.
To Report Fraud, Waste, and Abuse in Federal Programs
Contact FraudNet:
Website: https://www.gao.gov/about/what-gao-does/fraudnet
Automated answering system: (800) 424-5454 or (202) 512-7700
Congressional Relations
A. Nicole Clowers, Managing Director, ClowersA@gao.gov, (202) 512-4400, U.S. Government Accountability Office, 441 G Street NW, Room 7125, Washington, DC 20548
Public Affairs
Sarah Kaczmarek, Managing Director, KaczmarekS@gao.gov, (202) 512-4800, U.S.
Government Accountability Office, 441 G Street NW, Room 7149
Washington, DC 20548
Strategic Planning and External Liaison
Stephen J. Sanford, Managing
Director, spel@gao.gov, (202) 512-4707
U.S. Government Accountability Office, 441 G Street NW, Room 7814, Washington,
DC 20548
[1]Kathryn Ziegler-Graham, et al., “Estimating the Prevalence of Limb Loss in the United States: 2005 to 2050,” Archives of Physical Medicine and Rehabilitation, vol. 89 (2008): 422-429.
[2]Diabetes is a disease that occurs when a person’s blood glucose is too high and over time, can lead to nerve damage, and vascular disease, among other conditions. Some types of vascular disease cause blood vessels to narrow over time, which can reduce blood flow in limbs.
[3]Johns Hopkins University Bloomberg School of Public Health, Limb Loss Research and Statistics Program and Amputee Coalition of America, People with Amputation Speak Out: With the Amputee Coalition of America (ACA) (Baltimore, Md.: Johns Hopkins University Bloomberg School of Public Health, 2005), 3.
[4]Medicare is available to three groups of people: individuals aged 65 years or older; individuals entitled to Social Security benefits due to disability; and individuals with end stage renal disease (permanent kidney failure requiring dialysis or a transplant).
Under the Medicare program, traditional fee-for-service is also known as Original Medicare and covers Parts A (inpatient hospital coverage) and B (outpatient medical coverage). Managed care is also known as Medicare Part C, or Medicare Advantage. Medicare Part D is a federal prescription drug benefit program for Medicare beneficiaries provided through Part D plan sponsors, private companies who contract with CMS.
[5]In addition, you asked us to describe the Veterans Health Administration’s care for veterans with limb loss and to review published research on pediatric limb loss. We have included this information in appendixes I and II, respectively.
[6]We excluded beneficiaries enrolled in Medicare Advantage from our review because we and others have reported gaps in the completeness and accuracy of Medicare Advantage encounter data. For example, see GAO, Medicare Advantage: Continued Monitoring and Implementing GAO Recommendations Could Improve Oversight, GAO‑22‑106026 (Washington, D.C.: June 28, 2022) and Medicare Payment Advisory Commission, “Chapter 7: Ensuring the Accuracy and Completeness of Medicare Advantage Encounter Data,” Report to Congress: Medicare and the Health Care Delivery System (Washington, D.C.: June 2019).
[7]International Classification of Diseases codes are the standard code set used in the United States, including in the Medicare program, for documenting patient medical diagnoses and procedures. As of 2024, the 10th revision codes are the most current and were used consistently during our selected time period.
[8]We used the Veterans Health Administration’s definitions and classification of applicable International Classification of Diseases 10th revision codes to categorize amputation surgeries as major or minor. A major amputation includes the loss of either an entire foot or all or part of a leg (lower limb) or the loss of an entire hand or all or part of an arm (upper limb). Minor amputations include the loss of either a toe or part of a foot (lower limb) or the loss of a finger or part of a hand (upper limb).
[9]We used CMS’s designation of urban or rural location as based on the beneficiary’s mailing address zip code.
[10]See Medicare Program; Durable Medical Equipment, Prosthetics, Orthotics, and Supplies Policy Issues, and Level II of the Healthcare Common Procedure Coding System (HCPCS); DME Interim Pricing in the CARES Act; Durable Medical Equipment Fee Schedule Adjustments To Resume the Transitional 50/50 Blended Rates To Provide Relief in Rural Areas and Non- Contiguous Areas. 86 Fed. Reg. 73,860, 73,871 (Dec. 28, 2021).
[11]We interviewed officials from the following stakeholder groups: American Academy of Orthotists and Prosthetists, American Academy of Physical Medicine and Rehabilitation, American College of Surgeons, American Medical Rehabilitation Providers Association, American Orthotic and Prosthetic Association, American Physical Therapy Association, American Occupational Therapy Association, Amputee Coalition, Hanger Clinic, and Orthotic and Prosthetic Alliance.
[12]The percentage of beneficiaries who experienced limb loss in 2016 was 0.2 percent of 28,244,632 beneficiaries in traditional Medicare in 2016.
[13]Not shown in table 2 is the average age of beneficiaries that had an amputation in 2016, which was 68 years old, lower than the average age of all beneficiaries in 2016 (72 years old). For additional information on all beneficiaries in traditional Medicare in 2016, see appendix IV.
[14]Alexander C. Fanaroff, et al., “Geographic and Socioeconomic Disparities in Major Lower Extremity Amputation Rates in Metropolitan Areas,” Journal of the American Heart Association, vol. 10, no. 17 (2021); Karina Newhall, et al., “Amputation Rates for Patients with Diabetes and Peripheral Arterial Disease: The Effects of Race and Region,” Annals of Vascular Surgery, 30 (2016).
[15]Fanaroff et al., “Geographic and Socioeconomic Disparities”, 5-6.
[16]PMR physician services are specialized care focused on treating a decline in physical abilities after injury or disease. Physical therapy includes services intended to improve movement and physical function, manage pain, and aid in the prevention of and recovery from injury or disease. Occupational therapy includes services to restore independence and perform daily activities such as dressing, bathing, and using the toilet.
[17]A prosthetic limb is a device that supports or replaces a limb.
[18]See appendix IV for additional information.
[19]See 42 C.F.R. §§ 410.12, 424.5 (2023).
[20]See appendix IV for additional information.
[21]Specifically, 98 percent of beneficiaries received physical therapy and 97 percent received occupational therapy in an institutional setting.
[22]In outpatient clinics, 41 percent of beneficiaries received physical therapy and 27 percent received occupational therapy. Among therapists in private practice, 12 percent of beneficiaries received physical therapy and 2 percent received occupational therapy.
[23]The U.S. Census Bureau categorizes the country into four regions: Northeast, Midwest, South, and West.
[24]See appendix III for details on how we determined which beneficiaries received prosthetic limbs.
[25]See appendix IV for additional information on mortality rates.
[26]Annual mortality rates for all beneficiaries in traditional Medicare from 2016 through 2019 ranged from 5 to 6 percent.
[27]Chandler A. Long, et al., “Incidence and Factors Associated With Major Amputation in Patients With Peripheral Artery Disease: Insights From the EUCLID Trial,” Circulation. Cardiovascular Quality and Outcomes, vol.13, no. 7 (2020): e006399; Sanne Klaphake, et al., “Mortality after Major Amputation in Elderly Patients with Critical Limb Ischemia,” Clinical Interventions in Aging, vol. 12 (2017): 1985.
[28]Summer A. Beeson, et al., “Analysis of 5-year Mortality following Lower Extremity Amputation due to Vascular Disease,” Plastic and Reconstructive Surgery - Global Open, vol. 13, no. 1 (2023): e4727.
[29]The median number of emergency department visits per beneficiary was around four visits from 2016 through 2019. Such emergency department visits may not be directly related to their limb loss. See appendix IV for additional data on emergency department visits.
[30]See appendix IV for additional data on beneficiaries who had major amputation after a minor amputation on the same limb.
[31]Some representatives we met with said those challenges are not to exclusive beneficiaries in traditional Medicare and may affect individuals with limb loss who receive care through private insurers.
[32]According to some representatives we met with, post-operative and rehabilitative care may be coordinated by various health care providers such as surgeons, PMR physicians, and prosthetists, among others. For example, a surgeon may provide a prescription for a prosthetic limb and recommend that a patient see a prosthetist (see fig. 1 above for more information about some of these health care providers).
[33]CMS is authorized to replace prosthetic devices that are artificial limbs in specified circumstances: (1) when there is a physiological change in the condition of the beneficiary; (2) when there is an irreparable change in the condition of the device; or (3) when the device requires repair and the cost of such repairs would exceed 60 percent of the replacement cost. See 42 U.S.C. § 1395m(h)(1)(G).
[34]See Centers for Medicare & Medicaid Services, Local Coverage Determination: Lower Limb Prostheses (L33787). CMS officials said Medicare provides prosthetics with advanced components or technology for those who can use them (Medicare Functional Classification Levels 3 and 4). However, officials said the energy consumption needed to use a lower limb prosthetic is demanding and many beneficiaries may not have that physiologic capability to use a lower prosthetic limb.
[35]According to representatives, these benefits include reducing the rate of falling, risk and fear of falling, as well as improving walking performance.
[36]See Centers for Medicare & Medicaid Services, Proposed Local Coverage Determination - Lower Limb Prostheses (DL33787).
[37]For example, representatives from another group said a microprocessor lower prosthetic limb may cost over $20,000, which would require a beneficiary to pay at least $4,000 out-of-pocket, if they do not have supplemental insurance or financial support available to dual-eligible beneficiaries.
[38]Eligible veterans can receive care for limb loss that results from any injury or illness regardless of whether it is related to their service, according to VHA officials.
[39]For example, VHA Directive 1172.03, Amputation System of Care (Dec. 19, 2023).
[40]For example, Joseph B Webster et al., “Clinical Practice Guidelines for the Rehabilitation of Lower Limb Amputation: An Update from the Department of Veterans Affairs and Department of Defense,” American Journal of Physical Medicine & Rehabilitation, vol. 98, no. 9 (Sept. 2019): 820-829.
[41]Not all veterans use VHA for health care services. Veterans may generally obtain health care through (1) VHA medical facilities, (2) non-VHA health care providers in the community paid for by the Department of Veterans Affairs (called community care), or (3) providers paid through veterans’ own health insurance.
[42]Joseph Webster, et al., “Ten-Year Outcomes of a Systems-Based Approach to Longitudinal Amputation Care in the US Department of Veteran Affairs,” Federal Practitioner, vol. 37, no. 8 (August 2020): 360-367.
[43]In contrast, around 24 percent of all veterans enrolled in VHA had diabetes in 2022, according to VHA. See VHA Directive 1410, Prevention of Amputation in Veterans Everywhere Program (June 30, 2022).
[44]Webster, “Ten-Year Outcomes,” 361.
[45]VHA also helps veterans with limb loss access peer visits and support through collaboration with the Amputee Coalition, a nonprofit organization.
[46]Webster, “Ten-Year Outcomes,” 366.
[47]The Department of Veterans Affairs reimburses eligible veterans for health-care related travel expenses.
[48]In 2020, we reported that female veterans faced challenges obtaining appropriately sized prosthetic devices, including limbs. See GAO, Veterans Health Care: Agency Efforts to Provide and Study Prosthetics for Small but Growing Female Veteran Population, GAO‑21‑60 (Washington, D.C.: Nov. 12, 2020).
[49]Joseph B. Webster, “Lower Limb Amputation Care Across the Active Duty Military and Veteran Populations,” Physical Medicine and Rehabilitation Clinics of North America, vol. 30, no. 1 (February 2019): 101.
[50]The Amputee Data Repository contains information on the characteristics of enrolled veterans identified as having limb loss and the care they received through VHA. The National Prosthetic Patient Database contains information on purchase orders related to providing and maintaining prosthetic devices, including prosthetic limbs. VHA organizes these data by federal fiscal year.
[51]International Classification of Diseases codes are the standard code set used in the United States for documenting patient medical diagnoses and procedures. As of 2024, the 10th revision codes are the most current and were used consistently during our selected time period.
[52]These documents included Department of Veterans Affairs, Veterans Health Administration, VHA Directive 1172.03, VHA Amputation System of Care (Dec. 19, 2023) and Department of Veterans Affairs and Department of Defense, Clinical Practice Guideline for Rehabilitation of Individuals with Lower Limb Amputation (Sept. 2017) and Clinical Practice Guideline for the Management of Upper Limb Amputation Rehabilitation (Mar. 2022).
[53]Kathryn Ziegler-Graham et al., “Estimating the Prevalence of Limb Loss in the United States: 2005 to 2050,” Archives of Physical Medicine and Rehabilitation, vol. 89 (March 2008): 425. This study did not include limb loss due to congenital limb difference in its estimate.
[54]Motaz Awad et al., “Pediatric Amputation” in Pediatric Anesthesia: A Comprehensive Approach to Safe and Effective Care, ed. James S. Furstein (Springer Publishing Company, Incorporated, 2022), 593.
[55]Cara T Mai et al., “National Population-based Estimates for Major Birth Defects, 2010-2014, Birth Defects Research, vol. 111 (2019): 1429.
[56]Joan T. Le and Phoebe R. Scott-Wyard, “Pediatric Limb Differences and Amputations,” Physical Medicine and Rehabilitation Clinicians of North America, vol. 26 (2015): 96.
[57]Adrienne R. Socci et al., “What’s New in Pediatric Limb Lengthening and Deformity Correction?,” Journal of Pediatric Orthopedics, vol. 40, no. 7 (August 2020): e600 and P. Calder et al., “A Comparison of Functional Outcome Between Amputation and Extension Prosthesis in the Treatment of Congenital Absence of the Fibula with Severe Limb Deformity,” Journal of Children’s Orthopaedics, vol. 11 (2017): 318-19.
[58]Adrian D. Murphy et al., “The Use of Vascularized Bone Capping to Prevent and Treat Amputation Stump Spiking in the Paediatric Population,” Microsurgery, vol. 37 (2017): 589.
[59]Alan T. Blank et al., “A Novel Method to Prevent Terminal Appositional Overgrowth Following Pediatric Below Knee Amputations: A Case Series and Review of the Literature,” Bulletin of the Hospital for Joint Diseases, vol. 77, no. 4 (2019): 272.
[60]Marcus A. Battraw et al., “A Review of Upper Limb Pediatric Prostheses and Perspectives on Future Advancements,” Prosthetics and Orthotics International, vol. 46, no. 3 (2022): 269.
[61]David E. Westberry “State of the Art: Amputation and Prosthetics,” Journal of Pediatric Orthopedics, vol. 37, no. 6 (September 2017): S24.
[62]Roberta Ciocco, Michelle Hsia, and Tami Konieczny, “Pediatric Hand Therapy—Prosthetics and Training,” in Pediatric Hand Therapy, eds. Joshua M. Abzug, Scott H. Kozin, and Rebecca Neiduski (Elsevier, 2020): 78-79.
[63]Michelle J. Hall et al., “Essentials of Pediatric Prosthetics,” Journal of the Pediatric Orthopaedic Society of North America, vol. 2, no. 3 (November 2020): 7.
[64]Matthew B. Burn, Anderson Ta, and Gloria R. Gogola, “Three-Dimensional Printing of Prosthetic Hands for Children,” The Journal of Hand Surgery, vol. 41, no. 5 (2016): e103.
[65]Arezoo Eshraghi et al., “Walking and Balance in Children and Adolescents with Lower-Limb Amputation: A Review of Literature,” Clinical Biomechanics, vol. 59 (2018): 196.
[66]We analyzed durable medical equipment, health care provider (carrier), inpatient, outpatient, skilled nursing facility, hospice, and home health agency claims for our study.
[67]International Classification of Diseases codes are the standard set of medical classification codes used in the United States, including in the Medicare program, for documenting patient medical diagnoses and procedures. As of 2024, the 10th revision codes are the most current and were used consistently during our selected time period.
[68]Amputation procedure codes are International Classification of Diseases 10th revision procedure codes for the surgical removal of a part or all of a limb from the body. CMS develops and maintains International Classification of Diseases 10th revision procedure codes. We excluded beneficiaries that had both upper and lower limb amputation surgeries in 2016.
[69]Traditional or fee-for-service Medicare consists of Medicare Parts A and B. Medicare Part A covers hospital and other inpatient stays. Medicare Part B is optional insurance and covers physician, outpatient hospital, home health care, certain other services, and the rental or purchase of durable medical equipment, prosthetics, orthotics, and supplies.
[70]For example, see Medicare Payment Advisory Commission, “Chapter 7: Ensuring the Accuracy and Completeness of Medicare Advantage Encounter Data,” Report to Congress: Medicare and the Health Care Delivery System (Washington, D.C.: June 2019).
[71]Although based on the best available data, Medicare race and ethnicity data are known to have some limitations. For example, see U.S. Department of Health and Human Services, Office of Inspector General, Data Brief: Inaccuracies in Medicare’s Race and Ethnicity Data Hinder the Ability to Assess Health Disparities, OEI-02-21-00100 (Washington, D.C.: June 2022). In an effort to improve this data, the Research Triangle Institute developed a methodology that imputes race and ethnicity data for Hispanic and Asian and Pacific Islander beneficiaries based on name, geography, and requests for Social Security Administration or Medicare materials in Spanish. The Department of Health and Human Services Office of Inspector General reported that this variable improves the accuracy of race and ethnicity information for Asian/Pacific Islander and Hispanic beneficiaries.
[72]Medicare is available to three groups of people: (1) aged: individuals aged 65 years or older; (2) disabled: individuals entitled to Social Security benefits due to disability; and (3) end stage renal disease: individuals with permanent kidney failure requiring dialysis or a transplant.
[73]The four U.S. Census Bureau regions are Northeast, Midwest, South, and West.
[74]We used the Veterans Health Administration’s definitions and classification of applicable International Classification of Diseases 10th revision codes to categorize amputation surgeries as major or minor. A major amputation includes the loss of either an entire foot or all or part of a leg (lower limb) or the loss of an entire hand or all or part of an arm (upper limb). Minor amputations include the loss of either a toe or part of a foot (lower limb) or the loss of a finger or part of a hand (upper limb). We excluded 389 beneficiaries with upper and lower amputation surgeries in 2016.
[75]CMS uses these diagnoses to categorize beneficiary health conditions.
[76]We limited our review to health care services that were paid under traditional Medicare.
[77]We selected these services based on clinical practice guidelines for upper and lower limb amputations published by the Departments of Defense and Veterans Affairs. See Department of Veterans Affairs and Department of Defense, Clinical Practice Guideline Rehabilitation of Individuals with Lower Limb Amputation (Sept. 2017) and Clinical Practice Guideline for the Management of Upper Limb Amputation Rehabilitation (Mar. 2022).
[78]HCPCS codes are a collection of standardized codes that represent medical procedures, supplies, products, and services. The codes are used to facilitate the processing of health insurance claims by Medicare and other insurers. According CMS, the 97000 HCPCS codes are included under codes for physical therapy, occupational therapy, and outpatient speech-language pathology services.
[79]Institutional claim types were inpatient, skilled nursing facility, and hospice. Non-institutional claim types were outpatient, carrier, and home health agency.
[80]Institutional claim types were inpatient, skilled nursing facility, and hospice. Non-institutional claim types were outpatient, carrier, and home health agency.
[81]Our analysis excluded physical medicine and rehabilitation services provided by others, such as nurse practitioners and physician assistants.
[82]See 86 Fed. Reg. 73,860 (Dec. 28, 2021).
[83]These codes were: 99281, 99282, 99283, 99284, and 99285.
[84]We used the Veterans Health Administration’s definitions and classification of applicable International Classification of Diseases 10th revision codes to categorize amputation surgeries as major or minor as described previously.
[85]Skilled nursing facilities provide short-term, temporary care after a hospital stay to facilitate recovery and rehabilitation such as following an illness or surgical procedure.