URBAN HOSPITALS
Factors Contributing to Selected Hospital Closures and Related Changes in Available Health Care Services
Report to Congressional Requesters
United States Government Accountability Office
For more information, contact Leslie V. Gordon at GordonLV@gao.gov
Highlights of GAO-25-106473, a report to congressional requesters
Why GAO Did This Study
Hospitals play a critical role in delivering health care services to their communities. Approximately half of U.S. hospitals are in urban areas, and closures of urban hospitals outpaced new openings from 2019 to 2023. GAO and others have previously reported on hospital closures in rural areas, but few studies have been conducted on the closure of urban hospitals.
GAO was asked to examine the bankruptcy and closure of health care facilities. This report describes the closure of five selected urban hospitals, specifically: (1) the financial conditions and other factors that contributed to their closure and (2) how health care service availability in communities changed after their closure. GAO selected a nongeneralizable sample of five hospitals in urban areas that closed in 2022 or 2023. These five selected urban hospitals reflect variation in geographic region, ownership type (for-profit vs. nonprofit), and whether the hospital provided outpatient services after it closed. GAO analyzed financial data on each hospital from the Department of Health and Human Services and reviewed relevant documents including information provided by selected hospitals and publicly available information such as court documents or community health needs assessments. GAO interviewed representatives from these selected hospitals and other stakeholders, such as representatives from nearby hospitals, other health care providers, community organizations, state hospital associations, and local government officials. In addition, GAO visited two selected hospitals.
What GAO Found
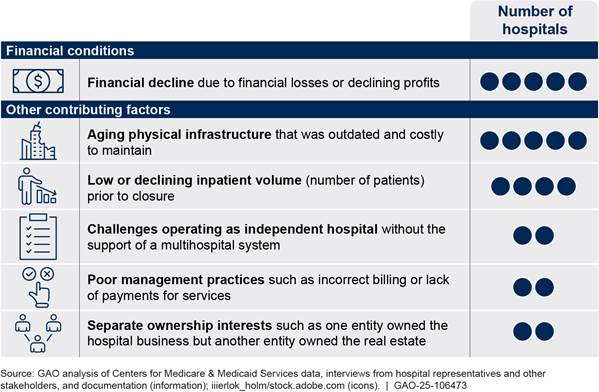
All five urban hospitals included in GAO’s review experienced financial decline characterized by financial losses or declining profits in the 5 years leading to their closure. For instance, one hospital filed for bankruptcy under three different owners within 5 years prior to its closure. Several other factors contributed to hospital financial decline and closure such as aging physical infrastructure, low inpatient volume, challenges operating as independent hospitals, poor management practices, and separate ownership interests.
Factors Contributing to Closure of Five Selected Urban Hospitals in 2022 or 2023
The availability of health care services shifted or decreased in the communities of all five hospitals after the hospitals closed. Specifically, two hospitals continued providing outpatient services after closing their inpatient services, and other providers in their communities adjusted their service availability by, for example, expanding inpatient capacity, according to stakeholders. The other three hospitals ceased all health care services when they closed. After two of them closed, the decline in service availability affected nearby hospitals and community residents. For example, one hospital’s closure reduced the availability of emergency and inpatient services in the part of the city where it was located, which exacerbated pre-existing access to care challenges for community residents, according to stakeholders.
Stakeholders for all five hospitals identified ongoing challenges with access to health care that some residents in their communities continued to experience after the closures. For example, even though the community residents had several options to seek health care after the hospitals closed, some residents lacked adequate transportation to reach alternative facilities or lacked access to primary care providers, according to stakeholders.
|
Abbreviations |
|
|
CMS |
Centers for Medicare & Medicaid Services |
|
HHS |
Department of Health and Human Services |
This is a work of the U.S. government and is not subject to copyright protection in the United States. The published product may be reproduced and distributed in its entirety without further permission from GAO. However, because this work may contain copyrighted images or other material, permission from the copyright holder may be necessary if you wish to reproduce this material separately.
August 20, 2025
The Honorable Terri Sewell
Ranking Member
Subcommittee on Oversight
Committee on Ways and Means
House of Representatives
The Honorable Charles E. Grassley
United States Senate
The Honorable Linda Sanchez
House of Representatives
Hospitals play a critical role in delivering health care services to their communities. In 2022, nearly 30 million patients were admitted to approximately 4,500 general acute care hospitals nationally, and spending on hospital services accounted for about $1.38 trillion, nearly one-third of the $4.5 trillion in total health care spending in the U.S.[1] As of 2022, approximately half of U.S. general acute care hospitals were located in an urban area.
There were 118 hospital closures in both rural and urban areas from fiscal year 2019 through fiscal year 2023.[2] Closures of urban hospitals outpaced openings from 2019 through 2023, with 72 closures and 55 openings nationally in this time period.[3] Some of these recent urban hospital closures included a history of private equity investment.[4]
We and others have reported that closures of rural hospitals can pose challenges, such as making it more difficult for patients—particularly those who are elderly or have low income—to obtain health care services.[5] However, few studies have been conducted on the factors that contributed to the closure of urban hospitals and how these closures affected health care service delivery in their communities.
You asked us to examine the bankruptcy and closure of health care facilities, including their relationship with private equity investments. This report describes the closure of five selected urban hospitals, including
1. the financial conditions and other factors that contributed to their closure, and
2. how health care service availability in communities changed after their closure.
We reviewed five selected urban hospitals that closed in 2022 or 2023. We define a hospital as having closed if it ceased providing inpatient services.[6] To identify urban hospitals that closed in 2022 or 2023, we used the Provider of Services file from the Centers for Medicare & Medicaid Services (CMS), an agency within the Department of Health and Human Services (HHS).[7] We confirmed these closures through online searches and interviews with hospital representatives. We selected five urban hospitals that closed to reflect variation in geographic region, type of ownership (i.e., nonprofit or for-profit), and whether the facility provided outpatient services after it closed. The information obtained about these five selected hospitals is not generalizable to all urban hospitals that closed in 2022 or 2023. We conducted site visits to two of the five selected hospitals to interview hospital representatives and other stakeholders in person as well as tour the facilities and communities. To distinguish the five selected hospitals and maintain their anonymity in this report, we refer to hospitals as hospital A, hospital B, hospital C, hospital D, and hospital E. Hospitals A and B continued providing some outpatient services after they closed their inpatient services.[8] See appendix I for additional detail on the methodology and appendix II for additional detail on the selected hospitals.
For both objectives we interviewed representatives of each of the selected hospitals.[9] We also interviewed other stakeholders, including representatives from nearby hospitals, other health care providers, community organizations, state hospital associations, and local government officials. In addition, we reviewed publicly available documentation on the selected hospitals’ communities such as community health needs assessments, state certificate of need approvals, and public announcements.[10] We considered a selected hospital’s “community” as the population served by the hospital. We generally use the selected hospital’s county to define the broader “area” where the selected hospital and nearby hospitals operate.
To describe the financial conditions and other factors that contributed to the closure of the five selected urban hospitals, we reviewed court documents such as bankruptcy filings and documentation from the selected hospitals on, for example, their finances and the patients served prior to the closure. We also analyzed CMS Medicare Cost Reports for fiscal years 2018 through 2022 on the selected hospitals’ profit margins, occupancy rate, and the average numbers of inpatients per day during the year.[11] In addition, to provide context for the financial conditions of our selected hospitals, we identified a comparison group using other HHS data, specifically the CMS Provider of Services file and a definition from the Federal Office of Rural Health Policy. See appendix I for additional detail on the methodology and appendix III for additional detail on the data analysis.
To assess the reliability of HHS data used in this report, we reviewed related documentation, interviewed agency officials about the data, and performed electronic data checks for missing or obviously erroneous data. We determined that the data were sufficiently reliable for the purposes of our reporting objectives.
We conducted this performance audit from December 2022 to August 2025 in accordance with generally accepted government auditing standards. Those standards require that we plan and perform the audit to obtain sufficient, appropriate evidence to provide a reasonable basis for our findings and conclusions based on our audit objectives. We believe that the evidence obtained provides a reasonable basis for our findings and conclusions based on our audit objectives.
Background
Hospital Revenues and Costs
A hospital’s financial viability depends on the balance of revenues received and costs incurred. A hospital makes a profit when revenue exceeds costs and has a loss when the cost exceeds revenue.
Revenues. A hospital’s primary source of revenue is reimbursement for patient care, including both inpatient and outpatient services.[12] A hospital obtains revenue for the delivery of medical care by billing and submitting claims to the patient’s health insurance—also known as a payer. Three categories of payers—Medicare, Medicaid, and private—accounted for about 81 percent of the approximately $1.38 trillion in national hospital spending on services provided to patients in 2022.[13] Specifically, in 2022, spending by payers was approximately $358 billion for Medicare, $263 billion for Medicaid, and $495 billion for private health insurance.
· Medicare. Medicare generally pays hospitals either on a fee-for-service basis based on rates set through laws and regulations or through managed care plans, which typically pay rates negotiated between plans and hospitals.
· Medicaid. State Medicaid programs pay hospitals either though Medicaid managed care plans or fee-for-service payments. Payment rates can vary considerably across and within states.
· Private health insurance. Private health insurance includes employer-sponsored health insurance and individually purchased private health plans. Private insurance plans typically pay hospitals based on rates negotiated between plans and hospitals.[14] Private insurance rates paid to hospitals generally exceed the fee-for-service rates paid by Medicare.
Some patients receiving hospital services do not have health insurance coverage through Medicare, Medicaid, or private insurance. When hospitals provide care to these uninsured individuals, they may not receive reimbursement. Hospitals may extend financial assistance and have processes to help anticipate whether alternative funding sources will be needed for patients who are unable to pay, according to the American Hospital Association. The Medicare and Medicaid programs also provide supplemental payments to hospitals to help offset the cost of uncompensated care. For example, both programs provide payments—called disproportionate share hospital payments—to hospitals serving large numbers of low-income individuals to help offset these hospitals’ uncompensated costs.[15]
Hospitals also may receive revenue from other sources. For example, some county governments use tax revenue to subsidize hospitals in their county. Hospitals may also receive revenue through charitable donations or income from investments. In addition, we have previously reported that from April 2020 through June 2023 hospitals received federal funding to account for financial losses and expenses related to the COVID-19 pandemic.[16]
Costs. Hospitals are responsible for a variety of operational costs including facilities, staffing, drugs, medical supplies and equipment, and information technology, among other expenses.[17] These costs include maintaining or upgrading their physical infrastructure, which can be significant for hospitals with aging facilities. Hospitals that struggle financially have limited ability to make necessary capital investments in infrastructure, according to the American Hospital Association.[18] In addition, labor costs made up almost 60 percent of an average hospital’s expenditures in 2023, according to the association.
Hospital Ownership
Hospital ownership refers to individuals and companies that have operational or managerial control. There are several dimensions to hospital ownership.
· Private or public ownership. Hospitals may be privately or publicly owned. Private ownership includes hospitals owned by nonprofit organizations or for-profit companies. Nonprofit hospital owners can be universities or religious organizations that demonstrate a charitable purpose by providing services that benefit their communities as a whole and are eligible for a tax exemption.[19] For-profit owners may be individuals or private companies such as corporations or private equity firms. Public hospitals are owned by federal, state, or local governments.
· Independent or system ownership. Hospitals may operate independently or be affiliated with a health system. A health system may include other hospitals (referred to as a multi-hospital system) or other health care providers.[20] The percentage of all U.S. hospitals affiliated with health systems increased from 58 percent in 2010 to 69 percent in 2023, and 78 percent of urban hospitals were affiliated with a system in 2023.[21]
· Separate ownership entities. Hospitals may also have multiple entities owning or operating aspects of the hospital. For example, hospitals may be owned by a parent company and operated by a separate entity. In addition, a hospital business owner may be a different entity than the hospital’s real estate owner, requiring the hospital owner to pay rent.
Financial Decline Over Multiple Years and Other Factors Contributed to Selected Urban Hospital Closures
All five selected urban hospitals experienced multiple years of financial decline prior to closure due to financial losses or declining profits, according to representatives from these hospitals and our analysis of CMS Medicare Cost Report data.[22] Several other factors contributed to the hospitals’ financial decline and closure; these included low or declining inpatient volume, aging physical infrastructure, challenges operating as independent hospitals, poor management practices, and separate ownership interests (see fig. 1).[23]
Figure 1: Financial Conditions and Other Factors Contributing to Closure of Five Selected Urban Hospitals in 2022 or 2023
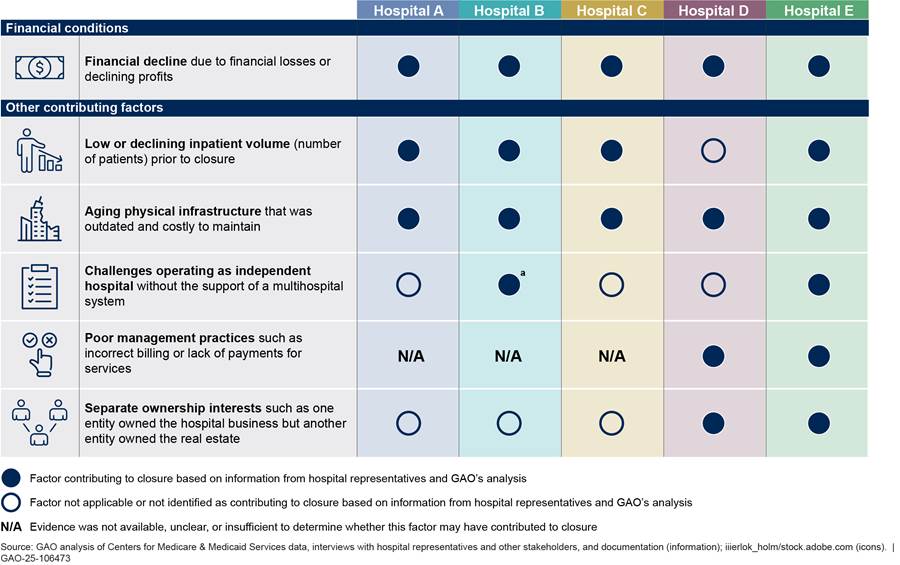
Note: We selected five urban hospitals that closed in 2022 or 2023 to reflect variation in geographic region, ownership type (i.e., nonprofit or for-profit), and whether the facility provided outpatient services after closure.
aThis hospital was the only acute care hospital within its health system and therefore operated as an independent hospital.
Financial Decline. All five selected urban hospitals experienced financial decline that contributed to their closure, according to representatives from the hospitals and our analysis of CMS Medicare Cost Reports. We considered financial decline to be a condition of financial losses or declining profits. For example, representatives from hospital B said they were losing millions of dollars each year, and the health system that owned the hospital redirected the financial support it had been providing for other purposes rather than continuing to support a struggling hospital. Further, two selected hospitals (hospitals D and E) filed for bankruptcy. For example, three consecutive owners of hospital E filed for bankruptcy in the 5 years prior to this hospital’s closure.
The five selected hospitals’ profit margins generally declined from fiscal years 2018 through 2022.[24] Four of the selected hospitals (hospitals A, B, D, and E) experienced financial losses in the fiscal year prior to their closure. One other hospital generally had positive but declining profit margins from 2018 through 2021. This hospital’s profit margins may have declined further in 2022 because, as described in more detail below, its average number of inpatients decreased substantially.
All five selected hospitals also had lower profit margins than the median for urban hospitals nationally in the fiscal year prior to their closures, while four of these selected hospitals’ profit margins were lower than the 25th percentile. For example, three of these selected hospitals (hospitals B, D, and E) had profit margins from negative 30.0 percent to negative 13.5 percent in fiscal year 2022.[25] Margins for these three hospitals were below the 25th percentile in 2022 for urban hospitals nationally, which was negative 5.4 percent (see fig. 2 and app. III for more detail).
Figure 2: Total Profit Margins for Five Selected Urban Hospitals Compared to All Urban Hospitals, Fiscal Years 2018 through 2022
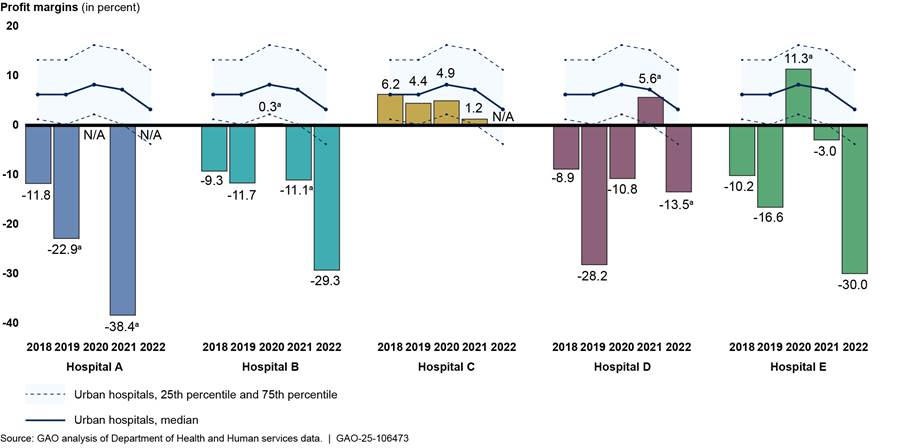
N/A = data not available or cost reporting period was less than 10 months.
Notes: We selected five urban hospitals that closed in 2022 or 2023 to reflect variation in geographic region, ownership type (i.e., nonprofit or for-profit), and whether the facility provided outpatient services after closure. This analysis included all urban hospitals open as of January 1, 2022, and excluded hospitals with cost reporting periods less than 10 months or more than 14 months in a given year. The reported margins include federal relief funds during the COVID-19 public health emergency.
aHospital received COVID-19 Provider Relief Funds in the respective fiscal year.
|
Local Resources for Public Hospitals Some public hospitals may be part of independent governing bodies called Hospital Districts that allow them to levy local taxes to financially support the hospital. Two selected hospitals were located near public hospitals, and these public hospitals were subsidized by local taxes to support health care services, according to representatives from these nearby hospitals. For example, from July 2022 through June 2023 a public hospital located near one selected hospital used about $350 million of these funds for free or discounted services for patients who are unable to pay, also known as charity care. Source: Information from hospital representatives and documentation. | GAO‑25‑106473 |
A complex set of drivers can affect a hospital’s revenue and costs, which may result in financial decline. For example, representatives from four hospitals (hospitals A, B, D, and E) told us that their hospital faced financial challenges because they served a higher percentage of patients covered by Medicare, Medicaid, or who were uninsured in comparison to patients covered by private payers.[26] Representatives from hospital E said that the Medicare and Medicaid reimbursement rates did not keep pace with the increased costs of operating the hospital. This could be influenced by a variety of reasons. For instance, the Medicare Payment Advisory Commission reported that a decline in hospital margins under Medicare fee-for-service in fiscal year 2022 was attributed to drivers such as higher-than-expected inflation with costs increasing faster than Medicare fee-for-service payments, the decline in the federal coronavirus relief funds, and a decrease in Medicare uncompensated care payments.[27] Other factors affecting hospital revenues and costs also contributed to financial decline and closure.
Other Factors Contributing to Closure. All five selected urban hospitals experienced multiple factors that contributed to the hospitals’ closure, according to hospital representatives and our review of CMS Medicare Cost Report data and other documentation such as court documents. These factors included low or declining inpatient volume, aging physical infrastructure, challenges operating as independent hospitals, poor management practices, and separate ownership interests. Factors such as low and declining inpatient volume and aging physical infrastructure also contributed to the hospitals’ financial decline.
Four of the selected hospitals (hospitals A, B, C, and E) experienced low or declining inpatient volume, which may contribute to a hospital’s financial decline. Representatives from three of these selected hospitals (hospitals A, B, and C) reported that a low or declining inpatient volume contributed to the closure of their hospital. In 2022 these four selected hospitals had occupancy rates—the percentage of available beds in use at a given time—between 19 and 27 percent, which was lower than the median occupancy rate of 64 percent for all urban hospitals nationally, according to CMS Medicare Cost Report data. Hospitals with a low occupancy rate incur staffing costs but do not receive patient revenue for beds that are not in use, which contributes to financial decline. Further, CMS Medicare Cost Report data show the four selected hospitals’ average daily census—the average number of inpatients per day during the year—declined from 2018 to 2022 and fell to between 22 and 57 patients in 2022 (see fig. 3). A declining number of patients usually leads to lower hospital revenue over time.
Figure 3: Average Daily Census of Patients for Five Selected Urban Hospitals, Fiscal Years 2018 through 2022
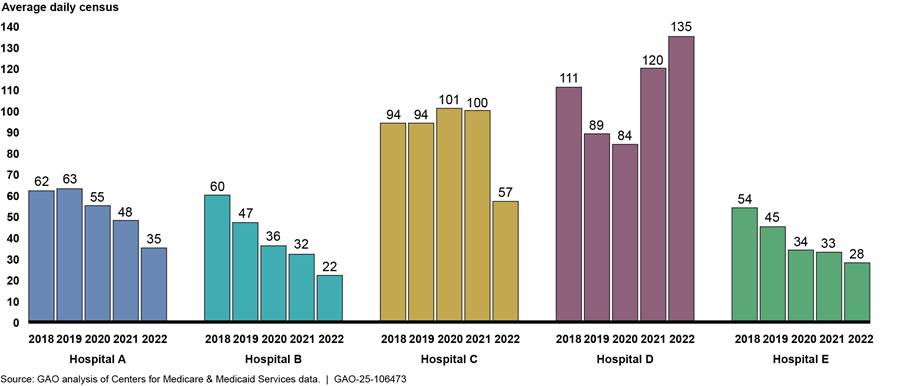
Notes: We selected five urban hospitals that closed in 2022 or 2023 to reflect variation in geographic region, ownership type (i.e., nonprofit or for-profit) and whether the facility provided outpatient services after closure. We calculated average daily census by dividing the number of inpatient days by the days covered in each selected hospital’s cost report in fiscal years 2018 through 2022.
Representatives of selected hospitals cited reduced services, few employed physicians, and competition from a nearby hospital as reasons for low or declining volume.
· Representatives from two selected hospitals (hospitals A and B) said their hospital eliminated or cut back certain types of services—such as cardiology or neurosurgery services—prior to the closure.[28] Representatives from hospital B said they faced challenges maintaining staffing levels for those types of services given their low volume of patients. They said their hospital offered fewer types of services in part because more services are being offered in outpatient settings. In addition, hospital B representatives stated that they cut back on elective surgery at the onset of the pandemic.
· Representatives from three selected hospitals (hospitals A, B, and E) said their hospital employed few physicians prior to closure.[29] Physicians employed by a hospital can refer patients to the hospital’s services, thereby increasing its patient volume and revenue.[30] Representatives from hospital B said that, in contrast to other nearby hospitals, they lost out on patient referrals because they employed fewer physicians than other nearby hospitals.
· Hospital C experienced a significant decline in inpatient volume—from approximately 100 patients per day in 2021 to 57 patients in 2022—due in part to competition from a nearby hospital that had recently opened about 5 miles away, according to hospital representatives. The new hospital immediately reached its capacity, according to representatives from this nearby hospital, and hospital C closed about 11 months later.
Representatives from all five selected urban hospitals stated that their hospitals’ physical infrastructure was outdated and costly to maintain, and representatives from four of these selected hospitals (hospitals A, B, C, and E) stated that anticipated costs for infrastructure updates or maintenance contributed to their hospitals’ closure.[31] For example, one selected hospital’s campus was over 100 years old, had frequent water leaks due to holes in the roof and aging pipes, and was in disrepair due to multiple owners that had not invested in the facility’s maintenance, according to hospital representatives and our observations (see fig. 4). Financial decline over multiple years may have inhibited hospitals’ ability to conduct maintenance and repairs. For example, representatives from hospital A told us that repairing hospital infrastructure would be cost prohibitive, estimating a cost of about $50 million to make the hospital viable, and using CMS Medicare Cost Report data we calculated that this hospital had lost over $43 million in fiscal year 2021. In another example, representatives from hospital B told us that three $1 million generators needed replacement, and we calculated that this hospital had experienced financial losses in 4 of the 5 years prior to closure, losing over $27 million in fiscal year 2022. Further, hospital E’s operator said the hospital needed significant investment to make the facility suitable and safe for patients and employees. For instance, the building’s cooling system had partially failed and two of four elevators were inoperable, according to court documents.
Figure 4: Examples of Hospital Infrastructure in Disrepair at One Selected Urban Hospital, 22 Months After Closure
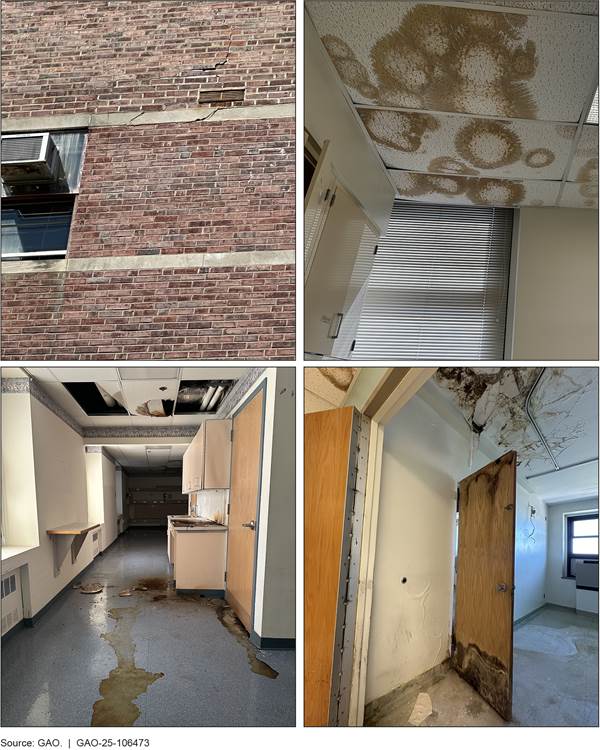
Note: According to hospital representatives, the cost to repair the hospital buildings was prohibitive. GAO visited this selected hospital in 2024, about 22 months after closure, and these photos are not meant to reflect the condition of the hospital prior to closure.
Two selected hospitals (hospitals B and E) faced financial challenges because they operated independently without the support of a multi-hospital system.[32] Independent hospitals often bear the full cost of investments and improvements alone, for example, the cost of electronic health record systems, according to representatives of these two selected hospitals. In contrast to independent hospitals, multi-hospital systems can spread these costs across multiple hospitals. In addition, these two independent hospitals had less leverage when negotiating payment rates with payers compared to other nearby health systems containing multiple hospitals and other health care providers, according to representatives. For example, representatives from hospital E told us that nearby hospitals received at least double the payment amount from private payers compared to the selected hospital.
Poor management practices posed financial challenges for two selected hospitals (hospitals D and E). For example, one representative from hospital E said that a prior owner’s poor management practices, such as inconsistent billing procedures, often led to incorrect billing and ultimately, less revenue. The representative of this hospital told us that the previous owner had not maintained financial records, and the antiquated billing software made it difficult and time consuming to identify the billing problems. Another representative from this hospital also said that continuing poor financial management meant that the hospital was unable to purchase medicine for patients or consistently pay their employees. This hospital struggled to recruit staff in part because it did not pay its employees consistently, according to the representative. Hospital D had been involved in multiple lawsuits related to payment for services rendered in the year of its closure, according to court documents and media reports stating that the hospital had not paid its medical residents or multiple vendors for their services.
Two selected hospitals (hospitals D and E) had separate owners for their business and real estate. Our analysis suggests that this ownership structure may have contributed to closure by impeding the sale of one of these hospitals and imposing certain financial risks on the other. Separate ownership may occur, for example, when a private equity firm sells a hospital’s real estate to a real estate investment trust.[33]
· The ownership by separate entities of hospital D and E’s real estate impeded the sale of at least one of these hospitals, which may have contributed to their closures. Representatives who operated hospital E said they were interested in purchasing the hospital.[34] However, the hospital’s operator and the real estate’s owner reached an impasse when negotiating the terms of the sale, according to representatives of the hospital’s operator, and the hospital closed soon thereafter.[35] The ownership of hospital D’s real estate by a separate entity may have impeded the sale of this hospital as well by making it less attractive to potential buyers. A representative told us this hospital’s owner attempted to sell the hospital before it closed. However, stakeholders from a nearby hospital system told us that they would not have considered acquiring the hospital in part because they would have financial responsibilities for maintaining the building without owning it.
· The ownership by separate entities of hospital D and E’s real estate also could have imposed financial risks on these hospitals. For example, hospital D was acquired by a health system with private equity investment at the same time the real estate of this hospital—and that of other hospitals in this health system—was sold to a real estate investment trust, according to financial documentation. This hospital, along with multiple other hospitals in the system, closed in the years after this transaction. Proceeds from the sale of a hospital’s real estate theoretically can be invested back into the business for improvements.[36] However, this arrangement could also allow investors to extract profits, leaving hospitals with fewer assets and financial obligations of rent payments while continuing to be responsible for building maintenance, among other costs.
Health Care Service Availability Shifted or Decreased After Selected Urban Hospital Closures
After the closure of the five selected urban hospitals, availability of inpatient and some outpatient services shifted or decreased in the hospitals’ communities. Two selected hospitals provided certain outpatient services after they closed or transferred some other services to a nearby hospital. In addition, health care service availability shifted or decreased following the cessation of all health care services by three selected hospitals. Although patients from all five selected urban hospitals had alternative providers or settings for services, stakeholders noted that some residents in their communities continued to experience challenges with access to health care after the closure of the five selected hospitals.
Two Selected Hospitals Provided or Transferred Certain Health Care Services After Closure, and Nearby Providers Adjusted Service Availability
Two selected hospitals (hospitals A and B) continued providing certain outpatient services, such as emergency department services, after closing their inpatient services, according to representatives and documentation from these hospitals. In addition, some services—such as cardiac surgery—were transferred to a nearby hospital. After these two selected hospitals closed, nearby hospitals and other providers adjusted service availability by, for example, taking steps to expand inpatient capacity, according to representatives from these nearby hospitals and providers.
Hospital A
|
Snapshot of Hospital A · Nonprofit, safety-net hospital with 130 available beds · Services offered: inpatient, cardiac surgery, and emergency department, among others · City residents: 25 percent in poverty and 20 percent uninsured · Inpatient volume: daily average about 50 patients in fiscal year 2021 · Profit margin: -38 percent in fiscal year 2021 · Nearby hospitals: three others in the area (two owned by health system that acquired hospital A), nearest hospital about 2 miles away Source: GAO analysis of data from Health and Human Services and U.S. Census Bureau and information from hospital representatives. | GAO‑25‑106473 |
The local health system that acquired hospital A continued providing emergency department services on hospital A’s campus and transferred certain other services—such as cardiac surgery—to a nearby hospital.[37] This health system was required to maintain emergency department services in the community when it acquired hospital A as part of the state’s certificate of need process, which is designed to ensure that service delivery changes such as these meet the community’s needs.
|
Hospital A: Community Engagement The health system that acquired hospital A was required to engage with the community by holding at least one public hearing before the hospital’s closure and by seeking ongoing input through community advisory groups. The health system was required to take these actions to comply with the state’s certificate of need process, which is designed to ensure that the community has access to quality health care services. At the time of our review—2 years after hospital A’s closure—the health system that acquired the hospital continued to engage with the community through these groups, which include faith leaders, community organizations, educational representatives, first responders, health care providers and elected officials. Community needs discussed at these regular meetings ranged from health care needs such as pediatric emergency services or cancer resources to social needs such as food insecurity or job trainings. The health system was also taking steps to help address the community’s needs by, for example, supporting a mobile food pantry and providing financial assistance to families to help with housing needs, according to hospital representatives. Representatives of a community organization recognized the steps the health system was taking to improve its connection to the community but said that more work was needed to understand and invest in addressing the community’s needs.
Source: GAO analysis of information from stakeholders (information) and GAO (image). | GAO‑25‑106473 Note: On Wednesdays, the health system offers mobile food pantry services outside of hospital A through its partnership with other community organizations. |

· The health system that acquired hospital A kept this hospital’s emergency department open as a satellite emergency department after hospital A closed, as required by the certificate of need. According to health system representatives, maintaining the emergency department at its current location after hospital A’s closure was the best way to meet the community’s needs.
· The health system also transferred other services, including cardiac surgery services, from hospital A to a hospital within its system that was about 2 miles away. As a result, these services continued to be available within the city rather than residents having to travel to hospitals outside the city. In addition, the nearby hospital was better equipped to support the cardiac surgery services transferred from hospital A, according to health system representatives. For example, this nearby hospital could sustain a higher volume of cardiac surgery services and offered a broader range of services that could better meet the needs of patients with higher acuity.
Two nearby hospitals adapted to an increase in inpatient volume following hospital A’s closure by expanding inpatient capacity or taking other steps, according to representatives of these hospitals. The increase in patient volume was due in part to hospital A’s closure as well as other factors such as nationwide trends of increased service use since the COVID-19 pandemic, according to representatives of these two hospitals.[38]
One of these nearby hospitals, which was less than 2 miles away and part of the health system that acquired hospital A, experienced overcrowding in its emergency department as patients waited for inpatient beds to become available, according to representatives from this hospital. This health system was expanding the hospital’s capacity to provide inpatient and emergency department services, among other types of services, but health system representatives noted that such expansions could take several years to complete.[39]
The other nearby hospital—located about 5 miles from hospital A—also experienced an increase in inpatient volume following hospital A’s closure, according to representatives from this nearby hospital. They also said the hospital had to rapidly adapt to manage the increase in volume and did so by reducing patients’ length of stay and reconfiguring its staffing process. Stakeholders from this nearby hospital noted that, if they had more notice about the closure, they would have been better prepared for the influx of patients that followed hospital A’s closure.[40]
Hospital B
|
Snapshot of Hospital B · Nonprofit, safety-net hospital with 90 available beds · Services offered: inpatient, emergency department, and comprehensive psychiatric services—inpatient, outpatient, and emergency department—among others · Inpatient volume: daily average about 40 patients in fiscal year 2022 · Profit margin: -29 percent in fiscal year 2022 · City residents: 31 percent in poverty and 9 percent uninsured · Nearby hospitals: 14 others in the area, nearest hospital less than 2 miles away Source: GAO analysis of data from Health and Human Services and U.S. Census Bureau and information from hospital representatives. | GAO‑25‑106473 |
Hospital B temporarily provided certain outpatient and psychiatric emergency department services after it closed; beginning in 2026, nearby providers plan to provide these services on or near hospital B’s campus, according to stakeholders.
· After hospital B’s closure, the hospital operated an outpatient clinic on its campus offering services such as urgent care, behavioral health care, and addiction treatment services.[41] Hospital representatives said that the population they served lacked primary care and depended on hospital B’s emergency department to meet their primary care needs. Additionally, a local outpatient behavioral health provider told us they experienced an increase in patients seeking behavioral health and substance use treatment following hospital B’s closure. Hospital B also collaborated with a local provider to establish a federally qualified health center on hospital B’s campus, which hospital representatives expected to begin operating in 2026. Another local provider planned to open a behavioral health facility in 2026 across the street from hospital B’s campus, which will provide services such as outpatient behavioral health, substance use disorder treatment, and psychiatric inpatient and emergency department services, according to stakeholders.
· Hospital B provided psychiatric emergency department services for approximately 18 months after the hospital closed, which helped maintain the availability of these services in the community.[42] A nearby hospital opened a psychiatric emergency department approximately 4 months after hospital B stopped providing these services, according to representatives of this nearby hospital. In addition, as noted above, a local provider plans to begin providing psychiatric emergency department services across the street from hospital B’s campus in 2026.[43]
Hospital B’s closure did not significantly affect the availability of most inpatient services but may have intensified the existing scarcity of inpatient psychiatric services in the community, according to stakeholders. Hospital B’s closure was unlikely to have significantly affected the availability of most inpatient services for two reasons. First, hospital B’s provision of inpatient services had declined over time. Second, the 14 other hospitals in the area operated by three major health systems—including four hospitals within 5 miles—likely absorbed the additional patients after hospital B’s closure. However, like many other communities, there was an ongoing scarcity of inpatient psychiatric beds among area hospitals, according to representatives from hospital B and other stakeholders.[44] Representatives of hospital B noted that, because of the scarcity of inpatient psychiatric beds, some patients had to be transported to other counties for these services. Therefore, hospital B’s cessation of inpatient psychiatric services when it closed—coupled with a nearby hospital’s reduction of inpatient psychiatric beds around the same time—may have intensified this existing scarcity, according to representatives of hospital B.[45]
Health Care Service Availability Shifted or Decreased Following Cessation of All Health Care Services by Three Selected Hospitals
Health care service availability in three communities shifted or decreased following the closure of hospitals C, D, and E, according to representatives and documentation from these selected hospitals and other stakeholders. When these three hospitals closed, they ceased all health care services and in at least two cases provided little advanced notice to their communities, according to stakeholders. Hospital C’s closure contributed to an increase in demand for inpatient and emergency department services at a nearby hospital. This nearby hospital adapted to the closure by expanding its capacity for these services, according to hospital representatives. In the case of hospital D’s closure, stakeholders reported reduced availability of inpatient and obstetric services. With hospital E’s closure, stakeholders disagreed about whether the closure exacerbated access to health care services.
Hospital C
|
Snapshot of Hospital C · For-profit hospital with 230 available beds · Services offered: inpatient, cardiac surgery, and emergency department, among others · Inpatient volume: daily average about 100 patients in fiscal year 2021 · Profit margin: +1 percent in fiscal year 2021 · City residents: 9 percent in poverty and 11 percent uninsured · Nearby hospitals: four others in the area, nearest hospital about 4 miles away Source: GAO analysis of data from Health and Human Services and U.S. Census Bureau and information from hospital representatives. | GAO‑25‑106473 |
When hospital C closed on short notice, the demand for inpatient and emergency department services increased at a nearby hospital, and it responded by expanding its capacity for these services. Hospital C closed after giving its staff and the community a 30-day notice and did not engage the community in the closure process, according to a hospital representative and other stakeholders. Hospital C’s closure occurred when demand for inpatient services had been increasing in the area due to factors such as population growth.[46]
Further, a nearby hospital was operating at capacity even prior to hospital C’s closure, according to stakeholders from this nearby hospital. Without adequate time to prepare for the closure, this nearby hospital experienced increased demand for emergency department and inpatient services, according to stakeholders from this hospital. This increased demand following hospital C’s closure led to overcrowding in this nearby hospital’s emergency department, according to a stakeholder.
This nearby hospital accelerated its expansion plans to accommodate the increased demand for inpatient and emergency services following hospital C’s closure, according to stakeholders from the nearby hospital. These plans, which were completed approximately 2 years after hospital C closed, doubled the hospital’s inpatient and emergency department capacity. This expansion likely compensated for the loss of inpatient service availability when hospital C closed, which averaged about 100 patients per day in the year before it closed.
Hospital D
|
Snapshot of Hospital D · For-profit, safety-net hospital with 190 available beds · Services offered: inpatient, behavioral health (including inpatient psychiatric), obstetric, and emergency department, among others · Inpatient volume: daily average about 135 patients in fiscal year 2022 · Profit margin: -14 percent in fiscal year 2022 · City residents: 17 percent in poverty and 20 percent uninsured · Nearby hospitals: 14 others in the area, nearest hospital 7 miles away Source: GAO analysis of data from Health and Human Services and U.S. Census Bureau and information from hospital representatives. | GAO‑25‑106473 |
Hospital D’s closure reduced the availability of health care services in the southern part of the city where it was located, leaving only one hospital remaining in that part of the city. Hospital D gave its community 60 days of notice before it closed, though one stakeholder characterized the closure as sudden. After hospital D’s closure, the remaining hospital in the southern part of the city was about 7 miles away and not easily reached by public transportation. In contrast, most of the city’s hospitals were concentrated in the northern part of the city, a more affluent area, according to stakeholders.
Community residents had challenges obtaining health care services before hospital D’s closure, according to stakeholders, and the closure exacerbated these challenges. Specifically, hospital D’s closure reduced the availability of health care services such as emergency department, inpatient (including inpatient psychiatric), and obstetric services, according to stakeholders. Furthermore, the only other hospital remaining in the community was about half the size of hospital D.[47] Stakeholders also told us the following.
· Area hospitals had to absorb larger numbers of psychiatric patients and experienced an influx of patients in their emergency departments.
· Pregnant women in the community likely had to travel farther for obstetric services because hospital D had been one of the few obstetric service providers in the community.
· Community residents may have needed to travel farther to access health care services. For example, many of the physicians who had office space near hospital D also chose to relocate.
Hospital E
|
Snapshot of Hospital E · For-profit, safety-net hospital with 150 available beds · Services offered: inpatient, psychiatric, and emergency department, among others · Inpatient volume: daily average about 30 patients in fiscal year 2022 · Profit margin: -30 percent in fiscal year 2022 · City residents: 20 percent in poverty and 11 percent uninsured · Nearby hospitals: two others in the city, both within 5 miles. Source: GAO analysis of data from Health and Human Services and U.S. Census Bureau and information from hospital representatives. | GAO‑25‑106473 |
Stakeholders’ perspectives differed on the effect that hospital E’s closure had on health care service availability in its community. The decision to close hospital E was finalized less than one week before the closure, according to court documents and a hospital representative.[48] A local government official asserted that hospital E’s closure exacerbated pre-existing challenges that its community faced with accessing health care services, including emergency department and behavioral health services. Hospital E representatives also acknowledged that after its closure, community residents needing emergency department services likely had to obtain these services from other hospitals that typically had longer emergency department wait times.
Other stakeholders offered a different assessment. For example, representatives of a nearby safety-net hospital stated that, although the community faced ongoing challenges accessing health care services, hospital E’s closure did not exacerbate these challenges for two reasons. First, hospital E’s inpatient volume had declined amid multiple bankruptcies and frequent ownership changes.[49] Second, nearby hospitals had expanded their capacity or were able to absorb hospital E’s patients.
Stakeholders Reported Some Community Residents’ Ongoing Challenges Accessing Health Care Services
Some community residents continued to face challenges accessing health care services after the closure of all selected hospitals, according to stakeholders. Stakeholders reported an ongoing lack of transportation, primary care, and insurance coverage.
Some community residents faced inadequate transportation options, and the closure of selected hospitals may have made travelling to obtain health care services more difficult, according to stakeholders for all five selected hospitals.[50] For example, stakeholders in hospital B’s community noted that traveling to a hospital located 4 miles from hospital B could be challenging without access to a vehicle, and one of them also said getting there requires crossing a river that was a barrier between communities in the city. In another community, a hospital located 4 miles from hospital E was accessible via public transportation; however, representatives said traveling there could still be challenging for community residents unable to pay for public transportation. Some hospitals we interviewed provided transportation assistance for residents in their communities. For example, a hospital located about 5 miles from hospital A provided financial assistance with transportation, but hospital representatives noted that funding for this assistance was limited.
Some community residents relied on the emergency department for health care needs such as primary care, according to stakeholders for four selected hospitals (hospitals A, B, D, and E). Therefore, the closure of the selected hospitals’ emergency departments may have exacerbated access challenges for individuals without access to primary care providers.[51] In addition, some residents of hospital B’s community could have difficulty accessing health care services from providers after the hospital’s closure in part because they lacked awareness of other providers, according to hospital B representatives. In hospital A’s community, residents—many of whom were immigrants—identified with hospital A’s Christian mission, had built relationships over many years with its staff, and did not feel the same connection with other providers, according to stakeholders.
The lack of insurance coverage was another ongoing challenge faced by some residents in the communities of at least three selected hospitals (hospitals A, D, and E), according to stakeholders.[52] Uninsured individuals are more likely to delay or forego health care for financial reasons.[53] Representatives of all three of these hospitals stated that many of their patients were uninsured. For example, hospital E was a safety-net hospital, and a hospital representative reported that 38 percent of its patients were uninsured in the year before it closed. When hospital E was in operation, a staff person was available to help its uninsured patients enroll in insurance coverage through Medicaid or Medicare, according to a hospital representative. In addition, an estimated 20 percent of residents were uninsured in the cities where hospitals A and D were located.[54] Uninsured residents in hospital D’s community faced greater challenges accessing health care services after the hospital closed, according to one stakeholder, and the uninsured in other communities where selected hospitals closed may have faced similar challenges.
Agency Comments
We provided a draft of this report to HHS for review and comment. HHS provided technical comments, which we incorporated as appropriate.
As agreed with your offices, unless you publicly announce the contents of this report earlier, we plan no further distribution until 30 days from the report date. At that time, we will send copies of this report to the appropriate congressional committees, the Secretary of Health and Human Services, and other interested parties. In addition, the report will be available at no charge on the GAO website at https://www.gao.gov.
If you or your staff have any questions about this report, please contact me at GordonLV@gao.gov. Contact points for our Offices of Congressional Relations and Public Affairs may be found on the last page of this report. GAO staff who made key contributions to this report are listed in appendix IV.

Leslie V. Gordon
Director, Health Care
This report describes the closure of selected urban hospitals, specifically: (i) the financial conditions and other factors that contributed to their closure, and (ii) how health care service availability in communities changed after their closure. To address these objectives, we reviewed five urban hospitals that closed in 2022 or 2023 and analyzed Department of Health and Human Services data.
To select five hospitals in urban areas that closed in 2022 or 2023, we first identified general acute care hospitals using the Centers for Medicare & Medicaid Services’ (CMS) Provider of Services files.[55] We identified a hospital as urban by adapting a definition from the Federal Office of Rural Health Policy.[56] We defined a hospital closure as the cessation of inpatient services.[57] We identified urban hospitals that closed in 2022 or 2023 among these urban hospitals based on the CMS Provider of Services file and confirmed these closures through online searches and interviews with hospital representatives.[58]
We selected a nongeneralizable sample of five urban hospitals that closed in 2022 or 2023 based on the list of urban hospital closures described above. These five selected urban hospitals reflect variation in (i) geographic region, (ii) ownership type (i.e., nonprofit or for-profit), and (iii) closure type.
· Geographic region.[59] Two of the five selected hospitals were located in the Midwest, two were in the South, and one hospital was in the Northeast.
· Ownership type.[60] Three of the five selected hospitals were owned by for-profit entities, and two were owned by nonprofit entities.
· Closure type.[61] We classified closures into two types, (i) the hospital ceased inpatient services but continued to provide other health care services at the same location (e.g., outpatient including emergency department services) after closing; and (ii) the hospital ceased all health care services and did not provide any health care services after closing. Among our five selected hospitals, two hospitals offered certain outpatient services after closing while three hospitals closed completely.
For more information on the characteristics of the five selected urban hospitals in our study, see appendix II.
To describe the financial conditions of our five selected hospitals in the years leading up to their closure, we calculated their total profit margins using data from CMS Medicare Cost Reports for fiscal years 2018 through 2022.[62] The total profit margin measures a hospital’s costs relative to its revenue and is calculated as revenue minus costs divided by revenue. The total profit margin is one indicator of a hospital’s financial condition.[63] We included revenue and costs associated with all of a hospital’s patients. To provide context for our selected hospitals’ profit margins, we calculated the total profit margins for all urban hospitals during the same period.[64] See appendix III for more detail.
We also described the utilization of inpatient services (average daily census and occupancy rate) and other characteristics of our five selected hospitals.[65] We calculated selected hospitals’ average daily census and occupancy rate using CMS Medicare Cost Reports for fiscal years 2018 through 2022. We calculated average daily census by dividing the number of inpatient days by the days covered in a given fiscal year. We calculated occupancy rate by dividing hospital days by hospital bed days available for each selected hospitals in a given fiscal year. We also obtained additional information on selected hospitals from CMS Medicare Cost Reports, including bed size, system affiliation, and whether the hospital received federal relief fund payments during the COVID-19 public health emergency.
To provide context on service availability in our selected hospitals’ communities, we described the number of hospitals in the area and the distance between selected hospitals and nearby hospitals. To calculate the distance from each selected hospital to the nearest hospital, we first identified hospitals in the vicinity of each selected hospital using the CMS Provider of Services file and data from state health departments as applicable. We calculated the straight-line distance (also known as “crow-fly miles”) from our selected hospitals to nearby hospitals using the geographic coordinates of each hospital’s address.[66]
This appendix provides additional information on five selected urban hospitals in our study (see table 1) and residents in the cities in which these hospitals were located (see table 2). For more detail on how we selected these hospitals, see appendix I.
|
|
Hospital A |
Hospital B |
Hospital C |
Hospital D |
Hospital E |
|
Years in operation |
150 |
160 |
70 |
40 |
150 |
|
Bed sizea |
130 |
90 |
230 |
190 |
150 |
|
Ownership |
Nonprofit |
Nonprofit |
For-profit |
For-profit |
For-profit |
|
System affiliationb |
Yes |
Yes |
Yes |
Yes |
No |
|
Closure typec |
Provided certain services |
Provided certain services |
Ceased all services |
Ceased all services |
Ceased all services |
|
Number of nearby hospitalsd |
3 |
14 |
4 |
14 |
2 |
|
Distance to nearest hospital in milese |
2 |
2 |
4 |
7 |
3 |
Source: GAO analysis of Health and Human Services data, information obtained from hospital representatives, and documentation. | GAO‑25‑106473
Note: We selected five urban hospitals that closed in 2022 or 2023. We identified hospitals as urban by adapting a definition from the Federal Office of Rural Health Policy. Selected hospitals also reflect variation in geographic region: specifically, two hospitals were located in Midwest, two hospitals were located in South, and one hospital was located in Northeast.
aWe rounded the number of available beds from fiscal year 2022 Medicare Cost Report to the nearest ten. Bed size reported differs from and is generally fewer than number of licensed beds.
bWe determined that a hospital was affiliated with a health system if it was part of an organization that includes at least one hospital and at least one group of physicians that provides comprehensive care and who are connected with each other and with the hospital through common ownership or joint management. Hospital B was part of a health system but was the sole hospital in its health system.
cWe classified closures into two types, (i) the hospital ceased inpatient services but continued to provide other health care services at the same location (e.g., outpatient including emergency department services) after closing; and (ii) the hospital ceased all health care services after closing. Among our five selected hospitals, two hospitals offered certain health care services after closing while three hospitals closed completely.
dWe focused our analysis on general acute care hospitals operating in the same county. Hospital E was located in an independent city that operates as its own county.
eWe calculated the straight-line distance (also known as “crow-fly miles”) from the selected hospital to the nearest hospital, which is generally shorter than the actual travel distance.
|
In percent |
|
|
|
|
|
|||||
|
|
Hospital A |
Hospital B |
Hospital C |
Hospital D |
Hospital E |
|||||
|
Racea |
|
|
|
|
|
|||||
|
White |
19 |
37 |
89 |
48 |
46 |
|||||
|
Black |
43 |
47 |
1 |
7 |
43 |
|||||
|
Language other than English spoken at homeb |
45 |
15 |
13 |
40 |
9 |
|||||
|
Persons in povertyc |
25 |
31 |
9 |
17 |
20 |
|||||
|
Persons without health insuranced |
20 |
9 |
11 |
20 |
11 |
|||||
Source: U.S. Census Bureau. | GAO‑25‑106473
Note: We retrieved Quick Facts data from the U.S. Census Bureau for these cities on April 7, 2025, which were based on 2019-2023 American Community Survey 5-year estimates.
aIncludes persons reporting only a single race, regardless of Hispanic origin.
bPercentages are calculated for individuals with age 5 years and above.
cThe official poverty definition applied by the Census Bureau uses a set of money income thresholds before taxes and does not include capital gains or noncash benefits and considers every individual in the family is in poverty if a family’s total income is less than the threshold.
dPercentages are calculated for individuals with age under 65 years. Individuals are considered to be uninsured if they did not have health insurance coverage for the entire calendar year.
Appendix III: Total Profit Margins for Five Selected Urban Hospitals Compared to All Urban Hospitals, Fiscal Years 2018 Through 2022
This appendix describes the total profit margins of the five selected urban hospitals in our study from fiscal years 2018 through 2022, as presented in figure 2. In addition, we calculated the total profit margins for all urban hospitals during the same period (see table 3). For more detail on how we selected these hospitals, see appendix I.
Table 3: Total Profit Margins for Five Selected Urban Hospitals and All National Urban Hospitals, Fiscal Years 2018 through 2022
|
|
2018 |
2019 |
2020 |
2021 |
2022 |
|
Selected urban hospitals |
|
|
|
|
|
|
Total profit margin |
|
|
|
|
|
|
Hospital A |
-11.8% |
-22.9%a |
N/A |
-38.4%a |
N/A |
|
Hospital B |
-9.3% |
-11.7% |
0.3%a |
-11.1%a |
-29.3% |
|
Hospital C |
6.2% |
4.4% |
4.9% |
1.2% |
N/A |
|
Hospital D |
-8.9% |
-28.2% |
-10.8% |
5.6%a |
-13.5%a |
|
Hospital E |
-10.2% |
-16.6% |
11.3%a |
-3.0% |
-30.0% |
|
All urban hospitals |
|
|
|
|
|
|
Number |
1,965 |
1,975 |
2,029 |
2,042 |
2,049 |
|
Total profit margin |
|
|
|
|
|
|
25th percentile |
-0.3% |
-0.5% |
1.5% |
-1.1% |
-5.4% |
|
Median |
5.5% |
5.4% |
7.4% |
6.2% |
1.9% |
|
75th percentile |
11.6% |
11.8% |
15.1% |
13.9% |
10.0% |
Source: GAO analysis of the Department of Health and Human Services data. | GAO‑25‑106473
N/A = data not available or cost reporting period was less than 10 months.
Notes: We selected five urban hospitals that closed in 2022 or 2023 to reflect variation in geographic region, ownership type (i.e., nonprofit or for-profit), and whether the facility provided outpatient services after closure. This analysis included all urban hospitals open as of January 1, 2022, and excluded hospitals with cost reporting period less than 10 months or more than 14 months in a given year.
Total profit margin is calculated as revenue minus costs divided by revenue. We included revenue and costs associated with all of a hospital’s patients. These margins are reported including federal relief funds during the COVID-19 public health emergency.
aHospital received COVID-19 Provider Relief Funds in the respective fiscal year.
GAO Contact
Leslie V. Gordon at GordonLV@gao.gov
Staff Acknowledgments
In addition to the contact named above, William Black (Assistant Director), Suhna Lee (Analyst-in-Charge), Naomi Joswiak, Patrick Netherclift, and Laurie Pachter made key contributions to this report. Also contributing were Dan Lee, Eric Peterson, Roxanna Sun, and Jennifer Whitworth.
The Government Accountability Office, the audit, evaluation, and investigative arm of Congress, exists to support Congress in meeting its constitutional responsibilities and to help improve the performance and accountability of the federal government for the American people. GAO examines the use of public funds; evaluates federal programs and policies; and provides analyses, recommendations, and other assistance to help Congress make informed oversight, policy, and funding decisions. GAO’s commitment to good government is reflected in its core values of accountability, integrity, and reliability.
Obtaining Copies of GAO Reports and Testimony
The fastest and easiest way to obtain copies of GAO documents at no cost is through our website. Each weekday afternoon, GAO posts on its website newly released reports, testimony, and correspondence. You can also subscribe to GAO’s email updates to receive notification of newly posted products.
Order by Phone
The price of each GAO publication reflects GAO’s actual cost of production and distribution and depends on the number of pages in the publication and whether the publication is printed in color or black and white. Pricing and ordering information is posted on GAO’s website, https://www.gao.gov/ordering.htm.
Place orders by calling (202) 512-6000, toll free (866) 801-7077,
or
TDD (202) 512-2537.
Orders may be paid for using American Express, Discover Card, MasterCard, Visa, check, or money order. Call for additional information.
Connect with GAO
Connect with GAO on X,
LinkedIn, Instagram, and YouTube.
Subscribe to our Email Updates. Listen to our Podcasts.
Visit GAO on the web at https://www.gao.gov.
To Report Fraud, Waste, and Abuse in Federal Programs
Contact FraudNet:
Website: https://www.gao.gov/about/what-gao-does/fraudnet
Automated answering system: (800) 424-5454
Media Relations
Sarah Kaczmarek, Managing Director, Media@gao.gov
Congressional Relations
A. Nicole Clowers, Managing Director, CongRel@gao.gov
General Inquiries
[1]Medicare Payment Advisory Commission, A Data Book: Health Care Spending and the Medicare Program (Washington, D.C.: July 2024) and Centers for Medicare & Medicaid Services, National Health Expenditure Accounts, Table 2: National Health Expenditures; Aggregate, Annual Percent Change, Percent Distribution and Per Capita Amounts, by Type of Expenditure: Selected Calendar Years 1960-2023, accessed on Jan. 31, 2025.
[2]Medicare Payment Advisory Commission, Report to the Congress: Medicare Payment Policy (Washington, D.C.: March 2025).
[3]Medicare Payment Advisory Commission, Report to the Congress: Medicare Payment Policy.
[4]See, for example: Nicquel Terry Ellis and Brandon Tensley, “Hospital Closures Batter Many Urban Communities,” Philadelphia Tribune, December 9, 2022; Chris Pomorski, “The Death of Hahnemann Hospital,” The New Yorker, May 31, 2021; and “Turning Patients into Profit: How Steward Embodies the Risk of Private Equity's Push in American Health Care,” Boston Globe, January 5, 2025.
[5]See, for example: GAO, Rural Hospital Closures: Number and Characteristics of Affected Hospitals and Contributing Factors, GAO‑18‑634 (Washington, D.C.: Aug. 29, 2018); GAO, Rural Hospital Closures: Affected Residents Had Reduced Access to Health Care Services, GAO‑21‑93 (Washington, D.C.: Dec. 22, 2020); Medicare Payment Advisory Commission, Report to the Congress: Medicare and the Health Care Delivery System (Washington, D.C.: June 2021); and Jane Wishner et al., A Look at Rural Hospital Closures and Implications for Access to Care: Three Case Studies (Menlo Park, Calif.: Kaiser Family Foundation, 2016).
[6]Inpatient services involve admission to a hospital for one or more overnight stays while outpatient services do not require an admission. Examples of inpatient services include complex surgeries and care that requires close monitoring by health care professionals such as for serious medical or mental health issues and treatment for substance use disorder.
[7]We determined potential closures by identifying general acute care hospitals with a termination date in 2022 and 2023 in the Provider of Services file. We identified a hospital as urban by adapting a definition from the Federal Office of Rural Health Policy within HHS’s Health Resources and Services Administration. We excluded specialty and emergency hospitals, federal hospitals, hospitals with other specialized characteristics, and hospitals located in U.S. territories.
[8]The selected hospitals continued offering some outpatient services such as emergency department and addiction treatment.
[9]These representatives included individuals with a leadership role in the entities that owned, managed, or operated the selected hospitals around the time of closure. We reviewed information from hospital representatives on factors that may have contributed to their closure, including factors specific to the selected hospitals, such as their financial condition and physical infrastructure, as well as the hospitals’ broader operating conditions, such as the extent of competition from nearby hospitals and the effects of the COVID-19 pandemic.
[10]Federal law requires all non-profit hospitals to conduct a community health needs assessment every 3 years. To do so, the hospital must solicit input from and consider the broad interests of the community. It may also conduct its community health needs assessment in collaboration with other organizations and facilities, including for-profit and government hospitals, government agencies, and non-profit organizations. See 26 U.S.C. § 501(r)(3); https://www.irs.gov/charities-non-profits/community-health-needs-assessment-for-charitable-hospital-organizations-section-501r3.
Certificate of need laws are state laws that require providers to obtain permission from the state and to demonstrate community need to expand or construct new health care facilities such as hospitals. According to the National Conference of State Legislatures, 35 states and Washington, D.C., operated certificate of need programs, with wide variation by state as of April 2025.
[11]Hospitals, among other Medicare certified facilities, are required to submit annual cost reports to CMS.
[12]The Center for Health Affairs, Hospital Finance 101 (Cleveland, OH).
[13]The remainder of the spending came from various other sources including other third-party payers and out-of-pocket spending by patients. See Centers for Medicare & Medicaid Services, National Health Expenditure Accounts, Table 7: Hospital Care Expenditures; Levels, Percent Change, and Percent Distribution, by Source of Funds: Selected Calendar Years 1970-2023, accessed on May 14, 2025.
[14]Congressional Budget Office, The Prices That Commercial Health Insurers and Medicare Pay for Hospitals’ and Physicians’ Services (January 2022).
[15]See GAO, Hospital Uncompensated Care: Federal Action Needed to Better Align Payments with Costs, GAO‑16‑568 (Washington, D.C.: June 30, 2016).
[16]For example, COVID-19-related losses or expenses include losses related to postponed patient care and expenses related to supplies, such as personal protective equipment, and facility upgrades to limit the spread of COVID-19. HHS distributed funding from the Provider Relief Fund to certain hospitals such as those with a high number of COVID-19 admissions or that provided care to vulnerable populations and operate on thin profit margins. See GAO, COVID-19 Provider Relief Fund: HRSA Continues to Recover Remaining Payments Due from Providers, GAO‑23‑106083 (Washington, D.C.: Sept. 21, 2023).
[17]Some costs—such as for labor, medical equipment, and maintaining physical infrastructure—generally do not change in the short-term based on the number of patients the hospital serves. Other costs—such as for medication and disposable supplies—can change in the short term with the number of patients served. See Rebecca Roberts et al., “Distribution of Variable vs Fixed Costs of Hospital Care,” JAMA, vol. 281, no. 7 (1999), and American Hospital Association, The Financial Stability of America’s Hospitals and Health Systems Is at Risk as the Costs of Caring Continue to Rise (2023).
[18]American Hospital Association, America’s Hospitals and Health Systems Continue to Face Escalating Operational Costs and Economic Pressures as They Care for Patients and Communities (2024).
[19]Factors identified by the Internal Revenue Service that demonstrate a community benefit include, for example, operating an emergency room open to all, regardless of ability to pay, and providing care to all patients able to pay, including those who do so through Medicare and Medicaid. We recommended that Congress consider amending the Internal Revenue Code to specify services and activities Congress believes would provide sufficient community benefits, which could improve the Internal Revenue Service’s ability to oversee tax-exempt hospitals. See GAO, Tax Administration: Opportunities Exist to Improve Oversight of Hospitals’ Tax Exempt Status, GAO‑20‑679 (Washington, D.C.: Sept. 17, 2020) and GAO, Tax Administration: IRS Oversight of Hospitals’ Tax-Exempt Status, GAO‑23‑106777 (Washington, D.C.: Apr. 26, 2023).
[20]A health system is an organization that includes at least one hospital and at least one group of physicians that provides comprehensive care and who are connected with each other and with the hospital through common ownership or joint management. Independent hospitals are unaffiliated with multi-hospital systems.
[21]Zachary Levinson et al., “Key Facts About Hospitals,” (KFF, 2025)
[22]We also used additional HHS data when comparing our selected hospitals to other national urban hospitals.
[23]Representatives of selected hospitals generally did not cite the COVID-19 pandemic as a primary factor contributing to the closure of their hospitals, though all acknowledged that their hospitals experienced financial or operational pressure due to the pandemic. According to representatives, the pandemic mostly amplified existing challenges, such as declining volumes or staffing challenges, with only representatives from hospital B indicating that COVID-19 pandemic contributed to their closure. Some of these challenges were partially mitigated by federal funding related to the COVID-19 pandemic, according to representatives from the four hospitals that received such funding (hospitals A, B, D, and E).
[24]Three of the selected hospital’s profit margins temporarily increased when they received COVID-19 Provider Relief Funds during the public health emergency.
[25]We did not report profit margins for two selected hospitals (hospitals A and C) in fiscal year 2022 because the cost reporting period was less than 10 months.
[26]Hospitals may be described as safety-net hospitals when they have (1) a high proportion of patients covered by Medicaid or who are uninsured and (2) a mission to provide services regardless of patient’s ability to pay. See Institute of Medicine, America’s Health Care Safety Net: Intact but Endangered (Washington, D.C.: National Academies Press, 2000).
[27]Medicare Payment Advisory Commission, Report to the Congress: Medicare Payment Policy (Washington, D.C.: March 2024).
[28]A 2019 survey found that physicians in certain service lines, such as cardiology and neurosurgery, will generate more revenue for hospitals. See Merritt Hawkins, 2019 Physician Inpatient/Outpatient Revenue Survey (Dallas, TX: 2019).
[29]In contrast to these three selected hospitals, the American Medical Association has reported that hospitals are increasingly likely to employ or contract with physicians directly, or hospitals may fully own physician practices. See Carol K. Kane, Policy Research Perspectives: Recent Changes in Physician Practice Arrangements: Shifts Away from Private Practice and Towards Larger Practice Size Continue Through 2022 (American Medical Association, 2023).
[30]Merritt Hawkins, 2019 Physician Inpatient/Outpatient Revenue Survey.
[31]Hospitals A and B continued providing certain outpatient services at the same location after they closed. However, within 3 years of closing, both hospitals experienced service disruptions due to aged physical infrastructure.
[32]One of these hospitals was part of a health system that provided financial and operational support but was the sole hospital in its health system.
[33]This arrangement is known as a sale-leaseback and typically involves a hospital’s owner selling the hospital’s real estate to a third party and distributing revenue from the sale to the private equity owners. The third-party owner of the real estate then leases the real estate back to the hospital. See Joseph Dov Bruch et al., “Trends in Real Estate Investment Trust Ownership of US Health Care Properties,” JAMA Health Forum, vol. 3, no. 5 (2022).
[34]This selected hospital’s operator had planned to acquire the hospital from the business owner and assumed the role of daily operations while the transaction was pending, according to representatives.
[35]A court-appointed third-party receiver ultimately made the decision to close the hospital.
[36]Dov Bruch et al., “Trends in Real Estate Investment Trust Ownership of US Health Care Properties,” 2.
[37]This local health system acquired hospital A from a large health system (operating in several states) that had chosen to leave the state where hospital A was located, according to hospital representatives.
[38]One recent study on inpatient volume trends—specifically, the number of quarterly hospital discharges—found that, after declining sharply in 2020 when the COVID-19 pandemic began, the number of discharges has since increased but is still short of pre-pandemic levels. See Matthew McGough et al., “What are Trends in Health Utilization and Spending in Early 2024?” Peterson-KFF Health System Tracker (August 2024).
[39]The health system had developed these plans for expansion while it was acquiring hospital A.
[40]Closure of hospital A was announced publicly at least 90 days before the hospital closed. Hospital A closed within 30 days of the state's final approval for its acquisition and closure.
[41]Hospital B announced that it would close its inpatient services approximately 60 days before this closure took effect. After operating the outpatient clinic for about 2 years, hospital B ceased its urgent care services.
[42]Hospital B received funding from its county government to continue operating its psychiatric emergency department after the hospital closed.
[43]This local provider also plans to offer other behavioral health services at this location, as described above, with funding support from the county government.
[44]A recent summary of research on the estimated need for psychiatric beds found that a shortage of inpatient psychiatric beds exists nationally. See Shanti Silver, Office of Research and Public Affairs, Estimating Psychiatric Bed Need in the United States (Treatment Advocacy Center, 2024).
[45]Hospital B had approximately 16 inpatient psychiatric beds in the year before it closed, according to hospital representatives.
[46]After hospital C’s closure, its multi-hospital system consolidated the hospital’s services at two of the system’s other hospitals that were located in a neighboring county, according to hospital representatives. The hospital system sold both of these hospitals within two years of closing hospital C, including one that had earlier been shut down due to damage from a natural disaster.
[47]A public health system in the area plans to open a new hospital in the community in 2027, according to health system representatives.
[48]The closure of hospital E was carried out by the court-appointed receiver, who held legal authority to manage and operate the hospital. The receiver engaged local stakeholders, including health care providers and public officials in an effort to secure funding and avoid the closure. When the receiver determined that no parties—including the owners of hospital E’s business and real estate—were willing to continue financially supporting its operations, the receiver closed hospital E within a few days, according to court documents and interviews with hospital representatives and other stakeholders.
[49]Our analysis of CMS data also shows that the number of patients receiving inpatient care at hospital E declined by approximately 50 percent from 2018 through 2022.
[50]All five selected hospitals were located in urban areas where the nearest hospital was from 2 to 7 miles away (see app. II). Studies have shown that, despite the geographic proximity of health care facilities in urban areas, residents of low-income neighborhoods may find it challenging to access care due to transportation issues such as inadequate or unreliable access to a vehicle or public transportation. For example, see Mary K. Wolfe et al., “Transportation Barriers to Health Care in the United States: Findings from the National Health Interview Survey, 1997-2017,” American Journal of Public Health, vol. 110, no. 6 (2020): 815-822, and Samina T. Syed et al., “Traveling Towards Disease: Transportation Barriers to Health Care Access,” Journal of Community Health, vol. 38, no. 5 (2013): 976-993.
[51]Individuals without access to primary care providers are less likely to receive preventive care such as blood pressure and cancer screenings. See, for example: Mark W. Friedberg et al., “Primary Care: A Critical Review of the Evidence on Quality and Costs of Health Care,” Health Affairs, vol. 29, no. 5 (2010): 766–772; K. Tom Xu, “Usual Source of Care in Preventive Service Use: A Regular Doctor Versus a Regular Site,” Health Services Research, vol. 37, no. 6 (2002): 1509–1529; and Lynn A. Blewett et al., “When a Usual Source of Care and Usual Provider Matter: Adult Prevention and Screening Services,” Journal of General Internal Medicine, vol. 23, no. 9 (2008): 1354–1360.
[52]One of these three hospitals was located in a state that had not expanded Medicaid eligibility to adults with incomes up to 138 percent of the federal poverty level.
[53]Jennifer Tolbert et al., “Key Facts about the Uninsured Population,” KFF Issue Brief (KFF, 2024).
[54]See app. II for more detail. The U.S. Census Bureau estimated the percentage of people without health insurance was about 8 percent nationally in 2023. See U.S. Census Bureau, Health Insurance Coverage in the United States: 2023 (Washington, D.C.: 2024).
[55]For the purpose of our analysis, we excluded hospitals identified as: (i) specialty and emergency hospitals, (ii) developmental centers and pre-long term acute care hospitals, (iii) federal hospitals, (iv) facilities that were allowed to temporarily enroll as a Medicare certified hospital during the COVID-19 public health emergency, and (v) hospitals located in U.S. territories using the CMS Provider of Service files. To confirm the accuracy of the hospitals identified from the CMS Provider of Service file, we compared it against the list of general acute care hospitals in the Compendium of U.S. Health Systems from the Agency for Healthcare Research and Quality and North Carolina Rural Health Research Program.
[56]The Federal Office of Rural Health Policy defines rural areas. Based on this definition, we considered non-rural areas as urban, specifically if they are in: (i) a metropolitan county; with a Rural-Urban Commuting Area code of 3 or lower; or (ii) not part of one of 132 large and sparsely populated census tracts with a Rural-Urban Commuting Area code of 2 or 3; or (iii) not part of an outlying metropolitan county with no population from an urban area of 50,000 or more people; or (iv) not part of a census tract that is at least 20 square miles in area with a Road Ruggedness Scale of 5 and a Rural-Urban Commuting Area code of 2 or 3. The Rural-Urban Commuting Area codes and Road Ruggedness Scale are used by the U.S. Department of Agriculture to classify census tracts as urban or rural based on measures of population density and geographic isolation in greater depth. See https://www.hrsa.gov/rural-health/about-us/what-is-rural for more information.
[57]Hospitals may have offered other health services—such as emergency or other outpatient services—after closing their inpatient services. Inpatient services involve admission to a hospital for one or more overnight stays. Outpatient services include a wide range of services such as emergency department services, observation services, lab tests, and preventive services that do not require admission to a hospital.
[58]We used hospitals’ termination dates from the CMS Provider of Service files to identify potential hospital closures in 2022 and 2023. We then verified these closures and determined these hospitals’ closure type (i.e., whether a hospital continued to offer other health care services after its closing or not) through online searches and interviews with hospital representatives.
[59]We identified geographic regions using the U.S. Census Bureau’s definition and state in which the closed hospital was located from CMS Provider of Services file.
[60]Specifically, we used ownership information from CMS Medicare Cost Reports. Among the urban hospitals closed in 2022 or 2023, we did not identify any public hospital closures.
[61]We determined the closure types through online searches—including hospital websites and media coverage, among others—and confirmed them through interviews with hospital representatives. Additionally, we visited both of the selected hospitals that continued to provide outpatient services at the same location after their closures.
[62]The CMS Medicare Cost Report is an annual financial document that hospitals and other Medicare-participating health care providers must submit to the CMS to report their financial and operational data. It provides information on utilization of services, revenue and costs incurred in delivering health care services to Medicare beneficiaries and is used by CMS to determine reimbursement rates and ensure compliance with Medicare requirements.
We excluded hospitals with cost reporting periods of less than 10 months and more than 14 months in a given fiscal year when calculating the total facility margins. The fiscal year for individual hospitals—i.e., the fiscal year begin and end dates—may vary by across hospitals.
[63]For example, see Brystana Kaufman, George Pink, and Mark Holmes, Prediction of Financial Distress among Rural Hospitals (Chapel Hill, NC: North Carolina Rural Health Research Program, 2016).
[64]We identified all urban hospitals operating as of January 1, 2022, using the CMS Provider of Services file and adapting a definition from the Federal Office of Rural Health Policy. When calculating the total profit margins for all national urban hospitals, we excluded hospitals with cost reporting period less than 10 months or more than 14 months in a given year. We also excluded hospitals in Maryland due to its unique hospital payment model.
[65]Average daily census refers to the average number of patients per day receiving inpatient services. The occupancy rate refers to the average number of hospital beds that were in use relative to the available beds.
[66]We focused these calculations on general acute care hospitals and did not examine distance to other types of health care facilities.