WIC INFANT FORMULA
Single-Supplier Competitive Contracts Reduce Program Costs and Modestly Increase Retail Prices
Report to Congressional Requesters
United States Government Accountability Office
View GAO‑25‑106503. For more information, contact Kathryn A. Larin at (202) 512-7215 or larink@gao.gov or Michael Hoffman at (202) 512-2700 or hoffmanme@gao.gov.
Highlights of GAO‑25‑106503, a report to congressional requesters
Single-Supplier Competitive Contracts Reduce Program Costs and Modestly Increase Retail Prices
Why GAO Did This Study
WIC provided food assistance to more than 6 million low-income pregnant and postpartum women, infants, and young children each month in fiscal year 2023. WIC is administered by USDA and state agencies. For infant formula, state agencies use a competitive bidding system. The manufacturer offering the lowest net price after a rebate to the state becomes that state’s single-supplier of formula for WIC participants. In 2022, a national infant formula shortage raised questions about how this system for WIC affects the infant formula market.
This report examines (1) trends in the price of infant formula and the rebates states receive from manufacturers, (2) how the WIC single-supplier competitive system affects infant formula prices and the formula market, (3) advantages and disadvantages of the current system for WIC and (4) alternatives to the current system.
GAO reviewed 31 studies determined to be methodologically sound and analyzed 2013–2023 retail sales data on infant formula (the most current at the time of analysis). GAO also reviewed 2013–2024 USDA data on states’ WIC contracts. GAO conducted an econometric analysis to assess the effect of winning a WIC contract on retail formula prices, sales, and market share within a state. GAO interviewed federal agency officials and various stakeholders, including researchers; representatives of associations, retailers, and formula manufacturers; and officials from eight states that serve large numbers of WIC infants or that had provided formula to WIC participants outside the retail market.
What GAO Found
Over half of the country’s infant formula is purchased by state agencies through the Special Supplemental Nutrition Program for Women, Infants, and Children (WIC). Since 1989, federal law has generally required WIC state agencies to use a single-supplier competitive system for infant formula. States solicit bids from formula manufacturers for the lowest net price after accounting for a rebate amount given to the state. The manufacturer with the winning bid is awarded a multi-year contract to provide formula for WIC participants in a state or in a group of states that are part of a contracting alliance. As of August 2024, two manufacturers held almost all of WIC contracts in the United States (see figure).
From 2013 to 2023, U.S. infant formula prices were generally stable or decreased, according to GAO’s analysis of retail sales data adjusted for inflation. For instance, the average price of milk-based powder formula—the most commonly purchased formula type—was relatively stable from 2013 to 2020 then fell by 11 percent from 2020 to 2023. During this same period (2020 to 2023), the size of rebates from formula manufacturers to states in newly awarded contracts fell by 27 percent after years of increases, according to GAO’s analysis of U.S. Department of Agriculture (USDA) data (see figure). A number of trends were present in the infant formula market at this time, including a decline in the number of formula-fed infants and the temporary removal of tariffs on foreign formula. However, GAO’s analysis was not designed to evaluate the role of these factors in determining national price or rebate trends over time.
The WIC single-supplier competitive system modestly increased prices for infant formula products of the winning brand, according to GAO’s regression analysis of 2018-2023 infant formula sales data. Winning a WIC contract caused an average price increase of 1.7 percent for the formula products specified in WIC contracts—about 30 cents for a typical 12-ounce container of powder formula. It also caused a 0.3 percent price increase for other formula products of the same brand. Winning a contract also greatly increased the winning brand’s overall market share in a state (see figure).
The key advantage of the current system is that rebate savings allow states to serve more eligible participants. About one-fifth of WIC participants were served monthly with $1.6 billion in rebate savings in 2023, according to USDA estimates. Disadvantages include limited choice for WIC participants and increased retail prices, which adversely affect non-WIC consumers. The reliance on a single-supplier can also leave states vulnerable to supply chain disruptions, which Congress and USDA took steps to mitigate. For example, USDA implemented provisions of the Access to Baby Formula Act of 2022 that require WIC state agencies to prepare plans in case of any future supply chain disruptions.
Alternative approaches identified in research and stakeholder interviews could address some disadvantages of the current system but would be unlikely to result in the same level of cost savings compared to the current system. For example, states could contract with more than one manufacturer to provide WIC participants additional choices and mitigate potential supply disruptions. However, state agencies could face additional administrative burdens in managing multiple contracts, and manufacturers would likely reduce the size of their rebates to states without the guarantee of an exclusive contract.
This is a work of the U.S. government and is not subject to copyright protection in the United States. The published product may be reproduced and distributed in its entirety without further permission from GAO. However, because this work may contain copyrighted images or other material, permission from the copyright holder may be necessary if you wish to reproduce this material separately.
Abbreviations
BLS Bureau of Labor Statistics
CPI Consumer Price Index
FDA Food and Drug Administration
FNS Food and Nutrition Service
FTC Federal Trade Commission
ERS Economic Research Service
EBT electronic benefits transfer
HHS Department of Health and Human Services
OIG Office of Inspector General
USDA U. S. Department of Agriculture
UPC Universal Product Code
WIC Special Supplemental Nutrition Program for Women, Infants, and Children
January 14, 2025
Congressional Requesters
About 40 percent of infants in the United States received food assistance through the Special Supplemental Nutrition Program for Women, Infants, and Children (WIC) in fiscal year 2023, according to the U.S. Department of Agriculture (USDA). WIC provides supplemental food, including infant formula, at no cost to low-income pregnant, post-partum, or breastfeeding mothers, and to infants and young children. The program is administered by USDA’s Food and Nutrition Service (FNS) and WIC state agencies.[1] WIC served about 6.6 million participants each month in fiscal year 2023. The Consolidated Appropriations Act, 2024 provided just over $7 billion for WIC.[2]
Since 1989, federal law has generally required WIC state agencies to use a single-supplier competitive system with infant formula manufacturers to obtain rebates on formula purchased through the program.[3] Under this system, WIC state agencies typically use a competitive bidding process in which the manufacturer offering the lowest net price is awarded an exclusive multi-year contract to provide infant formula to the state’s WIC participants.[4] The net price is determined by the manufacturer’s wholesale price minus a rebate amount offered by the manufacturer to the state. The rebate savings from infant formula, which totaled about $1.6 billion in fiscal year 2023, offset other WIC food costs and enable the program to serve more eligible participants.
A national shortage of infant formula associated with the closure of a critical manufacturing plant in 2022 and exacerbated by existing COVID-19 supply chain challenges resulted in a federal response. For example, FNS temporarily waived certain restrictions on the type of infant formula WIC participants could purchase with WIC benefits. The U.S. Food and Drug Administration (FDA) also temporarily allowed, on a case-by-case basis, certain foreign manufacturers to sell their formula in the United States without meeting all of FDA’s requirements. The share of formula in the United States that is consumed by WIC infants ages 0 to 12 months is estimated to have been about 56 percent in 2018, according to research by USDA’s Economic Research Service (ERS).[5] Accordingly, in the wake of the nationwide shortage, news reports and policymakers questioned how the WIC contract system affects the infant formula market.
You asked us to review WIC’s competitive single-supplier contract system for infant formula. This report examines (1) infant formula price and rebate trends, (2) how WIC contracts affect infant formula prices and the formula market, (3) advantages and disadvantages of the current single-supplier competitive system for WIC infant formula, and (4) advantages and disadvantages of potential alternatives to the current system.
To identify trends in infant formula prices and rebate amounts, we analyzed retail sales and rebate data and reviewed prior research. Specifically, we analyzed nationally representative data from NielsenIQ, a consumer information company, on the national average retail prices paid for 98 infant formula products over the last 10 years from July 13, 2013, through August 12, 2023.[6] Our analysis focused on infant formula products listed in WIC contract data provided by FNS as well as similar products that were not listed in WIC contracts but were under the same brands.[7] We focused on products by formula manufacturers with WIC contracts and did not include products whose manufacturers do not have WIC contracts. Over this period, the selected products accounted for about 64 percent of total infant formula sales.
We also analyzed data from FNS on rebate amounts and wholesale infant formula prices from WIC contracts that state agencies report to FNS. These data include information for contracts that were in effect at any time during the period from fiscal year 2013 through August 2024, though these contracts may have start or end dates beyond that time frame. We also identified and reviewed findings from 31 studies published from 1989 through 2023 that we identified through a literature search.[8] We selected these studies because they directly related to our research objectives, contained original research, and included clear descriptions of the study’s methodology.[9]
To determine how WIC contracts affect infant formula retail prices and the formula market, we used regression analysis to assess the relationship between winning a WIC contract and retail formula prices, sales, and market share within a state, controlling for other factors. For this analysis, we used state-level, quarterly sales data from NielsenIQ for 78 selected milk-based formula products from the last 5 years (October 2018 to September 2023).[10] This analysis included data collected from participating retailers in 30 states for which NielsenIQ could provide state-level estimates.[11] Accordingly, these data do not reflect infant formula sales or WIC contracts nationwide.
Our econometric analysis is not intended to measure the effect of the WIC program as a whole on infant formula prices and does not measure all possible effects the WIC contracting system might have on the competitive environment in the infant formula market. That is, our approach estimates price differentials between WIC primary contract products and non-WIC products that result from winning the WIC contract in a state or alliance under the existing regulatory environment. We view these price differentials as indicative of one of the effects of single supplier competitive contracts on the infant formula market, but effects may differ under alternative WIC contracting systems.
We assessed the reliability of the NielsenIQ and FNS data by reviewing technical documentation, interviewing NielsenIQ representatives and FNS officials, and testing data fields for missing values, outliers, and obvious errors. We determined that these data were sufficiently reliable for analyzing trends and the effects of WIC contracts on the infant formula market. See appendix I for more information about the data analyses we conducted to address our first two research objectives, including model specification, robustness checks, and limitations.
To identify the advantages and disadvantages of the current system and of potential alternatives to the system, we used several methods. We interviewed federal officials from FNS and ERS as well as WIC officials from eight states.[12] We selected these states because they led the largest state alliances (i.e., multiple states collectively soliciting competitive bids for infant formula), served the most WIC infants, or had historically used other ways to provide formula to WIC participants outside of the retail market.[13] Altogether, the selected states and other states in their state alliances represent 28 states in WIC infant formula contract negotiations and served 51 percent of WIC infants in fiscal year 2021. We conducted 11 interviews with various stakeholders we selected to obtain a broad range of perspectives including researchers and representatives from associations, infant formula manufacturers, and research/advocacy organizations.[14] We also interviewed two retailers that represented over 500 stores located in 11 states. The information collected through our interviews is not generalizable. We also reviewed relevant federal laws and regulations, agency guidance, and policy proposals discussed in our interviews.
Additionally, we drew on relevant findings from our data analysis and reviewed relevant government reports as they pertained to advantages and disadvantages of the current system. We also reviewed policy proposals identified in our interviews and, as part of our literature review, reviewed five prior studies or reports that included information about advantages and disadvantages of alternatives to the single-supplier competitive system. The potential alternatives we identified as well as the advantages and disadvantages of each alternative are based on findings from prior research and testimonial evidence from our interviews.
We conducted this performance audit from January 2023 to January 2025 in accordance with generally accepted government auditing standards. Those standards require that we plan and perform the audit to obtain sufficient, appropriate evidence to provide a reasonable basis for our findings and conclusions based on our audit objectives. We believe that the evidence obtained provides a reasonable basis for our findings and conclusions based on our audit objectives.
Background
WIC Single-Supplier Competitive System
WIC Infant Formula Contracts
Under the single-supplier competitive system, a WIC state agency publicly solicits sealed bids from infant formula manufacturers to supply discounted infant formula to the state’s WIC participants.[15] States require bidders to specify a rebate for milk- and soy-based formula and for each of the physical forms of infant formulas, which include:
· powder, which must be mixed with water before feeding;
· liquid concentrate, which must be mixed with an equal amount of water before feeding; and
· ready-to-feed, which requires no mixing.
The manufacturer offering the lowest net price—determined by the manufacturer’s wholesale price minus its rebate to the state—wins a multi-year contract and becomes the primary supplier of WIC infant formula in the state. The length of the contracts ranged from 2 to 6 years with an average length of 4.7 years, according to our analysis of FNS contract data.[16] The winning manufacturer provides a per unit rebate on specific infant formula products listed in the contract. States receive the rebates based on the amount of infant formula purchased by the state’s WIC participants at retail stores. Each contract is between the WIC state agency or state alliance and the manufacturer and is subject to state-specific procurement laws, policies, and processes. FNS is not a party in the contract, but it provides WIC state agencies with technical assistance to help ensure that states have federally compliant, timely, and competitive bid solicitations.
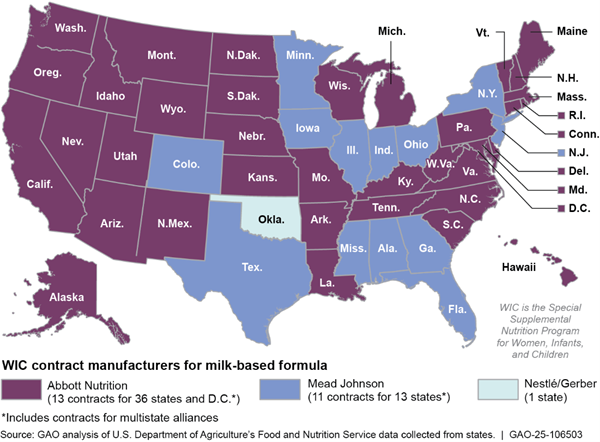
The brand of infant formula provided by WIC varies by state and depends on which manufacturer holds the contract for that state. As of August 2024, three manufacturers—Abbott Nutrition, Mead Johnson, and Nestlé/Gerber—had contracts with WIC state agencies to provide infant formula for the WIC program, though Nestlé/Gerber was transitioning out of WIC contracting after selling its infant formula business to Perrigo in 2022. For contracts in effect as of August 2024, Abbott Nutrition provided milk-based formula to WIC participants in 36 states and the District of Columbia, Mead Johnson in 13 states, and Nestlé/Gerber in one state (see fig. 1). According to our analysis of FNS participant data, about 52 percent of WIC infants who were formula-fed (either partially or fully) lived in states with Abbott contracts, 47 percent of WIC infants who were formula-fed lived in states in states with Mead Johnson contracts, and 1 percent lived in the state with a Nestlé/Gerber contract.
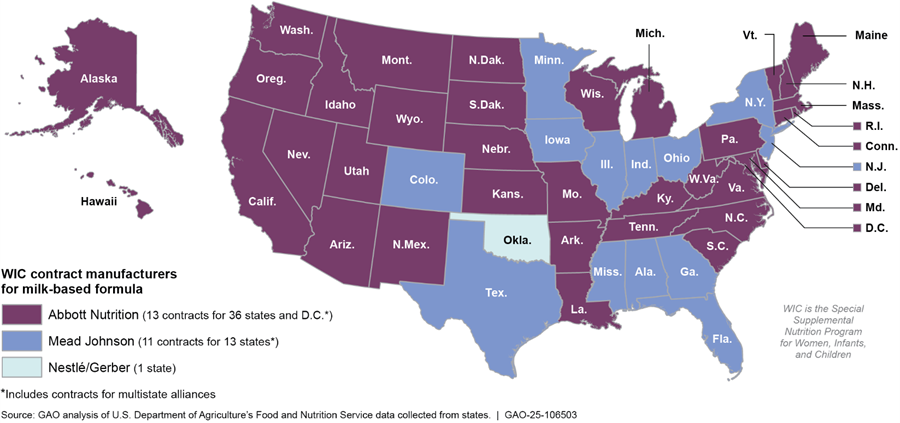
Notes: This figure does not show the contract manufacturer for contracts that may be held by U.S. territories and tribal organizations.
WIC Infant Formula Rebate Reimbursement Process
To receive infant formula rebates, WIC state agencies follow a specific reimbursement process, based on purchases of contract products by WIC participants. First, WIC participants use an electronic benefits transfer (EBT) card to obtain specified infant formula products at no cost to the participant at a WIC-authorized store.[17] Second, the store bills the WIC state agency for the retail price of the formula purchased and the state reimburses the store for this.[18] Third, the state invoices the contracted formula manufacturer to obtain a rebate for each container of its formula WIC participants obtained with WIC benefits. The rebate amount per container is the discount on the manufacturer’s wholesale price that was set during the competitive bidding process and agreed to in the contract.[19] Accordingly, the actual cost of infant formula to the WIC program is the difference between the retail price and the rebate amount. See fig. 2 for an example of this process with the retail price, wholesale price, and rebate percentage provided for illustration.
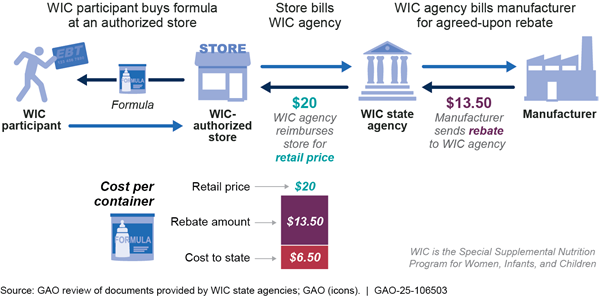
Note: EBT is an abbreviation for electronic benefits transfer. This example depicts the rebate provided for a 12.4-ounce container of milk-based powder formula. The sample retail price, wholesale price, and rebate amount are provided as an illustration.
With some exceptions, state agencies must provide WIC participants with the infant formula products specified in the rebate contract with the manufacturer. Federal regulations allow WIC participants with infants who have special medical or dietary conditions to be issued a different type of formula if they obtain medical documentation. Rebates are not provided for noncontract brands of formula that a medical professional has prescribed to an infant due to a health condition.[20]
2022 National Infant Formula Shortage
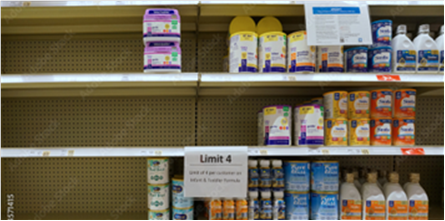
A combination of factors caused a national shortage of infant formula in 2022. In February of that year, Abbott Nutrition voluntarily shut down an infant formula production facility for about 4 months following an infant formula contamination and product recall after the FDA found that the plant was contaminated with harmful bacteria. Around the same time, multiple infants were hospitalized and at least two died from an illness caused by the same type of bacteria found in the plant. The shutdown of the Abbott Nutrition facility exacerbated pre-existing disruptions in the food supply chain due in part to the pandemic, which also contributed to shortages of infant formula.[21] More than one-third of parents with infants were affected by the shortage, including many families who obtained formula using WIC, according to estimates from a U.S. Census Bureau survey.[22] The shortage resulted in a wide-range of federal government responses and subsequent federal investigations (see examples in text box).
|
Federal Actions in Response to the 2022 Infant Formula Shortage Outside of efforts to help families participating in the Special Supplemental Nutrition for Women, Infants, and Children (WIC) obtain formula, various federal entities took action during and following the shortage. For example in 2022, · The Food and Drug Administration (FDA) used its enforcement discretion to allow some manufacturers on a case-by-case basis to import infant formula. · Congress passed laws temporarily suspending tariffs on imports of infant formula and formula ingredients. |
· Congress passed the Food and Drug Omnibus Reform Act of 2022, which among other things, set forth new requirements related to disruptions, recalls and shortages. It also established infant formula as a ‘critical food’ and required FDA to establish an office of critical foods. Subsequent reports and investigations were also released in the years following the shortage. For example, · In March 2023, the FDA released a national strategy to increase the resiliency of the U.S. infant formula market. It described actions the FDA planned to take to protect against future contamination and other potential causes of shortages. · In June 2024, the Department of Health and Human Services’ (HHS) Office of Inspector General (OIG) released a report on its investigation of FDA’s actions leading up to the recall. The OIG found that FDA lacked or had inadequate policies and procedures to identify risks to infant formula and respond effectively through its complaint, inspection, and recall processes. The OIG made nine recommendations to address these findings. |
|
Source: GAO summary of information from FDA National Strategy, HHS OIG report, and relevant federal laws; Spiroview Inc./ stock.adobe.com (photo). | GAO-25-106503 |
|
To help address the effect of the shortage on WIC participants, FNS offered state agencies temporary waivers of program rules to help participants obtain infant formula, among other actions. The waivers allowed WIC participants to obtain alternate sizes, forms, or brands of infant formula during the shortage. For example, one of the waivers allowed WIC participants to purchase noncontract brands of formula without medical documentation.[23] Another waiver allowed state agencies to permit WIC participants to obtain certain imported formulas approved by the FDA.[24]
In May 2022, the Access to Baby Formula Act of 2022 was enacted, which gave USDA permanent authority to respond to infant formula shortages and recalls that affect the WIC program.[25] Specifically, USDA can modify or waive certain WIC statutory or regulatory requirements during disasters, emergencies, or supply chain disruptions that impact the program. The act also requires that all new WIC state infant formula rebate contracts include remedies to enable WIC participants to obtain formula in the event of an infant formula recall.
Infant Formula Prices and Manufacturers’ Rebates to State Agencies Declined in Recent Years
Inflation-Adjusted Prices for Formula Were Generally Stable or Fell during the Last Decade
After adjusting for inflation, average infant formula prices in the United States were generally stable or fell from 2013 through 2023, according to our analysis of annual NielsenIQ retail sales data (see fig. 3).[26] The average price of milk-based powder formula—the most commonly purchased formula—was relatively stable from 2013 to 2020 and then fell by 11 percent, from $6.15 per 26 reconstituted ounces in 2020 to $5.48 in 2023.[27] While the average prices of milk-based liquid concentrate and ready-to-feed infant formula were generally higher than prices of powder formula, they followed a similar trend over time.[28]
Figure 3: Average Retail Price for Milk-Based Infant Formula Products by Type in 2023 Dollars (adjusted for inflation), 2013–2023
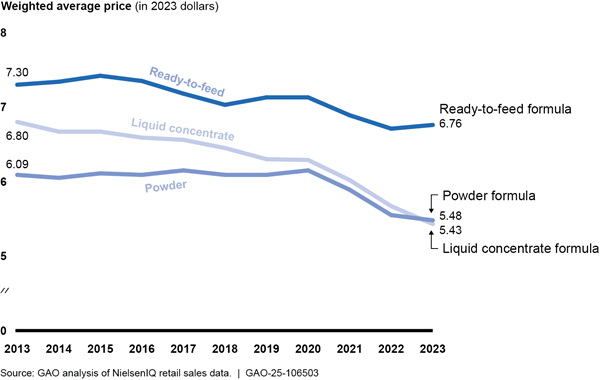
Notes: Reported amounts are adjusted to 2023 dollars using the Consumer Price Index for all items. The price represents the weighted average inflation-adjusted retail price per 26 reconstituted fluid ounces of formula, where retail price is weighted by units sold.
Milk-based powder formula prices generally kept pace with inflation from 2014 through 2020 but grew more slowly than inflation, which increased rapidly in 2021 and 2022 (see fig. 4). For example, our analysis of data from NielsenIQ and the Bureau of Labor Statistics found that the average price for milk-based powder formula increased at a rate of 2 percent in 2022, which was lower than the overall inflation rate (8 percent) and the inflation rate for of dairy products (12 percent).
Figure 4: Average Annual Percentage Price Increase for Milk-Based Powder Infant Formula (not adjusted for inflation), All CPI Dairy Items, and All CPI Goods, 2014–2023
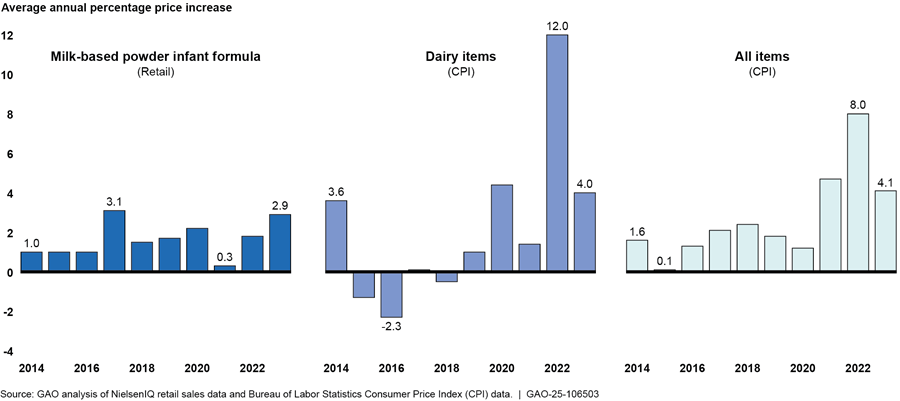
Notes: The Consumer Price Index (CPI) for all items is a common measure of inflation and is used to measure the average change over time in the prices paid by urban consumers for a market basket—or standard group of items—of consumer goods and services. The CPI for dairy items includes the average change in prices paid by urban consumers for dairy products, such as milk, cheese, yogurt, and ice cream.
According to our analysis, factors that may affect retail prices for infant formula include overall demand for formula and the size of the WIC program in a state—in addition to the WIC single-supplier competitive system, which we describe in detail in the next section. Our analysis of state-level data from 2018 to 2023 found that as the number of formula-fed infants fell over time (regardless of whether their formula was purchased through WIC), average inflation-adjusted retail prices of infant formula also fell.[29] Similarly, prior research from USDA’s Economic Research Service (ERS) found that an increase in a state’s percentage of formula-fed infants who were served by WIC was associated with an increase in the retail price of formula across brands (those with the WIC contract and those without).[30] Additionally, steps taken by the federal government to alleviate the 2022 shortage by expanding supply, such as through reducing tariff and regulatory barriers to imports, could have also affected prices, although we were not able to account directly for these factors in our analysis.
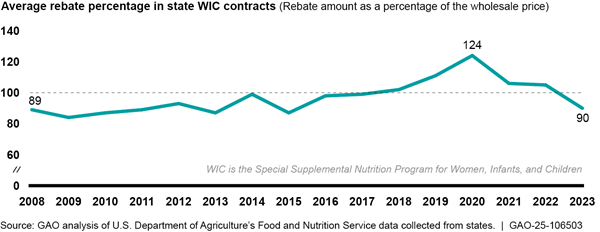
Manufacturers’ Rebates to States for WIC Infant Formula Declined in Recent Years After Several Years of Increases, Affecting Program Costs
The size of manufacturers’ rebates on milk-based formula purchased through WIC generally decreased in recent years following several years of increases, according to our analysis of FNS’s data on state contracts. For contracts initiated from 2008 to 2020, the rebate percentage that state WIC agencies received from manufacturers for milk-based powder formula generally increased. The rebate percentage peaked in 2020 at 124 percent of the manufacturer’s wholesale price and then declined to 90 percent in 2023 (see fig. 5).[31] Average rebate percentages for liquid concentrate formula followed a similar trend. For ready-to-feed formula, which is the most expensive type and the least commonly purchased, the average rebate percentage fluctuated over this period from a high of 83 percent in 2018 to a low of 26 percent in 2022. Although not shown in the figure, as of August 5, 2024, two states initiated new contracts in 2024, which also had lower average rebate percentages than prior years.
Figure 5: Average Manufacturers’ Rebate Percentage in State WIC Contracts by Milk-Based Infant Formula Type and Contract Initiation Year, 2008–2023
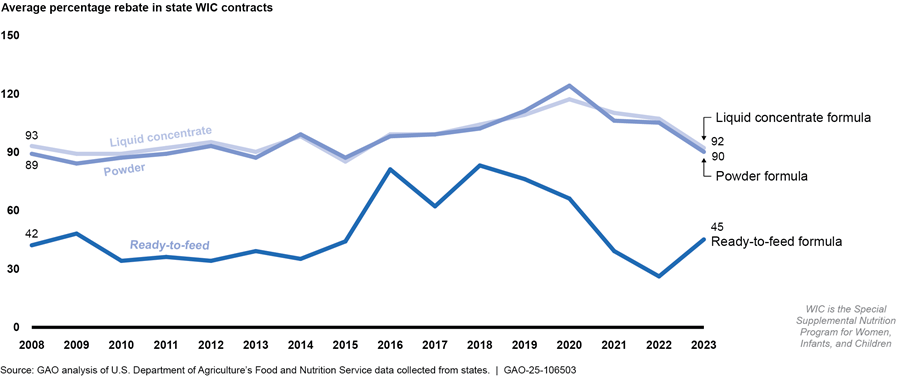
Notes: The rebate percentage represents the rebate as a share of the contract manufacturer’s wholesale price of formula, as set through a competitive bidding process and specified in the infant formula contract between the manufacturer and the WIC state agency or state alliance. This figure shows the average rebate percentage by contract initiation year and by the type of formula for contracts that were in effect from 2013 to 2023, which include some contracts with start dates as early as 2008. Because this figure presents the average rebate percentage at the contract level, the average rebate percentage is calculated using a different composition of state or alliance contracts in different contract initiation years. This figure excludes tribal organizations and U.S. territories that are not part of a state alliance.
We found similar trends when examining how the size of manufacturers’ rebates have changed over time for a single state or state alliance. Compared to their previous contracts, WIC state agencies received higher rebate percentages from manufacturers on milk-based powder formula for contracts initiated between 2015 and 2020, according to our analysis of contract data.[32] However, state agencies generally received a lower rebate percentage for contracts they initiated in more recent years. Specifically, eight of the 11 states or alliances that initiated a new contract in 2022 or 2023 received a lower rebate percentage for milk-based powder formula than in their previous contract (see fig. 6).[33]
Figure 6: Change in the Rebate Percentage between the Current and Previous WIC Contracts for Milk-Based Powder Formula by State or Alliance, 2015–2023
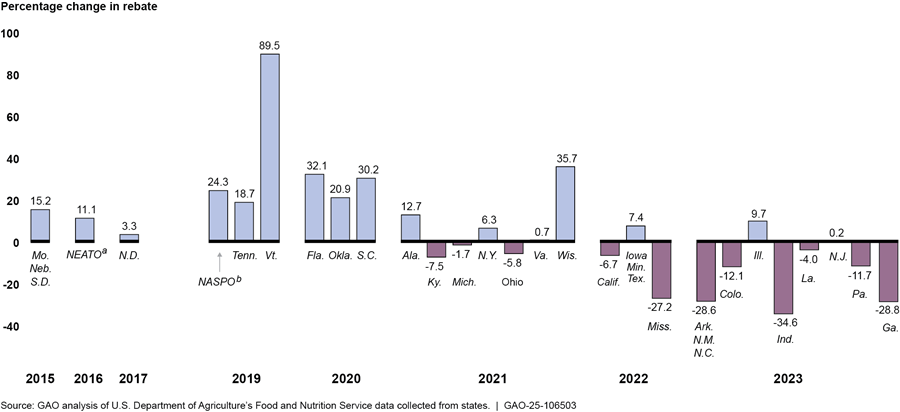
Notes: WIC is the Special Supplemental Nutrition Program for Women, Infants, and Children. The rebate percentage is the discount on the contract manufacturer’s wholesale price of formula, as set through a competitive bidding process and specified in the infant formula contract between the manufacturer and the WIC state agency or state alliance. This figure shows the percentage change between the milk-based powder rebate percentage of the current contract and the previous contract in the year the current contract was initiated for contracts that were in effect from 2013 to 2023. This figure excludes tribal organizations and U.S. territories that are not part of a state alliance.
aNEATO is the New England and Tribal Organization. In 2016, this alliance included Connecticut, Maine, Massachusetts, New Hampshire, Rhode Island, and the Cherokee Nation of Oklahoma. Vermont joined NEATO in 2021.
bNASPO is the National Association of State Procurement Officials. This alliance includes Alaska, American Samoa, Arizona, the Commonwealth of the Northern Mariana Islands, Delaware, Guam, Hawaii, Idaho, Kansas, Maryland, Montana, Nevada, Oregon, Utah, Virgin Islands, Washington, Washington DC, West Virginia, Wyoming, the Inter-Tribal Council of Arizona, Inter-Tribal Council of Nevada, Osage Nation, Pueblo of Isleta, and the Navajo Nation.
A variety of factors may affect the size of rebates manufacturers offer to states, according to our data analysis, prior research, and representatives from one formula manufacturer we interviewed. Our analysis of data from 2013 to 2023 found that the number of formula-fed infants in a state or alliance was positively correlated with WIC infant formula rebate amounts.[34] Specifically, as the number of infants who used formula (WIC or non-WIC) decreased over time, manufacturers offered lower rebates. An ERS study found a similar relationship between a state’s WIC infant population and rebates. This study found that a greater number of infants served by WIC was associated with lower net price bids.[35] Representatives from one formula manufacturer we interviewed said they determine the size of the proposed rebate in their bid based on the size of the contract, including the number of infants served in the state or alliance, as well other factors, such as the company’s budget and business strategy.
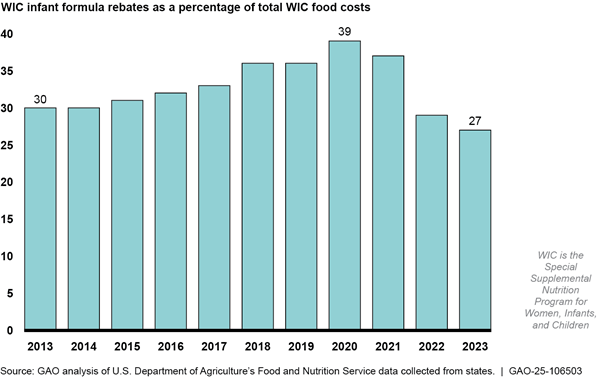
Infant formula rebates have covered a lower share of WIC food costs in recent years from a high of 39 percent in 2020 to a low of 27 percent in 2023 (see fig. 7). According to ERS, states spent more on WIC foods starting in fiscal year 2022 due, in part, to the increased costs associated with disruptions to the infant formula supply chain that year and the increased fruit and vegetable cash value benefit to WIC participants as a result of federal law in 2021.[36]
USDA monitors trends in infant formula rebates and WIC food costs, both of which have implications for overall WIC program costs. Specifically, FNS officials told us they review changes to state infant formula contracts when a new contract is awarded. If FNS anticipates these changes will affect the amount of funding needed to serve the state’s projected caseload, it will adjust future food costs in its budget estimate. In its fiscal year 2025 budget justification, FNS requested additional funding for WIC, in part to offset expected reductions in infant formula rebates.
In addition to considering contract changes as part of budget planning, USDA’s ERS has a related study underway that will look at trends in state agencies’ infant formula rebate contracts. The purpose of the study is to summarize recent trends in state agencies’ infant formula rebate contracts and examine how factors such as declines in the number of infants participating in WIC contribute to these trends. ERS officials said they expect to publish the study on ERS’s website some time in 2025.
WIC’s Single-Supplier Competitive Contracts Caused Modest Infant Formula Price Increases and Large Market Share Increases for the Winning Brand
WIC’s Single-Supplier Contracts Caused Modest Increases in Retail Prices for WIC Contract Products and Other Products under the Same Brand
Our analysis of quarterly state-level retail sales data from 2018 to 2023 found that winning a WIC contract caused modest increases in retail prices for products specified in WIC contracts and other products under the same brand.[37] Formula manufacturers have a variety of products under a single brand. However, certain products are specified in the state’s WIC contract as the primary infant formula that will be provided to WIC participants.[38] Winning a WIC contract caused a 1.7 percent increase in the average retail price of the products included in the WIC contract—about 30 cents for a typical 12-ounce container of milk-based powder formula, based on our main regression model.[39] Winning a WIC contract also caused a 0.3 percent increase in the price of other formula products under the same brand that were not included in the WIC contract.[40]
Our findings are consistent with earlier studies that found that the WIC single-supplier competitive system modestly increased the retail price of infant formula. In one study, researchers reviewed retail prices of infant formula products and FNS contract data from 2007 to 2013. They found that the prices of the formula products of the winning brand increased by more than 5 cents per ounce, which was more than the price increases among other brands’ products.[41] In an older 2004 study, ERS analyzed retail price data from 1994 through 2000 and found that the WIC single-supplier competitive system resulted in modest increases in a non-WIC family’s monthly expenditures on milk-based formula due to increased prices.[42]
Retailers likely raise the price of the WIC primary contract product because of the increased demand for the new product. In particular, retailers are likely to increase prices because WIC participants are insensitive to price changes, given that they obtain formula at no cost using WIC benefits.[43] To ensure that payments to retailers reflect competitive retail prices, state agencies must establish allowable reimbursement levels for retailers.[44] For other formula products under the same brand, retailers likely increase prices due to the increase in demand (discussed below). However, price increases for these products are likely smaller because non-WIC consumers who pay for formula are more sensitive to price changes.[45]
Winning a WIC Single-Supplier Contract Caused a Large Increase in the Contract Brand’s Sales and Market Share within a State
According to our analysis of state level retail sales data from 2018 to 2023, winning a WIC contract caused large increases in monthly dollar sales of the products specified in the WIC contract as well as other formula products under the same brand. On average, we estimated that the monthly dollar sales of products specified in the WIC contracts roughly tripled and products with the same brand roughly doubled after winning a state WIC contract (see fig. 8).[46] Some of this increase in dollar sales was due to the modest increase in retail prices described above, but the majority was due to a large increase in units sold after winning a WIC contract, as shown in the figure.[47]
Figure 8: Estimated Percent Increase in Infant Formula Products’ Monthly Dollar Sales for a Brand Winning a State WIC Infant Formula Contract, 2018 to 2023
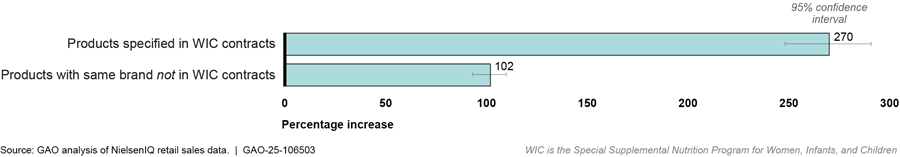
Notes: The data were collected from about 90 participating retail chains and included 78 distinct milk-based formula products sold in 30 states and do not reflect infant formula sales nationwide. We express our confidence in the precision of our sample’s results at the 95 percent confidence level.
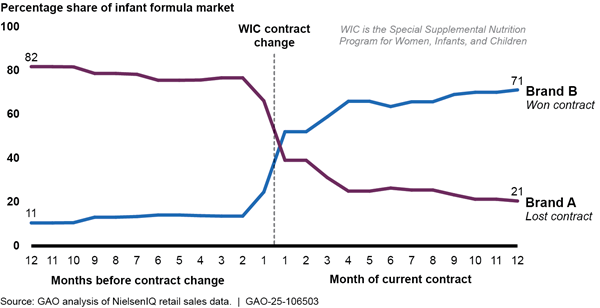
Winning a WIC contract also caused a substantial increase in the overall market share of the winning brand within a state, according to our regression analysis (see fig. 9).[48] Specifically, we estimated that winning a WIC contract caused a brand’s market share—the brand’s percentage of total infant formula sales in a state—to increase 58 percentage points on average.[49]
Figure 9: Estimated Average Infant Formula Brands’ Market Share of Selected Products Before and After a New State WIC Infant Formula Contract is Initiated, 2018 to 2023
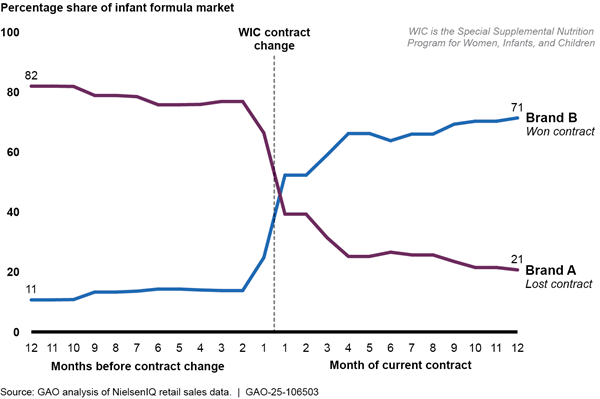
Note: The month a new contract started was designated as month 1 (indicated by the dashed line), and the other months are numbered sequentially from that point. Market share is calculated using only the products included in our sample, and therefore excludes products by brands that do not have WIC contracts. Therefore, the market share calculation reflects a subset of the overall infant formula market.
Our findings are consistent with earlier studies that found that winning a WIC contract resulted in large-volume sales of products under the winning brand. For example, one study examining sales and WIC contract data from 2006 to 2015 found that 1 year after a WIC contract change, sales of infant formula products increased 322 percent for the new contract brand and decreased 77 percent for the former brand.[50] Similarly, a 2011 ERS study examining 2004 to 2009 sales and contract data found that after winning a WIC contract, the winning brand’s market share increased by an average 74 percentage points.[51]
|
WIC Contract Spillover Effects Infant formula manufacturers competitively bid to win contracts to provide infant formula for the Special Supplemental Nutrition Program for Women, Infants, and Children (WIC) for states. In addition to purchases from WIC-consumers, the winning brand typically experiences increased sales by non-WIC consumers, known as spillover effects. Prior research has reported that spillover effects can occur for various reasons: · Retailers may devote more shelf space and better product placement to the brand under the WIC contract because WIC consumers make up a large portion of the infant formula market. This results in increased product visibility by non-WIC consumers. · Physicians or hospitals may recommend the WIC contract brand to all formula-feeding patients to avoid having to differentiate between those enrolled in WIC and those not. · WIC shelf tags may cause non-WIC consumers to perceive a food item as having the government’s endorsement. · WIC participants who are satisfied with the formula under WIC contract may continue with the same product if they leave WIC. They may also recommend the brand to others who are not enrolled in WIC. Source: Published studies by USDA’s Economic Research Service and others. | GAO‑25‑106503 |
Although some of this increase is due to WIC consumer purchases, some is due to a “spillover effect” in which non-WIC consumers also purchase products of the brand under WIC contract. Given that non-WIC infants account for about 44 percent of infant formula sales in the United States, we estimate that up to 44 percent of the increase in dollar sales and quantity sold of the infant formula specified in WIC contracts was due to non-WIC participants shifting their purchases to the product specified in the new WIC contract.[52] Almost all of the increase in sales for other products under the same brand is also likely due to this spillover effect.[53]
Prior research reported similar findings on spillover effects. In its 2011 study, ERS found that while most of the market share increase that occurred after winning a contract was directly due to WIC recipients switching to the products in the WIC contract, the winning brand also realized a spillover effect, in which non-WIC formula sales also increased.[54] ERS and other researchers have noted that these spillover effects help explain why infant formula manufacturers compete for contracts and have historically offered large rebates to win them. For example, a 2023 study found that the winning manufacturer was compensated for the loss experienced from providing a large rebate in WIC markets by a gain in non-WIC markets due to spillover effects.[55]
WIC’s Single-Supplier Competitive System Provides Substantial Cost Savings for WIC but Also Has Disadvantages
USDA Estimates More Than 1 Million WIC Participants Are Served Each Month Due to Rebate Savings from WIC Infant Formula Contracts
Rebate savings from WIC’s single-supplier competitive system have allowed states to serve more eligible participants, according to USDA estimates and other sources. For fiscal year 2023, rebate savings from the single-supplier contracts for infant formula totaled $1.6 billion and funded benefits for an average 1.3 million participants each month or 19.3 percent of the monthly caseload.[56] WIC state agency officials and other stakeholders we interviewed said that the cost savings from these rebates and the program’s ability to serve additional participants was a key benefit of the current system. Officials said they were unsure if an alternative system could provide similar savings, while serving the same number of participants.
These savings have long been an advantage of the current system, as noted in previous GAO and USDA reports. For example, in 2006, we reported that savings from infant formula rebates were an important source of funding for WIC, allowing the program to serve additional participants each year.[57] Before the single-supplier competitive system, infant formula accounted for nearly 40 percent of total WIC food costs and infant formula retail prices were rising more quickly than prices for other foods, according to a 2001 ERS report.[58] Similarly, a more recent study from FNS found that without infant formula rebates, the average estimated food package cost for WIC infants in fiscal year 2018 would have been about $94 more per month.[59]
States Cited Administrative Burden and Limited Choice as Disadvantages to WIC Agencies and Participants, While Higher Prices Affect Non-WIC Customers
Administrative Burden
WIC officials we interviewed from seven states said they dedicate substantial time and resources to overseeing WIC infant formula contracts. Officials estimated that it can take 1 to 2 years to complete the process given the multiple steps involved. These steps may include gathering state-specific data to include in the bid solicitation, drafting and publishing the bid solicitation, answering questions from manufacturers, reviewing manufacturer bid submissions, and awarding the contract. Officials from three states also told us that their agencies have spent an increasing amount of time responding to legal protests from manufacturers who did not receive the contract, challenging the award of the contract.
The transition from one brand to another when the WIC contract is awarded to a new manufacturer can be particularly burdensome, according to WIC state agency officials and retailers we interviewed. FNS contract data show that between July 2013 and August 2024, contract transitions occurred 20 times for 17 states or state alliances. WIC state agency officials noted that these transitions require updates to IT systems and informational materials, such as for WIC participants, healthcare providers, and retailers—all of which can be resource-intensive. Similarly, representatives from two retail companies said that a new WIC contract brand required stores to quickly manage inventory changes, shelf space, and store displays. FNS guidance recommends that state agencies plan well in advance of contract changes and alert WIC retailers of changes to allow ample time to order an adequate supply of the new contract brand of infant formula.[60]
Officials from two states said that state alliances lessened the administrative burden to some degree or that the contracting process was not significantly burdensome.[61] One official whose state was part of an alliance said that alliance membership reduced the administrative burden across member states since one state leads the procurement process on behalf of others. The administrative burden, however, is heavier for the lead state. As of August 2024, 31 states were part of six state alliances.[62] Officials from another state that was not part of a state alliance told us that the WIC contracting process was built into their overall workload and was not significantly burdensome.
Limited Choice for WIC Participants
WIC participants generally receive benefits for specific products of formula within the brand included in the rebate contract.[63] According to officials from three states, some participants can grow frustrated with the limited choice of formula offered. They noted that participants may perceive the WIC-authorized products as inferior when compared to other non-contract formula products that are newer or marketed as higher quality. As a result, these state officials said WIC staff spend considerable time with participants dispelling such perceptions. In addition, state rules that set maximum allowable reimbursement levels and other regulations on WIC-authorized stores decrease the incentive to become a WIC vendor, which could make formula less available for WIC participants. A 2011 ERS study also noted that non-WIC consumers may sometimes have fewer choices of formula under the single-supplier competitive system.[64] Given that WIC-authorized stores may be required by state agencies to maintain a minimum stock of formula products from their WIC contract, some retailers—especially smaller stores with limited shelf space—may decide to stock only WIC products.[65]
Higher Infant Formula Prices
As discussed earlier, the current single-supplier competitive system has caused modest price increases for infant formula products specified in WIC contracts and for other products under the same brand. These price increases affect non-WIC consumers—some of whom may have low-incomes. As we noted, some portion of increased product sales of the brand with the WIC contract can be attributed to non-WIC consumers. Non-WIC consumers may include those who are eligible for WIC but do not participate in the program. Based on the most recent available information, an FNS-funded study estimated that WIC served an estimated 78 percent of infants eligible for the program in 2022 and therefore about 22 percent of infants who were eligible for WIC did not receive WIC benefits.[66] Higher prices would also affect non-WIC households who have incomes that are above the WIC annual income limit, which is at or below 185 percent of the federal poverty level. This equates to a gross income of at or below $57,720 for a family of four.[67]
WIC’s Single-Supplier Competitive System Leaves States Vulnerable to Supply Chain Disruptions, and May Hinder Other Manufacturers from Gaining Market Share
States’ reliance on a single supplier for WIC infant formula leaves them more vulnerable to supply chain disruptions. Specifically, the Federal Trade Commission (FTC) reported in March 2024 that because state WIC programs depend on a single manufacturer for most of their infant formula, single-supplier contracts can make it more likely that a lone contaminant outbreak could lead to serious supply disruptions in the future.[68] The FTC also noted that each state’s reliance on a single manufacturer for WIC infant formula can create challenges in their accessing alternate supply of formula from other manufacturers when disruptions occur. For instance, manufacturers, distributors, and retailers may need to modify existing supply chains, such as through new agreements, before an alternate infant formula supply can actually enter the state.[69]
Similarly, in a July 2024, a committee convened by the National Academies of Sciences, Engineering, and Medicine (National Academies) stated that WIC’s single-supplier competitive system strongly influences the concentration of sales at the state level to the brand with the WIC contract.[70] Accordingly, if there is a supply disruption affecting the brand with the WIC contract, the effects in those states are greater because other brands’ products are less widely available immediately.
Stakeholders we interviewed also said that the WIC single-supplier competitive system made it more difficult to access formula during the 2022 shortage. For example, officials from three states told us that it was difficult for stores to get the needed non-contract formulas in a timely manner during the shortage because distribution chains were set up to support single-supplier contracting for WIC. Representatives from two retailers said that small independent retailers that specialize in serving WIC participants had trouble finding non-contract brands of formula to sell during the shortage because they did not have existing relationships with other distributors.[71] Officials from one state and representatives from a retailer association representing small independent stores also told us that formula distributors prioritized larger stores during the shortage. See the textbox to read about the experiences of some WIC-authorized retailers during the infant formula shortage.
Examples of Challenges WIC-Authorized Retailers Faced During the 2022 Infant Formula Shortage
During the 2022 infant formula shortage, authorized retailers for the Special Supplemental Nutrition Program for Women, Infants, and Children (WIC) struggled to meet state program requirements to keep certain minimum amounts of WIC foods in stock and had difficulty accessing non-contract and imported infant formula, according to two retailer representatives we interviewed. In one state, some retailers that primarily sold WIC products were concerned with the financial risk of buying non-contract formula during the shortage for fear they would be left with unusable inventory once the shortage ended and normal program operations returned, according to WIC agency officials from that state.
In response to these challenges, USDA’s Food and Nutrition Service (1) requested state agencies review and temporarily suspend state policies related to minimum stocking requirements for infant formula, if possible, until the supply of formula had normalized (2) issued memorandums that described the timeline for transitioning back to normal operations, and (3) encouraged WIC state agencies to proactively communicate with retailers and other stakeholders about plans for returning to primarily using the formula products in WIC contracts.
Source: GAO analysis of stakeholder interviews and review of documents from USDA’s Food and Nutrition Service. | GAO‑25‑106503
The FTC and National Academies reports also stated that in addition to state-level vulnerabilities, requirements related to WIC’s single-supplier contracts may make it difficult for smaller companies to bid on WIC contracts overall. To bid on WIC contracts, manufacturers must offer rebates on three physical forms of infant formula (powder, liquid concentrate, and ready-to-feed) and be able to supply formula that WIC agencies issue to participants in an entire state or multiple states in an alliance. According to the FTC, smaller infant formula manufacturers generally lack sufficient scale and could not afford to offer the same rebates as the larger incumbent manufacturers. Accordingly, the FTC concluded that smaller companies are essentially closed off from the market of WIC consumers and any spillover sales.[72] In its report, the National Academies also noted that the requirement to provide three forms of formula may prevent some smaller companies from bidding on WIC contracts.
Representatives we interviewed from one foreign infant formula company cited challenges to entering the U.S. market and competing for WIC contracts. For example, they noted that it was not financially viable for their company to offer competitive rebates in addition to paying the tariff on their products. They also told us that in addition to obtaining FDA certification to sell formula in the U.S. market—which they described as a difficult and lengthy process—infant formula companies must meet additional federal requirements to be able to bid on state WIC infant formula contracts. For example, the nutritional requirements for iron content in WIC infant formula are different than those required by the FDA.[73] WIC provides iron-fortified infant formula to help reduce the risk of iron deficiency anemia.[74] In 2022, FNS sought public comments on these requirements as part of its rulemaking on WIC food packages. The agency ultimately decided to maintain the current iron requirements for WIC infant formula, citing insufficient evidence warranting a change.[75]
Congress and FNS Have Taken Steps to Better Prepare the WIC Program to Respond to Formula Supply Disruptions
Congress and FNS have taken steps to mitigate WIC’s vulnerability to future supply chain disruptions. In December 2023, FNS issued a final rule implementing provisions of the Access to Baby Formula Act of 2022.[76] In addition to implementing provisions that grant FNS permanent authority to waive WIC rules during certain disasters, emergencies, and supply chain disruptions, the rule included other provisions. For example, the rule requires WIC state agencies to develop alternate operating procedures—such as developing a communications plan and coordinating with disaster and public health emergency planning agencies—to support the continuation of WIC services during an emergency.
The rule implemented provisions of the Access to Baby Formula Act of 2022 that required WIC state agencies to include specific remedies in their infant formula contracts with manufacturers they could use in the event of a product recall.[77] At minimum, these remedies must include allowing WIC participants to receive infant formula in sizes that may exceed the maximum monthly allowance and allowing WIC participants without medical documentation to receive formula products not specified in the WIC contract.[78] The remedies must also specify that when a contracted manufacturer is the subject of a recall, the manufacturer must provide the state agency with an action plan that includes supply data and must pay rebates to the state on non-contract brand infant formula.[79] State agencies may include additional remedies beyond these regulatory minimum requirements.[80]
State officials we interviewed expressed support for these remedies, but also had concerns. WIC officials from five states said that the new remedy requirements may help mitigate the effects of future supply chain disruptions. Officials from one state and representatives from one stakeholder organization also expressed concern that these remedies may negatively affect manufacturers’ bids—for instance by increasing costs for manufacturers, resulting in fewer or lower bids. Representatives from one infant formula manufacturer told us that when bidding on WIC contracts, the company considers the risk associated with any required remedies and bids accordingly.
In issuing the final rule, FNS also requested public comments on whether it should modify the requirement that bidders produce liquid concentrate formula—a change that could encourage more infant formula manufactures to consider bidding on WIC contracts. In the rule, FNS noted that states already have the flexibility to provide WIC participants with powder formula or liquid concentrate and that consumers predominantly purchase powder formula. However, FNS also noted that requiring liquid concentrate in WIC could impact some manufacturers’ ability to competitively bid and meet contractual requirements.
FNS officials told us that they will review the public comments and decide whether it should take additional actions related to bidding requirements. Officials we interviewed from two states expressed concern about eliminating the liquid concentrate requirement, noting that in some cases, liquid concentrate may better suited for WIC participants.[81] For example, state officials said liquid concentrate formula may be seen as a safer product compared to powder because it is sterile before opening and may be easier to prepare compared to powder.
Lastly, FNS has taken steps to allow WIC participants to order WIC foods online, which would provide them with additional ways to access infant formula. Data from the Census Bureau’s Household Pulse Survey showed that some WIC participants shopped online to find infant formula during the 2022 shortage even though they were not able to use their WIC benefits for these purchases.[82] In 2023, FNS proposed changes to WIC regulations to address key regulatory barriers to online shopping in the WIC program, such as the current prohibition of internet-based retailers.[83] Through a grant award, FNS is also funding the development of resource materials for state agencies interested in pursuing online transactions and awarded sub-grants to WIC state agencies to test online ordering and transactions. According to FNS, online shopping would provide WIC participants safer and more reliable options to access infant formula during a program disruption, including a supply chain disruption.
Alternatives Identified by Stakeholders and Relevant Studies Could Address Some Cited Disadvantages of the Current System, but Would Likely Increase Program Costs
Through stakeholder interviews and a review of relevant studies, laws, and regulations, we identified five alternatives to the current single-supplier competitive system for WIC infant formula. While these alternatives could address some disadvantages of the current system, including participant choice and administrative burden for states, they are unlikely to result in the same amount of cost savings and could pose other trade-offs, according to prior research and stakeholders we interviewed (see appendix II for a summary of these alternatives). To implement an alternative cost containment system for WIC infant formula, WIC state agencies must provide FNS with cost estimates, showing that the alternative system would result in savings equal to or greater than a single-supplier competitive system.[84] Except for fixed-price contracts, which we describe in more detail below, the alternatives are conceptual and have not been implemented and studied in real-world settings. As a result, there is very little empirical information on implementation or about how formula manufacturers, WIC participants, or the overall market would respond in these scenarios.
Two Alternative Systems Cited in Current Regulations Could Reduce Some Aspects of Administrative Burden with the Current System but Increase Others
Fixed-Price Contracts with Direct Distribution of Formula
States that distribute WIC foods directly to participants are exempt from the requirements to contain infant formula costs by soliciting manufacturer rebates.[85] Vermont and Mississippi previously purchased discounted formula for direct distribution, using a competitive bidding process to award contracts to the manufacturer with the lowest fixed discounted price. The states then directly distributed the formula to WIC participants, through WIC food centers in Mississippi and home delivery in Vermont. Vermont and Mississippi ended direct distribution of WIC foods when they implemented WIC EBT and began using retail stores for WIC food distribution in 2016 and 2021, respectively.
Advantages of this alternative system include increased state control over inventory and reduced administrative burden on the state to reimburse retailers, according to state officials we interviewed. Mississippi and Vermont state officials said that since the state was responsible for inventory control, it could more easily ensure that WIC products were available to participants. For example, WIC participants could obtain a full month’s supply of formula at a WIC food center and not deplete the center’s supply, according to Mississippi state officials. In addition, state officials told us that the state’s ongoing administration of fixed-price contracts was less complicated because it did not have to reimburse retailers for WIC infant formula purchases.
However, disadvantages of this alternative system could include limited participant access, depending on the type of distribution system; potentially higher administrative costs; and increased formula costs, resulting in lower government cost savings per participant served.
· Participant access. In Mississippi, officials said that participants’ access to WIC foods was more limited under the direct distribution system, which relied on 95 food centers across the state, operating from 8:00 a.m. to 5:00 p.m., Monday through Friday. In contrast, using the retail distribution system, officials said WIC participants have access to 290 retail stores in the state that are open longer hours and have a wider variety of WIC allowable items.
· Administrative costs. USDA officials we interviewed suggested that operating a direct distribution system may be more costly than operating a retail distribution system. For example, a separate food distribution system could require additional operations staff at the state and local levels. Similarly, a direct distribution system that delivered products to participants’ homes would add shipping costs and could involve other logistics, such as the state needing to maintain a separate WIC participant mailing list for distribution purposes.
· Cost savings. Fixed-price contracts may result in higher infant formula costs for states and therefore lower government cost savings for the same population served, according to our analysis of NielsenIQ sales data, state contract information from Mississippi, and interviews with Mississippi state officials.[86] For example, the cost of milk-based powder formula totaled $8.6 million per year under Mississippi’s 2017 fixed-price contract, but we estimated that it would have been about $1 million per year under a rebate contract.[87] Mississippi state officials confirmed that the state had seen lower formula costs since it began using a rebate contract. Manufacturers may offer lower discounts under the fixed-price contract because the winning manufacturer would not receive any spillover sales from the non-WIC market.
FNS Assistance with Bid Solicitation
Under current law and regulations, FNS could solicit bids and select the winning bidder for WIC infant formula contracts on behalf of states if two or more state agencies with retail food delivery systems request FNS to do so.[88] However, no states have made this request, according to FNS officials.
FNS assistance with bid solicitation could reduce some of the administrative burden for states, but state officials we spoke with said they had not considered this option, noting that it would create an additional burden in other areas. For example, to request FNS assistance, WIC state agencies would need to provide FNS with detailed information about their state’s procurement procedures, any required contractual provisions, and historical data on WIC participation and formula purchases. In addition, under this option, FNS would not award or enter into any infant formula cost containment contract on behalf of state agencies, so states would still have administrative costs associated with awarding and managing their contracts.
At the federal level, since use of this option would shift some of the administrative burden to FNS, the agency could face difficulties ensuring that bid solicitations adhere to state-level procurement and other policies. Most of the state officials we interviewed said this option could create additional complications given differences in state-level procurement rules.
Three Other Alternative Systems Could Provide WIC Participants Additional Choices and Might Reduce Prices and Increase Market Resilience, but Would Likely Increase Program Costs
Multi-Supplier Rebate Contracts
Stakeholders we interviewed and prior studies we reviewed identified multi-supplier rebate contracts as another alternative system. With these contracts, the state competitively bids and awards a contract to the manufacturer that offers the lowest net price and to any other bidders within a specified percentage or amount of the best bid. Bills have been introduced that would require states to contract with more than one infant formula manufacturer for WIC following the national infant formula shortage. Specifically, a bill was introduced in July 2022 that would require states to award WIC contracts to at least two manufacturers offering the lowest prices.[89] This bill also stipulated that no manufacturer could receive a contract for more than 70 percent of the formula purchased annually through the state’s WIC program. In May 2023, a separate bill was introduced that would require states to select two manufacturers offering the lowest price.[90]
Multi-supplier contracts could address some of the disadvantages of the current system. Use of these contracts would allow WIC participants to choose from at least one additional brand of formula and may help states more effectively manage disruptions if one manufacturer experiences supply chain issues. However, WIC officials from four states and representatives from three other stakeholder groups we interviewed did not support this alternative system due to concerns about increased administrative burden and reduced rebate savings.[91] Officials from two states said that their agencies would face additional administrative burden due to the complexity of managing multiple contracts. In addition, state officials and other stakeholders we interviewed noted that manufacturers would likely offer lower rebates to states without the guarantee of an exclusive contract. Moreover, with only two manufacturers currently bidding for state WIC contracts, requiring states to contract with multiple manufacturers would guarantee, in the near term, that both companies win contracts, regardless of the size of the rebates offered. Accordingly, manufacturers may have even less incentive to offer sizable rebates, which would increase program costs or result in fewer participants served, without additional funding.
Federally Set Rebate
In one 2023 study, researchers described another potential alternative system in which the federal government would set a predetermined rebate for WIC infant formula.[92] Companies that want to sell formula to WIC participants could voluntarily participate in the rebate program. The researchers used simulated models to compare this national predetermined rebate system—similar to a method used in the Medicaid drug rebate program—to the current WIC contract system. In their models, researchers set a national WIC infant formula rebate at 55 percent of the retail price. Their analysis suggested that at least two infant formula manufacturers would be willing to participate at this rebate percentage. In their scenario, any manufacturer that agreed to provide this rebate to states could sell their formula to WIC participants.
Use of a federally set rebate could have some advantages, but would likely increase program costs, according to this study’s researchers. Specifically, they noted that this alternative could allow more manufacturers to compete in the WIC market, including smaller manufacturers that agreed to provide a rebate. Additional formula brands in the WIC market would provide more choices to WIC participants and could potentially lower prices for non-WIC consumers. However, the researchers estimated that federal government costs for a given population served would increase due to lower rebate percentages in their model. With lower rebate savings and increased government costs, the WIC program would likely serve fewer participants under this option without additional funding.
Cash Value Benefit for Infant Formula Purchases
WIC officials we interviewed from two states suggested that it could be beneficial to pilot a cash value benefit for infant formula that would allow participants to purchase additional brands of formula. The benefit could be coupled with a “not-to-exceed amount” set by the state agency to help contain infant formula costs.[93] WIC uses a cash value benefit for fruit and vegetable purchases adjusted annually for inflation.[94]
Providing WIC participants with a cash value benefit for infant formula has some advantages, according to two stakeholders we interviewed. For example, using a cash value benefit could allow the program to provide WIC consumers more choices of formula. Without the single supplier contract, more companies’ products may be available on store shelves, which could help consumers find formula if one company experiences a supply chain disruption. With cash value benefits, WIC participants would be more price sensitive, so retailers would have an incentive to lower prices. Increased competition among manufacturers, resulting from the loss of exclusive single-supplier contracts, could also result in lower formula prices. In addition, states would incur fewer administrative costs related to WIC contracting.
However, eliminating the use of single-supplier contracts for WIC infant formula could also eliminate the cost savings from manufacturers’ rebates, which would have implications. ERS researchers noted that the implications would depend on whether the quantity of formula provided to WIC participants was maintained or whether containing program costs was the primary goal. According to ERS researchers we interviewed, if the quantity of formula for participants was maintained at current levels, then a cash value benefit for formula would substantially increase the cost of the WIC program or result in fewer participants served unless Congress provides additional funding.[95] Alternatively, if a cash value benefit for formula was used as a cost containment measure, the benefit amount would need to be set at an amount low enough to offset the loss of rebates, absent other program changes. As a result, WIC participants would not be able to purchase as much formula with their benefits, which could put infants at increased risk of malnutrition, according to ERS researchers we interviewed.
Agency Comments
We provided a draft of this report to USDA for review and comment. USDA provided technical comments on a draft of this report, which we incorporated as appropriate.
We will send copies of this report to the appropriate congressional committees, the Secretary of Agriculture and other interested parties. In addition, the report is available at no charge on the GAO website at https://www.gao.gov.
If you or your staff have any questions about this report, please contact us at (202) 512-7215 or larink@gao.gov, or (202) 512-2700 or hoffmanme@gao.gov. Contact points for our Offices of Congressional Relations and Public Affairs may be found on the last page of this report. GAO staff who made key contributions to this report are listed in appendix III.

Kathryn A. Larin
Director
Education, Workforce, and Income Security

Michael Hoffman
Director
Center for Economics
Applied Research and Methods
List of Requesters
The Honorable John Boozman
Chairman
Committee on Agriculture, Nutrition, and Forestry
United States Senate
The Honorable Shelley Moore Capito
United States Senate
The Honorable Susan M. Collins
United States Senate
The Honorable John Cornyn
United States Senate
The Honorable Deb Fischer
United States Senate
The Honorable Charles E. Grassley
United States Senate
The Honorable Roger W. Marshall, M.D.
United States Senate
The Honorable James E. Risch
United States Senate
The Honorable Thom Tillis
United States Senate
National Trends in Retail Price
We used retail scanner data from NielsenIQ, a consumer intelligence company, to examine national level trends in average retail infant formula prices. These data contain annual data on the average unit price, total units sold, and total sales for 98 different infant formula products from 2013 to 2023.[96] Each product is depicted by a unique Universal Product Code (UPC) in the NielsenIQ data. Our selected UPCs contain the milk and soy Special Supplemental Nutrition Program for Women, Infants, and Children (WIC) primary contract brand infant formula products as well as similar non-primary WIC brand products.[97] We focused on products by formula brands with WIC contracts and did not include products by brands that do not have WIC contracts. Our selected UPCs represent about 64 percent of total infant formula sales.
The infant formula products available over time can change as manufacturers introduce new products and discontinue others. To assess trends in average prices over the 10-year period, we used a subset of products that were in the data in every year so that we could examine changes in a constant set of products.[98] We focused on milk-based products in this report because milk-based is more commonly purchased than soy-based products.[99] We also examined trends in national average prices of WIC primary contract soy-based products and found that soy concentrate and powder products followed a similar trend as milk-based products while the average price of WIC primary contract soy ready-to-feed products was generally increasing over time.[100]
Average retail price is estimated as the total dollars sales of an item divided by the total units sold of that item.[101] Because infant formula products are sold in different sized packages and different forms, we used item price to create a standardized measure of price represented as the price per 26 reconstituted ounces of formula. Reconstituted fluid ounces refer to the amount of formula that a product will produce when prepared at standard dilution. For example, a typical WIC eligible container of milk-based powder formula contains about 12.4–12.9 ounces of powder formula and makes about 90–92 fluid ounces of formula when mixed with water while a typical container of concentrate formula contains 13 ounces of concentrated formula and makes 26 fluid ounces of formula when mixed with water. We examined prices per 26 reconstituted fluid ounces, which is the method used in prior U.S. Department of Agriculture’s Economic Research Service (ERS) studies.[102] Average retail prices per 26 reconstituted ounces were weighted by the sales quantity of the observation to account for varying sales volume of different products.[103] We inflation-adjusted prices to 2023 dollars using the Consumer Price Index (CPI) all items index from the Bureau of Labor Statistics (BLS).
Trends in Infant Formula Rebates
To examine trends in WIC infant formula rebates over time, we examined infant formula rebate contract data provided by U.S. Department of Agriculture’s Food and Nutrition Service (FNS). These data contain information on each state agency’s WIC contract formulas for each form of formula, the contract length, wholesale price, and rebate amount for contracts in place from 2013 through August 2024, meaning they may have start or end dates beyond that time frame. To examine trends in WIC participation, food costs, and total rebates, we examined FNS state-level WIC participation and program cost data for calendar years 2013 to 2023.
Econometric Analysis of WIC Contract Status on Retail Price, Sales, and Market Share
We used quarterly state-level NielsenIQ retail scanner data from quarter four of 2018 to quarter three of 2023 to examine the impact of WIC contracts on infant formula retail prices, sales quantities, sales dollars, and market share.[104] These data contain information from participating retailers on average unit price, total units sold, and total dollar sales at a quarterly level for 95 products in 30 states for which NielsenIQ could provide state-level data.[105] As in the national trends analysis above, we excluded all soy-based infant formula products. Thus, our analytical sample contains information on 78 milk-based products in 30 states.[106] Our data have some shortcomings that limit our ability to describe the entire U.S. infant formula market, which we discuss in more detail after describing our specification below.
The specification for identifying the effects of WIC contracts on these outcomes is a panel fixed effects regression. Our specifications include state-by-quarter, product-by-quarter, and product-by-state fixed effects. Because there is unlikely to be an omitted variable with variation that is not captured by the included fixed effects, we believe it is reasonable to conclude that our model identifies the causal effect of WIC contract status. Specifically, the identifying assumption is that, conditional on 1) the average outcome (e.g., price level) of a given product in a given quarter across the states in our sample, 2) the average outcome of all infant formula in our sample in a given state and quarter, and 3) the average outcome of a given product in a given state across the quarters in our sample, any difference in the outcome between WIC-contract products (brands) and non-WIC-contract products (brands) is solely attributable to the effect of the product (brand) being currently under WIC contract. We estimated the following regression model for each of our outcomes:

The observations are at the product-by-state-by-month
level, where i indexes an individual product UPC, b indexes product brand, s
indexes state, t indexes month, and q indexes quarter.[107] We cluster the standard errors at
the WIC contract level to account for potential correlated errors among
products under the same contract within a state. The dependent variable ![]() represents the following outcome
variables:
represents the following outcome
variables:
· Average retail price. Calculated as total dollar sales divided by total unit sales.[108] We used the natural logarithm of price to measure percent changes in price instead of dollar changes in price. We analyzed prices per 26 reconstituted fluid ounces and inflation-adjusted prices to 2023 dollars using the CPI all item index from BLS. Our regressions for prices are weighted by the sales quantity of the observation.[109] As a sensitivity check, we also ran regressions for prices without weighting and found that the estimated effects of WIC contracts were larger when not weighting by unit sales (see section “Robustness Check Specification: Unweighted Regressions” below for more information).
· Units sold. The total quantity of each item sold. We used the natural logarithm of units sold.
· Dollar sales. The total dollar amount of sales for each item. We used the natural logarithm of dollar sales. We inflation-adjusted sales to 2023 dollars using the CPI all item index from BLS.
· Product market share. Calculated as the product’s dollar sales (price times quantity) in a given state and month divided by the total dollar sales of all products in a given state and month.
· Brand market share. Calculated as the brand’s total dollar sales (price times quantity) in a given state and month divided by the total dollar sales of all products in a given state and month.[110]
The variable  is an indicator variable
depicting whether the product i is under WIC contract in state s and month t
and the variable
is an indicator variable
depicting whether the product i is under WIC contract in state s and month t
and the variable  is an indicator variable
depicting whether the product’s brand b is under WIC contract in state s and
month t. We include the brand indicator to account for potential spillovers to
non-WIC products under the same brand. While a brand of infant formula may sell
a variety of infant formula products, only specific products are WIC eligible.
If brand A is the WIC contract winner, then
is an indicator variable
depicting whether the product’s brand b is under WIC contract in state s and
month t. We include the brand indicator to account for potential spillovers to
non-WIC products under the same brand. While a brand of infant formula may sell
a variety of infant formula products, only specific products are WIC eligible.
If brand A is the WIC contract winner, then  for all of brand A’s products.
However,
for all of brand A’s products.
However,  only for the WIC-eligible
products.
only for the WIC-eligible
products.
The parameters ![]() and
and ![]() on these variables are the
primary coefficients of interest.
on these variables are the
primary coefficients of interest. ![]() identifies the effect of a
product’s brand being under WIC contract.
identifies the effect of a
product’s brand being under WIC contract. ![]() identifies the additional effect
of a product being under WIC contract, above and beyond the effect of that
product’s brand being under WIC contract.
identifies the additional effect
of a product being under WIC contract, above and beyond the effect of that
product’s brand being under WIC contract. ![]() identifies the total effect of a
product being under WIC contract.
identifies the total effect of a
product being under WIC contract.
Our model includes a variety of fixed effects to account for the fact that products, states, and quarters have varying outcomes on average. These fixed effects include:
· Product-by-quarter
fixed effects. The model includes product-by-quarter fixed effects (![]() to account for the fact that
different products are sold at different price levels, and furthermore these
price levels may change over time. These fixed effects are identified off the
price level of a given product across all states in a given quarter. The product-by-quarter
fixed effects take advantage of the fact that the same product can be sold in
one state under a WIC contract and sold simultaneously in another state not
under a WIC contract. Thus, this methodology requires that not all states have
the exact same products under contract in the same quarter so that, conditional
on product and quarter, there is variation in WIC contract status (because
states have different contracts).
to account for the fact that
different products are sold at different price levels, and furthermore these
price levels may change over time. These fixed effects are identified off the
price level of a given product across all states in a given quarter. The product-by-quarter
fixed effects take advantage of the fact that the same product can be sold in
one state under a WIC contract and sold simultaneously in another state not
under a WIC contract. Thus, this methodology requires that not all states have
the exact same products under contract in the same quarter so that, conditional
on product and quarter, there is variation in WIC contract status (because
states have different contracts).
· State-by-quarter
fixed effects. The model includes state-by-quarter fixed effects (![]() ) to account for the fact that
the price level in a given state will differ from the price level in another
state for a given time period. These fixed effects are identified off the
average price level of all products in a given state and quarter (where some
products will be under WIC contract, and some products will not). The
state-by-quarter fixed effects take advantage of the fact that not all products
in a given state can be under WIC contract simultaneously. Thus, this
methodology requires that states sell at least one product that is not under
WIC contract so that conditional on state and quarter there is variation in WIC
contract status (because some products are under contract, and some are not).
) to account for the fact that
the price level in a given state will differ from the price level in another
state for a given time period. These fixed effects are identified off the
average price level of all products in a given state and quarter (where some
products will be under WIC contract, and some products will not). The
state-by-quarter fixed effects take advantage of the fact that not all products
in a given state can be under WIC contract simultaneously. Thus, this
methodology requires that states sell at least one product that is not under
WIC contract so that conditional on state and quarter there is variation in WIC
contract status (because some products are under contract, and some are not).
Product-by-state fixed
effects. The model includes product-by-state fixed effects (![]() ) to account for the fact that a
product may be sold at different prices in different states. These fixed
effects are identified based on the average price level of a given product
across all quarters in a given state. The product-by-state fixed effects take
advantage of the fact that states switch manufacturers when a different company
wins a new WIC contract. Using product-by-state fixed effects requires that,
for each state, there are at least two manufacturers that have won a WIC
contract within our study period so that, conditional on product and state,
there is variation in WIC contract status. Specifications that include
product-by-state fixed effects thus rely on “switchers” within a state, and the
coefficients on and are therefore identified off of
products and brands that have switched WIC contract status within a state.
Among the 30 states included in our data, 21 states had no variation in WIC
contract status during our study period.
) to account for the fact that a
product may be sold at different prices in different states. These fixed
effects are identified based on the average price level of a given product
across all quarters in a given state. The product-by-state fixed effects take
advantage of the fact that states switch manufacturers when a different company
wins a new WIC contract. Using product-by-state fixed effects requires that,
for each state, there are at least two manufacturers that have won a WIC
contract within our study period so that, conditional on product and state,
there is variation in WIC contract status. Specifications that include
product-by-state fixed effects thus rely on “switchers” within a state, and the
coefficients on and are therefore identified off of
products and brands that have switched WIC contract status within a state.
Among the 30 states included in our data, 21 states had no variation in WIC
contract status during our study period.
Including product-by-state fixed effects in addition to product-by-quarter and state-by-quarter fixed effects likely produces the most robust results with regards to omitted variable bias. However, because some states have not switched manufacturers in the time period in our data, the coefficient estimates from regressions that include product-by-state fixed effects may not reflect different effects in states that have not switched manufacturers. We therefore present results both including and excluding product-by-state fixed effects.
Our econometric analysis is not intended to measure the effect of the WIC program as a whole on infant formula prices and does not measure all possible effects the WIC contracting system might have on the competitive environment in the infant formula market. That is, our approach estimates price differentials between WIC primary contract products and non-WIC products that result from winning the WIC contract in a state or alliance under the existing regulatory environment. We view these price differentials as indicative of one of the effects of single supplier competitive contracts on the infant formula market, but effects may differ under alternative WIC contracting systems.
Data and Related Limitations
Our data have some important shortcomings that limit our ability to describe the entire U.S. infant formula market. Notably, our analysis of state-level data includes 78 milk-based products from participating retailers in 30 states and therefore does not cover all states or infant formula products.
Additionally, our state-level data cover 5 years at the quarterly level of frequency and will not perfectly align with monthly WIC contract data. Some WIC contracts split quarters so there will be some unavoidable measurement error in our WIC brand and WIC product indicator variables. In our timeframe, four WIC contracts that changed brands started in the middle of a quarter.[111] Given that treated observations will sometimes be counted as untreated (and vice versa), the estimated difference between treated and control products will be smaller than the true difference. Therefore, the measurement error should bias our coefficient estimates towards zero.
To further assess the sensitivity of our results to this issue, we re-ran our model excluding quarters within states that have two different manufacturers under WIC contract. This guarantees that WIC contract status is correctly attributed to all sales, because there are no quarters where two different manufacturers are under WIC contract. We found that the magnitudes of our estimates were slightly larger when dropping these observations, which is consistent with eliminating a small amount of attenuation bias (see section “Robustness Check Specification: Dropping Split Quarters” for more information).
Lastly, our time period of 2018-2023 covers other major events which may impact the infant formula market. Notably, this time period covers the COVID-19 pandemic as well as the infant formula shortage, which began with the closing of a major manufacturing plant in February 2022. These events should largely be mitigated by the product-by-quarter and state-by-quarter fixed effects. The product-by-quarter fixed effects would account for supply chain shocks that potentially hit different products at different times.[112] The state-by-quarter fixed effects would account for differences between states over time, such as the timing of COVID-19 waves, state policy responses, or demand shocks. In response to the infant formula shortage, USDA granted waivers to help WIC participants obtain formula. The waivers allowed WIC participants to purchase alternate sizes, forms, or brands of infant formula during the shortage. Thus, WIC participants may have been purchasing products other than the WIC primary brand products during a portion of our study period which could result in our estimates underestimating the effect on WIC products and brands.
Results
Table 1 shows the results of our analysis of the association between WIC contract status and a product’s price. With no controls (column 1), there was a positive association between both a product and a product’s brand being under WIC contract and the price of the product.
Controlling for differences in average prices between states (state fixed effects, column 2) or controlling for differences in average prices between quarters (quarter fixed effects, column 3) had little effect on the estimated correlation between WIC contracts and a product’s prices, which indicates that WIC contract status is uncorrelated with states and quarters. This is because every state and every quarter has a WIC contract for at least some products.
Controlling for differences in average prices between products (product fixed effects, column 4) resulted in a statistically significant positive correlation between WIC contract status and a product’s prices. Because the coefficient estimate is more positive than the coefficient in column 1, this likely indicates that cheaper products (when not under WIC contract) are more likely to be under WIC contract than more expensive formula products. This also makes intuitive sense, given that specialized (typically more expensive) formula is unlikely to be the primary WIC product.
In the model that includes state-by-quarter and product-by-quarter fixed effects (column 6), we estimated that a product’s brand being under WIC contract caused a price increase of 0.5 percent and a product being under WIC contract caused a price increase of 1.4 percent. These effects are both statistically significant at the 1 percent level. The estimated effect is equivalent to $0.03 per 26 reconstituted ounces for a product’s brand being under WIC contract and $0.08 per 26 reconstituted ounces for a product being under WIC contract.
In the model that includes state-by-quarter, product-by-quarter, and product-by-state fixed effects (column 7) and is therefore identified off of “switchers,” we estimated that a product’s brand being under WIC contract caused a price increase of 0.3 percent and a product being under WIC contract caused a price increase of 1.7 percent. The product estimate is statistically significant at the 1 percent level while the brand estimate is statistically significant at the 10% level. The estimated effect is equivalent to $0.02 per 26 reconstituted ounces for a product’s brand being under WIC contract and $0.10 per 26 reconstituted ounces for a product being under WIC contract.
Table 1: Regression Results of Infant Formula Retail Price on WIC Contract Status, October 2018 – September 2023
|
|
(1) |
(2) |
(3) |
(4) |
(5) |
(6) |
(7) |
|
Brand Under WIC Contract=1 |
|
|
|
|
|
|
|
|
Coefficient |
0.040** |
0.040** |
0.029 |
0.018*** |
0.003 |
0.005*** |
0.003* |
|
Std. error |
(0.019) |
(0.018) |
(0.020) |
(0.005) |
(0.006) |
(0.002) |
(0.002) |
|
Product Under WIC Contract=1 |
|
|
|
|
|
|
|
|
Coefficient |
-0.008 |
-0.007 |
-0.009 |
0.022*** |
0.013* |
0.009*** |
0.014** |
|
Std. error |
(0.010) |
(0.010) |
(0.010) |
(0.006) |
(0.006) |
(0.003) |
(0.006) |
|
State FE |
- |
Y |
- |
- |
Y |
- |
- |
|
Quarter FE |
- |
- |
Y |
- |
Y |
- |
- |
|
Product FE |
- |
- |
- |
Y |
Y |
- |
- |
|
State-by-Quarter FE |
- |
- |
- |
- |
- |
Y |
Y |
|
Product-by-State FE |
- |
- |
- |
- |
- |
- |
Y |
|
Product-by-Quarter FE |
- |
- |
- |
- |
- |
Y |
Y |
|
Identifying Variation |
All States |
All States |
All States |
All States |
All States |
All States |
Switchers |
|
Sum of Product and Brand Estimates |
0.032 |
0.033 |
0.020 |
0.041 |
0.015 |
0.014 |
0.017 |
|
Sum of Product and Brand Estimates S.E. |
(0.011) |
(0.011) |
(0.012) |
(0.004) |
(0.003) |
(0.003) |
(0.005) |
|
(Unlogged) Y-Mean |
5.91 |
5.91 |
5.91 |
5.91 |
5.91 |
5.91 |
5.91 |
|
(Unlogged) Non-WIC-Primary Y-Mean w/o Contract |
5.75 |
5.75 |
5.75 |
5.75 |
5.75 |
5.75 |
5.75 |
|
(Unlogged) WIC-Primary Y-Mean w/o Contract |
5.87 |
5.87 |
5.87 |
5.87 |
5.87 |
5.87 |
5.87 |
|
Brand Estimate in $ |
0.23 |
0.23 |
0.17 |
0.11 |
0.02 |
0.03 |
0.02 |
|
Sum of Product and Brand Estimates in $ |
0.19 |
0.19 |
0.12 |
0.24 |
0.09 |
0.08 |
0.10 |
|
Observations |
79527 |
79527 |
79527 |
79527 |
79527 |
79527 |
79527 |
|
States |
30 |
30 |
30 |
30 |
30 |
30 |
30 |
|
Quarters |
20 |
20 |
20 |
20 |
20 |
20 |
20 |
|
Products |
78 |
78 |
78 |
78 |
78 |
78 |
78 |
|
R-Squared |
0.014 |
0.055 |
0.110 |
0.757 |
0.900 |
0.974 |
0.988 |
Legend: * = statistically significant at the 90 percent level (p-value <0.1); ** = statistically significant at the 95 percent level (p-value <0.05); *** = statistically significant at the 99 percent level (p-value <0.01); Y = included; - = not included.
Source: GAO analysis of NielsenIQ retail data and FNS infant formula rebate contract data. | GAO‑25‑106503
Table 2 shows the results of our analysis of the association between WIC contract status and a product’s quantity sold. In the model that includes state-by-quarter and product-by-quarter fixed effects (column 6), we estimated that a product’s brand being under WIC contract caused a 125 percent increase in the quantity sold and a product being under WIC contract caused a 335 percent increase in the quantity sold. These effects are both statistically significant at the 1 percent level. The estimated effect is equivalent to 1,905 units per month in each state (for the retailers in our sample) for a product’s brand being under WIC contract and 6,196 units per month in each state (for the retailers in our sample) for a product being under WIC contract.
In the model that includes state-by-quarter, product-by-quarter, and product-by-state fixed effects (column 7) and is therefore identified off of “switchers,” we estimated that a product’s brand being under WIC contract caused a 101 percent increase in the quantity sold and a product being under WIC contract caused a 262 percent increase in the quantity sold. These effects are both statistically significant at the 1 percent level. The estimated effect is equivalent to 1,535 units per month in each state (for the retailers in our sample) for a product’s brand being under WIC contract and 4,840 units per month in each state (for the retailers in our sample) for a product being under WIC contract.
Table 2: Regression Results of Infant Formula Sales Quantity on WIC Contract Status, October 2018 – September 2023
|
|
(1) |
(2) |
(3) |
(4) |
(5) |
(6) |
(7) |
|
Brand Under WIC Contract=1 |
|
|
|
|
|
|
|
|
Coefficient |
1.370*** |
1.344*** |
1.370*** |
1.242*** |
1.190*** |
1.250*** |
1.007*** |
|
Std. error |
(0.119) |
(0.109) |
(0.116) |
(0.096) |
(0.093) |
(0.087) |
(0.040) |
|
Product Under WIC Contract=1 |
|
|
|
|
|
|
|
|
Coefficient |
0.618*** |
0.657*** |
0.624*** |
1.975*** |
2.085*** |
2.103*** |
1.612*** |
|
Std. error |
(0.147) |
(0.149) |
(0.147) |
(0.099) |
(0.082) |
(0.077) |
(0.076) |
|
State FE |
- |
Y |
- |
- |
Y |
- |
- |
|
Quarter FE |
- |
- |
Y |
- |
Y |
- |
- |
|
Product FE |
- |
- |
- |
Y |
Y |
- |
- |
|
State-by-Quarter FE |
- |
- |
- |
- |
- |
Y |
Y |
|
Product-by-State FE |
- |
- |
- |
- |
- |
- |
Y |
|
Product-by-Quarter FE |
- |
- |
- |
- |
- |
Y |
Y |
|
Identifying Variation |
All States |
All States |
All States |
All States |
All States |
All States |
Switchers |
|
Sum of Product and Brand Estimates |
1.988 |
2.002 |
1.994 |
3.218 |
3.275 |
3.353 |
2.619 |
|
Sum of Product and Brand Estimates S.E. |
(0.113) |
(0.117) |
(0.113) |
(0.120) |
(0.126) |
(0.135) |
(0.099) |
|
(Unlogged) Y-Mean |
6800 |
6800 |
6800 |
6800 |
6800 |
6800 |
6800 |
|
(Unlogged) Non-WIC-Primary Y-Mean w/o Contract |
1524 |
1524 |
1524 |
1524 |
1524 |
1524 |
1524 |
|
(Unlogged) WIC-Primary Y-Mean w/o Contract |
1848 |
1848 |
1848 |
1848 |
1848 |
1848 |
1848 |
|
Brand Estimate in Units |
2088 |
2049 |
2089 |
1894 |
1814 |
1905 |
1535 |
|
Sum of Product and Brand Estimates in Units |
3673 |
3699 |
3685 |
5945 |
6051 |
6196 |
4840 |
|
Observations |
79533 |
79533 |
79533 |
79533 |
79533 |
79533 |
79533 |
|
States |
30 |
30 |
30 |
30 |
30 |
30 |
30 |
|
Quarters |
20 |
20 |
20 |
20 |
20 |
20 |
20 |
|
Products |
78 |
78 |
78 |
78 |
78 |
78 |
78 |
|
R-Squared |
0.086 |
0.121 |
0.116 |
0.495 |
0.584 |
0.850 |
0.952 |
Legend: * = statistically significant at the 90 percent level (p-value <0.1); ** = statistically significant at the 95 percent level (p-value <0.05); *** = statistically significant at the 99 percent level (p-value <0.01); Y = included; - = not included.
Source: GAO analysis of NielsenIQ retail data and FNS infant formula rebate contract data. | GAO‑25‑106503
Table 3 shows the results of our analysis of the association between WIC contract status and a product’s dollar sales. In the model that includes state-by-quarter and product-by-quarter fixed effects (column 6), we estimated that a product’s brand being under WIC contract caused a 126 percent increase in dollar sales and a product being under WIC contract caused a 342 percent increase in dollar sales. These effects are both statistically significant at the 1 percent level. The estimated effect is equivalent to $56,094.81 in sales per month in each state (for the retailers in our sample) for a product’s brand being under WIC contract and $99,352.23 in sales per month in each state (for the retailers in our sample) for a product being under WIC contract.
In the model that includes state-by-quarter, product-by-quarter, and product-by-state fixed effects (column 7) and is therefore identified off of “switchers,” we estimated that a product’s brand being under WIC contract caused a 102 percent increase in dollar sales and a product being under WIC contract caused a 270 percent increase in the dollar sales. These effects are both statistically significant at the 1 percent level. The estimated effect is equivalent to $45,113.34 in sales per month in each state (for the retailers in our sample) for a product’s brand being under WIC contract and $78,435.92 in sales per month in each state (for the retailers in our sample) for a product being under WIC contract.
Table 3: Regression Results of Infant Formula Dollar Sales on WIC Contract Status, October 2018 – September 2023
|
|
(1) |
(2) |
(3) |
(4) |
(5) |
(6) |
(7) |
|
Brand Under WIC Contract=1 |
|
|
|
|
|
|
|
|
Coefficient |
1.641*** |
1.623*** |
1.637*** |
1.256*** |
1.204*** |
1.264*** |
1.017*** |
|
Std. error |
(0.123) |
(0.113) |
(0.121) |
(0.097) |
(0.095) |
(0.088) |
(0.042) |
|
Product Under WIC Contract=1 |
|
|
|
|
|
|
|
|
Coefficient |
-0.300** |
-0.267* |
-0.280** |
2.028*** |
2.137*** |
2.153*** |
1.681*** |
|
Std. error |
(0.139) |
(0.139) |
(0.137) |
(0.103) |
(0.086) |
(0.081) |
(0.084) |
|
State FE |
- |
Y |
- |
- |
Y |
- |
- |
|
Quarter FE |
- |
- |
Y |
- |
Y |
- |
- |
|
Product FE |
- |
- |
- |
Y |
Y |
- |
- |
|
State-by-Quarter FE |
- |
- |
- |
- |
- |
Y |
Y |
|
Product-by-State FE |
- |
- |
- |
- |
- |
- |
Y |
|
Product-by-Quarter FE |
- |
- |
- |
- |
- |
Y |
Y |
|
Identifying Variation |
All States |
All States |
All States |
All States |
All States |
All States |
Switchers |
|
Sum of Product and Brand Estimates |
1.341 |
1.355 |
1.357 |
3.284 |
3.341 |
3.417 |
2.698 |
|
Sum of Product and Brand Estimates S.E. |
(0.094) |
(0.094) |
(0.092) |
(0.124) |
(0.131) |
(0.140) |
(0.108) |
|
(Unlogged) Y-Mean |
139328.77 |
139328.77 |
139328.77 |
139328.77 |
139328.77 |
139328.77 |
139328.77 |
|
(Unlogged) Non-WIC-Primary Y-Mean w/o Contract |
44,378.60 |
44,378.60 |
44,378.60 |
44,378.60 |
44,378.60 |
44,378.60 |
44,378.60 |
|
(Unlogged) WIC-Primary Y-Mean w/o Contract |
29,073.97 |
29,073.97 |
29,073.97 |
29,073.97 |
29,073.97 |
29,073.97 |
29,073.97 |
|
Brand Estimate in $ |
72,837.53 |
72,010.11 |
72,667.03 |
55,723.08 |
53,413.40 |
56,094.81 |
45,113.34 |
|
Sum of Product and Brand Estimates in $ |
39,002.61 |
39,404.12 |
39,467.31 |
95,478.39 |
97,137.21 |
99,352.23 |
78,435.92 |
|
Observations |
79527 |
79527 |
79527 |
79527 |
79527 |
79527 |
79527 |
|
States |
30 |
30 |
30 |
30 |
30 |
30 |
30 |
|
Quarters |
20 |
20 |
20 |
20 |
20 |
20 |
20 |
|
Products |
78 |
78 |
78 |
78 |
78 |
78 |
78 |
|
R-Squared |
0.083 |
0.113 |
0.106 |
0.535 |
0.612 |
0.858 |
0.954 |
Legend: * = statistically significant at the 90 percent level (p-value <0.1); ** = statistically significant at the 95 percent level (p-value <0.05); *** = statistically significant at the 99 percent level (p-value <0.01); Y = included; - = not included.
Source: GAO analysis of NielsenIQ retail data and FNS infant formula rebate contract data. | GAO‑25‑106503
Although a portion of the increase in quantity and dollar sales is due to WIC consumer purchases, some of the increase is due to a “spillover effect” in which non-WIC consumers also purchase products of the brand under WIC contract. To estimate the size of the spillover effect, we estimated similar regressions that proportionally allocated WIC-contract-product sales to non-WIC consumers based on the estimated proportion of non-WIC formula-fed infants in the state. We estimated that for the product specified in the WIC contract non-WIC quantity sales increased 184 percent and non-WIC dollar sales increased 192 percent.
Table 4 shows the results of our analysis of the association between WIC contract status and a product’s market share. In the model that includes state-by-quarter and product-by-quarter fixed effects (column 6), we estimated that a product’s brand being under WIC contract caused a 2.6 percentage point increase in the product’s market share and a product being under WIC contract caused a 10 percentage point increase in the product’s market share. These effects are both statistically significant at the 1 percent level. The estimated effect is equivalent to a 358 percent increase in product market share for a product’s brand being under WIC contract and a 2,623 percent increase in product market share for a product being under WIC contract.
In the model that includes state-by-quarter, product-by-quarter, and product-by-state fixed effects (column 7) and is therefore identified off of “switchers,” we estimated that a product’s brand being under WIC contract caused a 2.3 percentage point increase in the product’s market share and a product being under WIC contract caused a 10.1 percentage point increase in the product’s market share. These effects are both statistically significant at the 1 percent level. The estimated effect is equivalent to a 321 percent increase in a product’s market share for a product’s brand being under WIC contract and a 2,635 percent increase in a product’s market share for a product being under WIC contract.
Table 4: Regression Results of a Product’s Market Share on WIC Contract Status, October 2018 – September 2023
|
|
(1) |
(2) |
(3) |
(4) |
(5) |
(6) |
(7) |
|
Brand Under WIC Contract=1 |
|
|
|
|
|
|
|
|
Coefficient |
0.024*** |
0.026*** |
0.024*** |
0.023*** |
0.025*** |
0.026*** |
0.023*** |
|
Std. error |
(0.001) |
(0.001) |
(0.001) |
(0.001) |
(0.001) |
(0.001) |
(0.001) |
|
Product Under WIC Contract=1 |
|
|
|
|
|
|
|
|
Coefficient |
0.060*** |
0.060*** |
0.061*** |
0.073*** |
0.073*** |
0.075*** |
0.078*** |
|
Std. error |
(0.006) |
(0.006) |
(0.006) |
(0.004) |
(0.004) |
(0.004) |
(0.006) |
|
State FE |
- |
Y |
- |
- |
Y |
- |
- |
|
Quarter FE |
- |
- |
Y |
- |
Y |
- |
- |
|
Product FE |
- |
- |
- |
Y |
Y |
- |
- |
|
State-by-Quarter FE |
- |
- |
- |
- |
- |
Y |
Y |
|
Product-by-State FE |
- |
- |
- |
- |
- |
- |
Y |
|
Product-by-Quarter FE |
- |
- |
- |
- |
- |
Y |
Y |
|
Identifying Variation |
All States |
All States |
All States |
All States |
All States |
All States |
Switchers |
|
Sum of Product and Brand Estimates |
0.084 |
0.086 |
0.085 |
0.097 |
0.098 |
0.100 |
0.101 |
|
Sum of Product and Brand Estimates S.E. |
(0.007) |
(0.007) |
(0.007) |
(0.004) |
(0.005) |
(0.005) |
(0.006) |
|
Y-Mean |
0.021 |
0.021 |
0.021 |
0.021 |
0.021 |
0.021 |
0.021 |
|
Non-WIC-Primary Y-Mean w/o Contract |
0.007 |
0.007 |
0.007 |
0.007 |
0.007 |
0.007 |
0.007 |
|
WIC-Primary Y-Mean w/o Contract |
0.004 |
0.004 |
0.004 |
0.004 |
0.004 |
0.004 |
0.004 |
|
Brand Estimate in % |
337 |
358 |
336 |
324 |
346 |
358 |
321 |
|
Sum of Product and Brand Estimates in % |
2207 |
2242 |
2216 |
2528 |
2554 |
2623 |
2635 |
|
Observations |
83493 |
83493 |
83493 |
83493 |
83493 |
83493 |
83493 |
|
States |
30 |
30 |
30 |
30 |
30 |
30 |
30 |
|
Quarters |
20 |
20 |
20 |
20 |
20 |
20 |
20 |
|
Products |
78 |
78 |
78 |
78 |
78 |
78 |
78 |
|
R-Squared |
0.162 |
0.166 |
0.163 |
0.514 |
0.517 |
0.541 |
0.928 |
Legend: * = statistically significant at the 90 percent level (p-value <0.1); ** = statistically significant at the 95 percent level (p-value <0.05); *** = statistically significant at the 99 percent level (p-value <0.01); Y = included; - = not included.
Source: GAO analysis of NielsenIQ retail data and FNS infant formula rebate contract data. | GAO‑25‑106503
Table 5 shows the results of our analysis of the association between WIC contract status and a brand’s market share. Our measure of market share is based on products and brands included in our data. Our data do not contain generic products, foreign brand products, or products by brands that have not held a WIC contract during our study period. With no controls (column 1), there was a positive correlation between a product’s brand being under WIC contract and the brand’s market share.
Controlling for differences in average brand market share between states (state fixed effects, column 2) or controlling for differences in average brand market share between quarters (quarter fixed effects, column 3) had little effect on the estimated correlation between WIC contracts and a brand’s market share, which indicates that WIC contract status is uncorrelated with states and quarters. This is because every state and every quarter have a WIC contract for at least some products.
Controlling for differences in average brand market share between brands (brand fixed effects, column 4) resulted in a statistically significant positive correlation between WIC contract status and a brand’s market share. The estimated correlation for brands being under WIC contract was lower than when excluding brand fixed effects. This likely indicates that brands with high market share (when not under WIC contract) are more likely to be under WIC contract.
In the model that includes state-by-quarter and brand-by-quarter fixed effects (column 6), we estimated that a brand being under WIC contract caused a 68.5 percentage point increase in the brand’s market share. This effect is statistically significant at the 1 percent level. The estimated effect is equivalent to a 700 percent increase in a brand’s market share for a brand being under WIC contract.
In the model that includes state-by-quarter, brand-by-quarter, and brand-by-state fixed effects (column 7) and is therefore identified off of “switchers,” we estimated that a brand being under WIC contract caused a 57.5 percentage point increase in the brand’s market share. This effect is statistically significant at the 1 percent level. The estimated effect is equivalent to a 587 percent increase in a brand’s market share for a brand being under WIC contract.
Table 5: Regression Results of a Brand’s Market Share on WIC Contract Status, October 2018 – September 2023
|
|
(1) |
(2) |
(3) |
(4) |
(5) |
(6) |
(7) |
|
Brand Under WIC Contract=1 |
|
|
|
|
|
|
|
|
Coefficient |
0.706*** |
0.706*** |
0.706*** |
0.682*** |
0.682*** |
0.685*** |
0.575*** |
|
Std. error |
(0.016) |
(0.016) |
(0.016) |
(0.014) |
(0.014) |
(0.015) |
(0.012) |
|
State FE |
- |
Y |
- |
- |
Y |
- |
- |
|
Quarter FE |
- |
- |
Y |
- |
Y |
- |
- |
|
Brand FE |
- |
- |
- |
Y |
Y |
- |
- |
|
State-by-Quarter FE |
- |
- |
- |
- |
- |
Y |
Y |
|
Brand-by-State FE |
- |
- |
- |
- |
- |
- |
Y |
|
Brand-by-Quarter FE |
- |
- |
- |
- |
- |
Y |
Y |
|
Identifying Variation |
All States |
All States |
All States |
All States |
All States |
All States |
Switchers |
|
Y-Mean |
0.333 |
0.333 |
0.333 |
0.333 |
0.333 |
0.333 |
0.333 |
|
Y-Mean w/o Contract |
0.098 |
0.098 |
0.098 |
0.098 |
0.098 |
0.098 |
0.098 |
|
Brand Estimate in % |
722 |
722 |
722 |
696 |
696 |
700 |
587 |
|
Observations |
5,400 |
5,400 |
5,400 |
5,400 |
5,400 |
5,400 |
5,400 |
|
States |
30 |
30 |
30 |
30 |
30 |
30 |
30 |
|
Quarters |
20 |
20 |
20 |
20 |
20 |
20 |
20 |
|
Brands |
3 |
3 |
3 |
3 |
3 |
3 |
3 |
|
R-Squared |
0.935 |
0.935 |
0.935 |
0.957 |
0.957 |
0.968 |
0.986 |
Legend: * = statistically significant at the 90 percent level (p-value <0.1); ** = statistically significant at the 95 percent level (p-value <0.05); *** = statistically significant at the 99 percent level (p-value <0.01); Y = included; - = not included.
Source: GAO analysis of NielsenIQ retail data and FNS infant formula rebate contract data. | GAO‑25‑106503
Robustness Check Specification: Difference in Differences Methodology
While some literature has examined the impacts of WIC contract on the infant formula market using a difference-in-differences model[113], we elected to not run a difference-in-differences model for the following reasons:
1. There is not a clear pre-treatment and post-treatment period.
Products can be on the WIC contract, lose the WIC contract, and then win the WIC contract later or conversely be off the WIC contract, win the WIC contract, and then lose the WIC contract later. Thus, WIC contract status acts more like a light switch than a one-time event. For this reason, it is unclear when the “event” of starting the WIC contract should take place. The post-treatment period could start after the first time a manufacturer wins a WIC contract in the state, or it could start after the second time a manufacturer wins a contract. Similarly, the pre-treatment period could start before the first time a manufacturer wins a WIC contract in the state or before the second time a manufacturer wins a contract.
If we use the first WIC contract as the timing of the event, then there will be observations for which “post-WIC contract” is true but the observation is not under WIC contract. And if we use the second WIC contract as the timing of the event, then there will be observations for which “pre-WIC contract” is true but the observation is under WIC contract.
While it would be possible to expand the dataset so that observations appear multiple times and one observation uses the first WIC contract as the event while the second, duplicate observation uses the second WIC contract as the event, this creates measurement error and would likely complicate interpreting the results.
Another potential solution would be to expand the dataset and recode observations from calendar time (e.g. years) to event time (years relative to the start of the event such that pre-event observations have negative event times and post-event observations have positive event times) and only keep the event years that would not cross a second WIC contract change. This approach has been used by some researchers.[114] However, this approach would have a second issue discussed immediately below.
2. Control group observations may be treated.
In order to estimate a difference-in-differences regression, it is necessary to have a control group that is unaffected by the event under study. However, if a new manufacturer wins a WIC contract, another manufacturer is losing the WIC contract, so the losing manufacturer is an inadequate control group.
If there were only two manufacturers, we would effectively double count the effects when the WIC contract changes manufacturers, because we are comparing the gains of the manufacturer winning the contract to the equivalent losses of another manufacturer losing the contract instead of comparing the gains of the manufacturer winning the contract to what would have happened to a manufacturer who had no change in WIC contract status before and after the contract change.
Because there are three main infant formula manufacturers who have bid on WIC contracts during our period of study, we could have conducted a difference-in-differences analysis using only the third, truly-never-treated, manufacturer that neither wins nor loses the WIC contract as the control group. However, this would require omitting the observations of the manufacturer who loses the WIC contract. Furthermore, during our study period one manufacturer began its transition out of the WIC market, complicating the classification of a control group.
Thus, we believe our fixed effects specification is both unbiased and more easily interpretable than a difference-in-differences specification because we use each observation only once, we utilize all instances where a product is under WIC contract, and we only indicate an observation is under WIC contract when it actually is under WIC contract.
Robustness Check Specification: Omitting Split Quarters
While our data on WIC contracts provide the exact day that a contract starts, our data from NielsenIQ are at the quarterly level. For contracts that start on the first day of a quarter and end on the last day of the quarter, there is no issue in mapping the NielsenIQ data to the data indicating which products are currently under WIC contract. However, for contracts that start or end in the middle of a quarter, attributing WIC contract status requires proportional allocation.
In our primary regressions, we accounted for this issue by expanding our quarterly NielsenIQ data into monthly data. We did so by creating three observations for each quarter, where we divided sales quantities and sales dollars by three so that the sum of sales across the three months is equal to the total sales in that quarter. This implicitly assumes that sales, both quantities and dollars, were evenly spread out across the three months in the quarter. Because price is calculated as an average across the quarter (total sales dollars divided by total sales quantity), there is no need to adjust price when going from the quarterly to the monthly level. However, we again implicitly assume that prices were constant across the three months in the quarter.
The assumption that quarterly sales are evenly spread out across three months may be unjustified. At one end of the spectrum, a product’s entire sales in a given state and quarter may take place solely in the first month of the quarter, such that the product has zero sales in the second and third months of the quarter. At the other end of the spectrum, a product’s sales in a given state and quarter may be exactly equally spread out among the three months, such that we perfectly measure sales at the monthly level when converting our dataset from quarterly to monthly. Similarly, a product’s price may be high in one month and low in the other months, or may be constant over three months.
If something like the former scenario is true, then our approach may incorrectly estimate the true effect of WIC contracts. This is because we would be attributing too many sales to some contracts (i.e., observations that have no monthly sales but we attributed a third of quarterly sales) while other contracts would have too few sales (i.e. observations that have all the quarterly sales but we attributed only a third of quarterly sales). This measurement error in our dependent variable would lead to biased estimates that are shrunk in magnitude towards zero (attenuation bias). Measurement error in prices would have the same effect.
Given that we lack monthly data and some contracts start or end in the middle of a quarter, our primary regressions suffer from this attenuation bias due to measurement error. As a robustness check, we reran our regressions omitting quarters within states that have two different manufacturers under WIC contract in the same quarter. This guarantees that WIC contract status is correctly attributed to all sales, because there are no quarters where two different manufacturers are under WIC contract. We expect the coefficients to be larger in magnitude than our primary specifications since they will not suffer from this attenuation bias.
While this approach should eliminate measurement error in the dependent variable, the tradeoff is that dropping contracts that split quarters reduces the size of the dataset. However, the vast majority of our sample has only one WIC contract per quarter, so it is unlikely that dropping these observations would meaningfully change our results. The observations we lost were Georgia in 2018, quarter 4; Kentucky in 2021, quarter 4; Michigan in 2021, quarter 4; and California in 2022, quarter 3.
Overall, we found that our results from this specification were qualitatively similar to our primary specification. Relative to our primary regressions, the effects of WIC contract status on retail price, quantity sold, sales dollars, product market share, and brand market share were similar but slightly larger in magnitude, consistent with eliminating a small amount of attenuation bias.
Robustness Check Specification: Unweighted Regressions
Our data from NielsenIQ reports sales data at the UPC-by-state-by-quarter level. Thus, a product j that sold 500,000 units in state s and quarter t has one observation in the dataset, and a product k that sold 50 units in state s and quarter t also has one observation in the dataset. While calculating sales quantity or sales dollars is straightforward for a given product, as it only requires adding up the number of units or dollars sold, calculating the price requires taking an average across all the prices at which a product was sold at in a given state and quarter. Because each sale in dollars is equal to price times quantity, average price can be calculated by dividing total dollar sales by total sales quantity. However, because the average price is a summary statistic, it gives no information as to how many sales actually contributed to estimating the average price.
Thus, in our main specification analyzing the effects of WIC contracts on infant formula prices, we weight each observation by the denominator of the dependent variable, the sales quantity of the UPC. Because the dependent variable is a ratio (sales dollars / sales quantity), weighting ensures that we do not count the price increase of a product that sold only 50 units as equal to the price increase of a product that sold 500,000 units. Weighting each observation by sales quantity effectively runs the regression at the point-of-sale level, so that each sale of a product counts equally, instead of all products counting equally regardless of sales volume.
We follow prior research using similar retail data by weighting when estimating the effect of WIC contracts on infant formula prices as we deemed it appropriate here.[115] However, as a robustness check we ran the same regressions unweighted. Relative to our primary, weighted, regressions, unweighted regressions will systematically increase the importance of price changes on products with fewer quantity sales and decrease the importance of price changes on products with higher quantity sales (because price changes for each product in a given state and quarter will be treated equally regardless of sales quantity). Thus, if the unweighted results are more positive than our primary results, we can deduce that price increases were larger on relatively unpopular products, and price increases were smaller on relatively popular products. If, on the other hand, the unweighted results are less positive than our primary results, then we can deduce the opposite is true.
Table 6 shows the results of our analysis of the association between WIC contract status and a product’s price for the regressions that do not weight each observation by sales quantity. In the model that includes state-by-quarter and product-by-quarter fixed effects (column 6), we estimated that a product’s brand being under WIC contract caused a price increase of 1.4 percent and a product being under WIC contract caused a price increase of 6.3 percent. These effects are both statistically significant at the 1 percent level. The estimated effect is equivalent to $0.08 per 26 reconstituted ounces for a product’s brand being under WIC contract and $0.37 per 26 reconstituted ounces for a product being under WIC contract. Relative to our primary, weighted, regressions, the brand and product effects were larger in magnitude. The brand estimate is 0.9 percentage points larger, and the product estimate is 4.9 percentage points larger. This indicates that price increases due to being under WIC contract were larger for products that sell less often and smaller for products that sell more often.
In the model that includes state-by-quarter, product-by-quarter, and product-by-state fixed effects (column 7) and is therefore identified off of “switchers,” we estimated that a product’s brand being under WIC contract caused a price increase of 1 percent and a product being under WIC contract caused a price increase of 7.5 percent. The product estimate is statistically significant at the 1 percent level while the brand estimate is statistically significant at the 5 percent level. The estimated effect is equivalent to $0.06 per 26 reconstituted ounces for a product’s brand being under WIC contract and $0.44 per 26 reconstituted ounces for a product being under WIC contract. Relative to our primary, weighted, regressions, the brand and product effects were larger in magnitude. The brand estimate is 0.7 percentage points larger, and the product estimate is 5.8 percentage points larger. This again indicates that price increases due to being under WIC contract were larger for products that sell less often and smaller for products that sell more often.
Table 6: Regression Results of Unweighted Infant Formula Retail Price on WIC Contract Status, October 2018 – September 2023
|
|
(1) |
(2) |
(3) |
(4) |
(5) |
(6) |
(7) |
|
Brand Under WIC Contract=1 |
|
|
|
|
|
|
|
|
Coefficient |
-0.005 |
-0.005 |
-0.004 |
0.013*** |
0.014*** |
0.014*** |
0.010** |
|
Std. error |
(0.026) |
(0.027) |
(0.026) |
(0.004) |
(0.005) |
(0.002) |
(0.004) |
|
Product Under WIC Contract=1 |
|
|
|
|
|
|
|
|
Coefficient |
0.010 |
0.010 |
0.007 |
0.051*** |
0.050*** |
0.049*** |
0.066*** |
|
Std. error |
(0.026) |
(0.026) |
(0.026) |
(0.008) |
(0.008) |
(0.007) |
(0.015) |
|
State FE |
- |
Y |
- |
- |
Y |
- |
- |
|
Quarter FE |
- |
- |
Y |
- |
Y |
- |
- |
|
Product FE |
- |
- |
- |
Y |
Y |
- |
- |
|
State-by-Quarter FE |
- |
- |
- |
- |
- |
Y |
Y |
|
Product-by-State FE |
- |
- |
- |
- |
- |
- |
Y |
|
Product-by-Quarter FE |
- |
- |
- |
- |
- |
Y |
Y |
|
Identifying Variation |
All States |
All States |
All States |
All States |
All States |
All States |
Switchers |
|
Sum of Product and Brand Estimates |
0.005 |
0.005 |
0.003 |
0.063 |
0.064 |
0.063 |
0.075 |
|
Sum of Product and Brand Estimates S.E. |
(0.015) |
(0.015) |
(0.015) |
(0.008) |
(0.008) |
(0.008) |
(0.014) |
|
(Unlogged) Y-Mean |
5.91 |
5.91 |
5.91 |
5.91 |
5.91 |
5.91 |
5.91 |
|
(Unlogged) Non-WIC-Primary Y-Mean w/o Contract |
5.75 |
5.75 |
5.75 |
5.75 |
5.75 |
5.75 |
5.75 |
|
(Unlogged) WIC-Primary Y-Mean w/o Contract |
5.87 |
5.87 |
5.87 |
5.87 |
5.87 |
5.87 |
5.87 |
|
Brand Estimate in $ |
-0.03 |
-0.03 |
-0.02 |
0.07 |
0.08 |
0.08 |
0.06 |
|
Sum of Product and Brand Estimates in $ |
0.03 |
0.03 |
0.02 |
0.37 |
0.37 |
0.37 |
0.44 |
|
Observations |
79527 |
79527 |
79527 |
79527 |
79527 |
79527 |
79527 |
|
States |
30 |
30 |
30 |
30 |
30 |
30 |
30 |
|
Quarters |
20 |
20 |
20 |
20 |
20 |
20 |
20 |
|
Products |
78 |
78 |
78 |
78 |
78 |
78 |
78 |
|
R-Squared |
0.000 |
0.005 |
0.013 |
0.556 |
0.567 |
0.738 |
0.809 |
Legend: * = statistically significant at the 90 percent level (p-value <0.1); ** = statistically significant at the 95 percent level (p-value <0.05); *** = statistically significant at the 99 percent level (p-value <0.01); Y = included; - = not included.
Source: GAO analysis of NielsenIQ retail data and FNS infant formula rebate contract data. | GAO‑25‑106503
Analysis of Factors Associated with Retail Prices
To examine factors associated with infant formula retail prices, we used the same state-level NielsenIQ data described above as well as other state-level data on potentially relevant factors that may impact infant formula prices. We estimated the following regression to examine how state-level factors are associated with milk-based infant formula retail prices:

The dependent variable is the residual from the regression model we ran to estimate the causal impact of WIC contracts on infant formula prices. We present results from the model that includes state-by-quarter and product-by-quarter fixed effects and the model that includes state-by-quarter, product-by-quarter, and product-by-state fixed effects (see previous section). Using the residuals from this model removes the causal effect of WIC contracts from prices, allowing us to examine the correlation between state-level factors and the remaining variation in retail prices. Specifically, the dependent variable is defined as:

o  is an indicator variable equal
to 1 if the brand b of a product i is currently under WIC contract in state s
and month t
is an indicator variable equal
to 1 if the brand b of a product i is currently under WIC contract in state s
and month t
o  is an indicator variable equal
to 1 if the product i is currently under WIC contract in state s and month t
is an indicator variable equal
to 1 if the product i is currently under WIC contract in state s and month t
The observations are at the product-by-state-by-month level, where i indexes an individual product UPC, b indexes product brand, s indexes state, t indexes month, and q indexes quarter.[116] We weight each observation by the sales quantity of the observation.
We include state demographic controls (![]() to identify the residual
correlates of infant formula prices. These controls include the logged number
of formula-fed WIC infants, the logged number of formula-fed non-WIC infants,
the unemployment rate, the poverty rate, logged real median household income,
and logged real retail wages.[117]
to identify the residual
correlates of infant formula prices. These controls include the logged number
of formula-fed WIC infants, the logged number of formula-fed non-WIC infants,
the unemployment rate, the poverty rate, logged real median household income,
and logged real retail wages.[117]
We ran separate regressions including state fixed effects,
![]() , which utilize across-time
variation in the supply and demand factors, and quarter fixed-effects,
, which utilize across-time
variation in the supply and demand factors, and quarter fixed-effects, ![]() , which utilize across-state
variation in the supply and demand factors. We also ran regressions that
exclude product fixed effects,
, which utilize across-state
variation in the supply and demand factors. We also ran regressions that
exclude product fixed effects, ![]() , which allow both the extensive
and intensive margins to contribute to price differences across states and
quarters, and include product fixed effects, which controls for different
product offerings across states and quarters and therefore isolates differences
in prices for the same product.
, which allow both the extensive
and intensive margins to contribute to price differences across states and
quarters, and include product fixed effects, which controls for different
product offerings across states and quarters and therefore isolates differences
in prices for the same product.
Table 7 and table 8 show the associations between supply and demand factors and a product’s price. We found that the correlations between supply and demand factors and infant formula prices differ depending on if we study across-state variation (quarter fixed effects) or across-time variation (state fixed effects). In regressions that include state fixed effects and therefore utilize across-time variation in the supply and demand factors, we found the number of WIC infants who use formula and the number of non-WIC infants who use formula are both positively correlated with infant formula prices. We also found that quarters with higher unemployment tend to have higher infant formula prices. In regressions that include quarter fixed effects and therefore utilize across-state variation in the supply and demand factors, we found that the number of WIC infants who use formula is uncorrelated with infant formula prices and the number of non-WIC infants who use formula is somewhat negatively correlated with infant formula prices. We also found that states with a higher median household income tend to have higher prices, and states with higher retail wages or a higher poverty rate have somewhat higher prices. Across both regressions, including product fixed effects generally changed the estimated coefficients, suggesting that some of the price differences between states and over time are due to differences in the products offered at retail stores.
Table 7: Regression Results of Infant Formula Retail Price on State-Level Factors (First Stage Includes State-by-Quarter and Product-by-Quarter Fixed Effects), October 2018 – September 2023
|
|
(1) |
(2) |
(3) |
(4) |
(5) |
(6) |
(7) |
(8) |
|
ln(# of WIC Formula Infants) |
|
|
|
|
|
|
|
|
|
Coefficient |
0.057*** |
0.044** |
0.282*** |
0.294*** |
0.302*** |
-0.004 |
-0.021 |
-0.022 |
|
Std. error |
(0.017) |
(0.017) |
(0.058) |
(0.064) |
(0.074) |
(0.021) |
(0.014) |
(0.014) |
|
ln(# of non-WIC Formula Infants) |
|
|
|
|
|
|
|
|
|
Coefficient |
-0.026* |
-0.009 |
0.092*** |
0.108*** |
0.103*** |
-0.026** |
-0.010 |
-0.009 |
|
Std. error |
(0.014) |
(0.015) |
(0.025) |
(0.029) |
(0.029) |
(0.012) |
(0.011) |
(0.010) |
|
Unemployment rate - not seasonally adjusted |
|
|
|
|
|
|
|
|
|
Coefficient |
0.004*** |
0.004*** |
0.002** |
0.002*** |
0.002*** |
0.003 |
0.002 |
0.003** |
|
Std. error |
(0.001) |
(0.001) |
(0.001) |
(0.001) |
(0.001) |
(0.002) |
(0.001) |
(0.001) |
|
Estimated percent in poverty |
|
|
|
|
|
|
|
|
|
Coefficient |
-0.006* |
-0.002 |
-0.007 |
-0.006 |
-0.006 |
0.001 |
0.005* |
0.006** |
|
Std. error |
(0.003) |
(0.003) |
(0.005) |
(0.006) |
(0.006) |
(0.004) |
(0.003) |
(0.002) |
|
ln(Real Median household income - 2022 CPI adjusted) |
|
|
|
|
|
|
|
|
|
Coefficient |
0.103* |
0.151*** |
0.107 |
0.120* |
0.113* |
0.078* |
0.127*** |
0.133*** |
|
Std. error |
(0.052) |
(0.048) |
(0.066) |
(0.066) |
(0.065) |
(0.039) |
(0.031) |
(0.029) |
|
ln(Real Retail wages and salaries) |
|
|
|
|
|
|
|
|
|
Coefficient |
-0.031 |
-0.035* |
-0.118 |
-0.104 |
-0.097 |
0.033 |
0.035* |
0.034* |
|
Std. error |
(0.020) |
(0.021) |
(0.087) |
(0.089) |
(0.090) |
(0.026) |
(0.018) |
(0.018) |
|
State FE |
- |
- |
Y |
Y |
- |
- |
- |
- |
|
Quarter FE |
- |
- |
- |
- |
- |
Y |
Y |
- |
|
Product FE |
- |
Y |
- |
Y |
- |
- |
Y |
- |
|
State-by-Quarter FE |
- |
- |
- |
- |
- |
- |
- |
- |
|
Product-by-State FE |
- |
- |
- |
- |
Y |
- |
- |
- |
|
Product-by-Quarter FE |
- |
- |
- |
- |
- |
- |
- |
Y |
|
Observations |
67881 |
67881 |
67881 |
67881 |
67881 |
67881 |
67881 |
67881 |
|
States |
30 |
30 |
30 |
30 |
30 |
30 |
30 |
30 |
|
Quarters |
17 |
17 |
17 |
17 |
17 |
17 |
17 |
17 |
|
Products |
78 |
78 |
78 |
78 |
78 |
78 |
78 |
78 |
|
R-Squared |
0.032 |
0.818 |
0.118 |
0.886 |
0.909 |
0.116 |
0.914 |
0.948 |
Legend: * = statistically significant at the 90 percent level (p-value <0.1); ** = statistically significant at the 95 percent level (p-value <0.05); *** = statistically significant at the 99 percent level (p-value <0.01); Y = included; - = not included.
Source: GAO analysis of NielsenIQ retail data and FNS infant formula rebate contract data. | GAO‑25‑106503
Table 8: Regression Results of Infant Formula Retail Price on State-Level Factors (First Stage Includes State-by-Quarter, Product-by-Quarter, and Product-by-State Fixed Effects), October 2018 – September 2023
|
|
(1) |
(2) |
(3) |
(4) |
(5) |
(6) |
(7) |
(8) |
|
ln(# of WIC Formula Infants) |
|
|
|
|
|
|
|
|
|
Coefficient |
0.057*** |
0.044** |
0.281*** |
0.293*** |
0.302*** |
-0.004 |
-0.021 |
-0.022 |
|
Std. error |
(0.017) |
(0.017) |
(0.058) |
(0.064) |
(0.075) |
(0.021) |
(0.014) |
(0.014) |
|
ln(# of non-WIC Formula Infants) |
|
|
|
|
|
|
|
|
|
Coefficient |
-0.027* |
-0.009 |
0.093*** |
0.108*** |
0.103*** |
-0.026** |
-0.010 |
-0.009 |
|
Std. error |
(0.014) |
(0.015) |
(0.025) |
(0.029) |
(0.029) |
(0.012) |
(0.011) |
(0.010) |
|
Unemployment rate - not seasonally adjusted |
|
|
|
|
|
|
|
|
|
Coefficient |
0.004*** |
0.004*** |
0.002** |
0.002*** |
0.002*** |
0.003 |
0.002 |
0.003** |
|
Std. error |
(0.001) |
(0.001) |
(0.001) |
(0.001) |
(0.001) |
(0.002) |
(0.001) |
(0.001) |
|
Estimated percent in poverty |
|
|
|
|
|
|
|
|
|
Coefficient |
-0.006* |
-0.002 |
-0.007 |
-0.006 |
-0.006 |
0.001 |
0.005* |
0.006** |
|
Std. error |
(0.003) |
(0.003) |
(0.005) |
(0.006) |
(0.006) |
(0.004) |
(0.003) |
(0.002) |
|
ln(Real Median household income - 2022 CPI adjusted) |
|
|
|
|
|
|
|
|
|
Coefficient |
0.102* |
0.151*** |
0.107 |
0.120* |
0.113* |
0.077* |
0.127*** |
0.133*** |
|
Std. error |
(0.052) |
(0.048) |
(0.066) |
(0.066) |
(0.065) |
(0.039) |
(0.031) |
(0.029) |
|
ln(Real Retail wages and salaries) |
|
|
|
|
|
|
|
|
|
Coefficient |
-0.030 |
-0.035* |
-0.116 |
-0.104 |
-0.097 |
0.033 |
0.035* |
0.035* |
|
Std. error |
(0.020) |
(0.021) |
(0.087) |
(0.089) |
(0.090) |
(0.026) |
(0.018) |
(0.018) |
|
State FE |
- |
- |
Y |
Y |
- |
- |
- |
- |
|
Quarter FE |
- |
- |
- |
- |
- |
Y |
Y |
- |
|
Product FE |
- |
Y |
- |
Y |
- |
- |
Y |
- |
|
State-by-Quarter FE |
- |
- |
- |
- |
- |
- |
- |
- |
|
Product-by-State FE |
- |
- |
- |
- |
Y |
- |
- |
- |
|
Product-by-Quarter FE |
- |
- |
- |
- |
- |
- |
- |
Y |
|
Observations |
67881 |
67881 |
67881 |
67881 |
67881 |
67881 |
67881 |
67881 |
|
States |
30 |
30 |
30 |
30 |
30 |
30 |
30 |
30 |
|
Quarters |
17 |
17 |
17 |
17 |
17 |
17 |
17 |
17 |
|
Products |
78 |
78 |
78 |
78 |
78 |
78 |
78 |
78 |
|
R-Squared |
0.032 |
0.818 |
0.118 |
0.886 |
0.909 |
0.116 |
0.914 |
0.948 |
Legend: * = statistically significant at the 90 percent level (p-value <0.1); ** = statistically significant at the 95 percent level (p-value <0.05); *** = statistically significant at the 99 percent level (p-value <0.01); Y = included; - = not included.
Source: GAO analysis of NielsenIQ retail data, FNS infant formula rebate contract data, Centers for Disease Control National Immunization Survey data, and state-level data from the Federal Reserve Bank of St. Louis. | GAO‑25‑106503
Analysis of Factors Associated with Rebates
To examine state-level factors associated with milk-based infant formula rebates, we used FNS data on state infant formula rebate contracts as well as other state-level data on potentially relevant factors that may impact infant formula rebates. These data contain information on each state agency’s WIC primary contract formulas for each form of formula, the contract length, wholesale price, and rebate amount for contracts in place between 2013 and 2023. As with our other analyses, we focused on rebates for milk-based products. We estimated the following regression to examine how state-level factors are associated with milk-based infant formula rebate bids:

The dependent variable is the WIC rebate amount for milk-based formula as a proportion of the product’s wholesale price. Observations are at the WIC-contract-by-formula-type level where c indexes a rebate contract, f indexes formula type (powder, concentrate, or ready to feed) and t indexes contract start year.
We include one-year lagged demographic controls, ![]() , to examine the correlates of
rebate amounts which include the logged number of formula-fed infants, the
unemployment rate, the poverty rate, and logged real median household income.[118] Because manufacturers place bids
for WIC contracts in advance of when a contract is implemented, we examine
whether values of our independent variables from one year prior are correlated
with WIC rebates to approximate the information available to manufacturers at
the time they place a WIC infant formula rebate bid. Our analysis is at the
contract level, so for state alliances we calculated the weighted average
unemployment rate, poverty rate, and real median household income, weighted by
state population size, across states in the alliance.[119]
, to examine the correlates of
rebate amounts which include the logged number of formula-fed infants, the
unemployment rate, the poverty rate, and logged real median household income.[118] Because manufacturers place bids
for WIC contracts in advance of when a contract is implemented, we examine
whether values of our independent variables from one year prior are correlated
with WIC rebates to approximate the information available to manufacturers at
the time they place a WIC infant formula rebate bid. Our analysis is at the
contract level, so for state alliances we calculated the weighted average
unemployment rate, poverty rate, and real median household income, weighted by
state population size, across states in the alliance.[119]
We include formula-type fixed effects, ![]() , to account for average
differences in the rebate amounts between powder, concentrate, and
ready-to-feed formula. We also include contract-start-year fixed effects,
, to account for average
differences in the rebate amounts between powder, concentrate, and
ready-to-feed formula. We also include contract-start-year fixed effects, ![]() , to account for average
differences in rebate amounts between contracts that start in different years.
This accounts for any national trends in rebate amounts that are independent of
changes in state-level demographic factors.
, to account for average
differences in rebate amounts between contracts that start in different years.
This accounts for any national trends in rebate amounts that are independent of
changes in state-level demographic factors.
Table 9 shows how state-level factors are correlated with WIC rebates. Our preferred specification is shown in column 4, which includes both formula-type and contract-start-year fixed effects, but the results are generally similar across all specifications. We found that the number of formula-fed infants was consistently positively correlated with WIC infant formula rebate ratios. However, we found that whether a contract is for an alliance of states or an individual state was uncorrelated with WIC infant formula rebates after accounting for the number of formula-fed infants. This indicates that, with respect to WIC infant formula rebates, a key mechanism for the benefits of forming an alliance of states is through increasing the number of infant formula consumers.[120] We also found that contracts implemented in years following higher national unemployment rates have lower rebate ratios (see columns 1 and 3 in Table 9), although there is no relationship between the unemployment rate and rebates across state contracts in the same year (see columns 2 and 4 in table 9). The poverty rate and real median household income were not consistently correlated with WIC infant formula rebate amounts.
|
|
(1) |
(2) |
(3) |
(4) |
|
In Contract Alliance=1 |
|
|
|
|
|
Coefficient |
-0.026 |
0.007 |
-0.026 |
0.007 |
|
Std. error |
(0.041) |
(0.035) |
(0.041) |
(0.035) |
|
ln(One-Year Prior # of Formula Infants) |
|
|
|
|
|
Coefficient |
0.076*** |
0.067*** |
0.076*** |
0.067*** |
|
Std. error |
(0.028) |
(0.023) |
(0.028) |
(0.023) |
|
One-Year Prior Unemployment rate - not seasonally adjusted |
|
|
|
|
|
Coefficient |
-0.034*** |
-0.008 |
-0.034*** |
-0.008 |
|
Std. error |
(0.008) |
(0.012) |
(0.008) |
(0.012) |
|
One-Year Prior Estimated percent in poverty |
|
|
|
|
|
Coefficient |
0.002 |
-0.006 |
0.002 |
-0.006 |
|
Std. error |
(0.013) |
(0.013) |
(0.013) |
(0.013) |
|
ln(One-Year Prior Real Median household income - 2022 CPI adjusted) |
|
|
|
|
|
Coefficient |
-0.046 |
-0.176 |
-0.046 |
-0.176 |
|
Std. error |
(0.274) |
(0.264) |
(0.275) |
(0.265) |
|
Year FE |
- |
Y |
- |
Y |
|
Formula-Type FE |
- |
- |
Y |
Y |
|
Y-Mean |
0.82 |
0.82 |
0.82 |
0.82 |
|
Observations |
261 |
261 |
261 |
261 |
|
Contracts |
87 |
87 |
87 |
87 |
|
Years |
15 |
15 |
15 |
15 |
|
R-Squared |
0.066 |
0.127 |
0.589 |
0.650 |
Legend: * = statistically significant at the 90 percent level (p-value <0.1); ** = statistically significant at the 95 percent level (p-value <0.05); *** = statistically significant at the 99 percent level (p-value <0.01); Y = included; - = not included.
Source: GAO analysis of FNS infant formula rebate contract data, Centers for Disease Control National Immunization Survey data, and state-level data from the Federal Reserve Bank of St. Louis. | GAO‑25‑106503
Appendix II: Summary of Advantages and Disadvantages of Alternatives to the Single-Supplier Competitive System for WIC Infant Formula
The following appendix includes a description of each alternative and a summary of potential advantages and disadvantages according to our interviews with stakeholders and relevant literature (see table 10).
Table 10: Potential Advantages and Disadvantages of Alternatives to the Competitive Single-Supplier Contract System for Special Supplemental Nutrition Program for Women, Infants, and Children (WIC) Infant Formula According to Stakeholder Interviews and Literature Review
|
Description |
Advantages |
Disadvantages |
|
FNS assistance with bid solicitation |
|
|
|
Permitted under the current system, except U.S. Department of Agriculture’s (USDA) Food and Nutrition Service (FNS) solicits bids for infant formula contracts on behalf of multiple states. |
· Reduces administrative burden on states to develop the bid solicitation |
· Potentially more administrative burden on WIC state agencies to involve FNS while also adhering to state-level procurement and other policies · Increases burden on FNS |
|
Fixed-price contracts and direct distribution of formula |
|
|
|
Permitted under the current system, states competitively bid on single-supplier contracts with infant formula manufacturers and purchase infant formula from the manufacturer offering the lowest discounted price. The formula is then distributed by the WIC state agency or an authorized organization. |
· Reduces the administrative burden on states to reimburse retailers · Gives state more control over inventory because the state purchases the formula directly |
· Less convenient for WIC participants, depending on how the state distributes formula · Increases the administrative burden and other costs related to storage and distribution of formula across the state · Government cost savings could be lower because there are fewer incentives for manufacturers to offer large discounts given that there will be no spillover sales to the non-WIC market. (Non-WIC consumers would not purchase formula through the state’s direct distribution system.) |
|
Multi-supplier rebate contracts |
|
|
|
This alternative is like the current system, except all states must award a contract to more than one manufacturer offering the lowest net price and other bidders within a specified percentage or amount of the best bid. |
· Gives WIC participants at least one more choice of formula brand · Increases market resilience, which could help states address supply disruptions if one manufacturer experiences supply issues |
· Higher administrative costs due to the complexity of soliciting and managing additional contracts · Manufacturers would likely offer lower rebates because the companies would not receive as much market share from this arrangement · Lower government cost savings from reduced rebates could result in fewer participants served if additional funding is not provided. |
|
Description |
Advantages |
Disadvantages |
|
Federally set rebate |
|
|
|
The federal government would set a predetermined rebate for WIC infant formula. Companies that want to sell formula to WIC participants voluntarily participate in the rebate program. |
· Gives WIC participants more formula choices · Smaller manufacturers could receive more market share |
· Cost increase for the federal government due to the lower rebate level · Lower government cost savings from reduced rebates could result in fewer participants served if additional funding is not provided |
|
Cash value benefit for infant formula purchases |
|
|
|
No rebate contracts. Instead, the state provides WIC participant a fixed dollar amount for infant formula purchases. |
· Gives WIC participants more formula choices · More competition could lead to lower retail prices · Reduces administrative costs for states to award and manage the infant formula contracts |
· The fixed dollar amount may not cover the retail cost of formula. WIC participants may receive less formula, which could increase infants’ nutritional risk · Without rebates, fewer participants would be served or participants would receive less infant formula if additional funding were not provided |
Source: GAO analysis of relevant literature and interviews with stakeholders. | GAO‑25‑106503
GAO Contacts
Kathryn A. Larin, 202-512-7215, larink@gao.gov
Michael Hoffman, 202-512-6445, hoffmanme@gao.gov
Staff Acknowledgments
In addition to the contacts above, Theresa Lo (Assistant Director), Cathy Roark (Analyst in Charge), Carly McCann, Kathleen McQueeney, Mathew Naven, Tracie Sánchez, and Michael Smith made key contributions to this report.
Also contributing to this report were Justine Augeri, James Bennett, Charlotte Cable, Jieun Chang, Julie Clark, Maria Gadel, Nkenge Gibson, Monika Gomez, Serena Lo, Stacia Odenwald, Emma O’Shea, Rhiannon Patterson, Almeta Spencer, William Stupski, and Adam Wendel.
The Government Accountability Office, the audit, evaluation, and investigative arm of Congress, exists to support Congress in meeting its constitutional responsibilities and to help improve the performance and accountability of the federal government for the American people. GAO examines the use of public funds; evaluates federal programs and policies; and provides analyses, recommendations, and other assistance to help Congress make informed oversight, policy, and funding decisions. GAO’s commitment to good government is reflected in its core values of accountability, integrity, and reliability.
Obtaining Copies of GAO Reports and Testimony
The fastest and easiest way to obtain copies of GAO documents at no cost is through our website. Each weekday afternoon, GAO posts on its website newly released reports, testimony, and correspondence. You can also subscribe to GAO’s email updates to receive notification of newly posted products.
Order by Phone
The price of each GAO publication reflects GAO’s actual cost of production and distribution and depends on the number of pages in the publication and whether the publication is printed in color or black and white. Pricing and ordering information is posted on GAO’s website, https://www.gao.gov/ordering.htm.
Place orders by calling (202) 512-6000, toll free (866) 801-7077,
or
TDD (202) 512-2537.
Orders may be paid for using American Express, Discover Card, MasterCard, Visa, check, or money order. Call for additional information.
Connect with GAO
Connect with GAO on Facebook, Flickr, X, and YouTube.
Subscribe to our RSS Feeds or Email Updates. Listen to our Podcasts.
Visit GAO on the web at https://www.gao.gov.
To Report Fraud, Waste, and Abuse in Federal Programs
Contact FraudNet:
Website: https://www.gao.gov/about/what-gao-does/fraudnet
Automated answering system: (800) 424-5454 or (202) 512-7700
Congressional Relations
A. Nicole Clowers, Managing Director, ClowersA@gao.gov, (202) 512-4400, U.S. Government Accountability Office, 441 G Street NW, Room 7125, Washington, DC 20548
Public Affairs
Sarah Kaczmarek, Managing Director, KaczmarekS@gao.gov, (202) 512-4800, U.S.
Government Accountability Office, 441 G Street NW, Room 7149
Washington, DC 20548
Strategic Planning and External Liaison
Stephen J. Sanford, Managing
Director, spel@gao.gov, (202) 512-4707
U.S. Government Accountability Office, 441 G Street NW, Room 7814, Washington,
DC 20548
[1]WIC is administered by 50 states, the District of Columbia, 33 tribal organizations, American Samoa, the Commonwealth of the Northern Mariana Islands, Guam, Puerto Rico, and the U.S. Virgin Islands. However, our analysis and scope of work generally did not include tribal organizations and U.S. territories that are not part of state alliances. At the local level, services are provided at a variety of local clinic locations including, but not limited to, county health departments, hospitals, schools, and Indian Health Service facilities.
[2]WIC is a federal discretionary grant program for which Congress appropriates a specific amount of funds each year.
[3]The Child Nutrition and WIC Reauthorization Act of 1989 generally required all WIC state agencies to use either: 1) a competitive, sealed-bid single supplier contract for price concessions on the cost of formula purchased by program participants, or 2) any alternative method which the state agency could show would result in savings equal to or greater than a competitive bidding system. Pub. L. No. 101-147, § 123, 103 Stat. 877,901 (codified as amended at 42 U.S.C. § 1786).
[4]7 CFR 246.16a(c)(5).
[5]L. Hodges, S. Toossi, J.E. Todd, and C. Ryan-Claytor, The Special Supplemental Nutrition Program for Women, infants, and Children (WIC): Background, Trends, and Economic issues, 2024 Edition, EIB-267, U.S. Department of Agriculture, Economic Research Service, February 2024.
[6]We used the most recent data available at the time of our analysis. We present prices per 26 reconstituted fluid ounces to be consistent with prior ERS research.
[7]We focused on the primary contract brand formula specified in the manufacturer’s bid. States can choose to issue some, none, or all of the manufacturers other contract brand infant formulas and may, at their discretion, choose to require medical documentation for any of these formulas. 7 C.F.R. § 246.16a(c)(9).
[8]For the literature search, we searched databases including Scopus, Econlit, ProQuest Sociology Collection, Business Abstract with Full Text, Social SciSearch®, Policy File Index, AGRICOLA, AGRIS, and AgEcon Search.
[9]Two economists reviewed the overall quality of the research.
[10]For this analysis, we excluded the soy products and focused on the milk-based formula products.
[11]The 30 states are Alabama, Arizona, California, Colorado, Connecticut, Florida, Georgia, Illinois, Indiana, Kansas, Kentucky, Louisiana, Maryland, Massachusetts, Michigan, Minnesota, Missouri, Nevada, New Jersey, New York, North Carolina, Ohio, Oregon, Pennsylvania, South Carolina, Tennessee, Texas, Virginia, Washington, and Wisconsin. Although NielsenIQ also provided state-level data for Mississippi, we excluded this state from our primary analysis because it did not distribute WIC foods through a retail distribution system during the entire period of study.
[12]The states we selected were California, Massachusetts, Mississippi, New Mexico, Oregon, Texas, Vermont, and Washington.
[13]WIC state agencies can hold an individual rebate contract or be part of a state alliance for the purpose of procuring infant formula through the competitive bidding process. State alliances can include state agencies (including for the 50 states, District of Columbia, and U.S. territories), as well as certain tribal entities. As of August 2024, 31 states were part of six multistate alliances, and the remaining 19 states were not in an alliance.
[14]Associations and research/advocacy organizations we interviewed were the Cato Institute, the Center on Budget and Policy Priorities, the Food Industry Association, the National Grocers Association, and the National WIC Association.
[15]A state agency has the option to structure its bid solicitation either as a single solicitation or as separate solicitations for milk-based and soy-based infant formulas. Any state agency or state alliance that served a monthly average of 100,000 infants during the preceding 12-month period must issue separate bid solicitations. 7 C.F.R. § 246.16a(c)(1).
[16]Some state agencies and alliances solicit separate bids for milk-based and soy-based formula and therefore may have separate contracts for milk-based and soy-based formula. 42 U.S.C. § 1786(h)(8)(vii).
[17]Approximately 38,000 retail stores are authorized nationwide to accept WIC benefits.
[18]Retail prices are set by the WIC-authorized store within state guidelines.
[19]State WIC agencies must credit cost savings they receive from infant formula rebates to their state’s WIC food grant. 42 U.S.C. 1786(b)(18). 2 C.F.R. § 200.406
[20]The Access to Baby Formula Act allows USDA to waive medical documentation requirements in the event of a recall under certain circumstances. The Medicaid program is the primary payer for exempt infant formulas and medical foods issued to WIC participants who are also Medicaid beneficiaries. Exempt infant formulas are designed for infants with specific medical or dietary problems. WIC state agencies are expected to coordinate with their state Medicaid counterpart to ensure that the nutritional needs of individuals who participate in both programs are met.
[21]The infant formula recall occurred amid ongoing supply chain challenges related to both the COVID-19 pandemic and areas of conflict around the world, which limited raw supplies for some components, according to the National Academies of Sciences, Engineering, and Medicine. See the National Academies of Sciences, Engineering, and Medicine, Challenges in Supply, Market Competition, and Regulation of Infant Formula in the United States (Washington, D.C.: July 2024).
[22]Caitlyn Keeve, Aleia Fobia, and Jennifer Berkley, “About 20% of Parents Reported Difficulty Getting Infant Formula in Summer 2023, Down From 35% in Fall 2022,” America Counts: Stories (U.S. Census Bureau, April 2, 2024), last revised June 6, 2024, https://www.census.gov/library/stories/2024/04/infant-formula-shortage.html. FDA and FNS worked with the U.S. Census Bureau to develop the survey questions.
[23]Medical documentation requirements were not waived for WIC participants who have a documented qualifying condition that requires the use of a specific type of formula to address their special nutritional needs.
[24]The FDA oversees the safety of infant formula products sold in the United States. For example, it specifies nutrition and energy requirements, manufacturing practices, and labeling requirements, among other things. Manufacturers interested in marketing their formula in the United States must register with the FDA, and the FDA inspects the manufacturers annually. During the shortage of 2022, the FDA used its enforcement discretion to temporarily allow some manufacturers from other countries to supply formula in the United States without meeting all of the FDA’s regulatory requirements. For example, the FDA provided manufacturers flexibility on product labeling. FDA also outlined a path for interested manufacturers of infant formula products that were imported, sold, and/or distributed under a letter of enforcement discretion to continue marketing their products while they work toward meeting all applicable FDA requirements.
[25]Pub. L. No. 117-129, § 2, 136 Stat. 1225.
[26]Our NielsenIQ retail sales data include 98 unique products which represent about 64 percent of total infant formula sales in the United States.
[27]We present prices per 26 reconstituted fluid ounces to be consistent with prior ERS research. Reconstituted fluid ounces refers to the amount of formula that a product will produce when prepared at standard dilution. A typical WIC eligible container of milk-based powder formula contains about 12–12.9 ounces of powder formula and makes about 90–92 fluid ounces of formula when mixed with water. The average price of these milk-based powder products was $21.47 in 2020 and $19.20 in 2023 (adjusted for inflation in constant 2023 dollars). Milk-based powder formula is the primary type of formula purchased, according to ERS research. Victor Oliveira, Elizabeth Frazão, and David Smallwood, The Infant Formula Market: Consequences of a Change in the WIC Contract Brand, ERR-124, U.S. Department of Agriculture, Economic Research Service, August 2011.
[28]Wholesale prices—which are set by the manufacturer—followed a pattern similar to retail prices for WIC contract brand products, according to our analysis of FNS data. Specifically, the average wholesale price for the primary milk-based powder formula specified in the WIC contract remained relatively stable from 2013 to 2020 and then fell after 2020, after adjusting for inflation. Although the NielsenIQ retail scanner data does not contain wholesale price information, according to NielsenIQ representatives, the FNS infant formula contract data contain wholesale prices for the WIC infant formula products under contract in each state.
[29]Other state-level factors we examined were not consistently correlated with infant formula prices. These included the unemployment rate, the poverty rate, real median household income, and real retail wages. See appendix I for additional information on this analysis, including on data sources used.
[30]Victor Oliveira, Mark Prell, David Smallwood, and Elizabeth Frazão, WIC and the Retail Price of Infant Formula, FANRR 39, U.S. Department of Agriculture, Economic Research Service, May 2004.
[31]In the next section of the report, we describe possible reasons why manufacturers have offered large rebates.
[32]Similarly, prior ERS research found that for 20 of the 22 contracts ERS reviewed, WIC state agencies received a higher rebate percentage in their infant formula contracts held in 2013, relative to their previous contract. See Victor Oliveira, Elizabeth Frazão, and David Smallwood, Trends in Infant Formula Rebate Contracts: Implications for the WIC Program, EIB-119, U.S. Department of Agriculture, Economic Research Service, December 2013.
[33]Two states had initiated a new WIC infant formula contract in 2024 at the time of our analysis. Both received a lower rebate percentage; one declined by 28 percent and the other by 40 percent.
[34]Other state-level factors we examined were not consistently correlated with the size of rebates that manufacturers offered at the time of bid solicitation. These included the unemployment rate, the poverty rate and the real median household income. Also, we found that being in a state alliance was not correlated with the rebate percentage after accounting for the number of formula-fed infants in a market. See appendix I for additional information on our data sources and analysis.
[35]David E. Davis and Victor Oliveira, Manufacturers’ Bids for WIC Infant Formula Rebate Contracts, 2003-2013, EIB-142, U.S. Department of Agriculture, Economic Research Service, July 2015.
[36]Hodges et al., The Special Supplemental Nutrition Program for Women, infants, and Children (WIC).
[37]We analyzed state-level NielsenIQ retail sales data from 2018 to 2023 to determine the effect of winning a WIC contract on prices, quantity sold, sales, and market share. The data were collected from about 90 participating retail chains and included 78 distinct milk-based formula products sold in 30 states. Accordingly, these data may not reflect all infant formula sales nationwide. Average retail price is calculated from total revenues and total units sold and therefore may not reflect shelf prices because the average retail price incorporates discounts and loyalty card sales, although it does not include manufacturer distributed coupons. Because our analysis includes state-by-quarter, product-by-quarter, and product-by-state fixed effects, we believe it is reasonable to interpret our estimates as the causal effects of WIC contract status. For more information about our methodology and robustness checks, see appendix I. Our estimate for WIC contract products is statistically significant at the 1 percent level and our estimate for other products under the same brand is significant at the 10 percent level.
[38]The WIC state agency must use the primary contract product as the first choice of infant formula to issue to WIC participants, and primary contract products were the focus of our analysis. Other contract-brand infant formulas a WIC state agency chooses to issue also require a rebate to the state, except exempt formulas that are for infants with specific medical or dietary problems.
[39]The 95 percent confidence interval ranges from a 0.6 percent to 2.8 percent increase. In an alternate regression model, the estimated effect is a 1.4 percent increase and the 95 percent confidence interval ranges from 0.8 percent to 1.9 percent. Our econometric analysis is not intended to measure the effect of the WIC program as a whole on infant formula prices and does not measure all possible effects the WIC contracting system might have on the competitive environment in the infant formula market. That is, our approach estimates price differentials between WIC primary contract products and non-WIC products that result from winning the WIC contract in a state or alliance under the existing regulatory environment. We view these price differentials as indicative of one of the effects of the single supplier competitive contracts on the infant formula market, but effects may differ under alternative WIC contracting systems.
[40]The 95 percent confidence interval ranges from a 0.03 percent decrease to a 0.7 percent increase. In an alternate regression model, the estimated effect is a 0.5 percent increase and the 95 percent confidence interval ranges from 0.2 percent to 0.8 percent. Our analysis allowed us to differentiate the effect of a product being under WIC contract from that product’s brand winning a WIC contract. For more information, see appendix I.
[41]Christian A. Rojas and Hongli Wei, “Spillover Mechanisms in the WIC Infant Formula Rebate Program,” Journal of Agricultural and Food Industrial Organization, vol. 17, (2019).
[42]Oliveira et al., WIC and the Retail Price of Infant Formula.
[43]Prior research has also characterized the infant formula market in this way, consistent with economic theory. For example, see Oliveira et al., WIC and the Retail Price of Infant Formula.
[44]State agencies set maximum allowable reimbursement levels to retailers, which provide a ceiling on reimbursement for the WIC primary contract product.
[45]Because the NielsenIQ retail sales data capture the average price instead of shelf price, use of manufacturer coupons could affect the average price of products. This could result in a higher average price for WIC contract products if WIC consumers do not take advantage of such coupons. However, we did not identify any evidence that coupons or other optional discounts are driving the difference in price between WIC contract products and non-WIC products. In fact, WIC customers have an incentive to use their discount loyalty cards if purchasing other non-WIC items or if loyalty programs accrue points that can be used for other purchases. Furthermore, FNS’s policy states that allowing WIC participants to use vendor discounts in WIC purchases reinforces wise food-purchasing practices, a goal of WIC nutrition education. The policy notes that many state agencies have encouraged the use of coupons and other vendor discounts through their nutrition education programs in order to reach this goal or reduce program costs. See U.S. Department of Agriculture, Food and Nutrition Service, WIC Policy Memorandum #2014-3, Vendor Management: Incentive Items, Vendor Discounts and Coupons (February 7, 2014), https://www.fns.usda.gov/wic/vendor-management-incentive-items-vendor-discounts-and-coupons (webpage last updated June 25, 2024).
[46]See appendix I for coefficient estimates and confidence intervals.
[47]All estimates in figure 8 are statistically significant at the 1 percent level. See appendix I for more details.
[48]Market share is calculated using only the products included in our sample, and therefore excludes products by brands that do not have WIC contracts. Therefore, the market share calculation reflects a subset of the overall infant formula market. See appendix I for more details.
[49]The 95 percent confidence interval ranges from a 55 percentage point to a 60 percentage point increase. In an alternate regression model, the estimated effect is a 69 percentage point increase and the 95 percent confidence interval ranges from 66 percentage points to 71 percentage points. See appendix I for more details.
[50]Yoon Choi, Alexis Ludwig, Tatiana Andreyeva, and Jennifer Harris, “Effect of United States WIC Infant Formula Contracts on Brand Sales of Infant Formula and Toddler Milks,” Journal of Public Health Policy, vol. 41 (2020): 303–320.
[51]Oliveira et al., The Infant Formula Market: Consequences of a Change in the WIC Contract Brand.
[52]ERS estimated that infants in USDA’s WIC program consumed 56 percent of U.S. infant formula in 2018, thus non-WIC infants consumed an estimated 44 percent of U.S. infant formula. The NielsenIQ data do not disaggregate sales into WIC and non-WIC purchases. In theory, the entirety of the sales increase for the product specified in the WIC contract could be due to WIC participants if non-WIC participants did not change their purchasing behavior, although our brand-level results and related research suggest this is unlikely. We estimate that a meaningful portion of the increase in sales is due to the non-WIC spillover effect. See appendix I for more details.
[53]This is because WIC participants generally cannot use their benefits to purchase products not specified in the WIC contract unless they obtain medical documentation of a need for a different product. In practice, there will be some exceptions due to WIC participants who purchase exempt formula for medical reasons. In addition, FNS granted waivers during the 2022 infant formula shortage allowing WIC participants to purchase noncontract brands of formula, which occurred during the period we study.
[54]Oliveira et al., The Infant Formula Market: Consequences of a Change in the WIC Contract Brand.
[55]Yonghong An, David Davis, Yizao Liu, and Ruli Xiao. “Procurement in Welfare Programs: Evidence and Implications from WIC Infant Formula Contracts.” July 2023, https://doi.org/10.48550/arXiv.2308.12479
[56]U.S. Department of Agriculture, Economic Research Service, “WIC Program,” last updated June 26, 2024, https://www.ers.usda.gov/topics/food‑nutrition‑assistance/wic‑program/
[57]GAO, Food Assistance: FNS Could Take Additional Steps to Contain WIC Infant Formula Costs, GAO‑06‑380 (Washington, D.C.: March 28, 2006).
[58]Victor Oliveira, Mark Prell, David Smallwood, and Elizabeth Frazão, Infant Formula Prices, and Availability: Final Report to Congress, E-FAN-02-001, U.S. Department of Agriculture, Economic Research Service, October 2001.
[59]N. Kline, M. Meyers, and J. Marr, WIC Participant and Program Characteristics 2018 Food Packages and Costs Report, a report prepared at the request of the Department of Agriculture, Food and Nutrition Service, November 2020.
[60]U.S. Department of Agriculture, Food and Nutrition Service. Final Policy Memorandum #99-3 Evaluation Criteria for Infant Formula Rebate Contracts, (October 14, 1998).
[61]The Child Nutrition and WIC Reauthorization Act of 2004 added limits on the size of state alliances. State alliances may only serve up to 100,000 infants, though alliances that existed prior to 2004 are allowed to continue and serve additional infants as long as they do not add new states.
[62]Our analysis excluded Washington D.C., tribal organizations, and U.S. territories.
[63]Certain WIC participants with medically documented qualifying conditions may receive specialty contracted or non-contracted formula in accordance with their medical documentation.
[64]Oliveira et al., The Infant Formula Market: Consequences of a Change in the WIC Contract Brand.
[65]State agencies must establish minimum requirements for the quantity and variety of supplemental foods that WIC-authorized stores must stock to be authorized. However, there is no federal requirement for the quantity of infant formula WIC-authorized vendors must stock. 7 C.F.R. § 246.12(g)(3)(i)
[66]C. Kessler, A. Bryant, K, Munkacsy, and K. Farson Gray (2024). National- and State-level estimates of WIC eligibility and WIC program reach in 2022, a report prepared for the U.S. Department of Agriculture, Food and Nutrition Service (Arlington, VA: Westat Insight). Some infants who are eligible but not served by WIC may be fully breastfed.
[67]This limit applies from July 1, 2024 to June 30, 2025, according to the Food and Nutrition Service.
[68]Federal Trade Commission, Market Factors Relevant to Infant Formula Supply Disruptions 2022 (Mar. 13, 2024).
[69]Additionally, the FTC report stated that highly concentrated markets can create fragility, with a single shock or disruption affecting the entire supply chain. The U.S. infant formula market has long been highly concentrated, including prior to 1989 when the use of single-supplier competitive contracts became a federal requirement. For instance, in 1987, three manufacturers produced approximately 99 percent of all domestic infant formula. Similarly, in 2022, four companies produced 99 percent of the powder formula sold in the United States. See GAO, Infant Formula: Cost Containment and Competition in the WIC Program, HRD-90-122 (Washington, D.C.: Sept. 27, 1990) and U.S. Food and Drug Administration, The U.S. Food and Drug Administration’s Immediate National Strategy to Increase the Resiliency of the U.S. Infant Formula Market (March 2023).
[70]National Academies of Sciences, Engineering, and Medicine, Challenges in Supply, Market Competition, and Regulation of Infant Formula in the United States (Washington, D.C.: 2024). The Food and Drug Omnibus Reform Act of 2022 directed the FDA to sponsor this work and produce a report of its findings, conclusions, and recommendations on measures to address infant formula supply and market competition in the United States. Pub. L. No. 117-328, tit. III, § 3401, 136 Stat. 4459, 5839-40. The National Academies study also found that production of infant formula in the United States is concentrated in few manufacturing facilities, which increases the potential for a shortage.
[71]Above-50-percent stores (A50) specialize in serving WIC participants and derive most of their food sales from WIC benefit redemptions. According to ERS, 973 A50 stores represented 2.2 percent of WIC stores nationwide but accounted for 10.6 percent of national WIC redemptions in 2018.
[72]Federal Trade Commission, Market Factors Relevant to Infant Formula Supply Disruptions 2022.
[73]For example, USDA regulations require that WIC infant formula provides at least 1.5 milligrams of iron per 100 kilocalories at standard dilution, while the FDA requires infant formula to contain between 0.15 and 3 milligrams of iron per 100 kilocalories.
[74]Under authority provided by the Access to Baby Formula Act, FNS temporarily waived minimum requirements and specifications for infant formula.
[75]89 Fed. Reg. 28,488. (April 18, 2024).
[76]88 Fed. Reg. 86,545 (Dec. 14, 2023).
[77]88 Fed. Reg. 86,545 (Dec. 14, 2023). The rule states that the WIC state agency would determine when remedies take effect and remain in effect.
[78]Medical documentation requirements may not be waived for participants receiving Food Package III in the event of supply chain disruption, including an infant formula recall. This package provides formula and foods that meet special dietary needs for WIC participants with medically documented qualifying conditions.
[79]88 Fed. Reg. 86,545 (Dec. 14, 2023). Prior to the implementation of the Access to Baby Formula Act, FNS guidance (WIC policy memo #99-3) encouraged, but did not require, states to include provisions in their contracts that would protect the state agency in the event of a supply chain disruption, such as providing rebates to states on non-contract formula if the contract formula was unavailable. Officials from three state agencies we interviewed noted that their contracts already contained certain remedies prior to the shortage, such as requiring manufacturers to pay rebates to states on products from other brands during a recall or other types of supply disruptions.
[80]In its report, the National Academies expressed support for the remedies to be included in WIC contracts and said that USDA should also require the remedies apply to emergency periods or supply chain disruptions caused by factors other than a recall.
[81]In its report, the National Academies suggested identifying ways the bidding requirements for WIC infant formula contracts could be revised to allow for additional bidders as an area for future research.
[82]The Household Pulse Survey is administered by the U.S. Department of Commerce, Census Bureau, and samples 1 million housing units in the United States. Response rates vary with each survey and are typically less than 10 percent. All estimates are weighted to be nationally representative of households in the United States.
[83]88 Fed. Reg. 11,516 (Feb. 23, 2023).
[84]7 C.F.R. § 246.16a(d).
[85]7 C.F.R. § 246.16a(a)(1).
[86]Data were not available to determine how the formula costs under Vermont’s fixed price contracts compared to using a rebate contract. For the Mississippi analysis, we used the average retail price of the WIC product in Mississippi to help determine total costs of infant formula to the state.
[87]We adjusted these cost estimates to 2017 dollars because the fixed price contract was initiated in July 2017.
[88]7 C.F.R. § 246.16a(l). This option has been available since 1992 and, FNS stated it was intended to increase state purchasing power by encouraging states to form buying groups.
[89]Improving Newborn Formula Access for a Nutritious Tomorrow Act of 2022, 117 H.R. 8587.
[90]Improving Newborn Formula Access for a Nutritious Tomorrow Act of 2023, 118 H.R. 3540.
[91]Prior to 1989, several states used an open market system, which involved states awarding rebate contracts to multiple companies. This system did not involve competitive bidding or exclusive contracts. Rather, infant formula manufacturers voluntarily agreed to provide a rebate to the state. Our prior work and USDA previously found that the open market contracts resulted in lower cost savings compared to use of competitive bidding for a single-supplier contract. See GAO, Infant Formula: Cost Containment and Competition in the WIC Program, GAO/HRD‑90‑122 (Washington, D.C.: Sept. 27, 1990) and U.S. Department of Agriculture, Food and Nutrition Service, Office of Analysis and Evaluation, Cost-Effectiveness of Infant Formula Rebate Systems in the Special Supplemental Food Program for Women, Infants, and Children (WIC) (Alexandria, VA: 1991).
[92]An et al. 2023. "Procurement in welfare programs: Evidence and implications from WIC infant formula contracts."
[93]One WIC state agency official suggested the not-to-exceed amounts for formula could be set through existing mechanisms, such as redemption data, or in other ways, such as an independent board or committee, and could be adjusted over time as needed.
[94]Federal law increased the amount that states must provide WIC participants for the fruit and vegetable cash value benefit in 2022 and federal regulations require the benefit be adjusted annually for inflation. Agriculture, Rural Development, Food and Drug Administration, and Related Agencies Appropriations Act, 2022, Pub. L. No. 117-103, § 787, 136 Stat. 49, 101; 7 C.F.R. § 246.16.
[95]For infant formula, state agencies provide WIC participants the full nutrition benefit amount that can be individually tailored based on a nutrition and breastfeeding assessment. The full nutrition benefit amount is intended to provide close to 100 percent of the nutritional needs of a non-breastfed infant from birth to 6 months of age.
[96]Data in year 2013 refers to 07/13/2013 -12/28/2013 and year 2023 refers to 01/07/2023 to 8/12/2023. These years are truncated due to ten-year rolling history of the data.
[97]We focused on the primary contract brand formula specified in the manufacturer’s bid. States can choose to issue some, none, or all of the manufacturer’s other contract brand infant formulas and may, at their discretion, choose to require medical documentation for any of these formulas (7 CFR 246.16a(c)(9)).
[98]The general trend that infant formula prices were generally stable or falling from 2013 to 2023 also holds if we examine all milk-based concentrate and powder products in our data. The average price for all milk-based ready-to-feed products was generally increasing over time.
[99]Victor Oliveira, Elizabeth Frazão, and David Smallwood, The Infant Formula Market: Consequences of a Change in the WIC Contract Brand, ERR-124, U.S. Department of Agriculture, Economic Research Service, August 2011.
[100]Our analysis of soy-based products was limited to the WIC primary contract formula products specified in the manufacturers’ bids.
[101]Total sales dollars are net of discounts applied through sales and loyalty cards, thus the weighted average price is net of these discounts.
[102]For example, see Oliveira et al., The Infant Formula Market: Consequences of a Change in the WIC Contract Brand.
[103]The NielsenIQ data are at the UPC level rather than individual transaction point-of-sale level. Without weighting by units sold, the same weight is given to a product’s price regardless of units sold.
[104]These data are similar to the national NielsenIQ data but are at the state level and quarterly level of frequency.
[105]These UPCs were chosen to include the milk and soy WIC primary contract brand products as well as other comparable non-primary contract WIC products. The NielsenIQ retail data are available in 31 states. However, our analyses exclude Mississippi because it changed from a direct-distribution to a retail-distribution system during our analysis period.
[106]The
30 states are Alabama, Arizona, California, Colorado, Connecticut, Florida,
Georgia, Illinois, Indiana, Kansas, Kentucky, Louisiana, Maryland,
Massachusetts, Michigan, Minnesota, Missouri, Nevada, New Jersey, New York,
North Carolina, Ohio, Oregon, Pennsylvania, South Carolina, Tennessee, Texas,
Virginia, Washington, and Wisconsin.
[107]We converted the NielsenIQ scanner data to the monthly level by dividing sales quantities and sales dollars by three. We used the same price and market share for all 3 months in a quarter.
[108]Total sales dollars are net of discounts applied through sales and loyalty cards, thus the weighted average price is net of these discounts.
[109]The NielsenIQ data are at the UPC level rather than individual transaction point-of-sale level. Without weighting by units sold, the same weight is given to a product’s price regardless of number of units sold.
[110]In
the regressions with brand market share as the dependent variable, the
indicator for WIC product,  , is dropped because these
analyses are at the brand level.
, is dropped because these
analyses are at the brand level.
[111]California switched from Mead Johnson to Abbott Nutrition in August 2022, Georgia switched from Nestlé/Gerber to Mead Johnson in November 2018, Kentucky switched from Nestlé/Gerber to Abbott Nutrition in November 2021, and Michigan switched from Mead Johnson to Abbott Nutrition in November 2021.
[112]The product-by-quarter fixed effects would also account for supply shocks that potentially affect all products at the same time. This would be reflected in all product-by-quarter fixed effects being higher/lower during the shortage.
[113]For example, see Yoon Choi, Alexis Ludwig, Tatiana Andreyeva, and Jennifer Harris, "Effects of United States WIC infant formula contracts on brand sales of infant formula and toddler milks," Journal of Public Health Policy 41 (2020): 303-320; Rui Huang and Jeffrey M. Perloff, "WIC contract spillover effects," Review of Industrial Organization 44 (2014): 49-71.
[114]Choi et al. "Effects of United States WIC infant formula contracts on brand sales of infant formula and toddler milks."
[115]For example see GAO, Consumer Protection: Gender-Related Price Differences for Goods and Services, GAO‑18‑500 (Washington, D.C.: August 23, 2018) and Victor Oliveira, Mark Prell, David Smallwood, and Elizabeth Frazão, WIC and the Retail Price of Infant Formula, FANRR39, US Department of Agriculture, Economic Research Service, May 2004.
[116]We converted the NielsenIQ scanner data to the monthly level by dividing sales quantities and sales dollars by three. We used the same price and market share for all 3 months in a quarter.
[117]The number of formula-fed WIC infants is the sum of fully- and partially-fed infants from FNS program data. We calculated the number of non-WIC formula-fed infants as the total number of infants aged 0-12 months who had used formula at least once from the National Immunization Survey minus the number of formula-fed WIC infants. We retrieved data on the state’s unemployment rate, poverty rate, real median household income, and real retail wages from the Federal Reserve Bank of St. Louis.
[118]The number of formula-fed infants was calculated as the total number of infants aged 0-12 months who had used formula at least once from the National Immunization Survey. Data on the state’s unemployment rate, poverty rate, and real median household income (in 2022 constant dollars) were retrieved from the Federal Reserve Bank of St. Louis.
[119]As mentioned in the body of this report, a state alliance refers to two or more WIC state agencies that join to solicit competitive bids for infant formula.
[120]Being in an alliance may have additional benefits to member states that are not captured in this analysis.