DAIRY FARMERS
USDA Should Assess the Effectiveness of Its Communications Regarding Key Program Benefits
Report to Congressional Requesters
United States Government Accountability Office
For more information, contact Steve Morris at morriss@gao.gov.
Highlights of GAO-25-106595, a report to congressional requesters
USDA Should Assess the Effectiveness of Its Communications Regarding Key Program Benefits
Why GAO Did This Study
Dairy farmers may have difficulty staying in business when the price of feed increases, or the price of milk declines too much. The DMC program can help dairy farmers manage these price risks.
GAO was asked to review USDA’s implementation of the DMC program. This report examines (1) program payments, participation, and benefits and (2) challenges to program participation and steps USDA has taken to address those challenges.
GAO reviewed USDA participation and payout data for DMC and data on the number of dairy farms by state from 2019 through 2024. GAO interviewed USDA officials and eight groups representing dairy farmers. GAO selected these groups to ensure geographic dispersion, representation of both smaller and larger dairy farms, and a mix of conventional and organic dairy producers.
What GAO Recommends
GAO recommends that USDA assess how effectively it is communicating with dairy farmers about the DMC program. This effort should include measuring progress toward strategic objectives.
The agency generally disagreed with GAO’s recommendation and related findings about communications to promote awareness of the DMC program. As discussed in the report, USDA’s current tracking documents focus on counting activities, such as agency attendance at outreach events, rather than measuring results of those activities in terms of intended objectives. GAO maintains that USDA should implement the recommendation.
What GAO Found
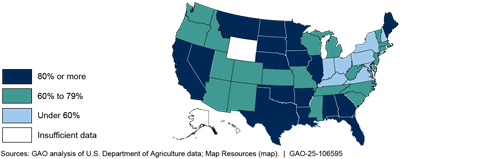
The U.S. Department of Agriculture’s (USDA) Dairy Margin Coverage (DMC) program pays dairy farmers who enroll in the program when the difference (margin) between the national prices of milk and feed falls below certain levels. From 2019 through 2024, this program made net payments to dairy farmers that totaled about $2.7 billion after subtracting fees and premiums collected for enrollment and coverage. About 45 percent of the amount USDA paid went to smaller dairy farms that produced 5 million pounds or less of milk each year—the typical total production of about 207 dairy cows in 2024. In 2024, over 63 percent of the nation’s dairy farms participated in the program. Most of these dairy farms were smaller farms. The percentage of farms participating varied by state, as shown in the map below. Most dairy farmer groups GAO interviewed said DMC helps farmers stay in business by reducing price risks. They noted that the program particularly helped small farmers due to the relatively low cost of coverage for the first 5 million pounds of milk. Following GAO’s analysis, Congress increased the 5-million-pound cap to 6 million pounds.
However, some dairy farmer groups said that certain farmers faced challenges to program participation. For example, according to some dairy farmer groups, underserved farmers such as beginning farmers just starting their operations, sometimes faced issues related to program awareness that made participation challenging. These issues included difficulty obtaining information about enrollment deadlines and benefits. Dairy farmer groups said some farmers may need targeted information about the DMC program. Other challenges identified by farmer groups involve aspects of the program that are set in statute, such as limiting the amount of milk covered by DMC to historic production.
USDA officials said they have taken steps to better communicate information about the program—including purchasing ads for dairy farmers on social media. However, they have not assessed the effectiveness of USDA’s communication methods in facilitating dairy farmer awareness of and participation in the program. For example, USDA does not measure how these steps affect progress toward agency strategic objectives of providing a safety net to farmers and reducing access barriers for rural economic development. By assessing how effectively it is communicating with farmers about the DMC program, USDA could better ensure it is helping farmers make informed decisions about participation in the program, potentially helping them stay in business.
This is a work of the U.S. government and is not subject to copyright protection in the United States. The published product may be reproduced and distributed in its entirety without further permission from GAO. However, because this work may contain copyrighted images or other material, permission from the copyright holder may be necessary if you wish to reproduce this material separately.
July 31, 2025
The Honorable Susan M. Collins
United States Senate
The Honorable Kristen Gillibrand
United States Senate
The Honorable Angus S. King, Jr.
United States Senate
The Honorable Roger W. Marshall
United States Senate
The Honorable Jeanne Shaheen
United States Senate
The U.S. Department of Agriculture’s (USDA) Dairy Margin Coverage (DMC) program provides a safety net for dairy farmers by helping them manage certain risks they face in maintaining their herds and contributing to the U.S. milk supply.[1] In particular, the program protects dairy farmers against risks from variances in the price of milk and the cost of feed, which can threaten a dairy farmer’s ability to make a profit and stay in business. Dairy farmers who participate in the program and pay any required fees or premiums receive payments when the difference (or margin) between the national price of milk and the average cost of feed falls below certain levels. From 2019 through 2024, USDA paid dairy farmers enrolled in the DMC program a total of over $2.7 billion after fees and premiums. Congress authorized the program under the 2018 Farm Bill and extended it through 2031 in subsequent legislation.[2] USDA’s Farm Service Agency (FSA) administers the DMC program.
You asked us to review key aspects of the program, including dairy farmer participation and payments to dairy farmers.[3] This report examines (1) DMC program participation, payments, and benefits and (2) challenges to program participation and steps FSA has taken to address these challenges. In addition, appendix I provides information on trends in the number of dairy farms, milk production, and number of dairy cows in recent decades.
To examine DMC program participation, we obtained and analyzed FSA data on DMC enrollments, premiums paid by dairy farmers and payments made to dairy farmers from 2019 through 2024. We also analyzed data from USDA on numbers of dairy farms per state, numbers of dairy cows, and milk production from 2003 through 2024. As part of our analysis, we used agency data to identify dairy farmers who also participated in two USDA Federal Crop Insurance plans: the Risk Management Agency’s Dairy Revenue Protection and Livestock Gross Margin Insurance for Dairy Cattle. We determined the data we analyzed were sufficiently reliable for determining trends in DMC participation, DMC payments, numbers of dairy farmers participating in both DMC and related Risk Management Agency plans, numbers of dairy farms and dairy cows, and milk production.
To identify benefits of the program, we interviewed stakeholders, including eight groups that represent dairy farmers, to obtain their views. We selected these groups based on variation in geographic dispersion, representation of conventional and organic dairy farmers, and representation of both smaller and larger dairy farms.[4] We conducted semistructured interviews with each of these groups to ensure we consistently captured their views. We then analyzed the results of these interviews and related documents to identify the main themes. To characterize the views of the groups, we defined modifiers as follows: “all” represents eight, “most” represents five to seven of the groups, and “some” represents one to four of them. The views of these groups are not generalizable to all dairy farmer groups or dairy farmers, but they illustrate a range of views regarding the DMC program.
To identify challenges to program participation, we used the same dairy farmer groups, interviews, and approach described above. To examine steps FSA has taken to address identified challenges, we interviewed and obtained documents from FSA program staff in headquarters, Kansas City, and six state FSA offices: New York, Wisconsin, California, Kansas, Maine, and Vermont. We selected these state offices based on variation in geographic dispersion and dairy production. Headquarters staff are responsible for program development and oversight, Kansas City staff are responsible for maintaining program data, and FSA state office staff are responsible for program implementation. Documents we obtained from these state office staff included reports on communication efforts and examples of FSA communications such as newsletters state FSA offices sent to dairy farmers. We compared FSA communication methods with objectives in USDA’s strategic plan and federal standards for internal control for external communication.[5]
To determine trends in the number of dairy farms and milk production, we obtained and analyzed data from USDA’s Milk Production Survey from 2003 through 2024. To determine trends in the number dairy cows in the U.S. and the distribution of dairy cows on farms of various sizes, we used data from the USDA’s Census of Agriculture, which occurs every 5 years. Appendix II describes our scope and methodology in greater detail.
We conducted this performance audit from February 2023 to July 2025 in accordance with generally accepted government auditing standards. Those standards require that we plan and perform the audit to obtain sufficient, appropriate evidence to provide a reasonable basis for our findings and conclusions based on our audit objectives. We believe that the evidence obtained provides a reasonable basis for our findings and conclusions based on our audit objectives.
Background
Dairy farmers can enroll in the DMC program in person at local FSA offices or online.[6] They pay a $100 administrative fee each year when they enroll, but FSA will waive the fee for dairy farmers who self-certify as historically underserved.[7]
Dairy farmers who participate may select a range of coverage from catastrophic coverage, which provides coverage at the $4.00 margin level, to “buy-up” coverage for various margins above $4. The smaller the margin, the harder it can be for dairy farmers to recover the price of feed—typically a major expense—by selling milk.[8] Feed costs are generally the largest component of total operating costs, comprising almost three quarters of total operating costs according to USDA data for 2021.[9]
Catastrophic coverage is included at no additional cost beyond any administrative fee. Buy-up coverage is available under a two-tier pricing schedule that depends on the amount of milk production and the margin covered (see fig. 1).
Figure 1: Options for Dairy Farmers When Selecting Level of U.S. Department of Agriculture (USDA) Dairy Margin Coverage (DMC)
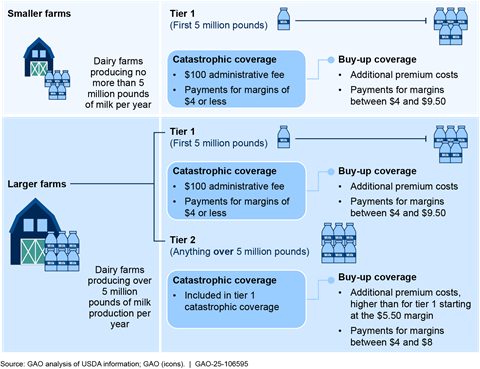
Note: In July 2025, the law establishing the program was amended to raise tier 1 coverage to 6 million pounds of milk produced per year. According to USDA officials these changes will be effective beginning in 2026. Pub. L. No. 119-21, § 10313(b).
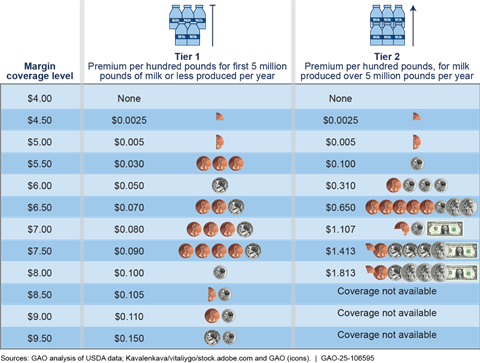
Pricing schedule. Through 2025, participating dairy farmers were able to purchase buy-up coverage under the tier 1 pricing schedule for the first 5 million pounds of milk produced per year, based on historic production amounts, as described later in this report. In July 2025, the law establishing the program was amended to raise tier 1 coverage to 6 million pounds of milk produced per year. According to FSA officials, these changes will be effective beginning in 2026. According to our analysis of USDA survey data on annual milk production, 5 million pounds was the annual production of about 207 dairy cows in 2024.[10] Buy-up coverage is available up to a $9.50 margin under the tier 1 pricing schedule. Through program year 2025, the tier 2 pricing schedule is for milk produced over the first 5 million pounds per year and based on historic production amounts. Tier 2 pricing is higher than tier 1 pricing for margins starting at $5.50, and tier 2 allows coverage up to an $8.00 margin (see fig. 2).
Note: The DMC program is a voluntary program that pays participating dairy farmers when the difference (margin) between the national price of milk and the average cost of feed falls below a certain level selected by the program participants. The DMC program has a two-tier pricing schedule that differentiated between the first 5 million pounds of production and higher amounts. In July 2025, the law establishing the program was amended to set that pricing schedule to differentiate between the first 6 million pounds of production and higher amounts beginning in 2026.
Established milk production history. Dairy farmers may obtain coverage
for the milk USDA has established as their farms’ historic production amount,
not the farms’ current milk production. According to FSA officials, basing the
coverage on production history rather than current production helps ensure that
dairy farmers do not change production in response to the program.
Other risk management programs. Dairy farmers are also eligible to participate in two USDA insurance plans that help dairy farmers mitigate risks: (1) Dairy Revenue Protection and (2) Livestock Gross Margin Insurance for Dairy Cattle. These programs provide subsidized insurance and do not limit the amount of milk production that can be covered.
Most Dairy Farms Participate in the DMC Program, but Participation and Payments Vary by Dairy Farm Size and State, with Several Benefits Cited
Most dairy farms participate in the DMC program, but participation rates have declined since the program’s inception. Participation rates have varied by dairy farm size and state. In addition, net payments to dairy farmers have varied year to year.[11] Most dairy farmer groups we interviewed cited several benefits of the program, including price risk reduction and availability of low-cost coverage.
Trends in DMC Program Participation
Most dairy farms participate in the DMC program. However, both the percentage of all dairy farms and the absolute number of dairy farms participating have declined. More specifically, in 2019, over 68 percent of the nation’s total dairy farms (23,485 of 34,207) participated, according to our analysis of DMC program participation data and USDA data on the total number of dairy farms.[12] In 2024, over 63 percent of the nation’s total dairy farms (15,686 of 24,811) participated in the program.[13]
According to our analysis of DMC participation data, the change in the number of dairy farm participants represented a decline of over 33 percent in 5 years. FSA officials we interviewed said that this decline could be due to the downward trend in the overall number of dairy farms as the dairy industry consolidates. See appendix I for a discussion of trends in the number dairy farms, milk production, and herd size in recent decades.
Trends by dairy farm size. As of 2024, smaller dairy farms—those that produce no more than 5 million pounds of milk per year—were the highest percentage of DMC program participants, but they have been declining as a proportion of all participants. In 2019, almost 76 percent of participating dairy farms (17,766 of 23,485) were smaller dairy farms, and in 2024, this proportion had declined to around 68 percent of participating dairy farms (10,721 of 15,686), as shown in figure 3.
Figure 3: Number of Dairy Farms Participating in the U.S. Department of Agriculture (USDA) Dairy Margin Coverage (DMC) Program by Dairy Farm Size, 2019–2024
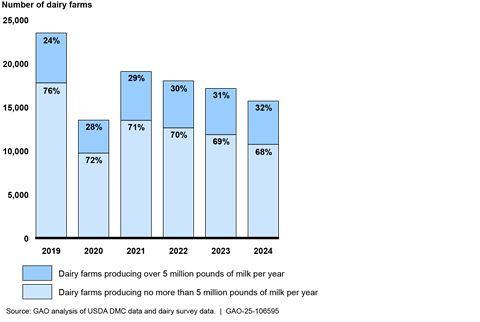
Note: USDA officials said that participation in DMC for 2020 was lower than other years because various models used to predict future milk and feed prices predicted there would be few or no DMC payments that year and so farmers might not benefit from purchasing DMC.
Dairy farmers have varied in the amount of coverage they purchased under the
program, depending on their size. According to our analysis of USDA DMC
participation data from 2019 through 2024, dairy farmers operating farms of any
size often purchased buy-up coverage for the first 5 million pounds of
production. But dairy farmers operating larger farms often opted solely for
catastrophic coverage for milk production over 5 million pounds. For example:
· In 2024, dairy farmers operating over 99 percent (10,664 of 10,721) of smaller dairy farms participating in the DMC program purchased buy-up coverage at an additional premium above catastrophic coverage for the milk they produced. This milk falls under the program’s tier 1 pricing schedule.
· Similarly, in 2024, dairy farmers operating over 97 percent of larger dairy farms (4,834 of 4,965) that participated in the DMC program purchased buy-up coverage under the tier 1 pricing schedule for the first 5 million pounds of milk produced. In contrast, for milk produced over 5 million pounds, dairy farmers operating 8 percent of larger dairy farms (398 of 4,965) participating in the program purchased buy-up coverage under the tier 2 pricing schedule. Most larger dairy farms, about 87 percent of larger dairy farms (4,312 of 4,965) participating in the program, were enrolled in catastrophic coverage (a margin of $4.00 included at no additional premium) for milk produced over 5 million pounds. The remaining 5 percent of larger dairy farms (255 of 4,965) participating in the program did not elect any tier 2 coverage.
As of 2023, about 28 percent (1,494 of 5,283) of larger dairy farms participating in the DMC program were also enrolled in one of USDA’s Federal Crop Insurance plans for dairy farmers, as were about 3 percent (326 of 11,840) of smaller farms, according to our analysis of USDA data.[14] See appendix III for additional information about these other dairy programs, including participation rates and payments.
Participation rates by state. According to our analysis, participation rates in the DMC program vary by state, as shown in figure 4. Some states had participation rates below 60 percent in 2024. Other states had participation rates above 80 percent in 2024. While the percentages have changed from year to year along with overall participation rates, states with relatively high participation rates in 2024 typically had relatively high participation rates compared with other states in previous years. Similarly, states with relatively low participation rates typically had relatively low participation rates in previous years.
Figure 4: U.S. Department of Agriculture (USDA) Dairy Margin Coverage (DMC) Participation Rates by State, 2024
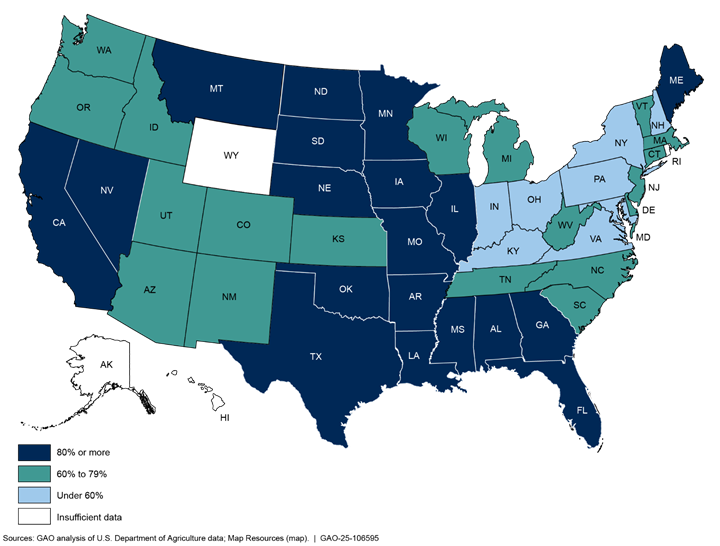
Note: Our analysis does not include DMC participation rates for dairy farms in Alaska, Hawaii, Puerto Rico, Rhode Island, and Wyoming because USDA data do not report the number of dairy farms in these states due to the relatively small number of dairy farms there. Collectively these states had about 16 dairy farms in 2024.
FSA officials told us that, in their experience, some dairy farmers do not want
to participate in government programs, including the DMC program, for a variety
of reasons. These reasons include privacy concerns or political or religious
beliefs against receiving federal subsidies. FSA officials said they knew this
through relationships they have built with dairy farmers in their areas, but
they did not have documentation on the extent to which farmers chose not to
participate for these reasons. Most dairy farmer groups we interviewed also
confirmed that some dairy farmers do not want to participate in government
programs.
Trends in DMC Payments to Dairy Farmers
USDA paid out about $2.7 billion more to dairy farmers participating in the DMC program than it collected in premiums from 2019 through 2024.[15] About 45 percent of this $2.7 billion went to dairy farmers operating smaller dairy farms and about 55 percent to dairy farmers operating larger dairy farms. Net payments have varied widely by year, in line with variations in milk and feed prices (see fig. 5).
Figure 5: Net Payments to Dairy Farmers Participating in the U.S. Department of Agriculture (USDA) Dairy Margin Coverage (DMC) Program by Dairy Farm Size, 2019–2024
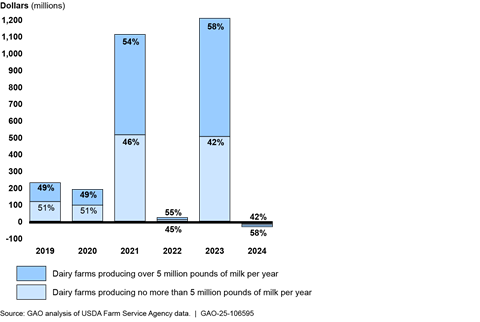
Note: Net payments are gross payments to dairy farmers minus the premiums that farmers paid. In 2024, dairy farmers paid more in premiums than they received in payments. In July 2025, the law establishing the program was amended so that the pricing schedule differentiates between the first 6 million pounds of production and higher amounts beginning in 2026.
From 2019 through 2024, dairy farmers received an average of $9.51 each year in
payments for every $1 spent on premiums, according to our analysis of DMC
premium and payment data. Specifically, dairy farmers operating smaller dairy
farms received an average of $9.18 each year in net payments for every dollar
they spent on premiums, and dairy farmers operating larger dairy farms received
$9.80 for every dollar spent on premiums. The amount that dairy farmers
received per dollar of premium varied from year to year, from a high of $21.22
in 2023 to a low of $0.66 in 2024. See appendix IV for additional information
about the program costs to dairy farmers at various milk production and
coverage levels.
Benefits of Program Participation Cited by Farmer Groups
Price risk reduction. Most dairy farmer groups said that the DMC program is valuable because it allows dairy farmers to reduce price risks associated with dairy production. Some dairy farmer groups provided examples of dairy farmers, particularly those operating smaller dairy farms, who would otherwise have shut down production due to fluctuating milk and feed prices.
Availability of low-cost coverage. Most dairy farmer groups noted that the price for catastrophic coverage was only the $100 administrative fee, which encourages dairy farmers to participate in the program. They noted that the program particularly helps small farmers due to the relatively low cost of tier 1 coverage. Some farmer groups also highlighted state reimbursement of premiums as incentivizing dairy farmers to participate. For example, according to state officials, the government of the State of Vermont reimbursed 427 dairy farmers in 2022 and 409 dairy farmers in 2023 for their DMC program tier 1 premiums.[16] These reimbursements totaled $2.9 million.
Dairy Farmer Groups Identified Challenges to DMC Participation, Including Program Awareness, but FSA Has Not Assessed Its Communication Efforts
Dairy farmer groups we interviewed identified four main challenges to DMC program participation. These were limits on the amount of milk covered, the cost of buy-up coverage, margin calculations that may not reflect dairy farmers’ actual operating costs, and program awareness. Because the amount of milk covered, cost of buy-up coverage, and calculation of margin are set in statute, FSA is limited in what actions it can take to address these challenges, but it has taken steps to improve its communication about the program. However, it has not assessed the effectiveness of its communication efforts in facilitating dairy farmer awareness of and participation in the program.
Limits on Amount of Milk Covered by DMC
Dairy farmer groups noted that the amount of milk for which dairy farmers can receive coverage under the DMC program is based on their established production history. Due to increases in milk production per cow or increases in a dairy farmer’s herd size, the farmers established milk production history may not reflect their current milk production. This could limit the extent of their participation since some of the milk they produce will not qualify for DMC. For example, when the program began in 2019, the established production history for most dairy farms for 2019 was based on their highest milk production in 2011, 2012, and 2013, as provided in statute. Current production may exceed historic production even if dairy farmers maintain the same herd size because of trends toward increased milk production per cow. According to USDA, the amount of milk produced per cow increased from 18,759 pounds in 2003 to 24,178 in 2024, an increase of about 29 percent. Since the inception of the DMC program in 2019, the amount of milk produced per cow has increased over 3 percent from 23,401 pounds in 2019 to 24,178 in 2024.
FSA officials noted that the rules for establishing
historic milk production are set in statute,[17]
and Congress has periodically acted to allow dairy farmers to adjust their
established milk production history. For example, in 2024, Congress passed an
extension of farm bill programs that necessitated changes to the regulations.
FSA revised the regulations for the DMC program to allow eligible dairy farmers
to make an adjustment to their established milk production history.[18] In July 2025, Congress further
modified the program, establishing that the production history will be equal
the highest annual milk production during 2021, 2022, or 2023 beginning in
program year 2026.
Cost of Buy-up Coverage
Groups representing both smaller and larger dairy farmers had concerns about the pricing structure of the DMC program as a challenge to participation. Some dairy farmer groups noted that smaller dairy farms paid the same premium for the first 5 million pounds of milk produced as larger dairy farms. These groups said that smaller farms run on such small profit margins that affording buy-up coverage under tier 1 could be harder for them than for larger dairy farms.[19] FSA is not able to modify the amount of milk that qualifies for tier 1 pricing under the DMC program because Congress sets that amount. However, FSA developed a web-based decision tool to help dairy farmers determine the most beneficial amount of buy-up coverage. After our interviews, the law establishing the program was amended to raise the tier 1 coverage cap from 5 million pounds of milk produced per year to 6 million pounds of milk. According to FSA officials, these changes will be effective beginning in 2026.
In addition, some dairy farmer groups we interviewed told us that the 5-million-pound cap on tier 1 pricing may have discouraged some farmers operating smaller dairy farms from expanding their dairy herds. The farmers would not have been able to cover their extra production from expansion under the DMC program. These groups said that the current cap, which will be raised beginning in 2026, does not reflect market changes such as increased average herd size and increased milk production per cow, and therefore does not reflect the current milk production from small farms. (See app. I more for information on these market changes.) According to one dairy farmer group, most farmers operating larger dairy farms did not select buy-up coverage under tier 2 for production over the first 5 million pounds of milk because they believe it is very expensive compared with buy-up coverage for tier 1. Dairy farmers may choose to cover some of their risks through other USDA programs. See appendix III for additional information.
DMC Margin Calculations
Statutes authorizing the DMC program direct the use of a national price for milk (all-milk price) and feed to calculate the margin for the program.[20] Some dairy farmer groups we interviewed said that the nationally calculated margin that is the basis for payments may not reflect farmers’ actual margins. Because of this, some farmers may choose not to participate, according to these groups.
In 2021, FSA adjusted how national feed prices are calculated for the DMC program to reflect changes in feed mixes used by dairy farmers to include a greater percentage of premium alfalfa hay that dairy farmers are most likely to use. Specifically, FSA amended the DMC regulations for calculating the national feed cost price to use premium alfalfa hay rather than blended alfalfa hay to determine the national average margin for each month.[21] According to FSA officials, agency analysis showed that the prior DMC feed cost formula did not adequately capture the costs experienced by dairy farmers.
However, most of the dairy farmer groups we interviewed said that the nationally calculated margin may not account for price variations for dairy farmers in different regions. For example, in February 2025, the “all milk” price was $23.60 per hundred pounds, but state prices varied from a high of $27.10 in Georgia and Virginia to a low of $21.60 in New Mexico.[22] Furthermore, according to the dairy farmer groups, the actual margin faced by organic dairy farmers may differ from the margin experienced by conventional dairy farmers in the same region because of differences in prices of organic feed compared with conventional feed.[23]
Some farmer groups said that Congress could allow FSA to calculate regional margins for dairy farmers to better reflect differences in regional prices of feed or milk. In addition, some dairy farmer groups said that Congress could allow FSA to calculate margins for organic milk separately for dairy farmers who produce organic milk to account for the differences in the margin between feed costs and milk prices between organic and conventional dairy farmers. However, as noted above, the law ties the margin in the DMC program to a calculated national price.[24]
Program Awareness
Some dairy farmer groups told us that program awareness issues posed challenges to participation even though FSA officials told us they have taken steps at the national and local level to better communicate with farmers about the program. At the national level, in 2019 and 2022, FSA held national webinars for dairy farmers explaining how the DMC program works. In 2024, FSA purchased targeted online ads for dairy farmers nationwide. Agency officials said they have not finished analyzing data on how many farmers viewed these ads or determined their effect. FSA tracks its communication efforts through an electronic system in which state officials report their outreach activities, such as FSA presence at a convention and number of attendees at the event. FSA’s Outreach Office provided us with tracking documentation of such outreach efforts for FSA programs, including DMC.
FSA state officials we interviewed from all six state FSA offices included in our review said they have taken steps to better communicate about the program to increase program awareness and reduce barriers to access.[25] For example, FSA officials said they have conducted training for FSA staff in county offices on the DMC program to increase their knowledge of the program so they may better communicate with farmers about the program benefits and how to enroll. In addition, FSA state and county officials said they have attended dairy farmer group conferences and workshops to educate dairy farmers about the DMC program; information about outreach at such event was included in the tracking documentation FSA provided to us. For example, the documentation includes attendance information. FSA state offices said they also provide newsletters and emails to farmers about various USDA programs, and they gave us examples of these newsletters and emails, which covered a broad number of programs.
Even with these efforts by FSA, some farmer groups said that some farmers do not have enough awareness about the DMC program to make informed decisions about participation. For example, some dairy farmer groups said that some dairy farmers, such as beginning dairy farmers, have had difficulty obtaining information about DMC program benefits or assistance in enrolling. Some dairy farmer groups said that not all local FSA offices have staff that are knowledgeable about the DMC program, and farmers may have to travel to more distant FSA offices for assistance. Furthermore, some farmer groups said it was difficult to keep up with DMC enrollment deadlines. These deadlines have varied from year to year for reasons including delays in appropriations for the program for 2024 and 2025. In 2019, 2022, and 2023, FSA extended deadlines to encourage more participation in the face of lower-than-expected enrollments.
In addition, some dairy farmer groups said that FSA does not effectively use targeted communications. For example, farmers cannot opt to receive information specifically about dairy programs from social media such as Instagram or X, which could enable farmers to learn in real time about changes in the program, such as changes in enrollment deadlines. In addition, FSA newsletters are not specific to dairy programs. These dairy farmer groups said that historically underserved farmers, such as beginning dairy farmers or veteran farmers, would benefit from more targeted information than is currently provided.
Similarly, some FSA officials said that different groups of dairy farmers may have different communication needs. For example, some FSA officials said that some underserved dairy farmers, such as beginning dairy farmers, may prefer more communication through social media to learn about program deadlines and benefits, and some would prefer more targeted texts or emails that farmers could opt to receive. Other dairy farmers do not use social media at all and would need to be contacted directly by mail, in person, or through other means such as community and religious leaders. However, FSA stated that addressing specific critiques that farmer groups raised to us about communications would be impracticable due to the limitations of social media and newsletter platforms currently available to the agency.
USDA’s strategic plan for fiscal years 2022–2026 includes objectives relevant to the DMC program. For example, it includes an objective for fostering sustainable economic growth by providing a strong safety net for America’s farmers and ranchers.[26] One of the ways USDA plans to meet this objective is by using targeted analysis to identify strategies for maintaining and enhancing high-quality implementation of major FSA programs, including the DMC program. In addition, USDA’s strategic plan includes an objective to expand opportunities for economic development in rural communities and lists a priority of reducing barriers to access for underserved communities.
Under federal standards for internal control, management should externally communicate the necessary quality information to achieve the entity’s objectives.[27] As part of this, management should select appropriate methods to communicate externally. Additionally, management should periodically evaluate the entity’s methods of communication so that the organization has the appropriate tools to communicate quality information throughout and outside of the entity on a timely basis.
FSA has various forms of communication in place, and FSA officials said the agency is planning to refine its monitoring of communication methods. However, it has not assessed the effectiveness of its communication methods in facilitating dairy farmer awareness of and participation in the program. In particular, the agency has not developed performance metrics to measure results against intended outcomes—such as progress toward providing a safety net for farmers and reducing barriers to participation for underserved dairy farmers.
FSA officials in the Outreach Office told us that it would be beneficial to have metrics that could help the agency assess its communication methods and identify those that are most helpful to dairy farmers. By developing metrics—such as changes in participation rates among underserved dairy farmers—to assess the effectiveness of its communication methods for the DMC program. By doing so, FSA might better ensure it is helping dairy farmers make informed decisions about participating in the DMC program, potentially helping them stay in business. FSA could use the results of its assessment to adjust its communication efforts, if necessary.
Conclusions
The DMC program offers dairy farmers a way to manage certain price risks, helping to keep them in business. Farmers who participated in the program generally received more than $9 in payments from USDA for every $1 of premiums they paid over the last 6 years. Participation rates in the program have varied, and some dairy farmer groups and USDA officials have noted challenges to participation, including challenges related to program awareness. FSA has taken steps to improve its communication about the program, but it has not assessed the effectiveness of its communication efforts in facilitating dairy farmer awareness of and participation in the program. For example, FSA does not have metrics to measure how these steps affect progress toward USDA strategic objectives of providing a safety net to farmers and reducing access barriers for underserved communities. By assessing the effectiveness of its communication methods, FSA could better ensure dairy farmers who might benefit from the program’s safety net are aware of the program and have the relevant information to participate if they choose.
Recommendation for Executive Action
The Secretary of Agriculture should direct FSA to assess the effectiveness of its methods for communicating with dairy farmers about the DMC program. This effort should include developing performance metrics, such as changes in participation rates by veteran and beginning farmers, that could be used to measure progress toward agency objectives. (Recommendation 1)
Agency Comments and Our Evaluation
We provided a draft of this report to USDA for review and comment. FSA responded on behalf of USDA. In its comments, reproduced in appendix V, FSA generally disagreed with our recommendation as well as our findings related to FSA communications to promote program awareness.
With its comments, FSA provided tracking documents that it uses to assess its outreach activities. We have modified our draft to acknowledge that FSA provided these documents. However, we previously examined them during our review and concluded that they do not measure progress toward USDA strategic objectives. The tracking documents focus on counting activities such as attendance at events rather than measuring results of those activities in terms of intended objectives, such as progress toward providing a safety net for farmers and reducing barriers to participation. Moreover, many of these documents are not specific to DMC. We maintain that FSA should implement our recommendation.
We are sending copies of this report to the appropriate congressional committees, the Secretary of Agriculture, and other interested parties. In addition, the report is available at no charge on the GAO website at https://www.gao.gov. If you or your staff have any questions about this report, please contact me at morriss@gao.gov. Contact points for our Offices of Congressional Relations and Public Affairs may be found on the last page of this report. GAO staff who made key contributions to this report are listed in appendix V.

Steve D. Morris
Director, Natural Resources and Environment
Appendix I: Trends in the Number of Dairy Farms, Milk Production, Dairy Cows, and Dairy Cows by Herd Size
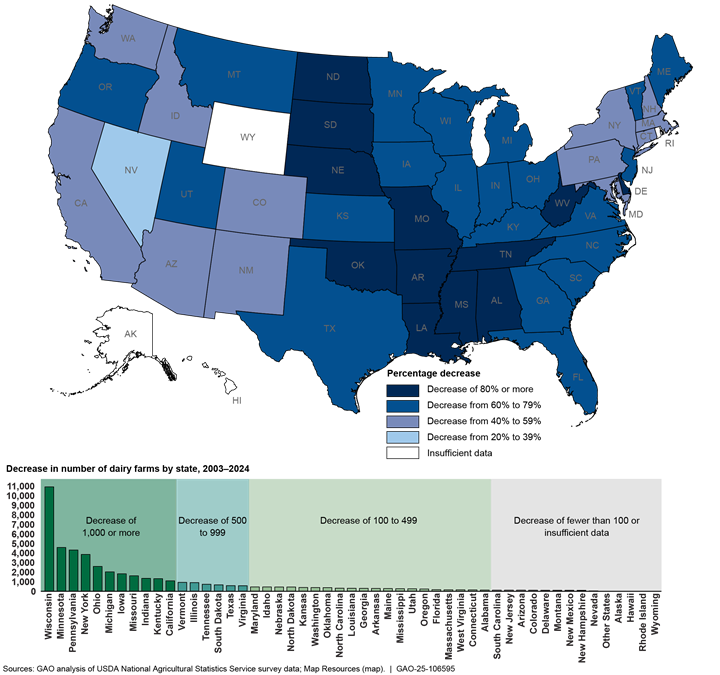
The dairy industry has changed significantly over the past several decades like other U.S. agricultural industries, such as farms that grow row crops. One major change has been consolidation—a shift to fewer and larger dairy farms. During 2003 through 2024, the number of dairy farms decreased from 70,375 to 24,811, a decline of about 65 percent, according to our analysis of U.S. Department of Agriculture (USDA) survey data on the number of total dairy farms in the U.S. This trend has accelerated in recent years: for 2019 through 2024, the U.S. lost an average of 6.6 percent of dairy farms each year, compared with an average annual decrease of 4.1 percent from 2003 through 2018.
Furthermore, some states have experienced a greater decrease in dairy farms than others. The five states with the largest decrease in dairy farms from 2003 through 2024 were Wisconsin, Minnesota, Pennsylvania, New York, and Ohio (see fig. 6).
While the number of dairy farms has decreased, the total number of dairy cows has changed little, and the amount of milk produced in the U.S. has substantially increased. Specifically, according to USDA Census of Agriculture data, the total number of dairy cows in the U.S. changed from 9.1 million in 1997 to 9.3 million in 2022, an increase of about 2 percent.[28] In addition, the total amount of milk produced by dairy farms each year in the U.S. increased from around 170 million pounds in 2003 to about 226 million pounds in 2024, an increase of about 33 percent, according to USDA survey data on milk production. In addition, the amount of milk produced per cow has increased from 18,759 pounds in 2003 to 24,178 in 2024, an increase of about 32 percent.[29]
Furthermore, the percentage of total U.S. dairy cows on farms with relatively larger herds has increased, as shown in figure 7. Specifically, according to USDA Census of Agriculture data, the percentage of all U.S. dairy cows on farms with a herd size of over 1,000 dairy cows increased from 17 percent (1.6 million out of 9.1 million total dairy cows) in 1997 to 65 percent (6 million out of 9.3 million total dairy cows) in 2022, the latest year for which such data are available. Conversely, the percentage of all U.S. dairy cows on farms with a herd size under 200 shrank from 57 percent (5.2 million out of 9.1 million total dairy cows) in 1997 to about 13 percent (1.2 million out of 9.3 million total dairy cows) in 2022.
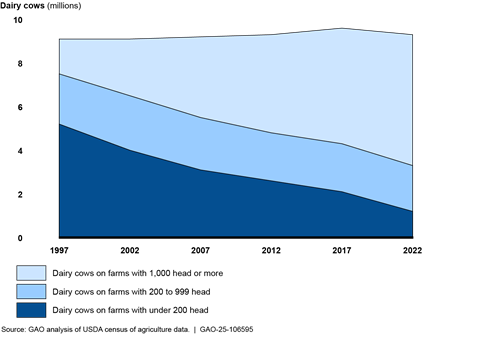
Note: USDA’s Census of Agriculture is taken every 5 years. Calendar year 2022 was the latest for which this information was available.
Dairy farmer groups attributed these changes to several factors. In particular,
they noted that (1) economies of scale favor larger dairy farms; (2) milk
prices and profits have declined over time; and (3) as the dairy farmer
population ages, few new entrants are interested in taking over the dairy
farms.
The objectives of this report were to examine (1) Dairy Margin Coverage (DMC) program participation, payments, and benefits and (2) challenges to program participation and steps Farm Service Agency (FSA) has taken to address these challenges. In addition, appendix I provides information on trends in the number of dairy farms, milk production, and size of dairy farms in the U.S. from 2003 through 2024.
To examine DMC program participation, payments, and benefits, we obtained and analyzed FSA participation and payment data for 2019 through 2024. We obtained selected data from FSA’s DMA administrative database including (1) dairy operation number (an FSA assigned number identifying the dairy operation), (2) state where the dairy operation is located, (3) producer core customer identification numbers (identifies the owner or owners), (4) Tier 1 coverage level elected, (5) Tier 2 coverage level elected, (6) premiums paid by dairy producer aggregated by year, (7) supplemental premium paid aggregated by year, and (8) payments and supplemental payments to dairy operations aggregated by year, among other things. To assess the reliability of these data, we reviewed related documentation including metadata, data maps, policy manuals. We also interviewed key data owners and users and asked them about data reliability steps the agency has taken and any known data quality issues and steps taken to address them and conducted electronic data testing. We determined the data we analyzed were sufficiently reliable for determining trends in DMC participation, DMC payments, number of dairy farms participating in the DMC program.
To identify benefits of the program, we interviewed stakeholders, including eight groups that represent dairy farmers, to obtain their views. We selected these groups based on variation in geographic dispersion, representation of conventional and organic dairy farmers, and representation of both smaller and larger dairy farms.[30] Membership in these groups in 2024 ranged from 38 dairy farmers to over 220,000 farmers and ranchers, including members who are also dairy farmers. We conducted semistructured interviews with each of these groups to ensure we consistently captured their views. We then analyzed the results of these interviews and related documents to identify the main themes. To characterize the views of the groups, we defined modifiers as follows: “all” represents 8, “most” represents 5 to 7 of the groups, and “some” represents 1 to 4 of them. The views of these groups are not generalizable to all dairy farmer groups or dairy farmers, but they illustrate a range of views regarding the DMC program.
To identify challenges to program participation, we used the same dairy farmer groups, interviews, and analytical approach described above. To examine steps FSA has taken to address identified challenges, we interviewed and obtained documents from FSA program staff in headquarters, Kansas City, and six state FSA offices: New York, Wisconsin, California, Kansas, Maine, and Vermont. We selected these state offices based on variation in geographic dispersion and dairy production. Headquarters staff are responsible for program development and oversight, Kansas City staff are responsible for maintaining program data, and FSA state office staff are responsible for program implementation. Documents we obtained from these state office staff included reports on communication efforts, and examples of communication efforts such as newsletters state FSA offices sent to dairy farmers. We compared FSA communication methods with goals in U.S. Department of Agriculture’s (USDA) strategic plan and federal standards for internal control for external communication.[31]
To determine trends in the number of dairy farms each year and annual milk production from 2003 through 2024, we obtained and analyzed data from USDA’s Milk Production Survey on numbers of dairy farms per state and annual milk production from 2003 through 2024. We selected 2003 through 2024 because that represented more than 2 decades of available data from USDA’s Milk Production Survey. The Milk Production Survey collects data for the number of all milk cows in the herd, number of cows milked on the first day of the survey month, and total milk produced on the first day of the survey month. To determine the number dairy cows in the U.S. and the distribution of dairy cows on farms of various sizes, we used data from the USDA’s Census of Agriculture for census years 1997, 2002, 2007, 2012, 2017 and 2022. USDA conducts the Census of Agriculture every 5 years, providing a detailed picture of farms and the people who operate them.[32] To determine the reliability of these data for our purposes, we reviewed agency documentation and a National Academy of Sciences review.[33] We also interviewed USDA staff who maintain or use the data. We determined the data were sufficiently reliable to determine the number of dairy farms, dairy cows, and milk production.
As part of our analysis, we used USDA data to identify dairy farmers who also participated in USDA Federal Crop Insurance plans, the Risk Management Agency’s (RMA) Dairy Revenue Protection and Livestock Gross Margin Insurance Plan for Dairy Cattle. To identify dairy farmers that participated in both FSA’s DMC program and the Risk Management Agency’s plans, we compared tax ID and core customer identification numbers for participants in both programs. We obtained information on dairy farmer participation in Risk Management Agency programs from a concurrent review of USDA programs that also included dairy farms. [34] We determined the various data we analyzed were sufficiently reliable for determining trends in DMC participation, DMC payments, number of dairy farms participating in both the DMC program and related RMA programs.[35]
We conducted this performance audit from February 2023 through July 2025 in accordance with generally accepted government auditing standards. Those standards require that we plan and perform the audit to obtain sufficient, appropriate evidence to provide a reasonable basis for our findings and conclusions based on our audit objectives. We believe that the evidence obtained provides a reasonable basis for our findings and conclusions based on our audit objectives.
Dairy farmers who participate in the Dairy Margin Coverage (DMC) program are also eligible to participate in two other U.S. Department of Agriculture (USDA) Federal Crop Insurance plans that help dairy farmers mitigate risks: (1) Dairy Revenue Protection and (2) Livestock Gross Margin Insurance for Dairy Cattle.
The USDA’s Risk Management Agency administers both plans, which partners with private insurance companies that deliver (i.e., sell and service) insurance policies to farmers under the plans. Farmers may purchase the insurance through authorized crop insurance agents, and USDA subsidizes the premiums.
Farmers cannot enroll the same milk production under both plans at once, but they can cover the same milk production under the DMC program. As of 2023, about 28 percent of larger dairy farms participating in the DMC program also participated in one of the two insurance plans, and about 3 percent of smaller farms did so, according to our analysis of USDA data.[36]
Dairy Revenue Protection. This plan is designed to insure against an unexpected decline in revenue on the milk produced from dairy cows. The plan covers the difference between a farmer’s guaranteed expected revenue and actual milk revenue during each quarter of the year. The guaranteed expected revenue is based on (1) futures prices for milk and dairy commodities and (2) the amount of covered milk production elected by the dairy farmer. The premium subsidy that USDA pays for a farmer range from 44 percent to 55 percent of a policy’s total premium, depending on the level of coverage that the farmer selects. The farmer pays the rest of the premium. Dairy Revenue Protection does not have an annual limit on the amount of production that a farmer can insure.
Livestock Gross Margin Insurance for Dairy Cattle. This plan provides protection when feed costs rise or milk prices drop, and it can be tailored to any size dairy farm. Gross margin is the market value of milk minus feed costs. This plan uses futures prices for corn, soybean meal, and milk to determine the expected gross margin and the actual gross margin. The premium subsidy that USDA pays for a farmer range from 18 percent to 50 percent. Livestock Gross Margin Insurance for Dairy Cattle does not have an annual limit on the amount of production that a farmer can insure.
For the two insurance plans, table 1 below shows average annual total net payments to participating farmers, net payments per policy, and the payment for every $1 spent on premiums from 2020 through 2023.[37]
Table 1: Dairy Revenue Protection and Livestock Gross Margin for Dairy Cattle Payments to Dairy Farms, 2020–2023
|
Program |
Average annual net payment |
Average annual number of policies |
Net payment per policy |
Payment per $1 of farmer premium |
|
Dairy Revenue Protection |
$173,709,002 |
2,825 |
$61,501 |
$1.79 |
|
Livestock Gross Margin Insurance Plan for Dairy Cattle |
$9,971,670 |
228 |
$43,735 |
$2.21 |
Source: GAO analysis of U.S. Department of Agriculture (USDA) data. | GAO‑25‑106595
Note: Net payments are payments to participating dairy farmers less program premiums paid by the dairy farmers.
Appendix IV: USDA Dairy Margin Coverage Cost to Farmers at Various Milk Production and Coverage Levels
Under the U.S. Department of Agriculture’s (USDA) Dairy Margin Coverage (DMC) program, catastrophic coverage ($4.00 margin) is included at no additional cost beyond the administrative fee, if any. Buy-up coverage is available under a two-tier pricing schedule that depends on the amount of milk production and the margin covered.
· Participating dairy farmers may purchase buy-up coverage under the tier 1 pricing schedule for the first 5 million pounds of milk produced per year, based on historic production amounts. Buy-up coverage is available up to a $9.50 margin under the tier 1 pricing schedule.
· The tier 2 pricing schedule is for milk produced over the first 5 million pounds per year, based on historic production amounts. Tier 2 pricing is higher than tier 1 pricing for margins starting at $5.50, and tier 2 allows coverage up to an $8.00 margin.
Table 2 provides examples of premiums that hypothetical farms would have paid and net payments they would have received under different scenarios based on historical milk and feed prices for 2019 through 2024.
Table 2: USDA Dairy Margin Coverage Program Annual Premiums and Cumulative Net Payments for Hypothetical Smaller and Larger Dairy Farms, 2019–2024
|
Hypothetical smaller dairy farm (5 million pounds) |
Hypothetical larger dairy farm |
|||||
|
|
||||||
|
Scenario 1 |
Scenario 2 |
Scenario 3 |
Scenario 4 |
Scenario 5 |
Scenario 6 |
|
|
Tier 1 coverage |
$4.00 |
$9.50 |
$4.00 |
$9.50 |
$9.50 |
$9.50 |
|
Tier 2 coverage |
—a |
—a |
$4.00 |
$4.00 |
$5.00 |
$6.00 |
|
Average payment per $1 premium paid |
—b |
$9.44 |
—b |
$9.67 |
$9.41 |
$1.40 |
|
Cumulative net payment |
$3,262 |
$299,334 |
$16,308 |
$327,963 |
$356,905 |
$140,992 |
Source: GAO analysis of U.S. Department of Agriculture (USDA) data. | GAO‑25‑106595
aDairy farms producing no more than 5 million pounds of milk per year (smaller farms) would only purchase coverage under DMC tier 1 prices. Dairy farms producing over 5 million pounds (larger farms) could enroll the first 5 million pounds under tier 1 prices and the remaining production under tier 2 prices. The law establishing the program has since been amended to set that pricing schedule to differentiate between the first 6 million pounds of production and higher amounts. According to Farm Service Agency officials these changes will be effective beginning in 2026. Pub. L. No. 119-21, § 10313(b).
bAverage payment per $1 premium paid was not calculated because there is no premium at the $4.00 coverage level for tier 1 or tier 2 coverage.
Generally, dairy farmers could maximize net payments by purchasing the greatest amount of buy-up coverage for the first 5 million pounds. For milk production over 5 million pounds, farmers could generally maximize net payments by taking catastrophic level coverage ($4.00) or purchasing buy-up coverage below the maximum level in tier 2.
· According to our analysis, a dairy farmer operating a smaller dairy farm with an annual milk production of 5 million pounds would have maximized total net payments received by purchasing tier 1 margin coverage of $9.50, as shown under scenario 2. The farmer would have received a total net payment (payments less premiums paid) of almost $300,000 for 2019 through 2024. For each $1 of premiums paid, the farmer would have received an average of $9.44 in payments.
· A dairy farmer operating a larger dairy farm with an annual milk production of 25 million pounds and tier 1 margin coverage of $9.50 and tier 2 margin coverage of $4.00 would have received total net payments of almost $328,000 for 2019 through 2024, as shown under scenario 4. For each $1 of premiums paid, the farmer would have received an average of $9.67 in payments—the maximum return per dollar spent on premiums, according to our analysis.
· However, the same dairy farmer would have maximized total net payments received by purchasing buy up coverage for a tier 1 margin coverage of $9.50 and tier 2 margin coverage of $5.00, resulting in total net payments of almost $357,000, as shown under scenario 5.
· If the same dairy farmer increased tier 2 coverage to $6.00, total net payments would decrease to about $141,000 for the same time frame. The farmer’s average payment received per $1 premium paid would also decrease to about $1.40 because of the relatively higher premium costs for tier 2 coverage above the $5.00 margin.
Appendix V: Agency Comments
GAO Contact
If you or your staff have questions about this report, please contact Steve D. Morris, Director, Natural Resources and Environment at MorrisS@gao.gov. Contact points for our Offices of Congressional Relations and Public Affairs may be found on the last page of this report.
Staff Acknowledgments
In addition to the contact named above, Thomas M. Cook (Assistant Director), Nkenge Gibson (Assistant Director) David Bennett (Analyst in Charge), Kevin Bray, Gary Brown, Kelly Butler, Lijia Guo, Scott Hiromoto, Michael Kendix (in memoriam), Jordan Kudrna, Emily O’Brien, Frank Garro, Cynthia Norris, Patricia Powell, Sara Sullivan, Jack Wang, and Zachary Stickelman made key contributions to this report.
The Government Accountability Office, the audit, evaluation, and investigative arm of Congress, exists to support Congress in meeting its constitutional responsibilities and to help improve the performance and accountability of the federal government for the American people. GAO examines the use of public funds; evaluates federal programs and policies; and provides analyses, recommendations, and other assistance to help Congress make informed oversight, policy, and funding decisions. GAO’s commitment to good government is reflected in its core values of accountability, integrity, and reliability.
Obtaining Copies of GAO Reports and Testimony
The fastest and easiest way to obtain copies of GAO documents at no cost is through our website. Each weekday afternoon, GAO posts on its website newly released reports, testimony, and correspondence. You can also subscribe to GAO’s email updates to receive notification of newly posted products.
Order by Phone
The price of each GAO publication reflects GAO’s actual cost of production and distribution and depends on the number of pages in the publication and whether the publication is printed in color or black and white. Pricing and ordering information is posted on GAO’s website, https://www.gao.gov/ordering.htm.
Place orders by calling (202) 512-6000, toll free (866) 801-7077,
or
TDD (202) 512-2537.
Orders may be paid for using American Express, Discover Card, MasterCard, Visa, check, or money order. Call for additional information.
Connect with GAO
Connect with GAO on X,
LinkedIn, Instagram, and YouTube.
Subscribe to our Email Updates. Listen to our Podcasts.
Visit GAO on the web at https://www.gao.gov.
To Report Fraud, Waste, and Abuse in Federal Programs
Contact FraudNet:
Website: https://www.gao.gov/about/what-gao-does/fraudnet
Automated answering system: (800) 424-5454
Media Relations
Sarah Kaczmarek, Managing Director, Media@gao.gov
Congressional Relations
A. Nicole Clowers, Managing Director, CongRel@gao.gov
General Inquiries
[1]For this report, dairy farmers are farmers who raise cows to produce milk for sale for human consumption or to be processed into dairy products such as cheese or yogurt that are then sold for human consumption.
[2]The Agriculture Improvement Act of 2018, Pub. L. No. 115-334, § 1401, 132 Stat. 4490, 4511 (amending 7 U.S.C. §§ 9052-9060) (2018 Farm Bill). The relevant provisions of the 2018 Farm Bill were scheduled to expire on December 31, 2023, but in November 2023, Congress enacted a 1-year extension that continued authorization through December 31, 2024. Pub. L. No. 118-22, § 102(c)(2)(B)(i), 137 Stat. 112, 115 (amending 7 U.S.C. § 9059). In December 2024, the authorization was further extended through December 31, 2025. Pub. L. No. 118-158, § 4101(c)(4)(A)(i) (amending 7 U.S.C. § 9059). In July 2025, Congress again extended authorization, this time through 2031. Pub. L. No. 119-21, § 10313(d), 139 Stat. 72, 100 (2025).
[3]Senator Gillibrand made this request in her capacity as then-Chair of the Committee on Agriculture, Nutrition, and Forestry, Subcommittee on Livestock, Dairy, Poultry, Local Food Systems, and Food Safety and Security.
[4]For this report, we refer to dairy farms that produce no more than 5 million pounds of milk per year as smaller dairy farms and farms that produce over 5 million pounds of milk annually as larger dairy farms. We selected these amounts because the DMC program has a two-tier pricing schedule that differentiates between the first 5 million pounds of production and higher amounts. In July 2025, the law establishing the program was amended to raise tier 1 coverage to 6 million pounds of milk produced per year. According to FSA officials, these changes will be effective in 2026. Pub. L. No. 119-21, § 10313(b).
[5]U.S. Department of Agriculture, Strategic Plan Fiscal Years 2022–2026 (Washington, D.C.: March 2022) and GAO, Standards for Internal Control in the Federal Government, GAO‑14‑704G (Washington, D.C.: Sept. 10, 2014).
[6]Each state has a state-level FSA office. In addition, each state has county-level FSA offices, the number of which differs by state. Further, one county office may service multiple counties. Certain USDA farm program benefits are not available to farmers with incomes that exceed a statutory limit (i.e., a 3-year average adjusted gross income of $900,000 or more). The DMC program does not have such an income limit.
[7]Statutes provide historically underserved farmers with an exemption to the administrative fee under the DMC program. The exemption is available to farming operation members who belong to groups such as beginning farmers, limited-resource farmers, and military veterans.
[8]USDA Economic Research Service, Changing Structure, Financial Risks, and Government Policy for the U.S. Dairy Industry (Washington, D.C.: March 2016).
[9]USDA Economic Research Service, Structure, Costs and Technology Used on U.S. Dairy Farms (Washington, D.C.: July 2024).
[10]According to USDA’s Milk Production Report for January 2025, the average production per cow in the U.S. in 2024 was about 24,184 pounds. The amount of milk produced per cow depends on various factors including the breed of cow or feed used.
[11]Net payments are gross payments to dairy farmers minus the premiums that farmers paid for coverage.
[12]Data on the total number of dairy farms in the U.S. come from USDA’s Milk Production Report. This report contains survey data on, among other things, the number of milk cows, production per cow, total milk production for all states and the U.S., and the number of dairy herds (dairy farms) for all states and the U.S.
[13]According to FSA officials, DMC participation declined in 2025, possibly due to FSA’s projections of low net payments compared with previous years.
[14]Fiscal year 2023 data were the latest available on Farm Crop Insurance Plans at the time of our analysis.
[15]According to a January 2025 Congressional Budget Office report, DMC program net spending is projected to total about $838 million from fiscal years 2025 through 2035.
[16]In addition to Vermont, we identified at least four other states that had, or have proposed similar financial assistance programs related to DMC participation—Maryland, Minnesota, Virginia, and Pennsylvania. Maryland’s program, which reimbursed dairy farmers for tier 1 premiums at the $9.50 margin, ran from 2019 through 2022. Minnesota’s program, which provides a rebate for tier 1 premiums, started in 2019 and continued through 2024. Virginia’s program started in 2022 and continued through 2024, and it also reimburses dairy farmers for tier 1 premium payments.
[17]7 U.S.C. § 9055(a).
[18]Pub. L. No. 118-22, § 102(c)(2)(A)(ii), 137 Stat. 112, 115 (adding 7 U.S.C. § 9055(a)(4)).
[19]A USDA study found that the cost to produce milk was higher for dairy farmers with smaller dairy farms than larger dairy farms. USDA Economic Research Service, Changing Structure, Financial Risks, and Government Polity for the U.S. Dairy Industry (Washington, D.C.: March 2016).
[20]7 U.S.C. § 9052(a). The all-milk price represents the average gross price dairy farmers received in the given month per hundred pounds of milk sold. USDA reports these data monthly in its Agricultural Prices report.
[21]86 Fed. Reg. 70689, 70708 (Dec. 13, 2021) (amending 7 C.F.R. § 1430.411(c)(3)).
[22]USDA, National Agricultural Statistics Service, Agricultural Prices, March 31, 2025.
[23]According to USDA’s Economic Research Service, in 2016 total production costs at organic dairy farms were noticeably higher than costs at conventional dairy farms. USDA Economic Research Service, Consolidation in U.S. Dairy Farming (Washington, D.C.: July 2020).
[24]7 U.S.C. § 9052(a).
[25]We interviewed and obtained documents from FSA program staff in six state FSA offices: New York, Wisconsin, California, Kansas, Maine, and Vermont. We selected these state offices based on variation in geographic dispersion and dairy production.
[26]U.S. Department of Agriculture, Strategic Plan Fiscal Years 2022–2026 (Washington, D.C.: March 2022).
[28]USDA conducts the Census of Agriculture every 5 years and provides a detailed picture of farms and the people who operate them. The 2022 Census of Agriculture was the most current version of this data source at the time of our review.
[29]USDA conducts the Milk Production Survey in all states in January, April, July, and October, collects data for the number of all milk cows in the herd, number of cows milked on the first day of the survey month, and total milk produced on the first day of the survey month.
[30]For this report, we refer to dairy farms that produce no more than 5 million pounds of milk per year as smaller dairy farms and farms that produce over 5 million pounds of milk annually as larger dairy farms. We selected these amounts because the DMC program has a two-tier pricing schedule that, at the time of our analysis, differentiated between the first 5 million pounds of production and higher amounts. The law establishing the program has since been amended to set that pricing schedule to differentiate between the first 6 million pounds of production and higher amounts. According to FSA officials these changes will be effective in 2026. Pub. L. No. 119-21, § 10313(b).
[31]U.S. Department of Agriculture, Strategic Plan Fiscal Years 2022–2026 (Washington, D.C.: March 2022) and GAO, Standards for Internal Control in the Federal Government, GAO‑14‑704G (Washington, D.C.: Sept. 10, 2014).
[32]The 2022 Census of Agriculture was the most current version of this data source at the time of our review.
[33]National Research Council, Panel to Review USDA’s Agricultural Resource Management Survey, Committee on National Statistics, Division of Behavioral Social Sciences and Education, Understanding American Agriculture: Challenges for the Agricultural Resources Management Survey (Washington, D.C.: The National Academies Press, 2008).
[34]To identify dairy farmers that participated in both FSA’s DMC program and other USDA Federal Crop Insurance plans such as the Risk Management Agency’s Dairy Revenue Protection and Livestock Gross Margin for Dairy Cattle, we compared tax ID and core customer identification numbers for participants in both programs. We obtained information on dairy farmer participation in Risk Management Agency programs from a concurrent review of USDA programs that also included dairy farms. See GAO, Department of Agriculture: Federal Subsidies for Livestock Feeding Operations, GAO‑25‑106347 (Washington, D.C.: Nov. 12, 2024).
[35]Our analysis may have undercounted the number of dairy farms participating in both RMA and DMC. Our analysis represents a conservative estimate because we obtained the core customer identification number of only the primary owner of each dairy farm enrolled in the DMC program from FSA. Some are co-owned by multiple farmers. We used the core customer identification number to match with RMA records.
[36]We did not obtain data on dairy farmers who participated in RMA programs but did not participate in the DMC program. For this report we refer to dairy farms that produce no more than 5 million pounds of milk per year as smaller dairy farms and farms that produce over 5 million pounds of milk annually as larger dairy farms. We selected these amounts because the DMC program has a two-tier pricing schedule, at the time of our analysis, that differentiated between the first 5 million pounds of production and higher amounts. The law establishing the program has since been amended to set that pricing schedule to differentiate between the first 6 million pounds of milk production and higher amounts. According to Farm Service Agency officials these changes will be effective in 2026.
[37]At the time of our analysis, 2024 data were not available.