PRIVATE HEALTH PLANS
Comparison of Employer-Sponsored Plans to Healthcare.gov Marketplace Plans
Report to the Chairwoman
Committee on Education and the Workforce
House of Representatives
November 2024
GAO-25-106798
United States Government Accountability Office
View GAO‑25‑106798. For more information, contact John E. Dicken at (202) 512-7114 or dickenj@gao.gov.
Highlights of GAO‑25‑106798, a report to the Chairwoman of the Committee on Education and the Workforce, House of Representatives
November 2024
PRIVATE HEALTH PLANS
Comparison of Employer-Sponsored Plans to Healthcare.gov Marketplace Plans
Why GAO Did This Study
Private health plan spending is projected to exceed $1.5 trillion in 2024. This has financial implications for enrollees, who pay for either all or part of their premiums; for employers who typically contribute to employees’ premiums costs; and for the federal government, which provides tax incentives and other financial support for Marketplace and employer-sponsored plans.
GAO was asked to compare employer-sponsored plans to Marketplace plans. In this report, GAO describes, among other objectives, how average employer-sponsored plan premiums compared to Marketplace plans; and how average cost sharing to consumers in employer-sponsored plans compared to that of Marketplace plans.
GAO reviewed Agency for Healthcare Research and Quality Medical Expenditure Panel Survey Insurance Component data on employer-sponsored plans and CMS Marketplace individual market plan data to estimate enrollment-weighted average premiums and cost sharing in 2022 in 33 states. These states were selected because they used the Healthcare.gov platform in 2022 (the most recent year of data available at the time of the review); thus, complete and comparable data were available for Marketplace plans across those states. Additionally, GAO interviewed officials from the Agency for Healthcare Research and Quality, CMS, the Department of the Treasury, and representatives from six stakeholder groups, such as those representing insurers and policy researchers, selected to reflect a range of expertise on the topics under review.
What GAO Found
Most Americans get their health coverage from private health plans. In 2023, about 165 million individuals got their health coverage from an employer plan and 16.3 million got their coverage from plans purchased through Marketplaces established through the 2010 Patient Protection and Affordable Care Act.
One of the costs for private health plans is the premium that needs to be paid for enrollment. GAO compared monthly premiums per covered individual for employer-sponsored and Marketplace plans using Agency for Healthcare Research and Quality survey data and Centers for Medicare & Medicaid Services’ (CMS) Marketplace data, respectively. GAO found that for the 33 states included in its review (those that used the Healthcare.gov platform), in 2022, the estimated average monthly premiums for employer-sponsored plans were lower than the average premiums for Marketplace plans. However, stakeholders noted that differences in covered populations, such as in health status, complicate comparability of premiums between these two types of plans. Additionally, after employer contributions to employee premiums and federal premium tax credits for Marketplace plans, the average estimated monthly enrollee contributions to premiums per covered individual for employer-sponsored plans were higher than the average enrollee contributions to premiums for Marketplace plans. Taxes complicate comparability because enrollee contributions to employer-sponsored plans do not reflect their cost after tax savings.
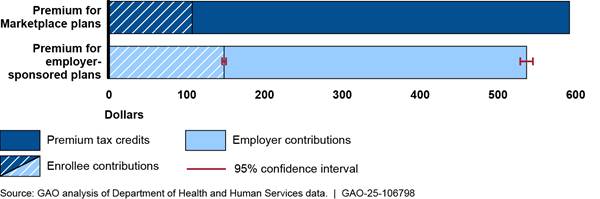
Note: Enrollee contributions to premiums for employer-sponsored health plans are made with pre-tax dollars, which results in tax savings for enrollees. Enrollee contributions to premiums for Marketplace plans are generally made with after-tax dollars.
Premiums for both employer-sponsored and Marketplace plans varied across the 33 states in 2022. In addition, for employer-sponsored plans, they varied by industry and for Marketplace plans they varied by tier of coverage.
GAO found that differences in plan designs complicated comparisons of cost sharing across plans. For example, in 2022, estimated average deductibles for employer-sponsored plans were lower than for Marketplace plans, but GAO estimated that a higher percentage of Marketplace plan enrollees were in plans with no deductible.
|
Abbreviations |
|
|
AHRQ |
Agency for Healthcare Research and Quality |
|
AV |
actuarial value |
|
CI |
confidence interval |
|
CMS |
Centers for Medicare & Medicaid Services |
|
CSR |
cost-sharing reduction |
|
HHS |
Department of Health and Human Services |
|
MEPS-IC |
Medical Expenditure Panel Survey Insurance Component |
|
PPACA |
Patient Protection and Affordable Care Act |
This is a work of the U.S. government and is not subject to copyright protection in the United States. The published product may be reproduced and distributed in its entirety without further permission from GAO. However, because this work may contain copyrighted images or other material, permission from the copyright holder may be necessary if you wish to reproduce this material separately.
November 27, 2024
The Honorable Virginia Foxx
Chairwoman
Committee on Education and the Workforce
House of Representatives
Dear Madam Chairwoman,
Most Americans get their health coverage from private health plans, including employer-sponsored plans and plans purchased on the individual market. In 2023, an estimated 165 million non-elderly individuals had coverage sponsored by employers and 16.3 million individuals were covered by plans purchased through health insurance exchanges—or Marketplaces—established through the Patient Protection and Affordable Care Act (PPACA).[1] According to national estimates from the Office of the Actuary at the Centers for Medicare & Medicaid Services (CMS), private health plan spending is projected to exceed $1.5 trillion in 2024. This spending has financial implications for (1) private health plan enrollees who pay for either all or part of their health plan premiums, (2) the many employers that sponsor plans and contribute to their employees’ premiums, and (3) the federal government, which provides different forms of federal financial support for both employer-sponsored and Marketplace plans, including through tax exclusions and tax credits. Because of this, there is interest in understanding how employer-sponsored and Marketplace plan premiums compare and who bears those costs. There is also interest in understanding how these plans compare in terms of the amounts plan enrollees are expected to pay for the services they use, which is referred to as cost sharing, as well as the benefits these plans cover.[2]
In addition to interest in comparing the costs and benefits of employer-sponsored and Marketplace plans, there is interest in understanding how changes in the financing for cost-sharing reductions (CSR) that insurers are required to offer to certain low-income Marketplace enrollees affected Marketplace enrollees. Initially, in 2014, the federal government reimbursed issuers for these CSRs. But beginning in 2018, the federal government stopped paying these reimbursements and the responsibility to fund them shifted to issuers.
You asked us to compare employer-sponsored plans to Marketplace plans. In this report, we describe
1. how average premiums of employer-sponsored plans compare to that of Marketplace plans;
2. how cost sharing and certain plan benefits offered in employer-sponsored plans compare to that of Marketplace plans; and
3. how the loss of federal payments for CSRs affected Marketplace enrollees.
To describe how the average premiums, cost sharing, and plan benefits of employer-sponsored plans compare to that of Marketplace plans, we used data from two units of the Department of Health and Human Services (HHS). For employer-sponsored plans, we used survey data from HHS’s Agency for Healthcare Research and Quality’s (AHRQ) Medical Expenditure Panel Survey Insurance Component (MEPS-IC) as a basis for creating our own estimates of the various plan elements included in our analysis.[3] For Marketplace plans, we used administrative data on individual market plans from CMS, the agency within HHS responsible for overseeing the establishment of these Marketplaces.[4] Our analyses used data from 2022, the most current available data at the time of our review. Complete CMS data were available only for the 33 states that used the federal Healthcare.gov platform in 2022, so for both employer-sponsored and Marketplace plans we generally limited our review to those 33 states.[5] To assess the reliability of these data, we reviewed relevant documentation and discussed our methodologies with agency officials. Based on this work, we determined that the data were reliable for the purposes of describing how premiums, cost sharing, and benefits of employer-sponsored plans compare to that of Marketplace plans.
As part of the first objective, for our analyses of premiums for employer-sponsored plans, we created enrollment-weighted estimates across the 33 selected states based on publicly available MEPS-IC tabular state-level survey data.[6] Our estimates included average monthly premium and enrollee contributions to premiums for three coverage types (single, employee-plus-one, and family), weighted by the proportion of enrolled employees in each state. We also used the MEPS-IC data to estimate employer-sponsored premiums and enrollee contributions to premiums per covered individual. We did so by combining data from all three of these coverage types to allow a comparison to the Marketplace premium data which are reported at the per covered individual level. Because the MEPS-IC does not collect data on the total number of covered individuals on a family coverage plan, we used 2022 U.S. Census Bureau (Census) household data to approximate the number of covered individuals in each employer-sponsored family policy—resulting in an estimate of 3.83 covered lives per family policy, with an associated 95 percent confidence interval (CI) of 3.70-3.96. We used this estimate as a proxy for the average number of covered individuals per family coverage plan, which we used in calculating average premiums and enrollee contributions to premiums per covered individual across the 33 states. All results of our analysis based on the MEPS-IC data include an associated 95 percent CI to take account of survey sampling error.
Additionally, for the first objective’s analyses of premiums and enrollee contributions to premiums for Marketplace plans, we used CMS data from the Open Enrollment Period Public Use files, which are reported as averages per covered individual.[7] These files include data on per covered individual average monthly premiums, average monthly advance premium tax credits, and average monthly enrollee contributions to premiums for plans in the bronze, silver, and gold metal tiers, as well as for the platinum and catastrophic tiers that we did not include in our analysis.[8] Average contributions to premiums per covered individual included in these files are the monthly premiums minus monthly advance premium tax credits received toward that premium.[9] We calculated an overall average Marketplace plan premium and enrollee contributions to premiums across the three metal tiers, weighting the averages per tier by the proportion of covered individuals in each tier.
For our analysis of cost sharing and plan benefits, we selected cost-sharing elements that were present in both the MEPS-IC survey data and CMS Marketplace data. The cost-sharing elements we analyzed were individual in-network deductible; individual in-network out-of-pocket maximum; and average in-network copay and coinsurance for provider services (a general doctor visit and a specialist visit) and prescription drugs (generic, preferred, non-preferred, and specialty).[10] The benefits we analyzed were mental health care and substance abuse treatment.[11] For employer-sponsored plans, we used the MEPS-IC data to estimate enrolled employee-weighted average individual deductibles, individual out-of-pocket maximums, copays, coinsurance, and benefit coverage, weighted across the 33 states based on the number of enrolled employees in each state.[12] For Marketplace plans we used CMS health insurance Marketplace public use files, together with plan variant enrollment-level data obtained from CMS, to calculate enrollment-weighted average cost sharing and plan benefits.[13]
To describe how the loss of federal payments for CSRs affected Marketplace enrollees, we conducted a literature search to identify papers published from January 2019 through September 2023 that focused on this issue. We also analyzed CMS Open Enrollment Period Public Use data from 2017 and 2018, the year prior to and the first year during the loss of federal payments for CSRs. We used these data to describe changes in average premiums and premium tax credits per covered individual across these two years for the 33 states that used the Healthcare.gov platform, as of 2022.
To inform all of our findings, we interviewed officials from AHRQ, CMS, the Department of the Treasury, and representatives from six organizations selected to reflect a range of expertise on the topics under review. Specifically, we spoke with organizations representing insurers, employers, insurance regulators, actuaries, and health policy researchers. See appendix I for additional details on our scope and methodology.
We conducted this performance audit from April 2023 to November 2024 in accordance with generally accepted government auditing standards. Those standards require that we plan and perform the audit to obtain sufficient, appropriate evidence to provide a reasonable basis for our findings and conclusions based on our audit objectives. We believe that the evidence obtained provides a reasonable basis for our findings and conclusions based on our audit objectives.
Background
Private health plans are the most common source of health coverage in the United States—covering approximately two-thirds of adults in 2023, according to HHS. Private health plans include, but are not limited to, employer-sponsored coverage and coverage offered through Marketplace plans. Health plan coverage reduces an enrollee’s costs for covered services when medical treatment is needed. Health plans do so by paying an agreed upon amount to the facilities, health care providers, and suppliers that a health plan has contracted with—referred to as the health plan’s network. Plans may also pay for services obtained outside of their network but at a higher cost to enrollees. Premiums are the amount—typically billed monthly—paid for health coverage.[14] In addition to premiums, plan cost-sharing elements, including deductibles, out-of-pocket maximums, copayments (copays), and coinsurance, can also affect an enrollee’s final cost for a health visit or procedure. See text box for definitions of key elements of a health plan discussed in this report.
|
Glossary of Key Terms Coinsurance: The percentage of costs of a covered health care service the enrollee pays (20 percent, for example) often after the deductible has been reached. Covered services typically have either a copay or coinsurance. Copay: A fixed amount ($20, for example) the enrollee pays for a covered health care service, often after the deductible has been reached. Covered health care service: A service that the health plan will pay for (in part or in full) on behalf of enrollees. Deductible: The amount the enrollee pays for certain covered health care services before the plan starts to pay. With a $2,000 deductible, for example, enrollees pay the first $2,000 for covered services, after which they usually pay only a copay or coinsurance for covered services. The plan pays the rest. For all Marketplace plans and most employer-sponsored plans, certain preventive services are covered in full before the deductible is met. In-network: Health care providers or health care facilities that have a contract with a health plan to provide health care services to its plan members. Out-of-pocket maximum: The most an enrollee pays for covered medical expenses in a plan year. The structure of an out-of-pocket maximum can vary by plan. For example, in some plans, out-of-network care may not apply to the out-of-pocket maximum or may result in a higher out-of-pocket maximum. Plan benefits: The health care items or services covered under a health plan. Premium: The amount paid to maintain health coverage. Premiums are typically paid monthly. |
Source: GAO analysis of Healthcare.gov and Centers for Medicare & Medicaid Services terms. | GAO‑25‑106798
Employer-Sponsored Health Plans
Many employers sponsor group health plans for their employees.[15] Eligibility for this group coverage is limited to individuals who are part of the group, by virtue of either their own employment or their relationship to an employee (e.g., the spouse or children of an employee, to the extent a sponsor makes the group plan available to family members). Payers for group plans generally include both the employers and employees, with each paying a share of the premium.[16]
Federal support for employer-sponsored plans is provided through various tax benefits. The employer’s share of the premiums for these plans is excluded from their employees’ gross income so it is not subject to federal income or payroll taxes (mainly for Social Security and Medicare). In addition, the employee’s share of premiums is also excluded from their taxable wages and therefore not subject to federal income or payroll taxes. Because tax rates vary, the amount of forgone tax revenue for employer-sponsored plans varies depending on employee income. See table 1 for illustrative costs of forgone federal tax revenue for individuals with different income levels in 2022. (We use 2022 for these examples to be consistent with the year of the analyses used to inform the findings of this report.)
|
|
Individual annual taxable income, Single filer in 2022 (top marginal tax rate) |
||||
|
|
$30,000 (12%) |
$75,000 (22%) |
$160,000 |
$300,000 (35%) |
$600,000 |
|
Forgone employee income tax |
$720 |
$1,320 |
$1,440 |
$2,100 |
$2,220 |
|
Forgone Social Security taxa |
$744 |
$744 |
$0 |
$0 |
$0 |
|
Forgone Medicare taxb |
$174 |
$174 |
$174 |
$228 |
$228 |
|
Total forgone federal tax revenue |
$1,638 |
$2,238 |
$1,614 |
$2,328 |
$2,448 |
|
Forgone federal tax revenue as a percentage of total premium ($6,000) |
27% |
37% |
27% |
39% |
41% |
Source: GAO analysis based on Internal Revenue Service information. | GAO‑25‑106798
Notes: For the purposes of this table, the assumption is that health plans are offered and premiums are treated like the last dollars of income received, so we reflect the top marginal tax rates that would apply to the health plan premium if it was counted as taxable income.
aIncome above a certain amount is not subject to Social Security tax. As a result, there was no Social Security tax reduction for income above $147,000 in 2022.
bBeginning in 2013, Medicare taxes increased by 0.9 percent for some taxpayers, including single filers, for incomes above $200,000.
Based on tax expenditure estimates by the Department of the Treasury, the federal cost for the exclusion of employer-sponsored health plans was approximately $361.5 billion for 2022.[17]
Marketplace Plans
Since 2014, millions of consumers have purchased health plans through the Marketplaces.[18] These consumers purchase a health plan through the Marketplaces for a variety of reasons, including being unemployed, self-employed, or employed by an employer that does not offer a health plan. PPACA requires insurance companies (or issuers) to market certain plans, including individual market plans, according to defined categories (known as metal tiers) that indicate the extent to which the plans would be expected to cover the costs of consumers’ medical care.[19] PPACA also established requirements for the benefits that must be covered by Marketplace health plans—referred to as essential health benefits.[20]
In addition to codifying how Marketplace plans were marketed and the minimum essential benefits they must cover, PPACA also established premium tax credits and CSRs that are available to some Marketplace consumers to help them afford their coverage.
Premium tax credits. Most Marketplace consumers in 2022 were eligible for federal premium tax credits that reduce the amount they contribute towards their premium. Based on tax expenditure estimates by the Department of the Treasury, the federal cost for premium tax credits in 2022 was approximately $76.3 billion.[21] The amount of the premium tax credit varies based on household income and the cost of a benchmark plan (the second lowest-cost silver plan available to the consumer).[22] The credit limits what the consumer would pay for that plan to be no more than a certain percentage of their household income. The American Rescue Plan Act of 2021 made temporary changes to premium tax credits by expanding eligibility to higher-income individuals and increasing premium tax credits for lower-income individuals for tax years 2021 and 2022.[23] For example, the law increased the premium tax credit amounts for eligible individuals and families, resulting in access to plans with no premium contributions for those earning 100 to 150 percent of the federal poverty level. It also expanded eligibility for premium tax credits to include certain individuals and families with incomes at or above 400 percent of the federal poverty level. The Inflation Reduction Act of 2022 extended these provisions through the end of tax year 2025.[24] See table 2.
|
Percent of federal poverty level |
Maximum percentage of annual household income paid for premiums in second lowest-cost silver plan, 2020 |
Temporary maximum percentage of annual household income paid for premiums in second lowest-cost silver plan, 2024a |
|
At least 100 up to 150b |
2.07-4.14 |
0.0 |
|
At least 150 up to 200 |
4.14-6.52 |
0.0–2.0 |
|
At least 200 up to 250 |
6.52-8.33 |
2.0–4.0 |
|
At least 250 up to 300 |
8.33-9.83 |
4.0–6.0 |
|
At least 300 up to 400 |
9.83 |
6.0–8.5 |
|
At least 400 and higher |
100 |
8.5 |
Source: GAO analysis of Department of Health and Human Services data. | GAO‑25‑106798
aThese percentages are temporary. The temporary percentages were established in 2021 and extended through 2025.
bPremium tax credits are generally only
available for households with incomes at or above 100 percent of the federal
poverty level. Lawfully present immigrants with incomes less than 100 percent
of the federal poverty level may receive premium tax credits if they are
ineligible for Medicaid based on immigration status.
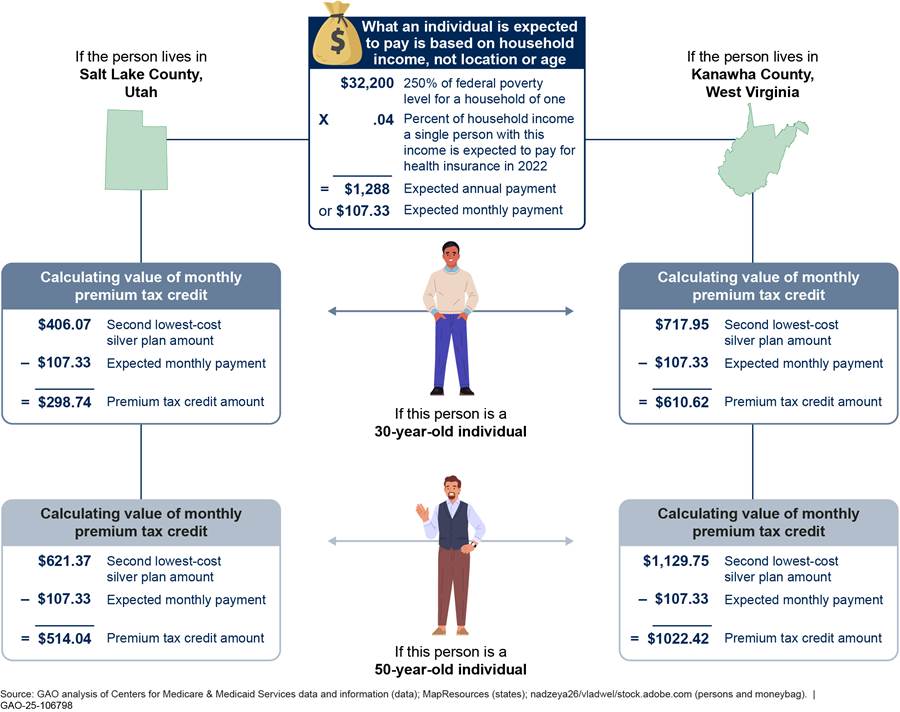
Premiums for Marketplace plans can vary by age, with premiums being up to three times higher for older consumers than for younger consumers in most states.[25] In addition, different premium amounts are established for each rating area in the United States (which are often aligned with counties), so each rating area has its own benchmark plan.
As a result, the formula used to calculate the premium tax credit available to a consumer takes into account their income, age, and location. Also, while premium tax credits are calculated based on the premium of a silver tier plan, consumers do not need to be enrolled in a silver tier plan to use these tax credits. See figure 1 for an illustration of how the premium tax credit for a 30-year-old individual living in Salt Lake County, Utah, would have been calculated in 2022. (We use 2022 for this example to be consistent with the year of the analyses used to inform the findings of this report.)

aPremium tax credits cannot be used to purchase a catastrophic plan available through the Marketplace. Catastrophic plans are available only to individuals under 30 and others who qualify for a hardship exemption or affordability exemption (based on Marketplace or job-based insurance being unaffordable).
bA premium tax credit cannot exceed the amount
of the premium. If an individual chooses a plan with a premium that is less
than their maximum premium tax credit, the premium tax credit is the lower of
the two amounts.
CSRs and actuarial values (AV). Marketplace consumers with household incomes from 100 to 250 percent of the federal poverty level who are eligible for premium tax credits and enroll in silver tier plans are also eligible to receive CSRs that further reduce out-of-pocket costs and increase the AVs of their plans.[26] A health plan’s AV is a measure of the relative generosity of a plan’s benefits that is expressed as a percentage of the covered medical expenses expected to be paid by the insurer on average. For example, on average, enrollees in a silver tier plan (which generally has an AV of 70 percent) would expect the plan to pay 70 percent of the costs of covered services they use, and enrollees would pay the remaining 30 percent.
For consumers who are eligible for CSRs and enroll in silver tier plans, the AVs of their plans are increased. These higher AV plans reduce enrollee costs, including by charging lower copays and coinsurance amounts, and by having lower deductibles and out-of-pocket maximums. The AVs of the three silver tier plans with CSRs are
· 73 percent for covered individuals with incomes greater than 200 percent and less than or equal to 250 percent of the federal poverty level;
· 87 percent for covered individuals with incomes greater than 150 percent and less than or equal to 200 percent of the federal poverty level; and
· 94 percent for covered individuals with incomes greater than or equal to 100 percent and less than or equal to 150 percent of the federal poverty level.
In 2022, around 53 percent of all covered individuals in Marketplace plans were in one of the three silver tiers with CSRs.[27] See table 3.
|
Plan type |
Number of covered individuals |
Percentage of all Marketplace-covered individuals |
|
Marketplace plansa |
10,187,998 |
100% |
|
Bronze tier, 60% actuarial value (AV) |
3,447,850 |
34% |
|
Silver tier with no cost-sharing reduction (CSR), 70% AV |
507,669 |
5% |
|
Silver CSR tier with 73% AV |
506,333 |
5% |
|
Silver CSR tier with 87% AV |
1,368,120 |
13% |
|
Silver CSR tier with 94% AV |
3,553,409 |
35% |
|
Gold tier, 80% AV |
804,617 |
8% |
Source: GAO analysis of Centers for Medicare & Medicaid Services data. | GAO‑25‑106798
Notes: A health plan’s AV is a measure of the relative generosity of a plan’s benefits that is expressed as a percentage of the covered medical expenses expected to be paid by the insurer on average. Covered individuals who have household incomes between 100 and 250 percent of the federal poverty level who are eligible for premium tax credits and select silver tier plans are also eligible to receive CSRs that further reduce out-of-pocket costs and increase the AV of their plans.
For the purposes of this table, we use Marketplace plan selection as a proxy for enrollment.
aMarketplace plans refers to bronze, silver,
and gold tier Marketplace plans combined. Our analysis did not include
catastrophic or platinum tier Marketplace plans. The Marketplace data include
individual plan enrollments in the 33 states that used the Healthcare.gov
platform, whether consumers enrolled directly into plans using the platform or
enrolled through a third party, such as an agent or broker.
Silver loading. Originally, in 2014, HHS made payments to issuers to reimburse them for reduced cost sharing from qualified enrollees. After HHS discontinued these payments, beginning in plan year 2018, the responsibility to pay for CSRs shifted to issuers. As we reported in 2018, issuers in most states increased the premiums they charged for silver tier plans to offset the loss of federal payments. These silver plan increases were larger than increases made to plans in other metal tiers because enrollees who receive CSRs are typically enrolled in silver plans.[28] This approach, which loads the cost of silver plan CSRs onto silver plan premiums, is commonly referred to as “silver loading.”
Differences between Employer-Sponsored and Marketplace Plans
PPACA provides that grandfathered health plans, such as employer-sponsored group health plans that were offered on March 23, 2010, are not subject to a number of PPACA’s market reform provisions.[29] For example, while all Marketplace plans are required to have an out-of-pocket maximum, that requirement does not apply to grandfathered employer-sponsored plans. In addition, while all Marketplace plans are required to cover certain preventive services without cost-sharing requirements for enrollees, that requirement does not apply to grandfathered employer-sponsored plans. These differences in health plan elements like cost sharing and coverage requirements, in addition to the nuances of health plan design, make comparing Marketplace and employer-sponsored plans complex. See table 4 for a comparison of key structural differences between Marketplace and employer-sponsored plans, including grandfathered plans.
|
Health plan element |
Employer-sponsored plans |
|
Marketplace plans |
|
Federal financial support |
Payroll and income tax exemptions |
|
Premium tax credits and tax exemptionsa |
|
Non-federal financial support |
Employer premium contributions |
|
Cost-sharing reductions |
|
Annual out-of-pocket maximum limits |
Required except for grandfathered plansb |
|
Required |
|
Ten federally defined essential health benefit categories covered |
Required except for large group, self-funded and grandfathered plansb,c,d |
|
Required |
|
Certain preventive services covered without cost sharing |
Required except for grandfathered plansb |
|
Required |
|
Treatment for pre-existing conditions |
Required |
|
Required |
Source: GAO analysis of Healthcare.gov and Department of the Treasury information. | GAO‑25‑106798
Notes: Additionally, individual Marketplace plan premiums can vary by age and location.
aSome Marketplace enrollees with medical expenses that reach a certain threshold may deduct the amount they spent on health plan premiums from federal income taxes.
bA grandfathered health plan refers to an existing plan in which at least one individual has been enrolled since March 23, 2010. These plans are subject to fewer requirements than plans established later. To maintain grandfathered status, a plan must avoid certain changes to benefits, cost sharing and employer contributions.
See Patient Protection and Affordable Care Act, Pub. L. No. 111-148, 1251, 124 Stat. 119, 161 (2010) (codified as amended at 42 U.S.C. 18011).
cIn general, large group plans are offered by an employer with 51 or more employees, but states may elect to define a large employer as one with 101 or more employees.
dIn self-funded plans, the employer pays for employee health care benefits directly, bearing the risk for covering medical benefits generated by beneficiaries.
Employer-Sponsored Plans Had Lower Average Premiums Than Marketplace Plans, but Higher Average Enrollee Contributions to Premiums
Average Premiums Were Lower for Employer-Sponsored Plans, but Differences in Covered Populations Limit Comparability between Employer-Sponsored and Marketplace Plans
Our analysis found that, per covered individual, the estimated average premiums for employer-sponsored plans were generally lower than average premiums for Marketplace plans. We found, however, that demographic and other differences in the covered populations complicate the comparability of premiums between these two types of plans.[30] Specifically, we found that, for the 33 states in our review, our estimate of the average monthly premium per covered individual in 2022 for employer-sponsored plans was $55 lower than the corresponding average for Marketplace plans.[31] Furthermore, the estimated average monthly premium per covered individual for employer-sponsored plans was $138 lower than the average monthly premium for Marketplace gold tier plans. According to some studies, Marketplace gold tier plans have an average AV similar to that of employer-sponsored plans.[32] See table 5.
|
|
Estimated average monthly premium per enrolled employee (95 percent confidence interval) |
Estimated average monthly premium per covered individual (95 percent confidence interval) |
|
|
Employer-sponsored plans |
|
||
|
Plan coverage type |
|
|
|
|
Single |
$619 ($587-$652) |
n/a |
|
|
Employee-plus-one |
$1,214 ($1,140-$1,289) |
n/a |
|
|
Family |
$1,769 ($1,659-$1,879) |
n/a |
|
|
All employer-sponsored plansa |
n/a |
$539 ($511-$567) |
|
|
|
|
Average monthly premium per covered individual |
|
|
Marketplace plans |
|
||
|
Metal tier |
|
||
|
Marketplace plansb |
n/a |
$594 |
|
|
Bronze |
n/a |
$526 |
|
|
Silver |
n/a |
$623 |
|
|
Gold |
n/a |
$677 |
|
Legend: n/a = Not applicable.
Source: GAO analysis of Centers for Medicare & Medicaid Services and Agency for Healthcare Research and Quality MEPS-IC data. | GAO‑25‑106798
Notes: Our estimate for employer-sponsored plans is based on Medical Expenditure Panel Survey Insurance Component (MEPS-IC) data and is limited to plans offered by private sector employers. The employee-plus-one and family coverage estimates are premiums for policies that cover multiple individuals. The estimates per employee are weighted by enrolled employees across the 33 states.
aWe used MEPS-IC data reported on a per employee level as the basis to estimate the average monthly premium per covered individual across the 33 states and all three coverage types. This estimate was calculated using a proxy for the average number of covered individuals for a family coverage plan of 3.83 (CI 3.70-3.96) that we derived from national level U.S. Census Bureau household survey data. Employee-plus-one plans were counted as two covered individuals and single plans as one.
bMarketplace plans refers to bronze, silver,
and gold tier plans combined. Our analysis did not include catastrophic or
platinum tier Marketplace plans. The Marketplace data include individual plan
enrollments in the 33 states that used the Healthcare.gov platform, whether
consumers enrolled directly into plans using the platform or enrolled through a
third party, such as an agent or broker.
Reporting average premiums across our 33 selected states masks variation in premiums by geographic area. Our analysis of premiums for both employer-sponsored and Marketplace plans found variation in average premiums depending on the state in which plans were sold. We also found that there was narrower state-by-state variation for employer-sponsored plan premium estimates compared to average premiums for Marketplace plans. Specifically, our per covered individual estimates of average monthly employer-sponsored plan premiums ranged from a low of $483 (CI $423-$543) in Alabama to a high of $634 (CI $569-$698) in Alaska—an estimated difference of $151. The average per covered individual monthly premiums in 2022 for Marketplace plans ranged from a low of $408 in Utah to a high of $1,144 in West Virginia—a difference of $736.
For employer-sponsored plans, the average premium also masks variation in premiums across industries. For example, MEPS-IC national data for private sector employer-sponsored plan enrollees showed variation in average total premiums across different industries. According to these data, in 2022 the estimated average total monthly premium for a retail company employee with a single coverage plan was $598 (CI $581-$616) compared to $680 (CI $662-$697) for a financial services and real estate company employee in a single coverage plan.[33]
For Marketplace plans, because their premiums can vary by the age of the covered individual, average premiums also mask variation in premiums by age.[34] For example, in 2022, the premium for the second lowest-cost Marketplace silver tier plan in Salt Lake County, Utah, was $406 per month for a 30-year-old individual and $621 per month for a 50-year-old individual.
In addition to the various factors that mask variation when comparing average premiums, stakeholders we interviewed noted other factors that limit the comparability of premiums of employer-sponsored plans (which are group plans) to Marketplace plans (which are nongroup plans). For example, stakeholders from an actuarial association and an association representing insurers told us that there are differences in the risk pools for these two types of plans. Specifically, they noted that nongroup plan enrollees are generally sicker than large group plan enrollees. One stakeholder also described Marketplace enrollees as generally older than employer-sponsored plan enrollees, while another stakeholder noted that more of the enrollees in Marketplace plans are early retirees. These demographic factors, along with other considerations like provider networks, benefits offered, cost sharing and average plan AV, as well as regulatory requirements and other factors insurers take into consideration in setting premiums, may affect average premiums and complicate the comparability of premiums for Marketplace and employer-sponsored plans.
Estimated Average Enrollee Contributions to Premiums for Employer-Sponsored Plans Were Higher Than Enrollee Contributions to Premiums for Marketplace Plans
|
Taxes and Enrollee Health Plan Premiums Employee and employer premium contributions to employer-sponsored health plans are made with pre-tax dollars. This lowers the amount of income on which the employee must pay taxes and is a tax savings for the employee. Enrollee premium contributions to Marketplace plans are generally made with after-tax dollars. However, some Marketplace enrollees with medical expenses that reach a certain threshold may deduct the amount they spent on health plan premiums from federal income taxes. For employer-sponsored plans, the tax benefit for an enrollee’s health plan contributions excluded or deducted from taxable income depends on the income and tax rate of the enrollee. For example, as illustrated in table 1, in 2022, an individual with employer-sponsored health coverage with taxable earnings of $75,000 per year with an annual health plan premium of $6,000, would have saved $1,320 in federal income taxes that year as well as $918 in forgone Social Security and Medicare taxes. Source: GAO analysis based on Internal Revenue Service information. | GAO‑25‑106798 |
Our analysis of per covered individual enrollee contributions to premiums found that in 2022, the estimated average monthly enrollee contribution for employer-sponsored plans was higher than the average enrollee contribution for Marketplace plans. After employers’ contributions, the estimated average monthly contribution to premiums per covered individual for employer-sponsored plans was $150 (CI $142-$158). After premium tax credits, the average monthly per covered individual contribution to premiums for Marketplace plans was $109.[35] See table 6. Taxes complicate comparability, however, because enrollee contributions to employer-sponsored plans are paid with pre-tax dollars, which results in a tax savings for enrollees, while enrollee contributions to Marketplace plans are generally paid with after-tax dollars. See sidebar.
|
|
Estimated average monthly enrollee contributions to premiums per enrolled employee (95 percent confidence interval) |
Estimated average monthly enrollee contributions to premiums per covered individual (95 percent confidence interval) |
|
|
Employer-sponsored plans |
|
||
|
Plan coverage type |
|
|
|
|
Single |
$138 ($129-$147)a |
n/a |
|
|
Employee-plus-one |
$370 ($345-$396)a |
n/a |
|
|
Family |
$549 ($511-$587)a |
n/a |
|
|
All employer-sponsored plansb |
n/a |
$150 ($142-$158) |
|
|
|
|
Average monthly enrollee contributions to premiums per covered individual |
|
|
Marketplace plans |
|
||
|
Metal tier |
|
||
|
Marketplace plansc |
n/a |
$109d |
|
|
Bronze |
n/a |
$125d |
|
|
Silver |
n/a |
$77d,e |
|
|
Gold |
n/a |
$276d |
|
Legend: n/a = Not applicable.
Source: GAO analysis of Centers for Medicare & Medicaid Services and Agency for Healthcare Research and Quality MEPS-IC data. | GAO‑25‑106798
Notes: Our estimate for employer-sponsored plans was based on Medical Expenditure Panel Survey Insurance Component (MEPS-IC) data and was limited to plans offered by private sector employers. The employee-plus-one and family coverage estimates are premiums for policies that cover multiple individuals. The estimates per employee are weighted by enrolled employees across the 33 states.
Average contributions to premiums for employer-sponsored plans and for Marketplace plans include enrollees with zero-dollar premium contributions.
aEnrollee contributions to premiums for employer-sponsored plans reflect the balance after employer contributions and are paid with pre-tax dollars, which results in a tax savings to enrollees.
bWe used MEPS-IC data reported on a per employee level as the basis to estimate the average monthly contributions to premiums per covered individual across the 33 states and all three coverage types. This estimate was calculated using a proxy for average number of covered individuals for a family coverage plan of 3.83 (CI 3.70-3.96) that we derived from national level U.S. Census Bureau household survey data. Employee-plus-one plans were counted as two covered individuals and single plans as one.
cMarketplace plans refers to bronze, silver, and gold tier plans combined. Our analysis did not include catastrophic or platinum tier Marketplace plans. The Marketplace data include individual plan enrollments in the 33 states that used the Healthcare.gov platform, whether consumers enrolled directly into plans using the platform or enrolled through a third party, such as an agent or broker.
dEnrollee contributions to premiums for Marketplace plans are the amount after premium tax credits and are paid, generally, with after-tax dollars. Average enrollee contributions to premiums per covered individual for Marketplace plans take into account premium tax credits. When calculating enrollee contributions to premiums for Marketplace plans, we use advance premium tax credits as a proxy for premium tax credits.
eThe majority of covered individuals in silver
tier plans were from households with incomes under 200 percent of the federal
poverty level. As a result, silver tier plan enrollees received among the
highest premium tax credits, resulting in lower average contributions to
premiums per covered individual when compared with those in bronze tier plans.
Enrollee contributions to premiums for employer-sponsored plans varied across employers.[36] For example, national MEPS-IC survey data on private sector employer-sponsored plans showed variation in the average share of employee contributions across industry type. Specifically, in 2022 an employee in single coverage employed by a retail company was, on average, responsible for an estimated 25 percent (or $150) (CI 23 percent-27 percent and $136-$163) of the average monthly premium for such a plan. Comparatively, an employee in single coverage employed by a financial services and real estate company was, on average, responsible for contributing an estimated 19 percent (or $128) (CI 18 percent-20 percent and $122-$135) of the average monthly premium.
Additionally, 2022 premiums for silver tier plans were, on average, higher than that of bronze tier Marketplace plans. However, the average enrollee contribution to premiums per covered individual in silver tier plans was lower as a result of premium tax credits, which are income based. In 2022, the majority (83 percent) of covered individuals in silver tier plans were from households with incomes from 100 up to 200 percent of the federal poverty level—levels that would make them eligible to receive among the highest premium tax credits. By contrast, most covered individuals in bronze and gold tier plans (68 and 85 percent, respectively) were from households with incomes above 200 percent of the federal poverty level.
|
Coverage Gap Premium tax credits are generally only available for households with incomes at or above 100 percent of the federal poverty level—$12,880 for a single person in the 48 contiguous states in 2022. In states that have expanded Medicaid to cover certain adults up to 138 percent of the federal poverty level, individuals with incomes below the 100 percent of federal poverty level premium tax credit threshold are generally eligible for Medicaid coverage. In states that have not expanded Medicaid, however, individuals whose incomes are below 100 percent of the federal poverty level may not be eligible for either premium tax credits or Medicaid coverage, depending on their states’ Medicaid eligibility criteria. For example, in some states, adults without a disability or a dependent are not eligible for Medicaid, regardless of their income. According to research released in 2024 from KFF using data from 2022, nearly 1.5 million people living in the ten states that have not opted to expand Medicaid as of the publication of their research fell into this coverage gap. Source: Department of Health and Human Services and GAO analysis of KFF research. | GAO‑25‑106798 |
Access to both premium tax credits and CSRs are factors that may have driven high enrollment in silver tier plans among covered individuals in households with lower incomes. For example, in 2022, about 83 percent of covered individuals in silver tier plans were from households with incomes from 100 to 200 percent of the federal poverty level, compared with 31 percent of covered individuals in bronze plans in households with incomes in that range. At this income level, individuals would have been eligible to receive among the highest premium tax credits amounts that year (regardless of the metal tier plan selected) and they would have also been eligible for CSRs if they chose coverage in a silver tier plan.
The contributions to premiums for Marketplace plans by enrollees eligible for premium tax credits varied less by geographic location than total premiums varied. For example, in 2022, the premium for the lowest-cost bronze plan for a 30-year-old individual was $254.10 per month in Salt Lake County, Utah (the state with the lowest average Marketplace premiums) and $596.48 per month in Kanawha County, West Virginia (the state with the highest average Marketplace premiums)—a difference of $342.38. However, after the premium tax credit, a single 30-year-old enrollee with a household income at 150 or 250 percent of the federal poverty level in either county would pay no premium for the lowest-cost bronze plan. Similarly, a single 30-year-old enrollee with a household income at 400 percent of the federal poverty level would contribute $212.96 towards the monthly premium in Salt Lake County and $243.46 in Kanawha County—a difference of $30.50 per month. See table 7.
|
|
Salt Lake County, Utah |
Kanawha County, West Virginia |
|
Premium for lowest-cost bronze plan |
$254.10 |
$596.48 |
|
Enrollee contribution to premium after premium tax credit |
|
|
|
Household income 150% of the federal poverty level ($19,320) |
$0.00 |
$0.00 |
|
Household income 250% of the federal poverty level ($32,200) |
$0.00 |
$0.00 |
|
Household income 400% of the federal poverty level ($51,520) |
$212.96 |
$243.46 |
Source: GAO analysis of Centers for Medicare & Medicaid
Services data. | GAO‑25‑106798
Marketplace plan enrollees eligible for premium tax credits experienced less geographic variation in the amounts they contributed to premiums than those in Marketplace plans who did not receive premium tax credits. Because premium tax credits limit enrollee contributions to premiums based on household income—regardless of location or age—premium tax credits for enrollees in states that have higher premiums will be larger than that of enrollees in states with lower premiums. Similarly, because premiums are higher for older enrollees, the premium tax credits for older enrollees will be larger than the premium tax credits for younger enrollees. See figure 2 for an illustration of the calculation of premium tax credits in 2022 for 30-year-old and 50-year-old individuals with the same income in Salt Lake County, Utah, and Kanawha County, West Virginia.
In addition, because the premium tax credit is calculated, in part, based on
the premium of the second lowest-cost silver plan (also referred to as the
benchmark plan), the contribution to premiums for an older enrollee who
receives a premium tax credit could be less than that for a younger enrollee
who receives a premium tax credit for the same plan. For example, in 2022 the
premiums for a 50-year-old were $388.83 for the lowest-cost bronze plan in Salt
Lake County, Utah, and $938.60 for the lowest-cost bronze plan in Kanawha
County, West Virginia, which are notably higher than the premiums for a
30-year-old ($254.10 and $596.48, respectively). However, because the benchmark
plan for a 50-year-old was also more expensive than the benchmark plan for a
30-year-old, a 50-year-old with the same income would have had a higher premium
tax credit. When that higher tax credit is applied to the lowest-cost bronze
plan, the result could be a lower contribution to premiums for a 50-year-old
enrollee compared to that of a 30-year-old enrollee with the same income
selecting the same plan. See table 8 for examples of premiums and contributions
to premiums in 2022 for different aged enrollees in Salt Lake County, Utah, and
Kanawha County, West Virginia.
|
|
Salt Lake County, Utah |
Kanawha County, West Virginia |
||
|
|
30-year-old |
50-year-old |
30-year-old |
50-year-old |
|
Premium for lowest-cost bronze plan |
$254.10 |
$388.83 |
$596.48 |
$938.60 |
|
Enrollee contribution to premiums after premium tax credit |
|
|
|
|
|
Household income 150% of the federal poverty level ($19,320) |
$0.00 |
$0.00 |
$0.00 |
$0.00 |
|
Household income 250% of the federal poverty level ($32,200) |
$0.00 |
$0.00 |
$0.00 |
$0.00 |
|
Household income 400% of the federal poverty level ($51,520) |
$212.96 |
$132.39 |
$243.46 |
$173.78 |
Source: GAO analysis of Centers for Medicare & Medicaid Services data. | GAO‑25‑106798
Average Cost-Sharing Amounts and Selected Covered Benefits Varied across Marketplace and Employer-Sponsored Plans
Estimated Average Cost-Sharing Amounts for Employer-Sponsored Plans Varied; Some Were Higher, Others Were Lower Than the Average for Marketplace Plans
In 2022, for the 33 states in our review, estimated average cost-sharing amounts for employer-sponsored plans were sometimes higher and sometimes lower when compared to Marketplace plan averages. However, the complexity of plan design complicates comparisons across Marketplace and employer-sponsored plans. For example, data we reviewed for employer-sponsored and Marketplace plans (MEPS-IC and CMS data, respectively) did not necessarily reflect the nuances of plan design or how those nuances may have affected who enrolled in each plan, which could affect how much enrollees paid for the health care services they received.
Our review focused on four cost-sharing features that applied to in-network services for employer-sponsored and Marketplace plans—deductibles, out-of-pocket maximums, and copays and coinsurance.[37]
Deductibles. We found that, for the 33 states in our review, compared to employees enrolled in employer-sponsored plans, a greater share of individuals enrolled in Marketplace plans in 2022 were in plans with no deductibles—meaning they did not have to meet a deductible before their plan started paying for covered services. Specifically, 37 percent of individuals enrolled in Marketplace plans were in plans with no deductible compared to an estimated 8 percent (CI 7 percent-9 percent) of employees enrolled in employer-sponsored plans with no deductible. This high percentage of Marketplace enrollees in plans with no deductibles was driven by the number of individuals enrolled in two of the silver tier plan variants with CSRs (the CSR plan variants with 87 and 94 percent AV), many of which had no deductible. See table 9.
|
Plan type |
Percentage of total Marketplace enrollees |
Percentage of enrollees in a plan with no deductible (95 percent confidence interval) |
|
Employer-sponsored plans (estimate)a |
n/a |
8% (7%-9%) |
|
Marketplace plansb |
100% |
37% |
|
Bronze tier, 60% actuarial value (AV) |
34% |
1% |
|
Silver tier with no cost-sharing reduction (CSR), 70% AV |
4% |
5% |
|
Silver CSR tier with 73% AV |
5% |
5% |
|
Silver CSR tier with 87% AV |
13% |
39% |
|
Silver CSR tier with 94% AV |
36% |
83% |
|
Gold tier, 80% AV |
8% |
10% |
Legend: n/a = Not applicable.
Source: GAO analysis of Centers for Medicare & Medicaid Services and Agency for Healthcare Research and Quality MEPS-IC data. | GAO‑25‑106798
Notes: Medical Expenditure Panel Survey Insurance Component (MEPS-IC) reports the percent of employees in plans with a deductible. For Marketplace plans, when determining which plans had a deductible, we included any non-zero deductible. This includes any non-zero value for plans with a combined medical and drug deductible or any non-zero value for either medical or drug deductibles.
A health plan’s AV is a measure of the relative generosity of a plan’s benefits that is expressed as a percentage of the covered medical expenses expected to be paid by the insurer on average. Covered individuals who have household incomes between 100 and 250 percent of the federal poverty level who are eligible for premium tax credits and select silver tier plans are also eligible to receive CSRs that further reduce out-of-pocket costs and increase the AV of their plans.
aOur estimates for employer-sponsored plans were based on MEPS-IC data and were limited to plans offered by private sector employers. The percentage of employees in a plan with a deductible includes those employees in single, employee-plus-one, and family coverage. MEPS-IC survey data is reported at a per enrolled employee level.
bMarketplace plans refers to bronze, silver, and gold tier plans combined. Our analysis did not include catastrophic or platinum tier Marketplace plans. Marketplace data are reported at a per covered individual level. Marketplace data in this table are based on effectuated enrollment, which is the number of unique individuals who have been determined eligible to enroll in a Marketplace plan, have selected a plan, and have submitted the first premium payment for a Marketplace plan. Because this data includes some plan variants where the number of enrollees is suppressed due to privacy concerns, it may not represent 100 percent of effectuated enrollment. The Marketplace data include individual plan enrollments in the 33 states that used the Healthcare.gov platform, whether consumers enrolled directly into plans using the platform or enrolled through a third party, such as an agent or broker.
|
Drug Deductible According to national Medical Expenditure Panel Survey Insurance Component (MEPS-IC) data for private sector employers, in 2022, 9.9 percent (confidence interval [CI] 9-11 percent) of employees enrolled in employer-sponsored health plans had a separate drug deductible. The average drug deductible for those enrollees was $357 (CI $317-$397). Among the individuals enrolled in Marketplace plans in 2022, we found that 13 percent had a separate drug deductible. The average drug deductible for those individuals was $3,360, driven primarily by bronze tier enrollees who had an average $4,374 drug deductible. Additionally, when there are separate medical and drug deductibles, some plans may have no deductible for one service type and a deductible for the other service type. For example, we found that 76 percent of Marketplace enrollees with a separate drug deductible had no medical deductible. This means they only needed to meet a deductible for drugs. Source: GAO analysis of Centers for Medicare & Medicaid Services and Agency for Healthcare Research and Quality MEPS-IC data. | GAO‑25‑106798 |
There are different ways deductibles can be structured that complicate comparisons of deductible amounts across plans. Notably, some plans have a single total deductible that applies to both medical services and drugs, while others have separate deductibles for medical services and drugs. For example, employer-sponsored plans and Marketplace plans differ in their use of separate drug deductibles. See sidebar.
Because of these and other complexities of plan design for deductibles, as well as limitations in the detail available in the MEPS-IC data, we focused our comparison of deductible amounts on individual medical deductibles for in-network services. This included plans that had a total deductible that pertained to both medical services and drugs or a separate deductible for medical services—which we refer to throughout this section collectively as medical deductibles.[38]
We found that across the 33 states in our review, among plans that had a medical deductible, our estimates of average individual medical deductibles for employer-sponsored plans were lower than that of Marketplace plans. But a much higher percentage of Marketplace enrollees were in plans with no medical deductible.[39] Among plans that had a medical deductible, the estimated average individual annual medical deductible in 2022 for employees enrolled in employer-sponsored plans was $2,063 (CI $1,943-$2,182), compared to an average of $4,285 for individuals enrolled in Marketplace plans. However, the average individual medical deductibles in plans with a medical deductible for three Marketplace tiers—silver tier plan variants with 87 and 94 percent AV CSR and gold tier plans—were lower than the estimate of that for employer-sponsored plans. Additionally, the majority of Marketplace plan enrollees in that same year (57 percent) were enrolled in plans in one of these three tiers. See table 10.
|
Plan type |
Percentage of total Marketplace enrollees |
Average individual medical deductible (for plans that have a deductible) (95 percent confidence interval) |
Average individual medical deductible (including plans with no deductible) (95 percent confidence interval) |
|
Employer-sponsored plans (estimate)a |
n/a |
$2,063 ($1,943-$2,182) |
$1,902 ($1,794-$2,011) |
|
Marketplace plansb |
100% |
$4,285 |
$2,536 |
|
Bronze tier, 60% actuarial value (AV) |
34% |
$7,067 |
$6,968 |
|
Silver tier with no cost-sharing reduction (CSR), 70% AV |
4% |
$4,715 |
$4,439 |
|
Silver CSR tier with 73% AV |
5% |
$3,312 |
$3,114 |
|
Silver CSR tier with 87% AV |
13% |
$765 |
$449 |
|
Silver CSR tier with 94% AV |
36% |
$366 |
$60 |
|
Gold tier, 80% AV |
8% |
$1,568 |
$1,411 |
Legend: n/a = Not applicable.
Source: GAO analysis of Centers for Medicare & Medicaid Services and Agency for Healthcare Research and Quality MEPS-IC data. | GAO‑25‑106798
Notes: The calculations for average medical deductibles included separate medical deductibles and total deductibles that pertained to both medical services and drugs. Separate drug deductibles were not included in these calculations. Averages in the table are enrollment-weighted.
A health plan’s AV is a measure of the relative generosity of a plan’s benefits that is expressed as a percentage of the covered medical expenses expected to be paid by the insurer on average. Covered individuals who have household incomes between 100 and 250 percent of the federal poverty level who are eligible for premium tax credits and select silver tier plans are also eligible to receive CSRs that further reduce out-of-pocket costs and increase the AV of their plans.
aOur estimates for employer-sponsored plans were based on Medical Expenditure Panel Survey Insurance Component (MEPS-IC) data and were limited to plans offered by private sector employers. The percentage of employees in a plan with a deductible includes those employees in single, employee-plus-one, and family coverage. MEPS-IC data reports average individual deductibles for employees enrolled with single coverage. When estimating the individual medical deductible for employer-sponsored plans including those plans with no deductible, we assumed that the rate for those single plan enrollees with no deductible was the same as the rate of employees across all coverage types with no deductible. The average individual medical deductible was then weighted based off the number of enrolled employees in single plans across the 33 states.
bMarketplace plans refers to bronze, silver,
and gold tier plans combined. Our analysis did not include catastrophic or
platinum tier Marketplace plans. Marketplace data in this table are based on
effectuated enrollment, which is the number of unique individuals who have been
determined eligible to enroll in a Marketplace plan, have selected a plan, and
have submitted the first premium payment for a Marketplace plan. Because this
data includes some plan variants where the number of enrollees is suppressed due
to privacy concerns, it may not represent 100 percent of effectuated
enrollment. The Marketplace data include individual plan enrollments in the 33
states that used the Healthcare.gov platform, whether consumers enrolled
directly into plans using the platform or enrolled through a third party, such
as an agent or broker.
In addition, national level survey data for employer-sponsored plans also showed variation in average individual medical deductibles across industries. For example, according to these data, in 2022, the estimated average individual medical deductible for an employee of a retail company in a single coverage plan with a deductible was $2,079 (CI $1,929-$2,229). In comparison, the estimated average individual medical deductible for an employee of a financial services and real estate company in a single coverage plan with a deductible was $1,707 (CI $1,609-$1,805).
Beyond the variation in the use of deductibles and their amounts, there are other complexities that make it challenging to compare deductibles across employer-sponsored plans and Marketplace plans. For example, all Marketplace plans are required to provide coverage for recommended preventive care like mammograms and behavioral health screenings at no cost to patients. These services are not subject to the deductible. These requirements apply to most, but not all, employer-sponsored plans depending on whether they have been granted a grandfathered status.[40] Similarly, it is difficult to know the full costs that covered individuals in these plans pay for the health care services they use before meeting their deductible. For example, two plans may have identical deductibles, but one plan may have more expensive copays for specialist visits prior to reaching the deductible. Another plan may have lower specialist visit copays but require the enrollee to pay the full negotiated amount of that specialist visit up until the deductible is reached.
Out-of-pocket maximums. For the 33 states in our review, the average individual out-of-pocket maximum—generally a cap on the maximum amount a covered individual will pay each year for covered expenses—was similar for employer-sponsored and Marketplace plans. However, while some employees enrolled in employer-sponsored plans were in plans that did not have an out-of-pocket maximum, all individuals enrolled in Marketplace plans were in plans with out-of-pocket maximums.
Our estimate of the average individual out-of-pocket maximum for employer-sponsored plans, among plans that had an out-of-pocket maximum, was $4,715 (CI $4,454-$4,975) compared to an average of $4,986 for Marketplace plans. However, an estimated 8 percent (CI 7-9 percent) of employees enrolled in employer-sponsored plans were in plans that did not have an individual out-of-pocket maximum, and no individuals enrolled in Marketplace plans were in plans without an individual out-of-pocket maximum. See table 11.
|
Plan type |
Percentage of total Marketplace enrollees |
Average individual out-of-pocket maximum (for plans that have an out-of-pocket maximum) (95 percent confidence interval |
Percentage of covered individuals in a plan with no out-of-pocket maximum (95 percent confidence interval |
|
Employer-sponsored plans (estimate)a |
n/a |
$4,715 ($4,454-$4,975) |
8% (7%-9%) |
|
Marketplace plansb |
100% |
$4,986 |
0% |
|
Bronze tier, 60% actuarial value (AV) |
34% |
$8,435 |
0% |
|
Silver tier with no cost-sharing reduction (CSR), 70% AV |
4% |
$8,369 |
0% |
|
Silver CSR tier with 73% AV |
5% |
$6,603 |
0% |
|
Silver CSR tier with 87% AV |
13% |
$2,724 |
0% |
|
Silver CSR tier with 94% AV |
36% |
$1,411 |
0% |
|
Gold tier, 80% AV |
8% |
$7,505 |
0% |
Legend: n/a = Not applicable.
Source: GAO analysis of Centers for Medicare & Medicaid Services and Agency for Healthcare Research and Quality MEPS-IC data. | GAO‑25‑106798
Notes: A health plan’s AV is a measure of the relative generosity of a plan’s benefits that is expressed as a percentage of the covered medical expenses expected to be paid by the insurer on average. Covered individuals who have household incomes between 100 and 250 percent of the federal poverty level who are eligible for premium tax credits and select silver tier plans are also eligible to receive CSRs that further reduce out-of-pocket costs and increase the AV of their plans. Averages in the table are enrollment-weighted.
aOur estimates for employer-sponsored plans were based on Medical Expenditure Panel Survey Insurance Component (MEPS-IC) data and were limited to plans offered by private sector employers. The individual out-of-pocket maximum data in MEPS-IC is reported only for those employees enrolled in single coverage plans, so the average individual out-of-pocket maximum and the percentage of covered individuals in a plan with no out-of-pocket maximum are for employees enrolled in a single plan.
bMarketplace plans refers to bronze, silver,
and gold tier plans combined. Our analysis did not include catastrophic or
platinum tier Marketplace plans. Marketplace data is reported at a per covered
individual level. Marketplace data in this table are based on effectuated
enrollment, which is the number of unique individuals who have been determined
eligible to enroll in a Marketplace plan, have selected a plan, and have
submitted the first premium payment for a Marketplace plan. Because this data
includes some plan variants where the number of enrollees is suppressed due to
privacy concerns, it may not represent 100 percent of effectuated enrollment.
The Marketplace data include individual plan enrollments in the 33 states that
used the Healthcare.gov platform, whether consumers enrolled directly into
plans using the platform or enrolled through a third party, such as an agent or
broker.
National level survey data for employer-sponsored plans also showed variation in average out-of-pocket maximums across industries. For example, in 2022, among employees enrolled in single coverage plans that had an out-of-pocket maximum, the estimated average individual out-of-pocket maximum for an employee of a retail company was $4,807 (CI $4,559-$5,055). This is in comparison to an out-of-pocket maximum of $4,399 (CI $4,255-$4,573) for an employee of a financial services and real estate company.
Although the overall average out-of-pocket maximums in employer-sponsored and Marketplace plans were similar, comparing averages miss an important element. As noted above, we estimated that 8 percent (CI 7-9 percent) of covered individuals in employer-sponsored plans did not have an out-of-pocket maximum in 2022. For that estimated 8 percent, the potential annual out-of-pocket costs—such as costs for undergoing expensive treatment for certain cancers—could far exceed both Marketplace and other employer-sponsored plan limits. This difference limits the comparability of estimated average individual out-of-pocket maximums in employer-sponsored plans to Marketplace plan out-of-pocket maximums. Comparing the averages does not account for the fact that an estimated 8 percent of employees enrolled in employer-sponsored plans are potentially at risk for incurring catastrophic medical expenses.
Copays and coinsurance. Our review of 2022 data in the 33 selected states found that average enrollment-weighted copays and coinsurance among plans with such features were generally either similar or lower for employer-sponsored plans compared to Marketplace plans. For example, our estimate for the average copay for general physician services for employees enrolled in employer-sponsored plans ($28; CI $26-$30) was the same as the average copay for individuals enrolled in Marketplace plans ($28). But we estimated that employer-sponsored plan enrollees had a lower average coinsurance for general physician services (20 percent; CI 19-22 percent) compared to covered individuals in Marketplace plans (31 percent). Additionally, the average enrollment-weighted copays and coinsurance among plans with such features for the different Marketplace tiers varied—some were higher, while others were lower, than estimated averages of employer-sponsored plans. See table 12 for general physician and specialist physician copay and coinsurance data, and appendix II for additional copay and coinsurance data, including for prescription drugs.
|
|
General physician visit |
Specialist physician visit |
||
|
Plan type |
Average copay (95 percent confidence interval) |
Average coinsurance (95 percent confidence interval) |
Average copay (95 percent confidence interval) |
Average coinsurance (95 percent confidence interval) |
|
Employer-sponsored plans (estimate)a |
$28 ($26-$30) |
20% (19%-22%) |
$48 ($45-$52) |
22% (20%-23%) |
|
Marketplace plansb |
$28 |
31% |
$41 |
34% |
|
Bronze tier, 60% actuarial value (AV) |
$47 |
40% |
$85 |
44% |
|
Silver tier with no cost-sharing reduction (CSR), 70% AV |
$33 |
25% |
$69 |
36% |
|
Silver CSR tier with 73% AV |
$26 |
25% |
$59 |
36% |
|
Silver CSR tier with 87% AV |
$13 |
20% |
$28 |
30% |
|
Silver CSR tier with 94% AV |
$7 |
13% |
$10 |
22% |
|
Gold tier, 80% AV |
$23 |
21% |
$46 |
29% |
Source: GAO analysis of Centers for Medicare & Medicaid Services and Agency for Healthcare Research and Quality MEPS-IC data. | GAO‑25‑106798
Notes: While this table describes average cost sharing for certain types of covered benefits, preventive care services like mammograms and behavioral health screenings are provided at no cost to enrollees for all Marketplace plans and for most employer-sponsored plans.
Average copays reflect plans that have a non-zero value for copays. Average coinsurance reflect plans that have a non-zero percentage of coinsurance. Averages in the table are enrollment weighted.
A health plan’s AV is a measure of the relative generosity of a plan’s benefits that is expressed as a percentage of the covered medical expenses expected to be paid by the insurer on average. Covered individuals who have household incomes between 100 and 250 percent of the federal poverty level who are eligible for premium tax credits and select silver tier plans are also eligible to receive CSRs that further reduce out-of-pocket costs and increase the AV of their plans.
aOur estimates for employer-sponsored plans were based on Medical Expenditure Panel Survey Insurance Component (MEPS-IC) data and were limited to plans offered by private sector employers. We used MEPS-IC data that were reported at the per employee level to weight average copays and coinsurance across the 33 selected states.
bMarketplace plans refers to bronze, silver,
and gold tier plans combined. Our analysis did not include catastrophic or
platinum tier Marketplace plans. Marketplace data are reported at a per covered
individual level. The Marketplace data include individual plan enrollments in
the 33 states that used the Healthcare.gov platform, whether consumers enrolled
directly into plans using the platform or enrolled through a third party, such
as an agent or broker.
Like the other cost-sharing features we analyzed, complexity in plan design makes comparing average copays and coinsurance across plans challenging. For example, different plans may apply different rules for when and how cost sharing is applied to the deductible. Some plans may require enrollees to pay the full cost of certain services until the deductible is met, while others may limit enrollee costs for these services to the copay or coinsurance amounts before the deductible is met. Additionally, for some plans, certain services, such as preventive services, may be available at no cost, while for other plans they are not. These are just a few examples of many ways that plan designs can differ.
Most, but Not All, Employees Enrolled in Employer-Sponsored Plans Had Coverage for Mental Health and Substance Abuse Treatment Benefits, Which Marketplace Plans Are Required to Cover
As previously noted, our comparison of benefits focused on mental health care and substance abuse treatment because of challenges in measuring other types of care. Our review found that most, but not all, employees enrolled in employer-sponsored plans were in plans that had coverage for mental health and substance abuse care. All Marketplace plans are required to cover these as essential health benefits. Specifically, according to our estimates using MEPS-IC survey data across the 33 states, 6 percent (CI 1-10 percent) of employees enrolled in employer-sponsored plans may lack mental health coverage and 7 percent (CI 3-12 percent) may lack substance abuse treatment coverage.[41] See table 13.
|
Plan type |
Percentage of enrollees with mental health benefits (95 percent confidence interval) |
Percentage of enrollees with substance abuse treatment benefits (95 percent confidence interval) |
|
Employer-sponsored plans (estimate)a |
94% (90%-99%) |
93% (88%-97%) |
|
Marketplace plansb |
100% |
100% |
Source: GAO analysis of Centers for Medicare & Medicaid Services and Agency for Healthcare Research and Quality MEPS-IC data. | GAO‑25‑106798
aOur estimates for employer-sponsored plans were based on Medical Expenditure Panel Survey Insurance Component (MEPS-IC) data and were limited to plans offered by private sector employers. We used MEPS-IC survey data that were reported at the per employee level to estimate average benefit coverage across the 33 selected states.
bMarketplace plans refers to bronze, silver, and gold tier plans combined. Our analysis did not include catastrophic or platinum tier Marketplace plans. Marketplace data are reported at a per covered individual level. The Marketplace data include individual plan enrollments in the 33 states that used the Healthcare.gov platform, whether consumers enrolled directly into plans using the platform or enrolled through a third party, such as an agent or broker.
The Loss of Federal Payments for CSRs Resulted in Increased Premium Tax Credits for Certain Marketplace Enrollees
The loss of federal payments beginning with the 2018 plan year for CSRs in silver tier plans for certain eligible enrollees shifted the responsibility of paying for CSRs from the federal government to issuers. See sidebar. Many issuers opted to increase silver tier plan premiums to cover the cost of these required CSRs and account for the loss of federal payments, as enrollees who receive CSRs are typically enrolled in silver tier plans. This strategy, commonly referred to as silver loading, contributed to higher silver tier plan premium increases. See figure 3 for an illustration of how premiums for silver tier plans changed as a result of silver loading.
|
Cost-Sharing Reductions (CSR) and Change in Funding The Patient Protection and Affordable Care Act (PPACA) required that certain eligible consumers who were enrolled in silver tier Marketplace plans receive CSRs in the form of lower deductibles, copays, coinsurance, and out-of-pocket maximums. These CSRs are income-based and reduce the out-of-pocket costs for enrollees. For consumers who are eligible for CSRs and enroll in silver tier plans, the actuarial values (AV) of their plans are increased from 70 percent to up to 94 percent. AVs are a measure of the relative generosity of a plan’s benefits. Initially, in 2014, the federal government reimbursed issuers for these CSRs. Beginning with the 2018 plan year, the responsibility to cover these CSRs shifted to issuers. Source: GAO and Centers for Medicare & Medicaid Services. | GAO‑25‑106798 |
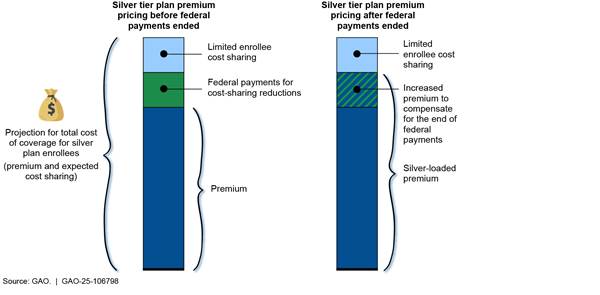
Note: The loss of federal payments for CSRs shifted the
responsibility of paying for CSRs from the federal government to issuers
starting in the 2018 plan year.
Based on our review of relevant literature and interviews with stakeholders, we found this change contributed to increases in premium tax credit amounts (which are calculated based on the second lowest-cost silver plan premiums). Further, enrollees eligible for premium tax credits had more plans to choose from on other (non-silver) metal tiers with no- or very-low premium contributions as a result of these higher premium tax credits. Some research suggests that these changes may have also resulted in decreases in the number of Marketplace enrollees selecting silver tier plans.
Silver plan premiums. Our review of CMS data for the 33 selected states found that in 2018, the first year that insurers started silver loading, the average monthly silver tier plan premium increased by 37 percent compared to 2017. By contrast, average monthly bronze tier plan premiums in these same states and years increased by only 18 percent from 2017 to 2018.
Premium tax credits. Similar to increases in silver tier plan premiums, our review of CMS data found that the average premium tax credit in the 33 states increased by 43 percent in 2018 compared to 2017. Officials we spoke with from an organization representing actuaries and one paper we reviewed noted that silver loading contributed to increases in the amounts of premium tax credits in 2018 because premium tax credits are calculated based on the cost of the second lowest-cost silver tier plan in each rating area.[42]
Access to zero- and low-premium contribution plans. Increases in premium tax credit amounts resulted in an increase in the proportion of Marketplace plan enrollees who could select plans for which their premium tax credits would cover most or all of the cost of their premiums, according to papers we reviewed. These plans are described as zero- or low-premium contribution plans. Three papers described how the increased value of premium tax credits in 2018 (due to silver loading) had contributed to an increase in the proportion of Marketplace enrollees who could select from Marketplace plans that, after taking into account the credits, had premiums that were either no-cost or low-cost to them. In one paper, researchers found that the percentage of consumers who could select zero-premium contribution plans increased by 18.3 percentage points from 2017 to 2018.[43] Similarly, in another paper that focused on states that used the Healthcare.gov platform, researchers found that a 45-year-old nonsmoking enrollee with an income of 151 to 200 percent of the federal poverty level could select a health plan with a zero-premium contribution in 13 percent of counties in 2015, compared to 83 percent of counties in 2018 (after silver loading began). The researchers found that the ability to select a zero-premium contribution plan in 2018 for enrollees varied across a range of ages and income levels.[44] In another paper, researchers noted that, more broadly, these increased premium tax credits have resulted in some enrollees being able to access a gold tier plan for a lower premium contribution than the premium contribution amount for a silver tier plan.[45]
Metal tier plan selection. Some of the papers we reviewed cited evidence that silver loading contributed to a decrease in enrollment in silver tier plans. For example, one found the total share of Marketplace enrollees in silver tier plans fell by almost 11 percentage points between 2017 and 2018. The authors noted that the shift in 2018 was consistent with expectations that increased premiums for silver tier plans, combined with the increased premium tax credits from silver loading, contributed to reducing the attractiveness of silver tier plans compared to plans in other Marketplace tiers.[46] For example, more enrollees could use their premium tax credits to cover most or all of the premium of a bronze tier plan or to reduce their premium contribution for a gold tier plan with a higher AV. Three other papers echoed that finding, pointing out increases in enrollment in bronze or gold tier plans following the adoption of increased silver premiums and accompanying premium tax credits.[47] For example, one of these papers, focusing on interviews with insurers in 10 states, noted that insurers reported a significant shift in enrollment from silver tier plans to bronze and gold tier plans among enrollees who were not eligible for CSRs.[48] Whether these shifts were driven by enrollees reconsidering their existing plan or by new enrollees in the market is less clear, though two studies that focused on California described re-enrollees leaving silver tier plans, especially for enrollees who had access to a more generous gold tier plan for only a small increase in premium contributions.[49]
Agency Comments
We provided a draft of this product to HHS and the Department of the Treasury for comment. Both agencies provided technical comments, which we incorporated as appropriate.
We are sending copies of this report to the appropriate congressional committee and the Secretary of Health and Human Services and the Secretary of the Treasury. In addition, the report will be available at no charge on the GAO website at http://www.gao.gov.
If you or your staff have any questions about this report, please contact me at (202) 512-7114 or at dickenj@gao.gov. Contact points for our Offices of Congressional Relations and Public Affairs may be found on the last page of this report. GAO staff who made key contributions to this report are listed in appendix III.
Sincerely,

John E. Dicken
Director, Health Care
This report compares employer-sponsored plans to Marketplace plans. In this report, we describe
1. how average premiums of employer-sponsored plans compare to that of Marketplace plans;
2. how cost sharing and certain plan benefits offered in employer-sponsored plans compare to that of Marketplace plans; and
3. how the loss of federal payments for cost-sharing reductions (CSR) affected Marketplace enrollees.
In this appendix, we provide detail on the data sources we used to analyze how the average premiums, premium contributions, cost sharing, and plan benefits of employer-sponsored plans compare to that of Patient Protection and Affordable Care Act (PPACA) Marketplace plans, and what we did with each data set to arrive at our results. These analyses used data from 2022, the most current available data at the time of our review. We also describe our approach in using a literature search and Centers for Medicare & Medicaid Services (CMS) data to note the effects of the loss of federal payments for CSRs on Marketplace enrollees. Finally, we describe the types of stakeholders we interviewed for all three reporting objectives. To assess the reliability of data used in this report, we reviewed relevant documentation and discussed our methodologies with agency officials. We found the data to be reliable for the purposes of our audit objectives.
Employer-Sponsored Plan Data
For our analyses of employer-sponsored plans, we generated estimates for average premiums, enrollee contributions to premiums, cost-sharing elements, and covered benefits based on state-level tabular survey data publicly available from the Department of Health and Human Services’ (HHS) Agency for Healthcare Research and Quality (AHRQ) Medical Expenditure Panel Survey Insurance Component (MEPS-IC).[50] The MEPS-IC survey is an establishment survey, collecting information from employers on their health plans, including annual premiums, annual contributions by employers and employees, benefits, and employer characteristics.[51] The MEPS-IC survey data we used for this report provides information on active employees, and does not include retirees or those with health insurance continuation coverage, commonly known as COBRA.
MEPS-IC includes both private sector and public sector establishments at the national level—in 2022, the MEPS-IC sample size included 39,969 private sector establishments and 3,264 state and local government units.[52] The publicly reported MEPS-IC state-level data include only private sector organizations. Our review was limited to 33 states for comparability with available data for Marketplace plans, so for most of our analyses we used only MEPS-IC private sector state-based data when describing employer-sponsored coverage.[53]
MEPS-IC data are reported at the enrolled employee level, in contrast to Marketplace data, which are reported at the per covered individual level. This distinction applies to most of the comparisons we conducted of employer-sponsored and Marketplace plans. However, to provide a more equivalent comparison of premiums and enrollee contributions to premiums between employer-sponsored and Marketplace plans, we converted the MEPS-IC premium and enrollee contribution to premiums estimates to per covered individual estimates.[54]
We estimated the number of enrolled employees in each of the 33 selected states for each coverage type by
· multiplying the number of employees in each of the state files by the percentage of employees in establishments that offer health insurance;
· multiplying that number in each state by the percentage of employees enrolled in health insurance at establishments that offer health insurance; and
· multiplying that number by the percentage of enrollees with single, employee-plus-one, and family coverage in each state respectively.
To estimate the number of covered individuals (the number of people covered by a health plan) for each coverage type, we counted one covered individual for single coverage plans and two covered individuals for employee-plus one plans. MEPS-IC data does not specify the number of covered individuals in a family coverage plan. To estimate the number of covered individuals in family coverage plans, we approximated the average number of covered individuals as 3.83 (95 percent confidence interval: 3.70-3.96).[55] We developed this approximation for the average covered individuals per family coverage plan through an analysis of publicly available 2022 U.S. Census Bureau Current Population Survey Annual Social and Economic Supplement microdata. Specifically, we used household survey data to approximate the national average number of covered individuals on employer-sponsored plans with three or more members.
To estimate the premium per covered individual within each state, we multiplied the estimated number of enrollees in each coverage type with its respective average premium for that coverage type and added the values across all coverage types. Then, we divided this number by the estimated total number of covered individuals in the state. We took the same approach to estimate the average enrollee contribution to premiums per covered individual (the amount of the premium each covered individual is responsible for after accounting for employer contributions) for each of the 33 states.
Then, we estimated average premium and enrollee contribution to premium amounts per covered individual across all 33 states. We did this by weighting both the average premium per covered individual in each state and the average enrollee contribution to premium per covered individual in that state by the proportion of estimated total covered individuals in that state relative to the estimated total number of covered individuals across all 33 states.[56] In addition, we estimated average premium and enrollee contribution to premiums’ amounts for each type of coverage type—single, employee-plus-one, and family—separately. These averages across all 33 states were weighted by the number of enrolled employees in each state.
The estimated premium and enrollee contribution to premiums per covered individual depended on the approximated average number of individuals per family coverage plan. While this approximation and associated confidence intervals account for sampling error, there are other factors involved in applying this approximation to the MEPS-IC analysis that may create non-sampling errors.[57] To test the sensitivity of our calculations to the average number of individuals on a family plan, we conducted a sensitivity analysis. We calculated employee-weighted individual premiums and premium contributions per covered individual with approximated family policy sizes above and below our original 3.83 approximation, and assuming the same standard error of 0.066 as the original 3.83 approximation. Based on these results we believe it is reasonable to conclude that the employee-weighted average employer-sponsored plan premium per covered individual is lower, and the average enrollee contribution to premiums per covered individual is higher, than the corresponding averages for all Marketplace plans.[58] However, the magnitude of these differences remains uncertain due to both sampling and non-sampling measurement error.
For our analysis of cost sharing and plan benefits in employer-sponsored plans, we estimated average deductibles, out-of-pocket maximums, copays, coinsurance rates, and enrollee benefit coverage across the 33 states.[59] For example, when calculating the average copay for a physician visit, we weighted each state average from MEPS-IC data by the estimated number of employees in that state that were enrolled in plans that had a physician copay, which was calculated by multiplying the estimated percentage of enrolled employees with such a copay by the estimated number of enrolled employees in the state.
The MEPS-IC survey data on plan cost sharing were more limited than Marketplace plan data. We selected cost-sharing elements that were present in both the MEPS-IC and the CMS Marketplace data. These included individual in-network deductible; individual in-network out-of-pocket maximum; and average in-network copay and coinsurance for provider services (a general doctor visit and a specialist visit) and prescription drugs (generic, preferred, non-preferred, and specialty).[60] For our calculations of average copays and coinsurance of these cost-sharing elements, any plans that did not have that cost-sharing element were excluded from the calculation.
Because of complexities of plan design for deductibles, as well as limitations in the detail available in the MEPS-IC data, we focused our comparison of deductible amounts on individual medical deductibles for in-network services. This may have included plans that had a total deductible that pertained to both medical services and drugs or a separate deductible for medical services—which we refer to throughout this report collectively as medical deductibles. We did not include separate amounts for separate drug deductibles in these calculations, though we did use national MEPS-IC data to describe average drug deductibles and the percentage of enrolled employees with separate drug deductibles. The MEPS-IC provides an estimated average individual medical deductible amount for those employees enrolled in single plans with deductibles. We also calculated the average individual medical deductible amount accounting for all enrolled employees in single plans, including those in plans without a medical deductible.[61]
For our analysis on plan benefits, we selected two benefits (mental health care and substance abuse treatment) that were present in MEPS-IC data and CMS Marketplace data. The MEPS-IC provides estimates of the percent of employees enrolled in plans that cover seven benefits (chiropractic care, routine vision care for children and adults, routine dental care for children and adults, mental health care, and substance abuse treatment), and one delivery method (telemedicine). However, because of the challenges in measuring certain types of care—for example vision and dental care may be accessed through separate coverage, we focused on mental health care and substance abuse treatment for our analysis. We calculated an overall average percentage of enrolled employees whose plan covered each of these two benefits, weighting the MEPS-reported state average by the number of enrolled employees in each of the 33 states.
Because the MEPS-IC is a sample survey, all MEPS-IC data used for this report are estimates. We used the linear combination method to estimate confidence intervals for all MEPS-IC estimates. The linear combination method is a method for approximating standard errors using MEPS-IC tabulated estimates and standard errors because we did not have the microdata. We used the formulas below to combine the tabulated standard errors based on how the estimates were calculated. In the formulas, A, B, C, X, Y, and Z are random variables. We assumed that covariances between random variables were 0.
·
Addition or subtraction: 
·
Multiplication or division: 
We express our confidence in the estimates with a 95 percent confidence interval.[62] The 95 percent confidence intervals were calculated as the estimate ± 1.96 x standard error.
Finally, we also obtained publicly available tabulated national level MEPS-IC data on enrollees in private sector establishments from the AHRQ website broken down by industry type. We used this data to describe how average single plan premiums, enrollee contributions to premiums, deductibles, and out-of-pocket maximums varied across industries. We used MEPS-IC publicly reported standard errors to estimate 95 percent confidence intervals for those nationally reported numbers ± 1.96 x MEPS-IC nationally reported standard error.
Marketplace Plan Data
To calculate the average premium and premium contribution per covered individual and cost sharing and plan benefits of Marketplace plans, we used individual market data from CMS, the unit of HHS responsible for overseeing the establishment of these Marketplaces.[63] Specifically, for our analysis of premiums for Marketplace plans, we used the publicly available CMS Open Enrollment Period State, Metal Level, and Enrollment Public Use File. These data include information on average premiums, premium tax credits, and premiums after premium tax credits by state and metal tier, and include information on bronze, silver, and gold tiers, as well as for the platinum and catastrophic tiers that we did not include in our analysis.[64] Because some CMS Marketplace data were only available for those states that used the Healthcare.gov platform, we limited our analysis to the 33 states that used that platform in 2022.[65]
In reporting its average premium and premium tax credit data, CMS calculates this information as per covered individual per month values in all states, reflecting the average premium and the average premium after premium tax credit for all covered individuals in a given metal tier.[66] For our premiums analysis, we used monthly premium per covered individual data as well as the per covered individual contributions to premiums, which in CMS data are reflected in the average premium after subtracting the advance premium tax credit values from the premiums.[67] We then used these data, which are available in the CMS data for bronze, silver, and gold tier plans, and calculated weighted average monthly premiums and enrollee contributions to premiums for the three tiers combined per covered individual across the 33 selected states. We also examined these data by metal tier to understand how premiums varied by actuarial value (AV). Finally, we used these data to describe metal tier enrollment by income as a percentage of federal poverty level. When comparing these income distributions across metal tiers, we used CMS data that includes only those individuals with known incomes. For the purposes of this analysis, we use plan selection as a proxy for enrollment when calculating covered individual-weighted values across the 33 states.[68]
For our analysis of cost sharing and plan benefits, we also calculated enrollment-weighted averages. To do so, we used publicly available data from CMS’s Center for Consumer Information and Insurance Oversight Plan Attributes and Benefits and Cost-Sharing Public Use Files and weighted these data using data provided by CMS on enrollment of all covered individuals by health plan and by CSR plan variant. This plan variant level enrollment data, which is based on effectuated enrollment, allowed us to describe enrollment-weighted cost sharing and plan benefits information by metal tier.[69]
As noted above, we selected cost-sharing elements that were present in both the CMS Marketplace data and in the data source we use for employer-sponsored plans—MEPS-IC. These included individual in-network medical deductible; individual in-network out-of-pocket maximum; and average in-network copay and coinsurance for provider services (a general doctor visit and a specialist visit), and for prescription drugs (generic, preferred, non-preferred, and specialty).[70] In the case of the individual medical deductible, as noted above, our calculation of total average deductible amounts included the enrollment-weighted average of covered individuals with total deductibles (i.e. deductibles that pertain to both medical and drug expenses) as well as a those with separate medical deductible. We refer to these broadly as medical deductibles. These calculations did not include amounts for separate drug deductibles. For context, we also described the extent to which covered individuals were enrolled in plans with separate drug deductibles, and the average drug deductible for Marketplace plan enrollees with a drug deductible.
For our calculations of average copays and coinsurance, any plan that did not have that cost-sharing element was excluded from the calculation. We calculated copays and coinsurance, and the percentage of covered individuals in plans with those elements, with zero value copays and coinsurance excluded. We took this approach because MEPS-IC data, which we used to develop our employer-sponsored plan cost-sharing estimates, did not have sufficient information to develop average copays and coinsurance amounts that would include zero values. For our analysis on plan benefits, as noted above, we selected two benefits (mental health care and substance abuse treatment) that were present in both CMS Marketplace and MEPS-IC data, and calculated the average percentage of covered individuals across the 33 selected states who were in plans covering these benefits.
Other Data Sources
To describe how the loss of federal payments to reimburse issuers for CSRs affected Marketplace enrollees, we conducted a literature search to identify papers published between January 2019 and September 2023 that focused on this issue. As we previously reported, issuers in most states responded to the end of federal payments by increasing the premiums they charged for silver tier plans—an approach commonly referred to as “silver loading.”[71] As such, our literature search focused on papers that referenced silver loading and the papers chosen for review included those that examined the effects of silver loading on Marketplace enrollment and premiums; the differential effects of silver loading by geographic area; the differential effects of different state responses; and factors that affected state and issuer decisions on how to offset the end of federal payments.[72]
We also analyzed CMS Open Enrollment Period public use file state-level data on average silver and bronze plan premiums and average advance premium tax credits from 2017 and 2018, the year prior to and the first year during the loss of federal payments for CSRs. As described above, in these data CMS calculates this information as per member per month values in all states, an enrollment-weighted approach resulting in average values for these variables per covered individual. We used these data to describe changes in premiums and premium tax credits across these two years for the 33 states that used the federal Healthcare.gov platform in 2022.
To inform each of our findings, we interviewed officials from AHRQ, CMS, the Department of the Treasury, and representatives from six organizations selected to reflect a range of expertise on the topics under review. Specifically, we spoke with organizations representing insurers, employers, insurance regulators, actuaries, and health policy researchers.
We conducted this performance audit from April 2023 to November 2024 in accordance with generally accepted government auditing standards. Those standards require that we plan and perform the audit to obtain sufficient, appropriate evidence to provide a reasonable basis for our findings and conclusions based on our audit objectives. We believe that the evidence obtained provides a reasonable basis for our findings and conclusions based on our audit objectives.
Our review of 2022 data for employer-sponsored and Marketplace plans in the 33 selected states found that our estimates of enrollment-weighted average copays and coinsurance were generally either similar or lower for employer-sponsored plans compared to Marketplace plans. The averages for the different Marketplace tiers varied—some were higher and some were lower than estimated averages for employer-sponsored plans. Additionally, the nuances of plan design may complicate analyses of copays and coinsurance. See tables 14-17 for average copays, coinsurance, and percentage of enrollees with these plan elements for prescription drugs, and tables 18 and 19 for general and specialty physician services.
|
Plan type |
Copay (95 percent confidence interval) |
Percentage of enrollees with a copay (95 percent confidence interval) |
Coinsurance (95 percent confidence interval) |
Percentage of enrollees with coinsurance (95 percent confidence interval) |
|
Employer-sponsored plans (estimate)a |
$12 ($11-$12) |
68% (65%-72%) |
20% (18%-23%) |
23% (21%-25%) |
|
Marketplace plansb |
$15 |
60% |
26% |
5% |
|
Bronze tier, 60% actuarial value (AV) |
$22 |
74% |
32% |
8% |
|
Silver tier with no cost-sharing reduction (CSR), 70% AV |
$17 |
86% |
23% |
5% |
|
Silver CSR tier with 73% AV |
$15 |
86% |
22% |
5% |
|
Silver CSR tier with 87% AV |
$10 |
80% |
18% |
3% |
|
Silver CSR tier with 94% AV |
$5 |
29% |
14% |
2% |
|
Gold tier, 80% AV |
$11 |
77% |
14% |
3% |
Source: GAO analysis of Centers for Medicare & Medicaid Services and Agency for Healthcare Research and Quality MEPS-IC data. | GAO‑25‑106798
Notes: While this table describes average cost sharing for certain types of covered benefits, preventive care services like mammograms and behavioral health screenings are provided for no cost for all Marketplace plans and for most employer-sponsored plans.
Average copays reflect plans that have a non-zero value for copays. Average coinsurance reflect plans that have a non-zero percentage of coinsurance. Averages in the table are enrollment-weighted.
A health plan’s AV is a measure of the relative generosity of a plan’s benefits that is expressed as a percentage of the covered medical expenses expected to be paid by the insurer on average. Covered individuals who have household incomes between 100 and 250 percent of the federal poverty level who are eligible for premium tax credits and select silver tier plans are also eligible to receive CSRs that further reduce out-of-pocket costs and increase the AV of their plans.
aOur estimates for employer-sponsored plans were based on Medical Expenditure Panel Survey Insurance Component (MEPS-IC) data and were limited to plans offered by private sector employers. We used MEPS-IC data that were reported at the per employee level to weight average copays and coinsurance across the 33 selected states.
bMarketplace plans refers to bronze, silver, and gold tier plans combined. Our analysis did not include catastrophic or platinum tier Marketplace plans. Marketplace data are reported at a per covered individual level. The Marketplace data include individual plan enrollments in the 33 states that used the Healthcare.gov platform, whether consumers enrolled directly into plans using the platform or enrolled through a third party, such as an agent or broker.
|
Plan type |
Copay (95 percent confidence interval) |
Percentage of enrollees with a copay (95 percent confidence interval) |
Coinsurance (95 percent confidence interval) |
Percentage of enrollees with coinsurance (95 percent confidence interval) |
|
Employer-sponsored plans (estimate)a |
$36 ($33-$38) |
64% (60%-67%) |
25% (23%-27%) |
33% (31%-36%) |
|
Marketplace plansb |
$68 |
62% |
34% |
27% |
|
Bronze tier, 60% actuarial value (AV) |
$196 |
36% |
42% |
37% |
|
Silver tier with no cost-sharing reduction (CSR), 70% AV |
$74 |
76% |
35% |
22% |
|
Silver CSR tier with 73% AV |
$70 |
73% |
35% |
24% |
|
Silver CSR tier with 87% AV |
$46 |
77% |
31% |
20% |
|
Silver CSR tier with 94% AV |
$22 |
72% |
24% |
24% |
|
Gold tier, 80% AV |
$48 |
84% |
25% |
15% |
Source: GAO analysis of Centers for Medicare & Medicaid Services and Agency for Healthcare Research and Quality MEPS-IC data. | GAO‑25‑106798
Notes: While this table describes average cost sharing for certain types of covered benefits, preventive care services like mammograms and behavioral health screenings are provided for no cost for all Marketplace plans and for most employer-sponsored plans.
Average copays reflect plans that have a non-zero value for copays. Average coinsurance reflect plans that have a non-zero percentage of coinsurance. Averages in the table are enrollment-weighted.
A health plan’s AV is a measure of the relative generosity of a plan’s benefits that is expressed as a percentage of the covered medical expenses expected to be paid by the insurer on average. Covered individuals who have household incomes between 100 and 250 percent of the federal poverty level who are eligible for premium tax credits and select silver tier plans are also eligible to receive CSRs that further reduce out-of-pocket costs and increase the AV of their plans.
aOur estimates for employer-sponsored plans were based on Medical Expenditure Panel Survey Insurance Component (MEPS-IC) data and were limited to plans offered by private sector employers. We used MEPS-IC data that were reported at the per employee level to weight average copays and coinsurance across the 33 selected states.
bMarketplace plans refers to bronze, silver, and gold tier plans combined. Our analysis did not include catastrophic or platinum tier Marketplace plans. Marketplace data are reported at a per covered individual level. The Marketplace data include individual plan enrollments in the 33 states that used the Healthcare.gov platform, whether consumers enrolled directly into plans using the platform or enrolled through a third party, such as an agent or broker.
|
Plan type |
Copay (95 percent confidence interval) |
Percentage of enrollees with a copay (95 percent confidence interval) |
Coinsurance (95 percent confidence interval) |
Percentage of enrollees with coinsurance (95 percent confidence interval) |
|
Employer-sponsored plans (estimate)a |
$64 ($60-$68) |
61% (58%-65%) |
33% (30%-36%) |
35% (33%-38%) |
|
Marketplace plansb |
$102 |
15% |
42% |
72% |
|
Bronze tier, 60% actuarial value (AV) |
$185 |
6% |
48% |
65% |
|
Silver tier with no cost-sharing reduction (CSR), 70% AV |
$157 |
18% |
45% |
77% |
|
Silver CSR tier with 73% AV |
$142 |
17% |
45% |
78% |
|
Silver CSR tier with 87% AV |
$98 |
16% |
42% |
79% |
|
Silver CSR tier with 94% AV |
$63 |
18% |
38% |
77% |
|
Gold tier, 80% AV |
$108 |
32% |
39% |
67% |
Source: GAO analysis of Centers for Medicare & Medicaid Services and Agency for Healthcare Research and Quality MEPS-IC data. | GAO‑25‑106798
Notes: While this table describes average cost sharing for certain types of covered benefits, preventive care services like mammograms and behavioral health screenings are provided for no cost for all Marketplace plans and for most employer-sponsored plans.
Average copays reflect plans that have a non-zero value for copays. Average coinsurance reflect plans that have a non-zero percentage of coinsurance. Averages in the table are enrollment-weighted.
A health plan’s AV is a measure of the relative generosity of a plan’s benefits that is expressed as a percentage of the covered medical expenses expected to be paid by the insurer on average. Covered individuals who have household incomes between 100 and 250 percent of the federal poverty level who are eligible for premium tax credits and select silver tier plans are also eligible to receive CSRs that further reduce out-of-pocket costs and increase the AV of their plans.
aOur estimates for employer-sponsored plans were based on Medical Expenditure Panel Survey Insurance Component (MEPS-IC) data and were limited to plans offered by private sector employers. We used MEPS-IC data that were reported at the per employee level to weight average copays and coinsurance across the 33 selected states.
bMarketplace plans refers to bronze, silver, and gold tier plans combined. Our analysis did not include catastrophic or platinum tier Marketplace plans. Marketplace data are reported at a per covered individual level. The Marketplace data include individual plan enrollments in the 33 states that used the Healthcare.gov platform, whether consumers enrolled directly into plans using the platform or enrolled through a third party, such as an agent or broker.
|
Plan type |
Copay (95 percent confidence interval) |
Percentage of enrollees with a copay (95 percent confidence interval) |
Coinsurance (95 percent confidence interval) |
Percentage of enrollees with coinsurance (95 percent confidence interval) |
|
Employer-sponsored plans (estimate)a |
$112 |
43% |
26% |
42% |
|
Marketplace plansb |
$289 |
6% |
43% |
82% |
|
Bronze tier, 60% actuarial value (AV) |
$680 |
2% |
49% |
70% |
|
Silver tier with no cost-sharing reduction (CSR), 70% AV |
$301 |
9% |
46% |
86% |
|
Silver CSR tier with 73% AV |
$297 |
7% |
46% |
88% |
|
Silver CSR tier with 87% AV |
$216 |
7% |
44% |
88% |
|
Silver CSR tier with 94% AV |
$197 |
7% |
39% |
87% |
|
Gold tier, 80% AV |
$313 |
12% |
42% |
87% |
Source: GAO analysis of Centers for Medicare & Medicaid Services and Agency for Healthcare Research and Quality MEPS-IC data. | GAO‑25‑106798
Notes: While this table describes average cost sharing for certain types of covered benefits, preventive care services like mammograms and behavioral health screenings are provided for no cost for all Marketplace plans and for most employer-sponsored plans.
Average copays reflect plans that have a non-zero value for copays. Average coinsurance reflect plans that have a non-zero percentage of coinsurance. Averages in the table are enrollment-weighted.
A health plan’s AV is a measure of the relative generosity of a plan’s benefits that is expressed as a percentage of the covered medical expenses expected to be paid by the insurer on average. Covered individuals who have household incomes between 100 and 250 percent of the federal poverty level who are eligible for premium tax credits and select silver tier plans are also eligible to receive CSRs that further reduce out-of-pocket costs and increase the AV of their plans.
aOur estimates for employer-sponsored plans were based on Medical Expenditure Panel Survey Insurance Component (MEPS-IC) data and were limited to plans offered by private sector employers. We used MEPS-IC data that were reported at the per employee level to weight average copays and coinsurance across the 33 selected states.
bMarketplace plans refers to bronze, silver, and gold tier plans combined. Our analysis did not include catastrophic or platinum tier Marketplace plans. Marketplace data are reported at a per covered individual level. The Marketplace data include individual plan enrollments in the 33 states that used the Healthcare.gov platform, whether consumers enrolled directly into plans using the platform or enrolled through a third party, such as an agent or broker.
|
Plan type |
Copay (95 percent confidence interval) |
Percentage of enrollees with a copay (95 percent confidence interval) |
Coinsurance (95 percent confidence interval) |
Percentage of enrollees with coinsurance (95 percent confidence interval) |
|
Employer-sponsored plans (estimate)a |
$28 ($26-$30) |
56% (53%-59%) |
20% (19%-22%) |
38% (35%-40%) |
|
Marketplace plansb |
$28 |
49% |
31% |
5% |
|
Bronze tier, 60% actuarial value (AV) |
$47 |
52% |
40% |
9% |
|
Silver tier with no cost-sharing reduction (CSR), 70% AV |
$33 |
87% |
25% |
4% |
|
Silver CSR tier with 73% AV |
$26 |
81% |
25% |
4% |
|
Silver CSR tier with 87% AV |
$13 |
67% |
20% |
4% |
|
Silver CSR tier with 94% AV |
$7 |
23% |
13% |
3% |
|
Gold tier, 80% AV |
$23 |
84% |
21% |
5% |
Source: GAO analysis of Centers for Medicare & Medicaid Services and Agency for Healthcare Research and Quality MEPS-IC data. | GAO‑25‑106798
Notes: While this table describes average cost sharing for certain types of covered benefits, preventive care services like mammograms and behavioral health screenings are provided for no cost for all Marketplace plans and for most employer-sponsored plans.
Average copays reflect plans that have a non-zero value for copays. Average coinsurance reflect plans that have a non-zero percentage of coinsurance. Averages in the table are enrollment weighted.
A health plan’s AV is a measure of the relative generosity of a plan’s benefits that is expressed as a percentage of the covered medical expenses expected to be paid by the insurer on average. Covered individuals who have household incomes between 100 and 250 percent of the federal poverty level who are eligible for premium tax credits and select silver tier plans are also eligible to receive CSRs that further reduce out-of-pocket costs and increase the AV of their plans.
aOur estimates for employer-sponsored plans were based on Medical Expenditure Panel Survey Insurance Component (MEPS-IC) data and were limited to plans offered by private sector employers. We used MEPS-IC data that were reported at the per employee level to weight average copays and coinsurance across the 33 selected states.
bMarketplace plans refers to bronze, silver, and gold tier plans combined. Our analysis did not include catastrophic or platinum tier Marketplace plans. Marketplace data are reported at a per covered individual level. The Marketplace data include individual plan enrollments in the 33 states that used the Healthcare.gov platform, whether consumers enrolled directly into plans using the platform or enrolled through a third party, such as an agent or broker.
|
Plan type |
Copay (95 percent confidence interval) |
Percentage of enrollees with a copay (95 percent confidence interval) |
Coinsurance (95 percent confidence interval) |
Percentage of enrollees with coinsurance (95 percent confidence interval) |
|
Employer-sponsored plans (estimate)a |
$48 ($45-$52) |
56% (53%-59%) |
22% (20%-23%) |
39% (37%-42%) |
|
Marketplace plansb |
$41 |
72% |
34% |
17% |
|
Bronze tier, 60% actuarial value (AV) |
$85 |
56% |
44% |
21% |
|
Silver tier with no cost-sharing reduction (CSR), 70% AV |
$70 |
84% |
36% |
14% |
|
Silver CSR tier with 73% AV |
$59 |
80% |
36% |
17% |
|
Silver CSR tier with 87% AV |
$28 |
82% |
30% |
15% |
|
Silver CSR tier with 94% AV |
$10 |
79% |
22% |
15% |
|
Gold tier, 80% AV |
$46 |
75% |
29% |
23% |
Source: GAO analysis of Centers for Medicare & Medicaid Services and Agency for Healthcare Research and Quality MEPS-IC data. | GAO‑25‑106798
Notes: While this table describes average cost sharing for certain types of covered benefits, preventive care services like mammograms and behavioral health screenings are provided for no cost for all Marketplace plans and for most employer-sponsored plans.
Average copays reflect plans that have a non-zero value for copays. Average coinsurance reflect plans that have a non-zero percentage of coinsurance. Averages in the table are enrollment-weighted.
A health plan’s AV is the percentage of total average costs for covered benefits that a plan will cover. Covered individuals who have household incomes between 100 and 250 percent of the federal poverty level who are eligible for premium tax credits and select silver tier plans are also eligible to receive CSRs that further reduce out-of-pocket costs and increase the AV of their plans.
aOur estimates for employer-sponsored plans were based on Medical Expenditure Panel Survey Insurance Component (MEPS-IC) data and were limited to plans offered by private sector employers. We used MEPS-IC data that were reported at the per employee level to weight average copays and coinsurance across the 33 selected states.
bMarketplace plans refers to bronze, silver, and gold tier plans combined. Our analysis did not include catastrophic or platinum tier Marketplace plans. Marketplace data are reported at a per covered individual level. The Marketplace data include individual plan enrollments in the 33 states that used the Healthcare.gov platform, whether consumers enrolled directly into plans using the platform or enrolled through a third party, such as an agent or broker.
GAO Contact
John E. Dicken, (202) 512-7114 or DickenJ@gao.gov
Staff Acknowledgments
In addition to the contact named above, Gerardine Brennan (Assistant Director), Luke Baron (Analyst-in-Charge), Gail-Lynn Michel, and Priyanka Panjwani made key contributions to this report. Laura Elsberg, Julianne Flowers, Joy Grossman, Emei Li, Daniel Mahoney, Eric Peterson, Jennifer Rudisill, MaryLynn Sergent, Yinghua Shi, Roxanna Sun, Frank Todisco, Jack Wang, Nicole Willis, and Sirin Yaemsiri also made important contributions.
GAO’s Mission
The Government Accountability Office, the audit, evaluation, and investigative arm of Congress, exists to support Congress in meeting its constitutional responsibilities and to help improve the performance and accountability of the federal government for the American people. GAO examines the use of public funds; evaluates federal programs and policies; and provides analyses, recommendations, and other assistance to help Congress make informed oversight, policy, and funding decisions. GAO’s commitment to good government is reflected in its core values of accountability, integrity, and reliability.
Obtaining Copies of GAO Reports and Testimony
The fastest and easiest way to obtain copies of GAO documents at no cost is through our website. Each weekday afternoon, GAO posts on its website newly released reports, testimony, and correspondence. You can also subscribe to GAO’s email updates to receive notification of newly posted products.
Order by Phone
The price of each GAO publication reflects GAO’s actual cost of production and distribution and depends on the number of pages in the publication and whether the publication is printed in color or black and white. Pricing and ordering information is posted on GAO’s website, https://www.gao.gov/ordering.htm.
Place orders by calling (202) 512-6000, toll free (866) 801-7077,
or
TDD (202) 512-2537.
Orders may be paid for using American Express, Discover Card, MasterCard, Visa, check, or money order. Call for additional information.
Connect with GAO
Connect with GAO on Facebook, Flickr, X, and YouTube.
Subscribe to our RSS Feeds or Email Updates. Listen to our Podcasts.
Visit GAO on the web at https://www.gao.gov.
To Report Fraud, Waste, and Abuse in Federal Programs
Contact FraudNet:
Website: https://www.gao.gov/about/what-gao-does/fraudnet
Automated answering system: (800) 424-5454 or (202) 512-7700
Congressional Relations
A. Nicole Clowers, Managing Director, ClowersA@gao.gov, (202) 512-4400, U.S. Government Accountability Office, 441 G Street NW, Room 7125, Washington, DC 20548
Public Affairs
Sarah Kaczmarek, Managing Director, KaczmarekS@gao.gov, (202) 512-4800, U.S.
Government Accountability Office, 441 G Street NW, Room 7149
Washington, DC 20548
Strategic Planning and External Liaison
Stephen J. Sanford, Managing
Director, spel@gao.gov, (202) 512-4707
U.S. Government Accountability Office, 441 G Street NW, Room 7814, Washington,
DC 20548
[1]See Pub. L. No. 111-148, 124 Stat. 119 (2010), as amended by the Health Care and Education Reconciliation Act of 2010, Pub. L. No. 111-152, 124 Stat. 1029. In this report, any references to PPACA include any amendments made by the Health Care and Education Reconciliation Act of 2010.
See Gary Claxton and Matthew Rae, What are the Recent Trends in Employer-based Health Coverage?, (Peterson-KFF Health System Tracker, Dec. 2023).
[2]In the context of health plan coverage, benefits are the health care items or services covered under a health plan. Cost sharing is the amount that enrollees are generally expected to pay, not including premiums, for the health services they use under their plan.
[3]We used publicly available state-level tabular data from the MEPS-IC, which includes active enrollees employed by private sector employers. It does not include data for public employers and does not include data for retirees or those with health insurance continuation coverage, commonly known as COBRA.
[4]We did not include Small Business Health Options Program plans in our analysis of Marketplace plans.
[5]States can either use the federal eligibility and enrollment platform (Healthcare.gov) or run their own state-based Marketplace. In 2022, 33 states used the federal Healthcare.gov platform: Alaska, Alabama, Arkansas, Arizona, Delaware, Florida, Georgia, Hawaii, Iowa, Illinois, Indiana, Kansas, Louisiana, Michigan, Missouri, Mississippi, Montana, North Carolina, North Dakota, Nebraska, New Hampshire, Ohio, Oklahoma, Oregon, South Carolina, South Dakota, Tennessee, Texas, Utah, Virginia, Wisconsin, West Virginia, and Wyoming.
The data we used included all individual plan Marketplace enrollments in the 33 states that used the Healthcare.gov platform, whether consumers enrolled directly into plans using the platform or enrolled through a third party, such as an agent or broker.
[6]Enrollment-weighting our analysis allowed us to capture the average experienced premiums, rather than just taking an average of the premiums of all offered plans. For example, if one plan has a monthly premium of $100 and 10 enrollees, and a second plan has a premium of $1,000 and 90 enrollees, the enrollment-weighted average premium would be $910, while the non-enrollment-weighted average premium would be $550.
[7]To calculate these averages, CMS uses plan selection as a proxy for enrollment. CMS defines the plan selection count as the number of unique consumers as of January 15, 2022, with a non-canceled qualified health plan selection that has an end date of January 31, 2022, or later. CMS notes that plan selections will only become coverage for consumers that effectuate their coverage by paying their first monthly premium. When discussing Marketplace plans, we use enrollee contribution to premium to mean the premium amount that an enrollee pays after any premium tax credits.
[8]PPACA required insurance companies to market certain plans, including individual market plans, according to defined categories (known as metal tiers) that indicate the extent to which the plans are expected to cover the costs of consumers’ medical care. These metal tiers are based on how consumers split costs with their health plans—for example, a consumer with a bronze plan may pay a higher percentage of out-of-pocket costs compared to a consumer with a gold plan.
[9]Premium tax credits for Marketplace plans are refundable, meaning that taxpayers may receive the full amount of the tax credit even if the tax credit is more than their tax liability. Taxpayers can choose for an estimate of their credit to be paid in advance on a monthly basis to the insurer for coverage of themselves and/or family members, or they can choose to get all of the benefit of the credit when they file their tax return for the year. A taxpayer must reconcile the amount of estimated credit paid in advance with the premium tax credit they are eligible for on their income tax return. For the purposes of this report, we use the term premium tax credits to mean either the advance premium tax credit or the premium tax credits claimed during the income tax filing process.
[10]Health plans can be for an individual or for multiple individuals (single, employee-plus-one, and family coverage), and deductible and out-of-pocket maximum amounts typically vary depending on the number of people covered. In-network refers to the health care providers or health care facilities that have a contract with a health plan to provide health care services to plan members. A deductible is the amount the enrollee pays for certain covered health care services before the plan starts to pay. An out-of-pocket maximum is the most an enrollee pays for covered medical expenses in a plan year. A copay is a fixed amount the enrollee pays for a covered health care service. Coinsurance is the percentage of costs of a covered health care service the enrollee pays.
[11]The MEPS-IC survey includes questions about seven services (chiropractic care, routine vision care for children and adults, routine dental care for children and adults, mental health care, and substance abuse treatment), and one delivery method (telemedicine). Because of the challenges in measuring certain types of care—for example, vision and dental care may be accessed through separate coverage—we focused on mental health care and substance abuse treatment for our analysis, both of which are required benefits for Marketplace plans.
[12]All the cost-sharing variables we used were specific to in-network (i.e., copays for in-network services and deductibles for in-network care).
[13]These enrollment data use effectuated enrollment—the number of unique individuals who have been determined eligible to enroll in a Marketplace plan, have selected a plan, and have submitted the first premium payment for a Marketplace plan. Effectuated enrollment is distinct from plan selection.
[14]For employer-sponsored plans, the employer typically withholds salary from its employees to cover the employees’ share of the cost of coverage. This is typically referred to as the employees’ contribution.
[15]Employer-sponsored group health plans include plans provided by an employer, an employee organization (such as a union), or multiple employers through a multiple employer welfare arrangement. Employer-sponsored plans may be self-funded (also referred to as self-insured), where the employer pays for employee health care benefits directly, bearing the risk for covering medical benefits generated by employees. These employers can contract for insurance services such as enrollment, claims, and provider networks with a third-party administrator, or they can be self-administered. Alternatively, employer-sponsored plans can be fully funded (also referred to as fully insured), where the employer purchases coverage from a state-regulated issuer. Although employers are not required to offer health coverage, PPACA included a shared responsibility provision that penalizes certain employers (generally those with 50 or more employees) that do not offer coverage or whose offered coverage does not meet minimum value and affordability standards.
[16]In a self-insured plan, the employer does not pay a premium to an external party because the plan is self-funded.
[17]Tax expenditures are defined in law as revenue losses attributable to provisions of the Federal tax laws which allow a special exclusion, exemption, or deduction from gross income or which provide a special credit, a preferential rate of tax, or a deferral of tax liability. The estimated total for fiscal year 2022 reflects $224.52 billion in forgone individual income tax revenue and $136.99 billion in forgone payroll tax receipts. See Department of the Treasury, Office of Tax Analysis, Tax Expenditures, FY 2024 Update (Mar. 6, 2023).
[18]For the purposes of this report, we use the term “Marketplace plans” to mean individual market qualified health plans. We did not include Small Business Health Options Program plans in our analysis.
[19]A health plan’s actuarial value (AV) is a measure of the relative generosity of a plan’s benefits that is expressed as a percentage of the covered medical expenses expected to be paid, on average, by the insurer for the average consumer of a standard population. In general, as the AV of the plan increases, consumer cost sharing decreases.
[20]Essential health benefits are minimum benefit requirements for all Marketplace plans. All plans offered in the Marketplace cover a core package of 10 essential health benefits: 1) ambulatory patient services, including outpatient care the enrollee receives without being admitted to a hospital; 2) emergency services; 3) hospitalization, including surgery and overnight stays; 4) pregnancy, maternity, newborn care (both before and after birth), breastfeeding coverage, and birth control; 5) mental health and substance use disorder services, including behavioral health treatment (this includes counseling and psychotherapy); 6) prescription drugs; 7) rehabilitative and habilitative services and devices (services and devices to help people with injuries, disabilities, or chronic conditions gain or recover mental and physical skills); 8) laboratory services; 9) preventive and wellness services and chronic disease management; and 10) pediatric services, including oral and vision care. Specific services covered in each broad benefit category can vary based on each state’s requirements.
[21]The estimated total for fiscal year 2022 reflects $61.6 billion in outlays (expenditure accounts) associated with the refundable credit plus $14.7 billion in forgone income tax revenue. See Department of the Treasury, Tax Expenditures, FY 2024 Update.
[22]Premium tax credits are generally only available for households with incomes at or above 100 percent of the federal poverty level. Lawfully present immigrants with incomes less than 100 percent of the federal poverty level may receive premium tax credits if they are ineligible for Medicaid based on immigration status.
[23]See Pub. L. No. 117-2, § 9661, 135 Stat. 4, 182.
In a 2024 estimate, the Joint Committee on Taxation and the Congressional Budget Office estimated that a permanent extension of the American Rescue Plan Act of 2021 expanded eligibility would increase direct spending by $275 billion, on net, over the 2025-2034 period, and would result in 3.4 million more people having health coverage each year, on average, over that same period compared to current law.
[24]See Pub. L. No. 117-169, § 12001, 136 Stat. 1818, 1905.
[25]According to HHS, in all states except New York and Vermont (neither of which were included in our 33 selected states), Marketplace plans have premiums that increase with age and follow an age curve that generally sets the 64-year-old premium to three times higher than the 21-year-old premium. This is true for all states with an age curve, except Massachusetts (also not included in the 33 states), where the 64-year-old to 21-year-old ratio is 2 to 1.
[26]Certain American Indians and Alaska Natives who enroll in Marketplace plans of any metal tier may be eligible for CSRs. For eligible American Indians and Alaska Natives with income between 100 and 300 percent of the federal poverty level, there is zero cost sharing—meaning no requirement to pay copays, deductibles, or coinsurance when getting essential health benefits through a Marketplace plan.
[27]Marketplace plans refers to bronze, silver, and gold tier plans combined. Our analysis did not include catastrophic or platinum tier Marketplace plans.
[28]See GAO, Health Insurance Exchanges: HHS Should Enhance Its Management of Open Enrollment Performance, GAO‑18‑565 (Washington, D.C.: July 24, 2018).
[29]See PPACA § 1251, 124 Stat. at 161. A grandfathered health plan refers to an existing plan in which at least one individual has been enrolled since March 23, 2010. These plans are subject to fewer requirements than plans established later. To maintain grandfathered status, a plan must avoid certain changes to benefits, cost sharing and employer contributions.
As of 2019, an estimated 13 percent of covered workers were enrolled in employer-sponsored plans with grandfathered status. See Kaiser Family Foundation, 2019 Employer Health Benefits Survey, Section 13: Grandfathered Health Plans (San Francisco, Calif.: Sept. 25, 2019).
[30]Marketplace plans refers to bronze, silver, and gold tier plans combined. Our analysis did not include catastrophic or platinum tier Marketplace plans.
[31]The premium for Marketplace plans includes both the enrollee premium contribution and their premium tax credit. The premium for employer-sponsored plans includes both employee and employer premium contributions. All averages are enrollment-weighted. Enrollment-weighting our analysis allows us to capture the average experienced premiums, rather than just taking an average of the premiums of all offered plans. For example, if one plan has a monthly premium of $100 and 10 enrollees, and a second plan has a premium of $1000 and 90 enrollees, the enrollment-weighted average premium across the 100 enrollees would be $910, while the non-enrollment-weighted average premium would be $550.
Our estimate for employer-sponsored plans is based on MEPS-IC data and is limited to plans offered by private sector employers. We used MEPS-IC data that were reported on a per enrolled employee level as the basis to estimate the average monthly premium per covered individuals.
[32]See Paul Fronstin, et al., The More Things Change, the More They Stay the Same: An Analysis of the Generosity of Employment-Based Health Insurance, 2013–2019, Issue Brief, no. 545, (Employee Benefit Research Institute, Oct. 28, 2021); and Larry Levitt and Gary Claxton, Focus on Health Reform: What the Actuarial Values in the Affordable Care Act Mean, Issue Brief, (Menlo Park , Calif.: Kaiser Family Foundation, Apr. 2011).
[33]Differences across industries can reflect both the nature of the work and the age profile of the workforce. For example, the retail workforce tends to be younger, while the financial services workforce tends to be older.
[34]According to HHS, in all states except New York and Vermont (neither of which were included in our 33 selected states), Marketplace plans have premiums that increase with age and follow a standard age curve that generally sets the 64-year-old premium to three times higher than the 21-year-old premium. This is true for all states with an age curve, except Massachusetts (also not included in the 33 states), where the age 64 to age 21-year-old ratio is 2 to 1.
[35]In 2022, 32 percent of all Marketplace enrollees had a premium less than or equal to $10.00 per month. In the same year, according to national MEPS-IC data for private sector employees, an estimated 14 percent of employees in single coverage plans were in a plan that did not require an employee contribution (CI 13 percent-15 percent), an estimated 7 percent of employees in employee-plus-one coverage plans were in a plan that did not require an employee contribution (CI 6 percent-8 percent), and an estimated 7 percent of enrollees in family coverage plans were in plans that did not require an employee contribution (CI 6 percent-8 percent).
[36]Employee and employer contributions to an employer-sponsored health plan are made with pre-tax dollars. Thus, the tax benefit for an employer-sponsored plan would vary across employees based on the income and tax rate of the enrollee.
[37]In-network refers to the health care providers or health care facilities that have a contract with a health plan to provide health care services to plan members. Plans typically have different cost-sharing features for services obtained out-of-network or may not cover out-of-network services.
[38]We did not include separate drug deductibles in these calculations.
[39]When determining the percentage of Marketplace enrollees in a plan with a medical deductible, we included enrollees with a non-zero value for medical deductible or combined medical and drug deductible.
[40]According to the Kaiser Family Foundation, as of 2019, an estimated 13 percent of covered workers were enrolled in employer-sponsored plans with grandfathered status. See Kaiser Family Foundation, 2019 Employer Health Benefits Survey, Section 13: Grandfathered Health Plans. This survey includes both private sector and non-federal public sector employers.
[41]The MEPS-IC survey includes questions about seven services (chiropractic care, routine vision care for children and adults, routine dental care for children and adults, mental health care, and substance abuse treatment), and one delivery method (telemedicine). Because of the challenges in measuring certain types of care—for example vision and dental care may be accessed through separate coverage, we focused on mental health care and substance abuse treatment for our analysis, both of which are required benefits for Marketplace plans.
[42]Matthew Fiedler, The Case for Replacing ‘Silver Loading,’ Issue Brief (Washington, D.C.: Brookings Institution, May 20, 2021).
[43]See Douglas Keith Branham and Thomas DeLeire, “Zero-Premium Health Insurance Plans Became More Prevalent In Federal Marketplaces In 2018,” Health Affairs, vol. 38, no.5 (2019): 820-825.
[44]See Coleman Drake and David M. Anderson, “Terminating Cost-Sharing Reduction Subsidy Payments: The Impact of Marketplace Zero-Dollar Premium Plans on Enrollment,” Health Affairs, vol. 39, no.1 (2020): 41-49.
[45]See Sarah A. Nowak, Jodi L. Liu, Preethi Rao, Options for Reinvesting Savings from Restored Federal Cost- Sharing Reduction Payments: Examining the Effects of Two Policy Alternatives on Spending and Enrollment in the Individual Health Insurance Market” (Santa Monica, Calif.: RAND Corporation, 2019).
[46]See Erik Wengle and Linda Blumberg, Marketplace Coverage Enrollment by Metal Tier, 2016-18: Trends in States Using the Healthcare.gov Enrollment Platform (Washington, D.C.: Urban Institute 2020).
[47]See Joyce Bohl et al, “Paying For ACA Cost-Sharing Reductions: Are Premiums Too Low Or Too High?” Health Affairs Forefront. (Dec. 2022); Andrew Spring and David M. Anderson, Mining the Silver Lode, Health Affairs Blog (Washington, D.C.: Sept. 2018); and John Holahan et al, What’s Behind 2018 and 2019 Marketplace Insurer Participation and Pricing Decisions? (Washington, D.C: Urban Institute, 2019).
[48]See Holahan et al, What’s Behind 2018 and 2019 Marketplace Insurer Participation.
[49]Regarding enrollment change driven by existing or new entrants, see Drake and Anderson, “Terminating Cost-Sharing Reduction Subsidy Payments,” 41-49.
For California focused studies, see Petra W. Rasmussen, Thomas Rice, and Gerald F. Kominski, “California’s New Gold Rush: Marketplace Enrollees Switch To Gold-Tier Plans In Response To Insurance Premium Changes,” Health Affairs, vol. 38, no. 11 (2019), 1902-1910. This study found that during the 2017-2018 open enrollment period, for re-enrollees who switched metal tiers in each year, 36.69 percent of these re-enrollees moved into gold tier plans, compared to 9.55-12.21 percent in previous periods.
See also Petra Rasmussen and David Anderson, “When All That Glitters Is Gold: Dominated Plan Choice on Covered California for the 2018 Plan Year,” The Milbank Quarterly, vol. 99, no.4 (2021): 1059-1087. This study found that for 2015-2017, between 76.3 and 82.8 percent of enrollees with income above 200 percent of the federal poverty level who had been enrolled in certain Kaiser and Sharp silver tier plans in the prior year again chose one of the silver tier plans. However, in 2018, according to this study, when these plans became inferior—i.e., a silver tier plan with higher cost sharing and a higher premium than a gold tier plan), the number of enrollees who again chose one of the silver plans decreased to 40 percent.
[50]In the MEPS-IC, respondents are asked to report total premiums for fully insured plans and to report total premium equivalents for self-insured plans.
[51]Because MEPS-IC is an establishment survey, the state specifics reflect the location of the establishment rather than where the employees live, which may be in a different state. For employers with establishments in multiple states, the respondents are representative of the particular establishments in the given states that receive the survey rather than for all establishments that are part of the larger business across multiple states.
[52]In 2022, the response rate for private sector establishments was 54.6 percent and the response rate for state and local governments was 88.2 percent. AHRQ’s survey analysis methodology included using weights that were designed to account for the non-response to reduce bias attributable to survey non-response.
[53]States can either use the federal eligibility and enrollment platform (Healthcare.gov) or run their own state-based Marketplace. In 2022, 33 states used the federal Healthcare.gov platform: Alaska, Alabama, Arkansas, Arizona, Delaware, Florida, Georgia, Hawaii, Iowa, Illinois, Indiana, Kansas, Louisiana, Michigan, Missouri, Mississippi, Montana, North Carolina, North Dakota, Nebraska, New Hampshire, Ohio, Oklahoma, Oregon, South Carolina, South Dakota, Tennessee, Texas, Utah, Virginia, Wisconsin, West Virginia, and Wyoming.
[54]Additionally, MEPS-IC premium data are reported as the annual premium and premium contribution amounts. To better compare this data to Marketplace premium data, we divided annual premiums by 12 and reported estimated average monthly premiums and premium contributions.
[55]This estimate, which we developed independently, is similar to a family policy covered-life size estimate of 3.89 by Paul Fronstin in an October 2020 issue brief. See Paul Fronstin and Stephen A. Woodbury, How Many Americans Have Lost Jobs with Employer Health Coverage During the Pandemic, Issue Brief (Washington, D.C.: The Commonwealth Fund, Oct. 2020).
[56]The MEPS-IC data on average enrollee contributions to premiums by coverage type include covered individuals in plans for which the enrolled employee is not required to make a premium contribution.
[57]There are a number of limitations in applying the Current Population Survey Annual Social and Economic Supplement household survey estimate of the average number of individuals on employer-sponsored plans to our analysis of MEPS-IC establishment survey data that may contribute to non-sampling error. For example, our estimate of family policy size was a national estimate for household policyholders working for public and private employers, whereas our MEPS-IC analysis is solely of enrolled employees of private employers in 33 selected states. In addition, when using the Current Population Survey Annual Social and Economic Supplement data, we estimated the average number of covered individuals in plans with three or more people as a proxy for family policy size. However, the MEPS-IC data may include some family plans with two or more enrollees where employers do not offer employee-plus-one coverage. According to MEPS-IC national estimates for 2022, only about 4 percent of eligible private sector employees in establishments that offer health insurance are offered family coverage but not employee-plus-one coverage.
[58]In the sensitivity analysis, the approximated number of individuals on a family plan would have had to be 3.43 or lower for the employee-weighted average employer-sponsored plan premium per covered individual to be the same as or higher than the corresponding average for all Marketplace plans. The number of individuals on a family plan would have had to be 6.33 or larger for the employee-weighted average enrollee contribution to premiums to be the same or lower than the corresponding average for all Marketplace plans.
[59]All the MEPS-IC cost-sharing variables we used were those that applied to in-network (i.e. copays for in-network services and deductibles for in-network care). While not expressly labeled in-network on the MEPS-IC data tables, an AHRQ official confirmed that only those responses to the questions asking about in-network cost-sharing elements were reported in these tables.
[60]The individual out-of-pocket maximum data in MEPS-IC are reported only for those employees enrolled in single coverage plans, so the average individual out-of-pocket maximum and the percentage of enrolled employees in a plan with no out-of-pocket maximum are for employees enrolled in a single plan. The estimates per employee are weighted by enrolled employees in single plans across the 33 states.
[61]The percentage of employees in a plan with a deductible includes those employees in single, employee-plus-one, and family coverage. MEPS-IC data reports average individual deductibles for employees enrolled with single coverage. When estimating the individual deductible for employer-sponsored plans including those plans with no medical deductible, we assumed that the rate for those single plan enrollees with no medical deductible was the same as the rate of employees across all coverage types with no medical deductible. The average individual medical deductible was then weighted based off the number of enrolled employees in single plans across the 33 states. When estimating average deductibles that include zero value deductibles, we assigned a value of zero for plans without a deductible. We did not include separate drug deductibles in our calculation of average deductibles.
[62]The sample is only one of a large number of samples that might have been drawn. Because each sample could have provided different estimates, we express our confidence in the precision of the particular sample’s results as a 95 percent confidence interval. This is the interval that would contain the actual population value for 95 percent of the samples that could have been drawn. All of the differences that we discuss in this report are significant at the 95 percent confidence level, unless otherwise noted.
[63]We did not include Small Business Health Options Program plans in our analysis of Marketplace plans.
[64]Metal tier refers to the actuarial value (AV) metal tiers pertaining to Marketplace plans. A health plan’s AV is a measure of the relative generosity of a plan’s benefits that is expressed as a percentage of the covered medical expenses expected to be paid by the insurer on average. Marketplace plans are placed into metal tiers based on their AV. This report focuses on plans in three of those tiers—bronze (60 percent AV); silver (70 percent AV), and gold (80 percent AV). Within the silver tier plans there are three additional plan variants available to enrollees at certain income levels that have AVs higher than 70 percent, which we also included in our analysis. The CMS data we used did not include information on catastrophic or platinum tier plans—which accounted for a combined total of 1 percent of Marketplaces enrollees in 2022. To be consistent, we also excluded catastrophic and platinum tier plans from our analysis of cost sharing and benefit coverage.
[65]In 2022, the 33 states that used the Healthcare.gov platform were Alaska, Alabama, Arkansas, Arizona, Delaware, Florida, Georgia, Hawaii, Iowa, Illinois, Indiana, Kansas, Louisiana, Michigan, Missouri, Mississippi, Montana, North Carolina, North Dakota, Nebraska, New Hampshire, Ohio, Oklahoma, Oregon, South Carolina, South Dakota, Tennessee, Texas, Utah, Virginia, Wisconsin, West Virginia, and Wyoming.
The data we used included all individual Marketplace plan enrollments in the 33 states that used the Healthcare.gov platform, whether consumers enrolled directly into plans using the platform or enrolled through a third party, such as an agent or broker.
[66]When a policy includes more than three children CMS distributes the total child rate among all children younger than 21 years old (e.g., if the policy includes four children, each with a rate of $100, the policy-level premium is $300 and each child’s premium is $75).
[67]In this report, we use the term premium tax credits to mean both advance premium tax credits and the credits received during the income tax filing process. When calculating enrollee contributions to premiums for Marketplace plans, we use advance premium tax credits as a proxy for premium tax credits.
[68]CMS defines the plan selection count as the number of unique consumers as of January 15, 2022, with a non-canceled qualified health plan selection that has an end date of January 31, 2022, or later. CMS notes that plan selections will only become coverage for consumers that effectuate their coverage by paying their first monthly premium.
[69]Effectuated enrollment is the number of unique individuals who have been determined eligible to enroll in an exchange plan, have selected a plan, and have submitted the first premium payment for an exchange plan. This CMS data include some plan variants where there is an asterisk denoting the field is suppressed due to privacy concerns. As such, this total may not represent 100 percent of effectuated enrollment.
[70]When describing whether a Marketplace plan had a deductible, we included any non-zero deductible for plans with a total deductible that combines medical and drug amounts into a single deductible or any non-zero value for separate medical or drug deductibles. In our calculation of average individual medical deductible amounts for Marketplace plans, we included average individual total deductibles and average individual medical deductibles. We did not include separate drug deductibles in these our calculations.
[71]See GAO‑18‑565.
[72]Our search returned 62 research papers from peer-reviewed scholarly sources, think tanks, and trade organizations, 25 of which we determined were relevant for our purposes.