OLDER WORKERS
Employment Rates Rebounded and Personal Finances Remained Steady Following Pandemic
Report to Congressional Committees
United States Government Accountability Office
For more information, contact Kris Nguyen at nguyentt@gao.gov.
Highlights of GAO‑25‑106962, a report to congressional committees
Employment Rates Rebounded and Personal Finances Remained Steady Following Pandemic
Why GAO Did This Study
The COVID-19 pandemic caused significant nationwide economic disruptions. Older adults, particularly those close to or already in retirement, may have faced a greater financial burden because they did not have sufficient time to rebuild retirement savings.
The CARES Act includes a provision for GAO to monitor federal efforts in response to the pandemic. This report describes: (1) how trends in older workers’ employment status and duration varied from 2017-2023 and demographic differences among worker subpopulations; (2) how older workers’ personal finances, including Social Security benefit claiming rates, changed; and (3) what policy options experts identified that could enhance the outcomes of discouraged or unemployed older workers.
GAO used Current Population Survey monthly data from 2017 to 2023 to analyze labor force participation rates and employment trends for older and younger workers. Using the most recent data available, GAO examined retirement account balances and total assets held by older households using Survey of Consumer Finances data and analyzed claims for retirement benefits using Social Security Administration administrative data. GAO also sent a written questionnaire to 32 experts, asking them to identify policies likely to help discouraged or unemployed older workers.
GAO did not make recommendations in this report.
What GAO Found
Across demographic groups, labor market outcomes for older workers were generally resilient in the COVID-19 pandemic’s wake, with older workers’ employment outcomes returning to pre-pandemic levels after an initial spike in unemployment. The unemployment rate for workers aged 55–64 peaked at 12.6 percent in April 2020 and had returned to its pre-pandemic level of 2.2 percent by April 2023, according to GAO’s analysis of Current Population Survey data from 2017 to 2023. Further, older workers were more likely to report that they were unemployed because they had lost their job or been laid off, and they were also more likely to have exited the labor force by retiring. Younger workers (aged 25–54) were more likely to report that they were unemployed because a temporary job had ended or because they left a job. GAO found that existing differences by demographic group generally persisted, such as more highly educated older workers having higher labor force participation.
During the pandemic, older workers’ personal finances generally remained relatively steady. The rate of Social Security retirement benefit claims by workers who were near the full retirement age decreased during the first 3 months of the pandemic, according to GAO’s analysis of Social Security Administration data. In late 2020, the rate of benefit claiming for those near full retirement age increased, eventually exceeding pre-pandemic levels, according to GAO’s analysis. The prevalence of households aged 55 or over that had retirement accounts, and the value of those accounts, held relatively steady between 2019 and 2022, according to GAO’s analysis of Survey of Consumer Finances data. However, differences persisted in the value of assets held by income quartile (see figure), as well as by some demographic groups, including differences by education, race, and gender.
The 25 experts who responded to GAO’s written questionnaire generally favored policy options that could most effectively boost older workers’ employability. Among the options favored by 12 or more experts was a policy option suggesting that the Department of Labor identify and report on the legal, regulatory, logistical, or other barriers to the employment of older workers. Experts also favored a policy option that the Department of Labor offer targeted support, such as improving the agency’s existing job-search assistance programs for older job seekers.
This is a work of the U.S. government and is not subject to copyright protection in the United States. The published product may be reproduced and distributed in its entirety without further permission from GAO. However, because this work may contain copyrighted images or other material, permission from the copyright holder may be necessary if you wish to reproduce this material separately.
May 13, 2025
Congressional Committees
The COVID-19 pandemic caused significant economic disruptions, including widespread unemployment, temporary business closures, and other reductions in economic activity during the resulting national emergency that lasted from March 2020 to April 2023.[1] In April 2020, 1 month after the emergency began, the percentage of the U.S. population that was employed reached the lowest level ever measured, according to the Bureau of Labor Statistics (BLS). While the pandemic affected all age groups, older adults (age 55 and older), particularly those who are close to or already in retirement, may have faced a greater burden because they may have had insufficient time to rebuild retirement savings and may have experienced increased medical costs. As our previous work has shown, while older workers are less likely to be unemployed than workers in younger age groups, they are also less likely to find other employment when they lose a job.[2]
We are conducting this work in response to a provision in the CARES Act to monitor and oversee the federal government’s efforts to prepare for, respond to, and recover from the COVID-19 pandemic.[3] This report addresses the following: (1) How did trends in older workers’ employment status vary from 2017 to 2023, and to what extent were there demographic differences among worker subpopulations? (2) How did older workers’ personal finances, including their Social Security benefit claiming rates, change, if at all, during the pandemic? (3) What policy options did experts identify as likely to enhance the employment outcomes of discouraged or unemployed older workers?
To identify trends in older workers’ employment status, including any demographic differences among worker subpopulations, we analyzed monthly data from 2017 through 2023 from BLS’s Current Population Survey (CPS). To compare these trends across age groups, we organized the data using the following age groupings: people aged 25 to 54, who are defined by BLS as the prime working-age population; people aged 55 to 64, who are the older working population that is nearing full retirement age; and people aged 65 and older, who are more likely to be retired or retiring soon (see text box).
|
Age Groups in This Report Unless otherwise indicated, we use the following age groupings in this report: Prime-age workforce: Workers aged 25 to 54 Older workers: Workers aged 55 to 64 Oldest workers: Workers aged 65 and older |
Source: GAO. I GAO‑25‑106962
We also analyzed data from the 2008, 2010, 2020, and 2022 Displaced Worker,
Employee Tenure, and Occupational Mobility Supplements (Displaced Worker
Supplement) to the Current Population Survey, to estimate the extent to which
displaced workers reentered the workforce, remained unemployed, or retired, among
other things.[4]
To examine how older workers’ personal finances, including their Social Security benefit claiming rates, changed during the pandemic, we obtained and analyzed Social Security Administration (SSA) administrative data from 2018 to 2023—the most recent available at the time of our analysis. We determined the number and estimated the rate of claims, by claimant age, at which individuals opted to claim Social Security retirement or disability benefits. We compared the results of our retirement benefit claiming rates with information we analyzed on Unemployment Insurance claim data during the same period.
In addition, we analyzed Survey of Consumer Finances (SCF) data from 2019 and 2022 to estimate retirement account participation and balances, asset holdings, and other financial information for households.[5] For comparison purposes, we analyzed older households based on their household income and divided them into four income quartiles, with the first quartile representing households with the lowest income level and the fourth quartile representing those with the highest income level during those years. We analyzed SCF data to estimate the retirement account prevalence and median balances for older households (55 and older) with a positive retirement account balance. We also analyzed differences among demographic groups in assets held by older households (aged 55 to 64) and oldest households (aged 65 and older) by their income quartiles across income, race and ethnicity, educational attainment, and gender. All dollar values are adjusted for inflation to 2022 dollars.
For each dataset referenced above, we conducted a data reliability assessment of selected variables by conducting electronic data tests for completeness and accuracy, reviewing documentation such as codebooks on the dataset, and interviewing knowledgeable agency officials. Unless otherwise noted, we found each of these datasets to be sufficiently reliable for the purposes of our reporting objectives.
To provide information on policy options that experts identified as likely to enhance the employment outcomes of discouraged or unemployed older workers, we developed a written questionnaire describing 30 policy options focused on improving employment outcomes for older workers.[6] We identified these policy options in our prior work, from a recent National Academy of Social Insurance report, and through discussions with knowledgeable researchers.[7] We excluded policy options that address SSA or its benefit programs, any federal agency other than the Department of Labor (DOL), the federal-state Unemployment Insurance program, and any other state-level options. We also excluded policy options aimed at addressing attitudinal challenges among employers, such as employers’ opinions about age discrimination or employer-held stereotypes that older adults are difficult to train or less productive than younger workers. Attitudinal challenges among employers’ opinions may include age discrimination or employer-held stereotypes that diminish older job seekers’ prospects; certain actions are prohibited under federal law, but we did not attempt to assess the extent to which these actions are prevalent in the workforce or identify potential remedies in this report.[8]
We distributed this questionnaire to 32 experts from think tanks, universities, and nonprofits, and we received responses from 25 of them.[9] We asked the respondents to rank the policy options from not effective to highly effective. The sum of rankings reflects the opinions of the experts, and no empirical testing was done to verify whether any individual policy option would be effective. We supplemented our data analysis with semi-structured interviews of seven policy experts who we selected to provide a range of perspectives and experiences. We selected the seven experts we interviewed as a subset of the 25 who responded to our questionnaire.
For more information on our scope and methodology, see appendix I.
We conducted this performance audit from July 2023 to May 2025 in accordance with generally accepted government auditing standards. Those standards require that we plan and perform the audit to obtain sufficient, appropriate evidence to provide a reasonable basis for our findings and conclusions based on our audit objectives. We believe that the evidence obtained provides a reasonable basis for our findings and conclusions based on our audit objectives.
Background
How Employment and Unemployment Are Measured
DOL’s BLS works with the Census Bureau to produce the CPS.[10] The CPS is the primary source of federal government statistics on the labor force, including employment and unemployment in the United States. The basic monthly survey collects information on employment (e.g., employment status, occupation, and industry) and demographic characteristics to assess the health of the labor market and overall economy.
In addition, the Displaced Worker Supplement is administered every 2 years as a supplement to the CPS. Displaced workers are wage and salary workers 20 years of age and older who lost or left a job because their plant or company closed or moved, there was insufficient work for them to do, or their position or shift was abolished (see text box). For example, for the 2022 Displaced Worker Supplement, people are identified as displaced if they lost or left their job for one of the specified reasons between January 2019 and December 2021.
|
Bureau of Labor Statistics (BLS) Definitions for Types of Unemployed and Underemployed Workers Unemployed workers: Jobless persons who are available to take a job and who have actively sought work in the past 4 weeks. An unemployed worker may or may not be a displaced worker. Displaced workers: Persons who lost or left jobs within the past 3 years for the following reasons: their plant or company closed or moved, there was insufficient work for them to do, their position or shift was abolished, or similar economic reasons. Displaced workers may be unemployed, employed, or not in the labor market at the time of the survey. Underutilized workers: Workers who are either marginally attached to the workforce or employed part-time for economic reasons. · Marginally attached workers: Workers who are not in the labor force, who want and are available for work, and who have actively searched for work in the past 12 months. They are not counted as unemployed because they had not actively searched for work in the prior 4 weeks. They include these subsets of workers: · Discouraged workers: A subset of the marginally attached workers who indicate that they have not searched for work in the prior 4 weeks for the specific reason that they believed no jobs were available for them. · Other people marginally attached to the labor force: Marginally attached workers who are available for work but are not looking for work due to some reason other than that they believed no jobs were available for them (discouraged). · Workers employed part-time for economic reasons: Workers who are counted as employed and are employed less than 35 hours per week and who want and are available for, but are unable to find, full-time work, as well as those individuals who prefer full-time work but who had their hours reduced by their employer because of business conditions. |
Source: BLS. | GAO‑25‑106962
Selected Sources of Retirement Income for Older Workers
Personal finances such as income from employer-sponsored retirement plans, private savings, and Social Security retirement benefits are important sources of retirement income for many older workers.
Private Pensions and Defined Contribution Retirement Accounts
Individuals in the United States are increasingly responsible for their retirement security because the nation has moved from a primarily defined benefit to a primarily defined contribution retirement account system over the last several decades. Defined benefit pension plans traditionally provide a benefit for the life of the participant based on a formula that typically takes into account factors such as a worker’s salary, years of service, and age at retirement. With defined contribution retirement accounts, participants must often decide whether to participate, how much to contribute, and how to invest their savings to balance risks and returns. Defined contribution retirement account savings include assets from workplace retirement plans, such as 401(k) plans, and from individual retirement accounts (IRA).
Social Security
Social Security is a fundamental source of income for millions of retirees and their families.[11] Social Security retirement benefits are paid under the Old-Age, Survivors, and Disability Insurance program administered by SSA.[12] To qualify for retirement benefits under the Old-Age and Survivors Insurance program, workers must typically have earned a minimum of 40 quarters of coverage over their lifetime.[13] To qualify for disability benefits, workers generally need fewer quarters of coverage, but they must have recent work activity. The level of retirement benefits that an individual will receive depends on factors such as their work and earnings history and the age at which the beneficiary chooses to begin receiving benefits. For the purposes of this report, we defined the claiming rate for benefits as the ratio of the number of workers filing a claim for SSA benefits to the estimated number of eligible workers in the same period.
Generally, individuals may begin receiving Social Security retirement benefits at age 62; however, the payments will be lower than if they wait to receive benefits at their full retirement age, which varies from 65 to 67, depending on the individual’s birth year.[14] In contrast, the monthly benefit is higher for workers who opt to delay receiving benefits beyond their full retirement age, up to age 70.
Social Security also provides benefits to eligible individuals who have qualifying disabilities and their eligible family members.
Unemployment Insurance
The federal-state Unemployment Insurance system helps certain unemployed workers, including unemployed older workers. The Unemployment Insurance system provides eligible unemployed individuals with temporary benefits that partially replace their lost wages. The Unemployment Insurance system includes a federal-state program that is generally funded through federal and state employer payroll taxes. States determine eligibility requirements and benefit amounts within federal parameters. Unemployment Insurance benefits are generally available to eligible unemployed workers for up to 26 weeks, or approximately 6 months. Extended benefits are sometimes made available to those who exhaust these benefits, as has occurred during the COVID-19 pandemic.[15]
We previously reported that during the pandemic, states were allowed to ease certain Unemployment Insurance program requirements to support unemployed workers. This also included the creation of temporary Unemployment Insurance programs that expanded eligibility and enhanced Unemployment Insurance benefits (see text box).
|
Types of Pandemic-Era Unemployment Insurance The CARES Act created three federally funded temporary Unemployment Insurance programs that expanded benefit eligibility and enhanced benefit amounts. These programs were amended by the Consolidated Appropriations Act, 2021, and the American Rescue Plan Act of 2021. · Pandemic Unemployment Assistance authorized Unemployment Insurance benefits for individuals not otherwise eligible for Unemployment Insurance benefits, such as self-employed and certain gig-economy workers who were unable to work due to specified COVID-19-related reasons. · Federal Pandemic Unemployment Compensation generally authorized an additional weekly benefit for individuals who were eligible for weekly benefits under the regular Unemployment Insurance programs or the temporary CARES Act Unemployment Insurance programs. Pandemic Emergency Unemployment Compensation generally authorized additional weeks of Unemployment Insurance benefits for those who had exhausted their regular Unemployment Insurance benefits. In addition, the Consolidated Appropriations Act, 2021, created the Mixed Earner Unemployment Compensation program, which was extended by the American Rescue Plan Act of 2021. · Mixed Earner Unemployment Compensation program, which was voluntary for states, authorized an additional weekly benefit for certain Unemployment Insurance claimants who received at least $5,000 of self-employment income in the most recent tax year prior to their application for Unemployment Insurance benefits. These pandemic-era Unemployment Insurance programs expired on September 6, 2021. Some states opted to terminate their Pandemic-Era Unemployment Insurance programs before the authorized dates. As we noted in our July 2024 report (GAO‑24‑107471), according to the Department of Labor, 20 states terminated participation in the Pandemic Unemployment Assistance program between mid-June and late July 2021. For more information, see GAO‑22‑104438, GAO‑22‑104251, GAO‑22‑105162, and GAO‑24‑107471. |
Source: Department of Labor. | GAO‑25‑106962
Older Workers’ Employment Rebounded in the Wake of the Pandemic, but Differences Between Demographic Groups Persisted
Across demographic groups, labor market outcomes for older workers aged 55 and older generally remained resilient in the wake of the pandemic, with older workers’ employment outcomes returning to pre-pandemic levels after an initial spike in unemployment at the start of the pandemic. Existing differences among demographic groups by educational attainment and race and ethnicity preceding the pandemic generally persisted during and after the pandemic.
Unemployment Rates Spiked Higher for Older Workers than Prime-Age Workers Early in the Pandemic, and Some Older Workers Left the Labor Force
Estimated unemployment rates for workers of all ages, including those 55 and over, rose dramatically at the start of the pandemic. Although workers aged 55 and older experienced more pronounced increases in unemployment at the start of the pandemic compared to prime-age workers (aged 25 to 54), their employment outcomes were resilient. The unemployment rate for older workers (aged 55 to 64) increased from an estimated 2.2 percent in April 2019 to a peak of 12.6 percent in April 2020, and then decreased to 4.9 percent by April 2021, according to our analysis of Current Population Survey (CPS) monthly data (see fig. 1).[16] By April 2023, the unemployment rate for the oldest workers (aged 55 to 64) was an estimated 2.2 percent, rebounding to its pre-pandemic level.[17]
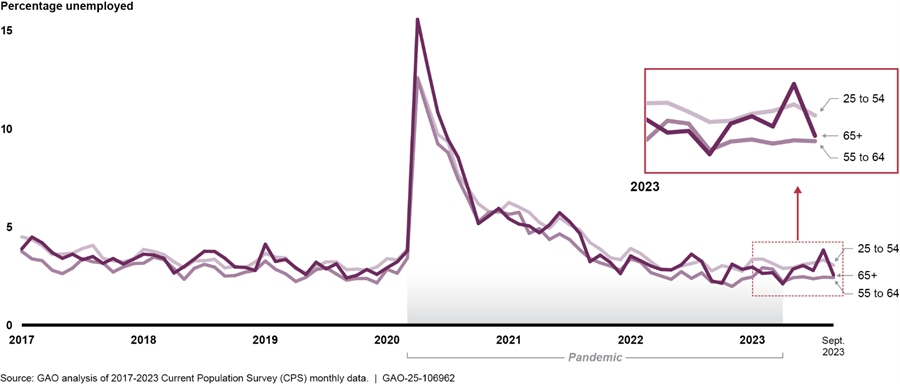
Notes: From January 2017 through March 2020 and from October 2020 to December 2023, these monthly estimates have a maximum margin of error at the 95 percent level of +/-0.3 percentage points for those aged 25 to 54, +/-0.6 percentage points for those aged 55 to 64, and +/-0.9 percent for those aged 65 and older. From April 2020 through September 2020, these monthly estimates have a maximum margin of error at the 95 percent level of +/-0.5 percentage points for those aged 25 to 54, +/-0.8 percentage points for those aged 55 to 64, and +/-1.4 percentage points for those aged 65 and older. We used CPS microdata to produce our estimates, and we did not adjust for seasonality. Our estimates may differ slightly from official Bureau of Labor Statistics estimates. See appendix II for estimates of the number of employed and associated margin of error, by annual quarter, from 2017 to September 2023.
Our analysis found that older workers faced different circumstances in unemployment. Before, during, and after the pandemic, unemployed older workers aged 55 to 64 as well as unemployed oldest workers aged 65 and older were more likely than prime-age workers aged 25 to 54 to report that the reason for their unemployment was that they lost their job or had been laid off. In contrast, prime-age workers aged 25 to 54 were more likely than older workers to report that the reason for their unemployment was that their temporary job had ended or they were a job leaver.[18]
The labor force participation rate is another way to assess the overall health of the economy.[19] We found that the labor force participation rate for all groups of workers we examined followed a relatively similar trajectory during the period from January 2017 through December 2023, with the exception of the participation rate for prime-age workers aged 25 to 54, who experienced a steeper downturn compared to older workers aged 55 to 64 or oldest workers 65 and older at the onset of the pandemic.[20] This is different from the Great Recession of 2007 to 2009, when there was a greater contrast between how older workers fared compared to younger workers. As we reported in 2012, the labor force participation rate of workers aged 55 and older had increased throughout the 2007–2009 recession, whereas the labor force participation rates for younger workers stayed the same or decreased during this period.[21]
There are a variety of factors that could have influenced the employment recovery of older workers during the pandemic, including reentry into the workforce, retirement, and underutilization.
Unemployed re-entrants. Following the initial wave of departures from the workforce at the onset of the pandemic, a greater proportion of individuals aged 65 and older (approximately 39 percent) in the fourth quarter of 2022 reported that they were job re-entrants—meaning they were job seekers who had worked before, but not immediately prior to their job search—than those aged 55 to 64 (approximately 25 percent) or those aged 25 to 54 (approximately 30 percent), according to our analysis of CPS data.[22]
Exiting and retirement. Older workers exiting the labor force or retiring in the wake of the pandemic could have contributed to what appears to be a strong recovery, according to two experts we interviewed.[23] A December 2021 survey of individuals aged 50 and older who left their job reported that 21 percent of respondents said they had retired earlier than planned because of the pandemic.[24] In addition, a study of workers aged 55 to 79 and transitioning out of the workforce pre- and post-pandemic found that the likelihood of them leaving the labor force rose by 6.7 percentage points—a rate that was 43 percent greater than the pre-pandemic period.[25]
Our analysis of Displaced Worker Supplements found that a higher percentage of workers aged 55 and older who were displaced in the 3 years prior to January 2022 generally reported that they were retired versus the percentage of those displaced in 3 years prior to the January 2010 supplement.[26] The results are shown in figure 2.
Figure 2: Labor Force Status of Workers Aged 55 and Older Who Lost Their Jobs in the Past 3 Years due to Layoffs or Plant Closures, as of January 2008, 2010, 2020, and 2022
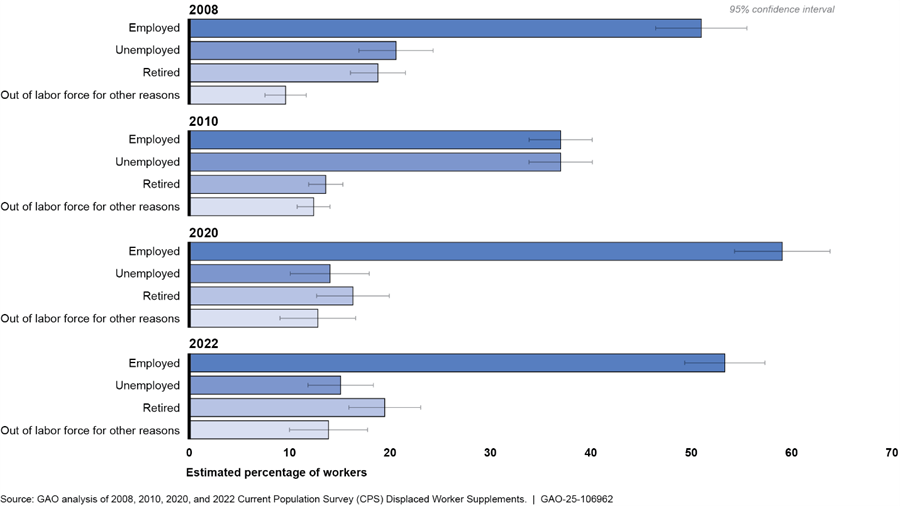
Notes: This figure shows the labor force status in January 2008 for workers displaced between January 2005 and December 2007, in January 2010 for workers displaced between January 2007 and December 2009, in January 2020 for workers displaced between January 2017 and December 2019, and in January 2022 for workers displaced between January 2019 and December 2021. Displaced workers are defined as wage and salary workers 20 years of age and older who lost or left jobs because their plant or company closed or moved, there was insufficient work for them to do, or their position or shift was eliminated. Due to CPS data limitations, our definition of “retired” includes only people who are no longer in the labor force. Therefore, this definition does not include retired persons who have part-time work. We note that the survey design results an overlap in reporting the time period in which workers may have been displaced. As such, the years 2007 and 2019 are represented twice in the figure. However, each wave of the Displaced Worker Supplement consists of an independent sample of distinct individuals.
Three experts told us in interviews that the continued aging of the U.S. baby boom generation—those born between 1946 and 1964—coincided with the increase in retirements during and after the onset of the pandemic. An analysis published in March 2023 found that “nearly all” of the decrease in the U.S. labor force participation rate since February 2020 could be explained by the aging of the U.S. population, which resulted in an increase in retirements during the period.[27]
Underutilization. An alternative measure, underutilization, shows that the number of underutilized older workers also increased substantially during the pandemic then returned to pre-pandemic levels around the third quarter of 2022.[28] An estimated 1.8 million older workers aged 55 to 64 and 800,000 oldest workers aged 65 and older were underutilized in the second quarter 2020, numbers that dropped to 1.0 million and 400,000, respectively, by the second quarter of 2021, according to our analysis of CPS data.[29] We found that the estimated number of older workers employed part-time for economic reasons was substantially larger than the number of marginally attached—including discouraged and other people marginally attached to the labor force—older workers throughout the time period.[30]
Nonetheless, the financial and emotional burdens of unemployment remain harsh for older workers, one expert told us. Workers aged 55 and older who lost their job in recent years were less likely to be reemployed and were more likely to earn less at their next job than younger workers, according to our analysis. Our analysis of Displaced Worker Supplements found that 41 percent of workers aged 55 and older who were displaced in the 3 years prior to January 2022 had not worked for pay since their previously held job compared to 22 percent for those aged 25 to 54 displaced during the same period.[31]
In addition, a greater share of older workers aged 55 and older who were displaced from their jobs during this period but successfully regained employment by January 2022 had lower earnings at the subsequent job compared to younger workers. An estimated 74 percent of reemployed displaced older workers had lower earnings (an earnings replacement rate of less than 100 percent) compared to 58 percent of reemployed individuals aged 25 to 54.[32]
Differences in Labor Force Participation by Educational Attainment and Race and Ethnicity Generally Persisted During and After the Pandemic
Across demographic groups, labor market trends generally remained resilient in the wake of the pandemic. We found that differences across demographic groups of older workers (including for those with higher educational attainment) persisted during and after the pandemic. In some cases, we found increases or decreases within a demographic group over time. We found greater labor force participation for Asian workers and reduced participation for leisure and hospitality workers after the pandemic.
Educational attainment. For older workers aged 55 to 64, the overall proportion participating in the labor force remained relatively steady at an estimated 65 to 66 percent from January 2017 to September 2023.[33] However, as shown in figure 3, those with higher levels of educational attainment consistently participated at greater rates.
Figure 3: Labor Force Participation Rate of Workers Aged 55–64, by Educational Attainment, Quarterly 2017–2023
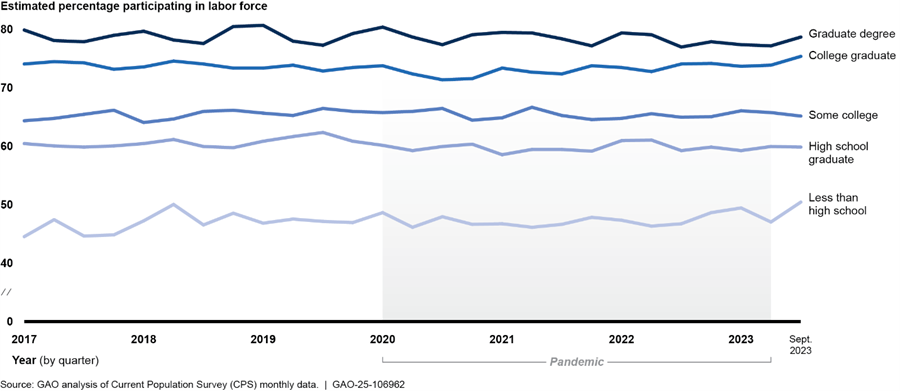
Notes: The maximum margins of error at the 95 percent confidence level are as follows: graduate degree, +/-1.9 percentage points; college graduate, +/-1.6 percentage points; some college, +/-1.6 percentage points; high school graduate, +/-1.5 percentage points; and less than high school, +/-2.8 percentage points. We used CPS microdata to produce our estimates, and we did not adjust for seasonality.
Five experts we interviewed told us that older workers with higher levels of educational attainment were likely to have higher levels of savings and household wealth and greater flexibility in terms of choosing whether to stay in the labor force or retire. One expert told us that older workers with lower levels of educational attainment were more likely to have reduced savings and household wealth, physically demanding jobs, and the need to remain in the labor force.
Industry. With respect to industries, our analysis shows that the largest share of displaced older workers aged 55 and older—about 20 percent—came from the trade, transportation, and utilities sector from 2019 to 2021.[34] However, the share of older worker displacements from the manufacturing sector moderately decreased between the 3-year periods of 2017 to 2019 and 2019 to 2021 from an estimated 22 percent to 14 percent. In addition, the share of displacements occurring in the leisure and hospitality industry moderately increased from an estimated 4 percent to 12 percent between those time periods.[35] See figure 4.
Figure 4: Industries of Workers Who Lost Their Jobs due to Plant Closures or Layoffs, by Time Period and Age Group
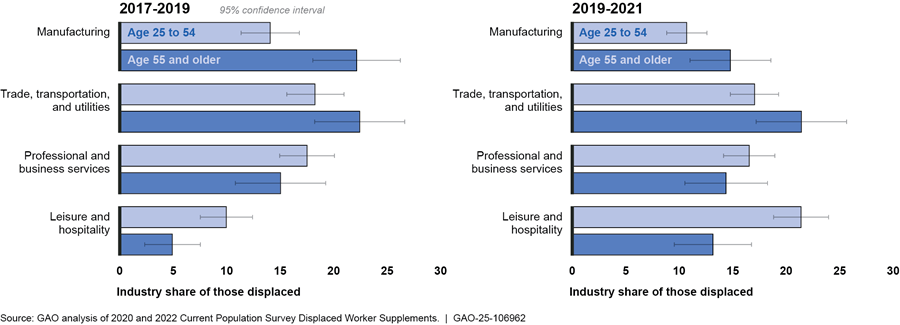
Notes: The Displaced Worker, Employee Tenure, and Occupational Mobility Supplement (Displaced Worker Supplement) is administered every 2 years as a supplement to the Current Population Survey. Displaced workers are wage and salary workers 20 years of age and older who lost or left jobs because their plant or company closed or moved, there was insufficient work for them to do, or their position or shift was abolished. For example, for the 2022 Displaced Worker Supplement, people are identified as displaced if they lost or left their job for one of the specified reasons between January 2019 and December 2021. We note that the survey design results in an overlap in the reporting time period in which workers may have been displaced. As such, those displaced in 2019 were included in the January 2020 and January 2022 issued Displaced Worker Supplements. However, each wave of the Displaced Worker Supplement consists of an independent sample of distinct individuals.
Race and ethnicity. The workforce participation of Asian individuals aged 55 to 64 increased slightly between March 2020 and March 2023, 3 years after the onset of the pandemic, while the workforce participation of White, Black, and Hispanic workers aged 55 to 64 and all race and ethnic groups aged 65 and older remained relatively steady, according to our estimates (see fig. 5).[36] See appendix II for detailed information on the estimated labor force participation rate by race and ethnic group by annual quarter.
Figure 5: Estimated Labor Force Participation Rate, by Race and Ethnicity and Age Group, Second Annual Quarter of Selected Years
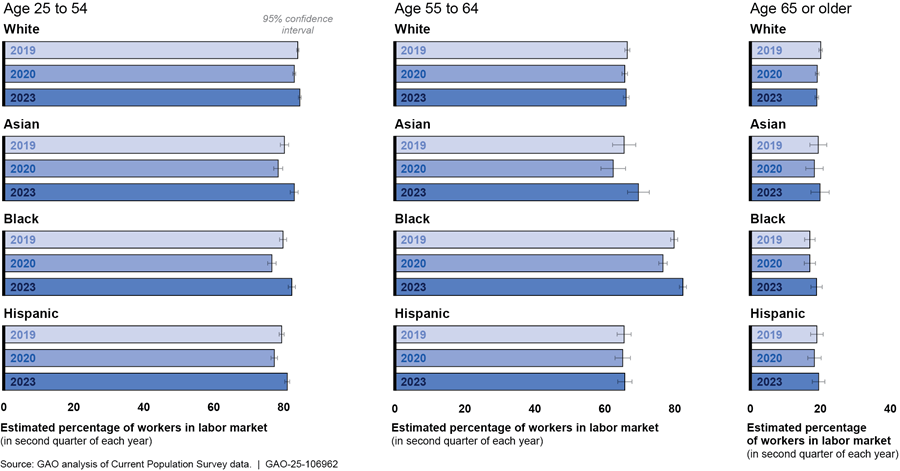
Note: We used CPS microdata to produce our estimates, and we did not adjust for seasonality. We compare quarterly estimates from the second quarter of 2019 to provide pre-pandemic estimates; the second quarter of 2020 to account for the pandemic onset; and the second quarter of 2023, which is the quarterly estimate closest to the review period end of September 2023 that maintains second quarter seasonality.
Gender. Men participated in the workforce at higher rates than women across all age groups from January 2017 to September 2023, as shown in figure 6. We did not observe any differences in labor force participation rates for older men or women during the pandemic.[37] See appendix II for detailed information on the estimated labor force participation rate by gender by annual quarter.
Figure 6: Estimated Labor Force Participation Rate, by Gender and Age Group, Second Annual Quarter of Selected Years
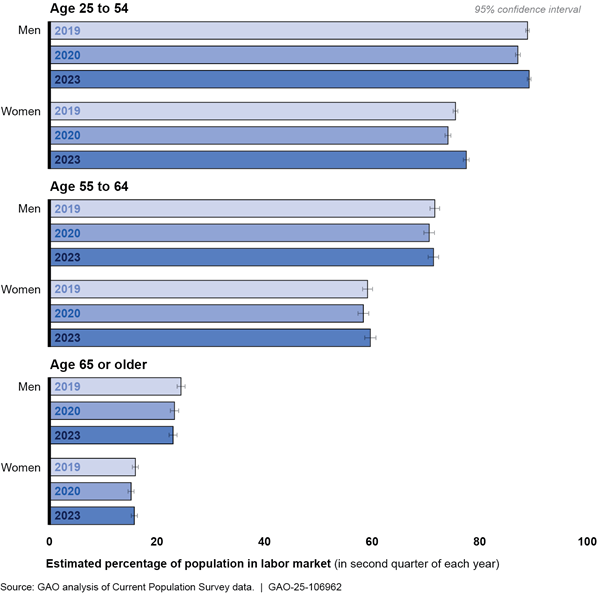
Note: We used CPS microdata to produce our estimates, and we did not adjust for seasonality. We compare quarterly estimates from the second quarter of 2019 to provide pre-pandemic estimates; the second quarter of 2020 to account for the pandemic onset; and the second quarter of 2023, which is the quarterly estimate closest to the review period end of September 2023 that maintains second quarter seasonality.
After Initial Decline, Higher Rate of Workers Near Full Retirement Age Claimed Social Security, and Demographic Differences in Older Workers’ Finances Persisted
Early in the pandemic, retirement benefit claims for older workers nearing full retirement age declined. However, rates of retirement benefit claiming for those near full retirement age increased 6 months after the President declared a national emergency. Older workers’ finances held steady during the pandemic, with their estimated median account balances holding steady between 2019 and 2022. Finally, differences in asset holdings among economic and demographic groups persisted during and after the pandemic. Specifically, we found that among other things, the median total value of assets was consistently higher for higher-income, more highly educated, Asian, White, and male-led older households during the periods reviewed.
During Early Pandemic, Retirement Claiming Rates Decreased Slightly for Most Older Workers, but After 6 Months, Claims Increased for Those Near Full Retirement Age
Our analysis of Social Security administrative data indicates that during the pandemic, the rate of fully insured workers who were near the full retirement age and claiming retirement benefits decreased during the first 3 months of the pandemic. In late 2020, 6 months after the President declared a national emergency, the rate of claiming around full retirement age increased, eventually exceeding pre-pandemic levels.[38]
Our analysis of Social Security retirement benefit claiming rates from 2018 to 2023 found that rates decreased during the initial months of the pandemic for most ages. However, claiming rates increased for those near full retirement age in the fourth quarter of 2020, which corresponded with the time when some individuals’ regular unemployment insurance benefits would have been expected to expire.[39] More specifically, as shown in figure 7, at the beginning of the pandemic, claiming rates for retirement benefits slowed for those aged 66 during the initial months of the pandemic, while claiming rates did not generally vary for the 62 to 63 age group.
Figure 7: Percentage of Eligible Fully Insured Workers Claiming Social Security Benefits, by Age, Quarterly 2018–2023
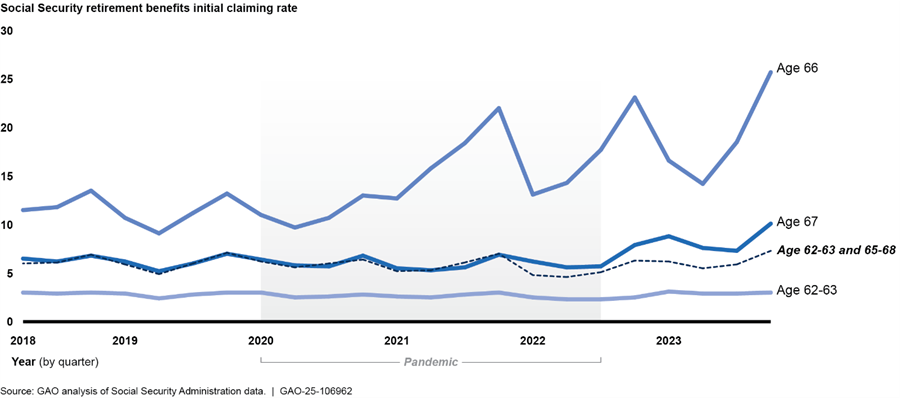
Notes: The quarterly claiming rate is ratio of the number of workers filing a claim for Social Security benefits to the estimated number of eligible workers in the same age group and in the same quarter. Rates are based on the age at which insured workers file their initial claim. As such, “advance filers”—individuals who may file up to 4 months in advance of their requested month and year to begin claiming retirement benefits—may be included at an earlier age than when they begin to receive benefits. We exclude age 64 rates because they would include Medicare-only claimants, who are included in the count of initial claim filings and are not filing for a retirement benefit. According to Social Security Administration officials, these claimants register for Medicare elsewhere, and that information is then sent to the Social Security Administration so it may prepare to issue retirement benefits to that individual, should that individual later choose to start claiming retirement benefits.
However, about 6 months after the pandemic national emergency was declared, the Social Security retirement benefit claiming rates started increasing for those near or at the full retirement age (age 66) during the fourth quarter of 2020, as shown in figure 7.[40] The annual rates for initial retirement benefit claims for the age 66 group—those who are at or near full retirement age—remained high during the pandemic, while the claiming rates for those younger than the full retirement age (e.g., ages 62 to 63) generally fell during the first 3 years of the pandemic then increased slightly in 2023.[41] We found that the rate at which workers aged 66 filed for Social Security retirement benefits increased more than 7 percentage points from 2019 to 2021, as shown in figure 8.
Figure 8: Change in the Annual Claiming Rate for Social Security Retirement Benefits, by Age, Since 2019
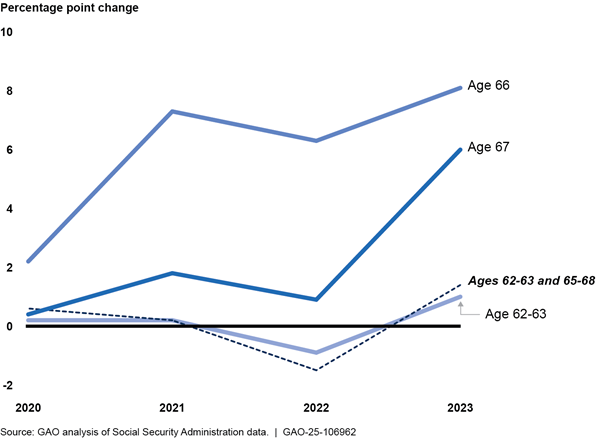
Notes: Rates are based on the age at which insured workers file their initial claim. As such, “advance filers”—individuals who may file up to 4 months in advance of their requested month and year to begin claiming retirement benefits—may be included at an earlier age than when they begin to receive benefits. We exclude age 64 rates because they would include Medicare-only claimants, who are included in the count of initial claim filings and are not filing for a retirement benefit. According to Social Security Administration officials, these claimants register for Medicare elsewhere, and that information is then sent to the Social Security Administration so it may prepare to issue retirement benefits to that individual, should that individual later choose to start claiming retirement benefits.
A comparison of the trends in figure 9 suggests that for workers near the full retirement age, the rate of initial claims for Social Security retirement benefits began increasing 6 months after the national emergency was declared.[42] Five experts we interviewed told us that because the value of the pandemic-era unemployment benefits may have been generous, some individuals may have delayed retirement until after their unemployment benefits ran out. One expert stated that because the pandemic-era unemployment insurance benefits were generous for some, there was less incentive to work or claim Social Security retirement benefits.[43] See figure 9.
Figure 9: Percentage of Eligible Workers Near Full Retirement Age Claiming Social Security Retirement Benefits and Distribution of Continued Claims for Regular Unemployment Insurance, Quarterly 2018–2023
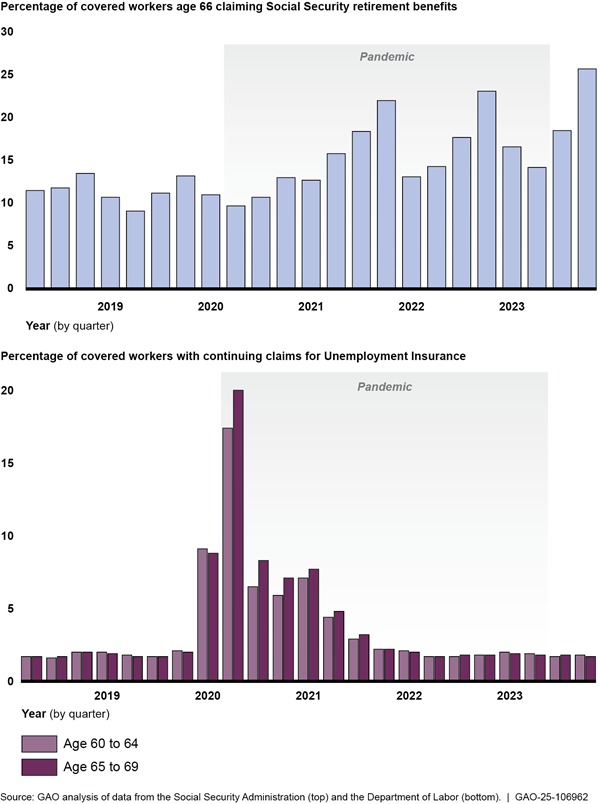
Notes: The quarterly claiming rate is the ratio of the number of workers filing a claim for Social Security benefits to the estimated number of eligible workers in the same age group and in the same quarter. We identified the number of Unemployment Insurance claimants by analyzing data from the Department of Labor’s (DOL) Characteristics of the Unemployed Insured (ETA 203) publication, which provides information on Unemployment Insurance continued claims. Continued claims represent the number of people who have already filed an initial claim for regular, non-pandemic-related Unemployment Insurance and who have experienced a week of unemployment then filed a continued claim to claim benefits for that week of unemployment. Because of DOL data limitations, we were unable to identify the number of or trend information for claimants by age for pandemic-related Unemployment Insurance benefits.
Figure 9 shows that the rate for older workers’ continued claims for Unemployment Insurance surged at the beginning of the pandemic in early 2020.[44] Their continued claiming rates dropped to pre-pandemic levels around the time that standard Unemployment Insurance would be expected to terminate but for the pandemic-era Unemployment Insurance programs. Moreover, some individuals may have chosen or needed to continue working while receiving Social Security retirement benefits.
In addition, as we previously noted, several experts told us that the continued aging of the U.S. baby boom generation—those born between 1946 and 1964—coincided with the increase in retirements during and after the onset of the pandemic. Social Security Administration Office of the Chief Actuary officials said that since the mid-1990s, there has been a gradual shift from claimants tending to retire at ages 62 or 63 to instead retiring at ages 66 or 67. These officials also told us that there is a concentration of people who want to start their retirement benefits at the full retirement age so they can receive full retirement benefits. Accordingly, there has been a reduction in the number of individuals claiming at ages before full retirement age.
In addition to Social Security retirement benefits, the Social Security Administration provides Disability Insurance benefits to those with a sufficient work history who are unable to work due to a long-term disability. We analyzed administrative data from January 2018 to December 2023 regarding Disability Insurance claims for four age groups of individuals and found that the claiming rate for Disability Insurance benefits declined for all of these age groups at the beginning of the pandemic.[45] Except for the age 65 to 66 group, the Disability Insurance claiming rates generally remained level or continued to decline until 2023 when they increased relative to their 2022 level. The claiming rate for individuals aged 65 to 66 remained approximately the same through 2023.
Estimated Percentage of Older Households with Retirement Accounts and Median Account Balances Held Steady Between 2019 and 2022
Overall, older households’ personal finances remained resilient during the pandemic. A variety of indicators suggests that older workers’ retirement savings generally held steady during the pandemic, including the percentage of households aged 55 or over with retirement accounts, the value of those accounts, and the extent to which such households took out hardship withdrawals from those accounts.[46]
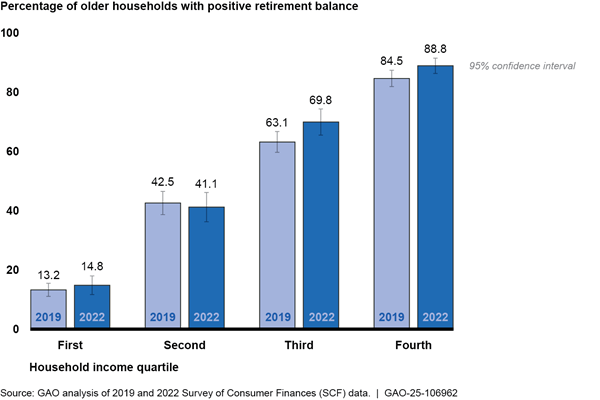
Retirement account prevalence. According to our analysis of the Survey of Consumer Finances (SCF) data, the percentage of older households (aged 55 and older) from higher income quartiles had consistently higher account prevalence rates in both 2019 and 2022. However, we did not observe any statistically significant increases or decreases for any income quartile from 2019 to 2022.[47] See figure 10.[48]
Figure 10: Estimated Percentage of Older Households (Aged 55 and Older) with a Retirement Account by Income Quartile, 2019 and 2022
Several experts told us that median savings rates and retirement savings have been generally increasing for older account holders since 2019. Also, two experts we interviewed told us they found that automatic enrollment has helped workers save more for retirement. A recent statutory provision requiring new workplace retirement plans to automatically enroll eligible employees may continue this trend.[49] In addition, research by Vanguard, one of the largest retirement record keepers, has also found that the overall participation rate of older workers was higher for employers that had adopted automatic enrollment. Vanguard also found that median retirement savings were higher for older workers in retirement plans with automatic enrollment than those with voluntary enrollment.[50]
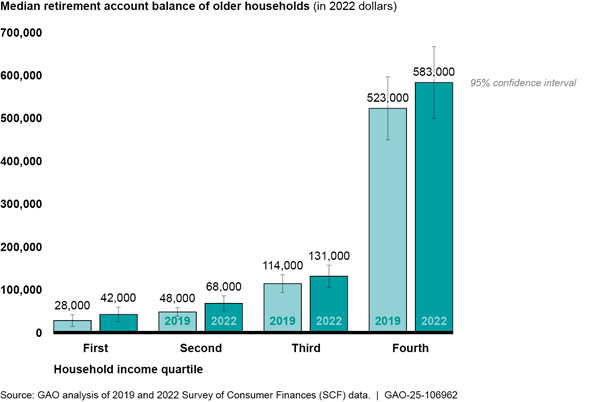
Account balances. According to our analysis of SCF data, among older households who had a positive retirement account balance, the estimated median balances in those accounts held steady between 2019 and 2022, as shown in Figure 11.[51]
Figure 11: Estimated Median Retirement Account Balance of Older Households (Aged 55 and Older) by Income Quartile, 2019 and 2022
However, two large record keepers reported balance increases during our study’s review period, from 2017 to 2024.[52]
In a 2024 study, researchers found that the risk of households aged 50 to 59 being unable to maintain their pre-retirement standard of living declined between 2019 and 2022 due to rising asset values (e.g., in housing, retirement plan savings, and investment accounts), according to their analysis of SCF data.[53] Similarly, several experts we interviewed told us that the rise in median total value of assets held by older households from 2019 to 2022 was driven in part by an increase in home values.
Hardship withdrawals. Two large record keepers found that hardship withdrawals remained relatively unchanged among older account holders aged 55 and older with retirement accounts between 2021 and 2022.[54] Vanguard found that 1.6 percent of its defined contribution account holders aged 55 to 64 took a hardship withdrawal in 2022 compared to 1.2 percent of account holders in that age group in 2021. For the oldest account holders aged 65 and older, only 0.2 percent took a hardship withdrawal in 2022 compared to 0.1 percent in 2021. Similarly, Fidelity reported that among its retirement account holders aged 55 to 59 years old, 3.8 percent took out hardship withdrawal distributions in 2022 compared to 3.0 percent in 2021.
Differences in Asset Holdings Among Economic and Demographic Groups Persisted During and After the Pandemic
We identified differences among demographic groups of older workers using SCF data. We found that the median total value of assets was generally consistently higher for higher-income, more highly educated, Asian and White, and male-led older households during the periods reviewed.[55]
Income level. Among the oldest households (those aged 65 and older), those in the highest income quartile were estimated to hold higher total assets compared to the other three income quartiles, as shown in figure 12.[56] The highest income quartile had an estimated $1,844,000 median total value of assets in 2019 and $2,584,000 in 2022.[57] However, the 2019 and 2022 estimates for the total value of assets held by households in the three lower income quartiles were not statistically different.
Figure 12: Estimated Median Total Value of Assets Held by Oldest Households (Aged 65 and Older) by Income Quartiles, 2019 and 2022
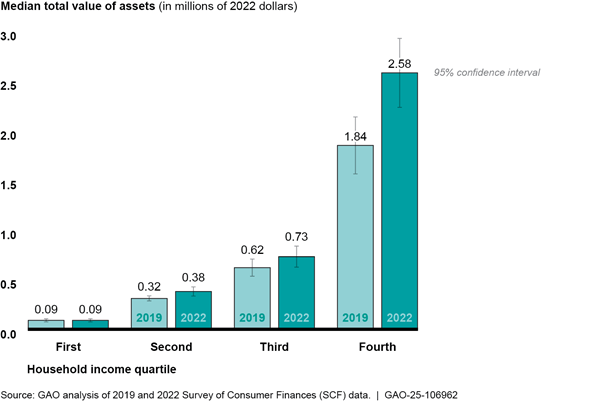
Note: When measuring the asset holdings of a household, we used the total value of assets held by the household that takes into account all financial and nonfinancial assets, including the total value of the household’s retirement account holdings.
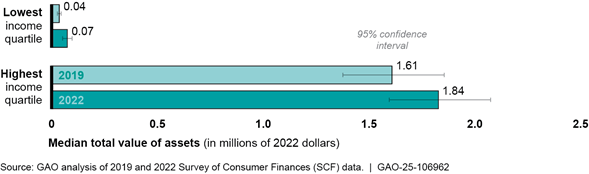
In addition, we found that among older households (aged 55 to 64), the highest income quartile held an estimated median value of assets of $1,609,000 in 2019 and $1,842,000 in 2022, as shown in figure 13.[58]
Figure 13: Estimated Median Total Value of Assets Held by Older Households (Aged 55–64) by Income Quartile, 2019 and 2022
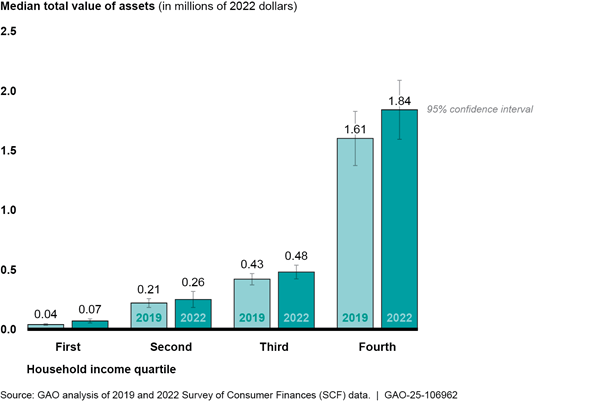
Note: When measuring the asset holdings of a household, we used the total value of assets held by the household that takes into account all financial and nonfinancial assets, including the total value of the household’s retirement account holdings.
Several experts told us that the total value of assets increased for highest-income older workers because they had a larger initial allocation of assets, and they held more assets that appreciated at a higher rate in recent years, such as stocks. In comparison, these experts said, lower-income households usually have fewer assets, and their assets generally generate lower returns; in particular, a larger share of lower-income households’ assets are held in cash.
Educational attainment. We found that older households (aged 55 to 64) with the highest educational attainment (i.e., a graduate or professional degree) were estimated to have the highest median incomes and median total assets across all age groups, as shown in Figure 14.[59]
Figure 14: Estimated Median Total Value of Assets Held by Age Group and Educational Attainment, 2019 and 2022
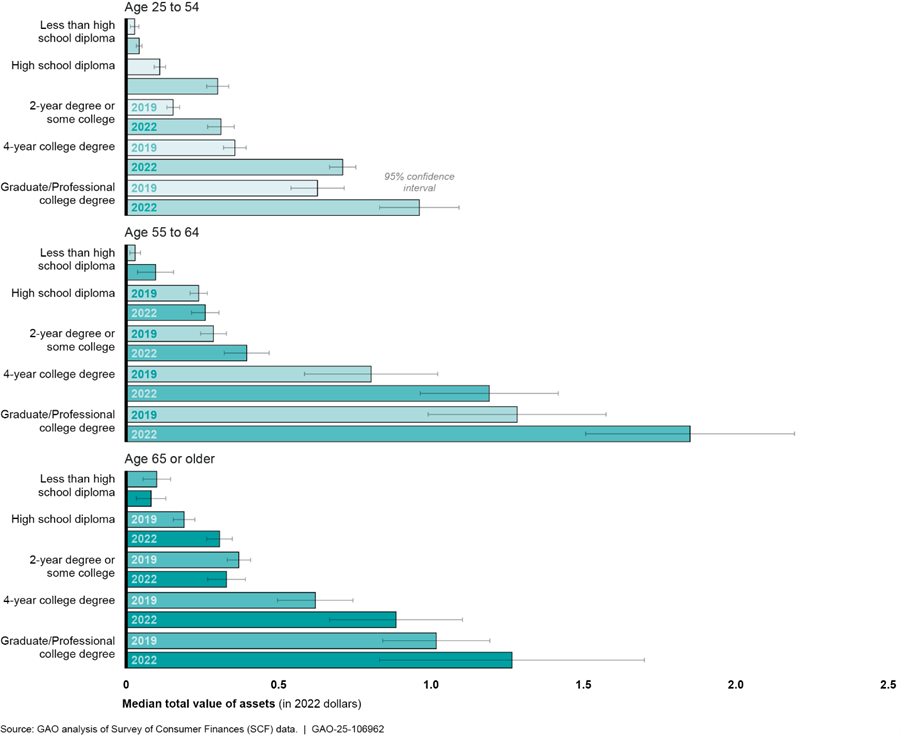
Notes: For the purposes of this report, we used the head of household’s age and educational attainment as the household’s age and educational attainment. When measuring the asset holdings of a household, we used the total value of assets held by the household that takes into account all financial and nonfinancial assets, including the total value of the household’s retirement account holdings.
Several experts told us that highly educated older workers are more likely to have higher incomes, have access to and participate in retirement accounts, and acquire additional assets. They noted that this may not be the case for employees with lower levels of education who may have lower income levels and less ability to save for retirement, and we may see differences in assets held based on educational attainment. Several experts also suggested those who are aged 65 and older and are still in the labor force are mainly working in jobs that require higher educational attainment.
Race. Our analysis identified differences across racial groups in the assets held by both older households (aged 55 to 64) and oldest households (aged 65 and older) in 2022.[60] Among all racial groups that year, Asian households held the highest estimated median value of total assets across all age groups, as shown in figure 15.[61]
Figure 15: Estimated Median Total Value of Assets Held by Household by Age Group and Race and Ethnicity, 2022
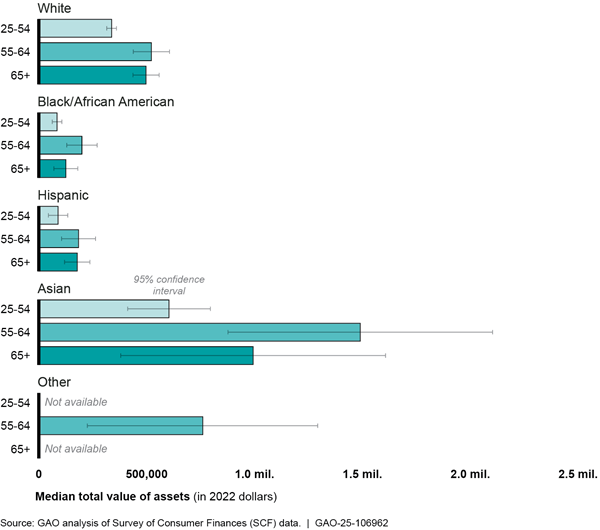
Notes: We are not reporting estimates reported as “not available” because they are statistically indistinguishable from 0 due to high sampling error. When measuring the asset holdings of a household, we used the total value of assets held by the household that takes into account all financial and nonfinancial assets, including the total value of the household’s retirement account holdings. The SCF’s Other category includes Alaska Native American Indian, Native Hawaiian, Pacific Islander, other races, and all respondents reporting more than one racial identification. In 2019, Asians were listed under the Other race category in the SCF.
In addition, we found that older Black/African American and Latino households aged 55 and older held less in retirement savings compared to older White households across all age groups in both 2019 and 2022, according to our analysis of SCF data.
Gender. We observed differences in the value of assets by household composition across all age groups and genders, as shown in figure 16.[62] More specifically, we looked at the total value of assets held by three groups:
· female head of household—this includes single women and women with same-sex spouses or partners,
· households in which a woman is married or partnered to a male head of household, and
· male head of household—this includes single men and men with same-sex spouses or partners.
Figure 16: Estimated Median Total Value of Assets Held by Households by Gender and Age Group, 2019 and 2022
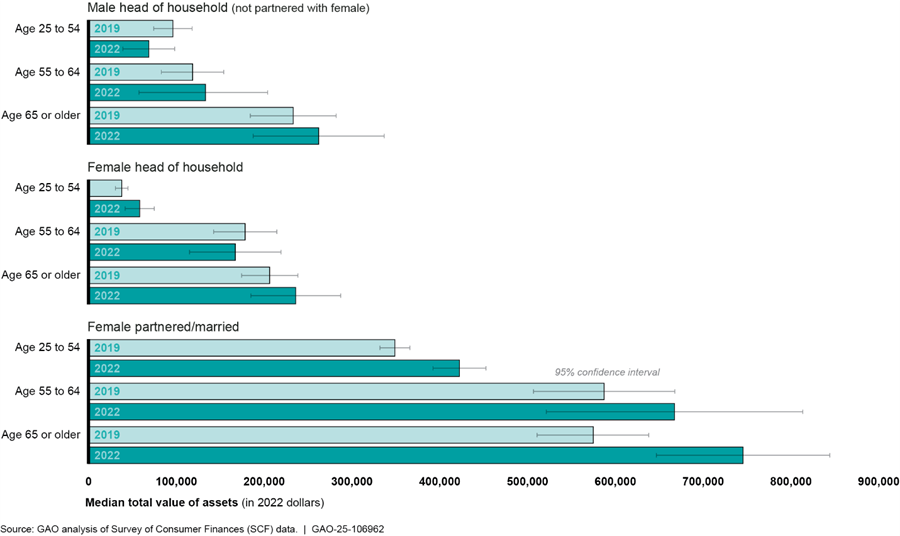
Notes: We estimated the total value of assets held by gender and age of the head of household. The SCF defines gender as male and female. For male heads of households (not partnered with females), this includes men that are single and married/partnered in same-sex couples. For female heads of households, this includes women that are single and married/partnered in same-sex couples. When measuring the asset holdings of a household, we used the total value of assets held by the household that takes into account all financial and nonfinancial assets, including the total value of their retirement account holdings.
Experts Favored Options to Boost Older Workers’ Employability but Cited Some Concerns
To understand more about how to improve employment outcomes for discouraged or unemployed older workers, we sent a written questionnaire to 32 experts on this topic. We asked the experts to rank the policies on a range of effectiveness and identify any specific limitations of each policy.[63]
Options Generally Aimed at Boosting Older Workers’ Employability Favored Most Often
Experts most often favored policy options that could most effectively boost older workers’ employability.[64] Of the 25 responses we received, experts ranked five of the 30 policy options as highly or moderately effective at enhancing employment outcomes for older workers.[65] The most favored policy option was a proposal that Congress remove the requirement that Medicare generally be the secondary payer for workers 65 and older who are covered by an employer health plan.[66]
Table 1 lists the five policy options for improving older workers’ employment outcomes that were ranked as highly or moderately effective by 12 or more experts, the reasons they cited for each policy option’s potential effectiveness, and the potential limitations of each policy option they identified. In addition, several experts who provided comments in our written questionnaire cautioned that a policy option’s effectiveness may be limited to the extent that it does not address other underlying challenges faced by unemployed older workers, such as age- or disability-related discrimination. Further, we previously reported that the effectiveness of certain policy options could be limited if an older worker’s unemployment is caused by structural rather than cyclical issues.[67] GAO did not develop or endorse any of these policy options.
Table 1: Policy Options to Improve Employment Outcomes for Older Workers Ranked as Highly or Moderately Effective by Selected Experts, and Selected Potential Limitations
|
Policy description |
Selected reason(s) experts supported policy |
Selected potential limitations identified by experts |
|
Policies to encourage employers to hire and/or retain older workers |
||
|
Congress removes the requirement that Medicare generally be the secondary payer for workers 65+ who are covered by an employer health plan.a |
Health insurance and other health-related costs are a major expense for employers, who can perceive cost as a disadvantage of hiring older adults because they may need expensive health care. Making Medicare the primary payer could alleviate the cost burden to employers offering health care coverage, which could increase demand for workers who are 65 and older. |
Workers aged 55–64 who are ineligible for Medicare could still face potential discrimination from employers who may avoid hiring them due to the perception that their health care costs more. This policy would also not specifically assist workers who do not have employer-based health insurance, including low-wage earners, and part-time workers, among other groups of workers. This policy could increase Medicare costs, and it is unclear to what extent most policymakers and taxpayers would be willing to support such increases. |
|
Reduce the cost of employing older workers by allowing employers to opt out of paying Social Security payroll tax once a worker has accumulated 35 years of covered earnings. |
This policy could reduce the employer’s cost of
hiring and employing older workers, and this could lead employers to hire
older workers more often. |
Without changes in other policies, this policy would not likely help those with weak labor force attachment, such as those who experience frequent unemployment spells or may not have accumulated 35 years of work experience or both. This could potentially reduce future benefits for older workers who had already accumulated 35 years of work experience and wanted to continued working. |
|
Policies to reduce older workers’ barriers to finding employment |
||
|
Congress enacts a wage insurance program to temporarily compensate older Americans who accepted new full-time jobs that pay less than their previous jobs within 27 weeks of filling for Unemployment Insurance. |
This could help older workers as they transition to new employment, especially those working in states that have lower minimum wages. |
None provided. |
|
Policies for Department of Labor (DOL) initiatives that could enhance older workers’ employment |
||
|
DOL identifies legal, regulatory, logistical, or other barriers to the employment of older workers and reports on approaches for reducing those barriers and any associated regulatory changes. |
This could help DOL better understand the barriers to employment older workers are facing. This could lead to more federal policymakers’ attention on age barriers and increase their efforts to find solutions. |
There is a lack of expertise on potential age discrimination and related barriers. Except for DOL’s Senior Community Service Employment Program, there is little federal funding and dedicated programs or support for older workers. |
|
DOL develops new or improves existing job search assistance programs to support older Americans. |
Targeted support for older job seekers could help reduce the problem of long-term unemployment that disproportionally affects older job seekers, especially if offered early in their job search. Currently, there are few, if any, services that target older workers. |
This policy should be coupled with evaluation of existing or new federal programs. To implement them, there would need to be funding for the local workforce services programs to support staff training and likely hire additional staff. |
Source: GAO analysis of experts’ responses to GAO’s questionnaire. I GAO‑25‑106962
These policy options were selected as highly or moderately effective by 12 or more experts from a list of 30 policy options. We selected most of our policy options presented in our prior work (GAO‑12‑445) and from a September 2023 National Academy of Social Insurance panel report to identify policy options that experts proposed to enhance the employment outcomes of older workers. We also identified policy options through discussions with experts, who are active in researching the issue. GAO did not develop or endorse any of these policy options.
aIf an employer with fewer than 20 full- and/or part-time employees sponsors or contributes to a single-employer Group Health Plan, the Medicare Secondary Payer rules applicable to individuals entitled to Medicare on the basis of age do not apply to such individuals.
Experts Identified Four Common Themes Across Policy Options
When responding to the written questionnaire and in interviews, experts stated concerns in at least one of four key themes concerning how to improve employment for older workers.
Reducing cost burdens. Three experts told us in interviews that employers view older workers as more expensive to hire.[68] Some experts favored policy options that would lower the cost of hiring and employing older workers. For example, four experts said in written comments or in interviews that the policy option that allowed employers to opt out of paying Social Security payroll tax once a worker has accumulated 35 years of covered earnings could reduce the cost of employing older workers. However, six experts who provided written or oral comments cautioned that this policy option could substantially increase the federal government’s costs.
Providing health care coverage. Four experts we interviewed told us that health care is a key concern for employers because they often pay a large share of the company’s insurance premiums and may need to pay more to provide health care to older workers.[69] Four experts we interviewed also said the perception that older workers’ health care benefits cost more can lead some employers to consciously or subconsciously rule out hiring them, thus creating a barrier on the demand side. Seven experts told us in written comments or interviews that the policy option for Congress to remove the requirement that Medicare generally be the secondary payer for workers aged 65 and older who are covered by an employer health plan could reduce health care costs for employers and thus encourage them to hire and or retain older workers.[70] This could enhance employment outcomes of older workers. However, four experts who provided written comments said that this could increase Medicare’s program costs and may not help older workers who are not eligible for Medicare.[71]
Providing targeted support services for older job seekers. Three experts expressed their concerns in interviews that there are insufficient targeted support services for older job seekers. For example, one expert we interviewed told us that they found older job seekers are not getting the same treatment as younger workers in Workforce Innovation and Opportunity Act programs or at American Job Centers.[72] Six experts also told us in their written comments or in interviews that more federal grant funding is needed for targeted services to support older job seekers, such as expanding eligibility or funding for the Senior Community Service Employment Program.[73] In addition, three experts told us in interviews that these federal efforts could help further support older workers, especially marginally attached workers who are historically overlooked by employers and may face additional barriers to employment. These marginally attached workers may include older workers who lack updated skills or older workers that cannot access certain jobs. Furthermore, three experts said in our written questionnaire that increasing supportive services that target older job seekers and workers could directly benefit older workers by enhancing their employment outcomes.
Providing age- and disability-related workplace accommodations and other flexibilities for older workers. Four experts said in written comments or in interviews that unemployment and low labor force participation among older workers are caused, in part, by employers’ failure to provide workplace accommodations to older workers with disabilities. Three experts that provided comments in our written questionnaire also told us that existing structural barriers—such as potential age and disability discrimination in the workplace—are a continued challenge for older workers and were not addressed in our list of policy options in the written questionnaire.
Various experts we spoke with discussed that workplace flexibilities had increased in recent years and supported increasing federal efforts to better support and understand this area of work in relation to older workers. Three experts said they supported expanding workplace flexibilities for older workers, such as independent contracting and gig work, in their comments provided to our written questionnaire or in interviews. Three experts told us in interviews that these types of workplace flexibilities can allow individuals to work when and how they want. This can be particularly appealing to some older workers who may have physical limitations that make it harder for them to serve in traditional full-time positions or who may prefer to have more flexibility over their time and daily schedules, these experts said. Two experts also told us in interviews that the increasing use of flexible work arrangements can encourage older workers to remain in or return to the workforce.
Agency Comments
We provided a draft of this report to the Federal Reserve Board of Governors, the Department of Labor, and the Social Security Administration for their review and comment. We received technical comments from the Department of Labor and the Social Security Administration, which we incorporated as appropriate.
We are sending copies of this report to the appropriate congressional committees, the Chair of the Federal Reserve Board of Governors, the Secretary of Labor, the Commissioner of the Social Security Administration, and other interested parties. In addition, the report will be available at no charge on the GAO website at http://www.gao.gov.
If you or your staff have any questions about this report, please contact me at nguyentt@gao.gov.

Tranchau (Kris) T. Nguyen, Director
Education, Workforce, and Income Security
List of Committees
The Honorable Susan Collins
Chair
The Honorable Patty Murray
Vice Chair
Committee on Appropriations
United States Senate
The Honorable Mike Crapo
Chairman
The Honorable Ron Wyden
Ranking Member
Committee on Finance
United States Senate
The Honorable Bill Cassidy, M.D.
Chair
The Honorable Bernard Sanders
Ranking Member
Committee on Health, Education, Labor, and Pensions
United States Senate
The Honorable Rand Paul, M.D.
Chairman
The Honorable Gary C. Peters
Ranking Member
Committee on Homeland Security and Governmental Affairs
United States Senate
The Honorable Tom Cole
Chairman
The Honorable Rosa L. DeLauro
Ranking Member
Committee on Appropriations
House of Representatives
The Honorable Brett Guthrie
Chairman
The Honorable Frank Pallone, Jr.
Ranking Member
Committee on Energy and Commerce
House of Representatives
The Honorable Mark E. Green, M.D.
Chairman
The Honorable Bennie G. Thompson
Ranking Member
Committee on Homeland Security
House of Representatives
The Honorable James Comer
Chairman
The Honorable Gerald E. Connolly
Ranking Member
Committee on Oversight and Government Reform
House of Representatives
The Honorable Jason Smith
Chairman
The Honorable Richard Neal
Ranking Member
Committee on Ways and Means
House of Representatives
This report examines the following: (1) How did trends in older workers’ employment status vary from 2017 to 2023, and to what extent were there demographic differences among worker subpopulations? (2) How did older workers’ personal finances, including their Social Security benefit claiming rates change, if at all, during the pandemic? and (3) What policy options did experts identify as likely to enhance the employment outcomes of discouraged or unemployed older workers?
Analyzing Employment Trends in Older Workers
To identify trends in older workers’ employment status, including any demographic differences among worker subpopulations, we analyzed monthly data from 2017 through 2023 from the Current Population Survey (CPS) produced by the Department of Labor (DOL) Bureau of Labor Statistics (BLS).[74] We also analyzed data from CPS’s 2008, 2010, 2020, and 2022 Displaced Worker, Employee Tenure, and Occupational Mobility Supplements (Displaced Worker Supplement).
We selected CPS because it is nationally representative; contains large sample sizes, as well as demographic and industry information; and is the primary source of labor force statistics for the United States. The survey is based on a sample of the civilian, noninstitutionalized population in the United States. About 42,000 households are interviewed monthly based on area of residence to represent individual states and the country as a whole.[75] We used CPS monthly data, rather than its yearly Annual Social and Economic Supplement, because it allowed us to analyze discrete monthly effects of the pandemic that occurred from March 2020 to April 2023.
We also produced quarterly annual summary statistics to identify aggregate trends. To compare these trends across age groups, we separately analyzed the following age groupings: people aged 25 to 54, who are defined by BLS as the prime working-age population; people aged 55 to 64, who represent the older working population that is nearing full retirement age; and people aged 65 and older, who are more likely to be retired or retiring soon.
Similarly, we analyzed the 2008, 2010, 2020, and 2022 Displaced Worker Supplements to the Current Population Survey, because this supplement contains data on the employment and earnings status of displaced workers before and after their job losses.[76] The Displaced Worker Supplement identifies people as displaced if they lost or left their job because of a plant closure or layoff, there was insufficient work for them to do, or their position or shift was abolished during the 3 years prior to the January issuance of the biannual supplement.[77] Displaced workers are defined as those workers who have lost a job in the past 3 years; however, they may be unemployed, employed, or not in the labor market at the time of the survey.
For all of our estimates using CPS data, including the Displaced Worker Supplements, we estimated the standard errors and constructed the confidence intervals taking into account the survey’s dual-frame sample design in order to estimate the sampling variance for these estimates.[78] We used CPS microdata to produce our estimates, and we did not adjust for seasonality.
To assess the reliability of the 2017–2023 CPS monthly data, as well as the 2008, 2010, 2020, and 2022 Displaced Worker Supplements, we (1) reviewed relevant documentation, including GAO’s previous analyses of CPS monthly data and Displaced Worker Supplement data; (2) interviewed (through email exchanges) officials or researchers with expertise who use these data to answer technical questions and obtain their perspectives on any data discrepancies or errors we found; and (3) conducted electronic tests to identify missing data, outliers, and errors. To the extent possible, we compared our estimates with published reports using CPS data, such as BLS reports.
We recognize that there are certain limitations with the data and, accordingly, any estimates we produced using the data. As a mixed-panel dataset, CPS compares cross-sections of workers at different points in time—over a 16-month period, respondents are asked to complete the survey for 4 months, then are not surveyed for 8 months, and then are asked to complete the survey for another 4 months. Any time trends may be subject to composition bias unless additional methodologies are implemented to control for this (e.g., matching respondents over time). We determined that the data for the variables we used were sufficiently reliable to produce statistically reliable estimates—including those used to produce estimates regarding the trends in employment and unemployment, duration of unemployment and identify any differences in employment or employment characteristics, such as sector and industry employed—for demographic subpopulations of workers aged 25 to 54, 55 to 64, and 65 and older.
We compared our results with other expert studies and previous GAO work, especially our October 2011 and April 2012 reports.[79]
Analyzing How Older Workers’ Personal Finances Changed
To examine how older workers’ personal finances, including their Social Security benefit claiming rates, changed during the pandemic, we obtained and analyzed Social Security Administration (SSA) data, DOL Unemployment Insurance data, and the Federal Reserve’s Survey of Consumer Finances (SCF) data; interviewed experts; and reviewed and analyzed other key information and studies regarding older workers’ personal finances before and after the pandemic.
SSA claiming rates. To identify trends in SSA claiming rates, we estimated claiming rates before and during the pandemic from 2018 to 2023. We then compared the claiming rates during the pandemic to the pre-pandemic rates. We also analyzed DOL Unemployment Insurance data for the same time period to help us understand any correspondence with SSA benefits claiming during the pandemic.
We obtained and analyzed individual SSA Old Age Insurance (retirement benefits) and Disability Insurance claimants’ biographic and demographic information (e.g., date of birth and zip code) from 2018 through 2023 from SSA’s Modernized Claims System. The Modernized Claims System is a non-public data repository with information for SSA retirement and Disability Insurance benefit claims.
We reviewed recent GAO work on SSA retirement, Disability Insurance, and Supplemental Security Income benefits. We conducted additional analyses of administrative data provided by SSA to GAO for a November 2022 report.[80] We obtained additional administrative data from SSA for retirement benefit and Disability Insurance benefit claims and used these data to analyze individual claiming behavior for retirement and Disability Insurance benefits.[81] In particular, we analyzed the data to determine the number of older workers claiming retirement and Disability Insurance benefits, by claimant age, on a quarterly basis from 2018 to 2023.[82]
We requested additional data regarding the estimated number of individuals fully insured for SSA retirement benefits and disability insured for Disability Insurance benefits, by claimant age, from 2018 through 2023 from SSA’s Office of the Chief Actuary.[83] These data, along with the number of claimants by age, allowed us to estimate the percentage of eligible workers claiming Social Security retirement or Disability Insurance benefits at various ages. We excluded retirement claiming rates at age 64 because they included many claims for Medicare benefits only (i.e., they did not include a claim for retirement income benefits). To identify any trends in how Social Security retirement benefit claiming rates might have corresponded with the termination of Unemployment Insurance benefits, we compared our analyses of Social Security retirement benefit claiming rates with information we obtained and analyzed from DOL’s Employment and Training Administration’s Characteristics of the Insured Unemployed reports from 2018 to 2023.[84]
With respect to Disability Insurance benefits, we analyzed administrative data from 2018 to 2023 that we obtained from SSA’s Modernized Claims System regarding individual claimants and analyzed for those claimants aged 55 to 59, 60 to 61, 62 to 64, and 65 to 66. We chose these age categories to isolate and better estimate the extent to which individuals nearing the full retirement age began claiming benefits compared to younger individuals.
To assess the reliability of SSA-supplied administrative data, we (1) reviewed relevant documentation, including GAO’s previous analyses of SSA Modernized Claims System data; (2) interviewed officials with expertise on these data to answer technical questions and obtained their perspectives on any data discrepancies or errors we found; and (3) conducted electronic tests to identify missing data, outliers, and errors. To the extent possible, we compared our estimates with published reports using these or similar SSA data, such as expert studies. We found these data to be sufficiently reliable to examine the extent to which the pandemic may have influenced eligible workers’ decisions to claim Social Security benefits.
To assess the reliability of DOL’s Unemployment Insurance data, we reviewed relevant documentation; interviewed DOL officials with expertise on these data; and conducted electronic tests to identify missing data, outliers, and errors. We found these data to be sufficiently reliable to determine the extent to which individuals of selected ages claimed Unemployment Insurance from 2018 through 2023.
Survey of Consumer Finances (SCF). To determine how older workers’ personal finances changed during the pandemic, we analyzed SCF data from 2019 and 2022 to estimate retirement account participation and balances, asset holdings, and other financial information for older households. The SCF is a nationally representative survey sponsored by the Board of Governors of the Federal Reserve System. This survey examines a different representative sample of households every 3 years. It captures detailed information about the financial situation of these households and oversamples higher-income households. In the SCF, the unit of analysis is the primary economic unit, which consists of an economically dominant individual or couple in a sampled household. The reference person—which we refer to in this report as “head of household”—completes the survey on behalf of the household. In addition to providing household-level data, the SCF also provides detailed individual-level economic information about an economically dominant single individual or couple in the household.[85] We chose 2019 as the beginning year to include data before the start of the pandemic. We chose 2022 as the end year because it was the most recent year for which data were available at the time of our analysis. We analyzed households in which the head of household is aged 25 to 54, 55 to 64, and 65 and older. For simplicity, we call these households “prime-age households,” “older households,” and “oldest households,” respectively. Additionally, the 2022 SCF added Quarantine-Related questions to capture households’ pandemic experiences.[86]
For estimates derived from SCF data, we estimated the associated standard errors following technical guidance published by the Federal Reserve. All estimates are weighted and generalizable to the U.S. population. To the extent possible, we used variables from the Summary Extract Public Data file, which the Board of Governors of the Federal Reserve System uses to produce its Federal Reserve Bulletin articles.
For the purposes of this report, we reported households that had a retirement account with a positive account balance. Retirement accounts include individual retirement accounts, Keoghs, and future and current account-type pensions. We recognize that there may be households that report having a retirement account, but their account balance is $0. We described retirement account prevalence among prime-age (aged 25 to 54) and older (aged 55 and older) households by estimating the percentage of these households with a positive retirement balance across all income quartiles. We also estimated the median retirement account balances among prime-age (aged 25 to 54) and older (aged 55 and older) households.
To determine households’ income groups, we split households into four groups, or income quartiles. Income is based on household income for the previous calendar year.[87] We also describe them as “the two lower income quartiles” and “the two higher income quartiles.” The lowest income group is the first quartile of the income distribution, and the highest income group is the fourth quartile of the income distribution (in 2022, these quartiles had an estimated median income of about $28,000 and $243,000 for households aged 55 and older with access to retirement accounts, respectively). Since the SCF is a survey of U.S. families every 3 years and each year of data in our analysis used a different set of households, we calculated distinct income-quartile cutoffs for each year of data.
We also examined the total value of assets held by households across demographic groups including income, educational attainment, race and ethnicity, and gender. When measuring a household’s asset holdings, we used the total value of assets held by the household to take into account all financial and nonfinancial assets, including the total value of their retirement account holdings. When measuring a household’s age, we used the reference person’s age. The SCF defines the reference person as either the male in a mixed-gender couple or the older individual in a same-gender couple.
To examine educational attainment at the household level, we used the reference person’s highest level of educational attainment. We used the SCF’s definition of levels of educational attainment, which include high school diploma, some college or 2-year degree, 4-year college degree, and graduate or professional degree. We categorized education levels less than a high school diploma or equivalent as “less than high school” for the purposes of this analysis.
To examine the race of the household, we used the reference person’s race. The 2022 SCF had the following categories of race: White non-Hispanic, Black or African American, Hispanic, Asian, and Other. The Other category includes Alaska Native or American Indian, Native Hawaiian, Pacific Islander, other races, and all respondents reporting more than one racial identification. In the 2019 SCF, Asians were listed under the Other race category.[88]
To examine differences by gender, we looked at three groups:
1. Households in which a woman is the primary reference person—this includes single female households and female same-sex spouses and partnerships;
2. Households in which the primary reference person is male, and they are partnered/married with a female; and
3. Households in which the primary reference person is male—this includes both single male households and male same-sex spouses and partners.
In the 2019 and 2022 SCFs, the reference person defaults to the male in a mixed-gender couple or the older individual in a same-gender couple.
To correct for how the SCF assigns the reference person, we also identified all adult females who are a spouse/partner living in the same residence with a male and assigned them to the second household group, as well as all adult males who are not partnered with females such as male same-gender couples who are married or partnered and assigned them to the third household group, and included them in our analysis of older households’ employment and financial assets.[89] For household assets, we separated out subpopulations by female reference persons, female spouses/partners of male references persons, and male reference persons without a female partner. We then pooled the asset variables for each spouse/partner in households with two adults. In addition, when measuring the family structure of a household, we identified whether children are present in the household.
To assess the reliability of the 2019 and 2022 SCF data, we reviewed relevant technical documentation published by the Federal Reserve; interviewed (through email exchanges) officials or researchers with expertise who use these data to answer technical questions and obtain their perspectives on any data discrepancies or errors we found; and conducted electronic tests to identify missing data, outliers, and errors. We determined that the SCF variables we used were sufficiently reliable for the purposes of our analysis.
Defined contribution service providers’ proprietary data and expert interviews. We supplemented our data analysis with information obtained from two key defined contribution plan record keepers regarding pre-pandemic and pandemic-era trends in hardship withdrawals and defined contribution account balances.
We also supplemented our data analysis with semi-structured interviews of seven policy experts who we selected to provide a range of perspectives and experiences, including academics with expertise on older workers and retirement security, leaders from nonprofit organizations with programs to support these workers, and representatives from organizations representing employers that hire older workers.[90] These seven experts are a subset of the 25 experts that responded to our written questionnaire. These interviews provided additional context to our discussion of trends in Social Security claiming rates, the extent to which Unemployment Insurance benefit claiming may have influenced older workers’ decisions on what age to begin claiming Social Security retirement benefits, and the potential effects of the pandemic on older workers’ personal finances.
We used a standard set of questions to interview the seven policy experts to ensure we consistently captured their views on various aspects of each of our objectives. We then analyzed the results of these interviews to identify the main themes in their responses that could be generalized and provide additional context for our findings. We tallied the number of interviewees that supported each generalized statement. The information we obtained from these interviews reflects the views of the experts and should not be interpreted as GAO endorsing any of them.
Experts Identifying Policy Options that May Enhance Older Workers’ Employment Outcomes
To identify which policy options could enhance the employment outcomes of discouraged or unemployed older workers, we administered a written questionnaire to 32 experts from think tanks, universities, and nonprofit organizations.[91]
Selection of questionnaire recipients. We selected experts to send our questionnaire to ensure a range of viewpoints were reflected. We identified experts by reviewing relevant literature and identifying experts who had participated in past GAO work, who were panelists in recent policy forums, or who were active in analyzing and researching the issue. To reflect a range of perspectives and a balance of experience, we selected experts from think tanks, universities, and nonprofits.[92] We applied three selection criteria, all of which had to be met, to be included as an expert:
· Education level. The individual holds a master’s degree or higher in a relevant field of study, such as economics, public administration, math, business, or a math-related or business-related field.
· Published work on older workers. The individual has written or contributed to at least one published article, book, or report about older workers’ employment or personal finances which was sponsored by a research organization or federal agency.
· Employment status. The individual currently holds a position that involves examining or performing work related to older workers or a related area.
We received responses from 25 of the experts. In table 2, we provide a list of the 17 experts who gave us permission to share their names and affiliated organizations.
Table 2: Partial List of Experts Who Responded to Our Older Workers’ Written Questionnaire and Their Affiliated Organizationsa
|
Name |
Title |
Affiliated organization |
|
Katherine Abraham |
Professor of Economics and Survey Methodology |
The University of Maryland |
|
Marco Angrisani |
Senior Economist |
Center for Economic and Social Research at The University of Southern California |
|
Lowell Arye |
Principal |
Aging and Disability Policy and Leadership Consulting |
|
Martin Bailey |
Senior Fellow Emeritus |
The Brookings Institution |
|
Gary Burtless |
Senior Fellow Emeritus |
The Brookings Institution |
|
Richard Fry |
Senior Researcher |
Pew Research Center |
|
Teressa Ghilarducci |
Irene and Bernard L. Schwartz Professor of Economics and Policy Analysis; Chair of Economics |
The New School for Social Research |
|
Gopi Shah Goda |
Senior Fellow, Associate Professor of Health Policy (by courtesy) and Professor of Economics (by courtesy) |
The Stanford Institute for Economic Policy Research and Stanford University |
|
Rachel Grezler |
Senior Research Fellow |
The Heritage Foundation |
|
Susan Houseman |
Senior Economist |
The Upjohn Institute for Employment Research |
|
Richard Johnson |
Senior Fellow and Director on Retirement Policy |
The Urban Institute |
|
Dana Muir |
Professor of Business and Professor of Business Law |
The Stephan M. Ross School of Business at the University of Michigan |
|
Francisco Perez-Arce |
Economist |
Center for Economic and Social Research at The University of Southern California |
|
Laura Quinby |
Senior Research Economist |
The Center for Retirement Research at Boston College |
|
Jen Schramm |
Senior Policy Advisor |
AARP |
|
Sita Slavov |
Professor of Public Policy |
George Mason University |
|
Gal Wettstein |
Senior Research Economist |
The Center for Retirement Research at Boston College |
Source: GAO analysis of experts’ responses to GAO’s questionnaire. | GAO‑25‑106962
aWe listed the names and affiliated organizations of experts who provided responses to our written questionnaire and gave us permission to share their names in our report. We received permission from 17 out of the 25 respondents who completed our questionnaire to share their names.
Identification of policy options for review. GAO also developed a list of 30 policy options identified by other experts in previous GAO work or in recent academic or policy studies to support discouraged or unemployed older workers. A written questionnaire allowed us to solicit and capture experts’ opinions on the policy options likely to enhance the employment outcomes of discouraged or unemployed older workers in an efficient manner.[93] We grouped the 30 policy options into four thematic areas:
· policies that encourage employers to hire and/or retain older workers,
· policies that reduce older workers’ barriers to finding employment,
· policies that increase oversight and protections of older workers’ employment outcomes, and
· policies that enhance certain DOL initiatives supporting older workers’ employment.
We selected most of our policy options from our prior work and a September 2023 National Academy of Social Insurance panel report to identify policy options that experts proposed to enhance the employment outcomes of older workers.[94] We also identified policy options through discussions with experts who are active in researching the issue. We also conducted a literature search that enhanced the team’s understanding of the strengths and challenges associated with the older workforce, but this literature search did not generate any additional expert-identified policy options. With regard to the prior work that supports our current questionnaire, we relied on the list of policy options identified in a survey administered in conjunction with GAO’s Unemployed Older Workers: Many Experience Challenges Regaining Employment and Face Reduced Retirement Security (GAO‑12‑445).[95]
For the purposes of our discussion, we limited our list of policy options to those that may enhance the employment outcomes of older workers or may support employers’ efforts to hire older workers. Additionally, we focused on federal policy options that would require action by either DOL or Congress, and we did not include state- and local-level initiatives. We excluded policy options that addressed the SSA or its benefit programs, any federal agency other than DOL, the federal-state-level Unemployment Insurance program, and state-level options.[96] We also excluded options aimed at addressing attitudinal challenges among employers, such as employer stereotypes that older adults are difficult to train or have lower productivity than younger workers. Attitudinal challenges among employers’ opinions may include age discrimination or employer-held stereotypes that diminish older job seekers’ prospects; certain actions are prohibited under federal law, but we did not attempt to assess the extent to which these actions are prevalent in the workforce in this report.[97]
Development of questionnaire. When developing our written questionnaire, we created an initial draft and solicited comments on it from internal stakeholders and external experts. We conducted interviews (in addition to the semi-structured interviews described previously) with experts to ask for their feedback on the draft questionnaire and identify any areas that needed clarification. After receiving their technical comments, we revised the list of policy options and the written questionnaire. While experts provided comments that addressed a range of relevant issues, they did not suggest including additional policy options that would address federal efforts to support evolving workplace practices, including flexible work arrangements such as part-time work, contract work, and remote work. We received responses from 25 out of 32 experts, a 78 percent response rate.
Analysis of responses. When analyzing the 25 responses we received, we tallied the experts’ rankings for each policy option. The five proposed policies addressed in the body of this report we called “favored” as they were those that were ranked as highly or moderately effective by at least 12 of the 25 experts. The sum of rankings reflects the experts’ opinions, and no empirical testing was done to verify whether any individual policy option would be effective.
Interpretation of responses. The expert-identified policy options cited in this report should be interpreted in the context of two key limitations and qualifications. First, although we were able to secure the participation of a balanced, highly qualified group of experts, we could not include other experts in this field because we needed to limit the size of the group. Although many points of view were represented, the group of experts we interviewed was not representative of all potential views, and the written questionnaire results are not generalizable.[98] Second, while we conducted preliminary research and heard from national experts in their fields through our expert interviews, these discussions do not represent the full variety of expert opinions on the policy proposals. Nevertheless, the experts who participated provided insightful comments in their responses to the questionnaire. The policy options and information we obtained via the written questionnaire represents the views of the experts and should not be interpreted as GAO endorsing any of them.
We conducted this performance audit from July 2023 to May 2025 in accordance with generally accepted government auditing standards. Those standards require that we plan and perform the audit to obtain sufficient, appropriate evidence to provide a reasonable basis for our findings and conclusions based on our audit objectives. We believe that the evidence obtained provides a reasonable basis for our findings and conclusions based on our audit objectives.
Appendix II: Detailed Information on the Estimated Number of Employed and Unemployed Individuals by Age Grouping
To identify trends in older workers’ employment status, including any demographic differences among worker subpopulations, we analyzed monthly data from 2017 through 2023 from the Current Population Survey (CPS) produced by the Bureau of Labor Statistics. We analyzed CPS data to estimate the numbers of individuals aged 25 to 54, 55 to 64, and 65 and older who were employed or unemployed, by quarter, from 2017 to 2023. We also analyzed CPS data to estimate the labor force participation rate by racial and ethnic group and by sex, among other things. This appendix presents selected results of our analyses.
Table 3: Estimated Number Employed, Number Unemployed, Unemployment Rate, Labor Force Participation Rate, and Associated Margins of Error, Ages 25 to 54, by Annual Quarter, 2017–2023
|
Year, quarter |
Estimated number employed |
Margin of error (+/-) |
Estimated number unemployed |
Margin of error (+/-) |
Estimated unemployment ratea |
Estimated labor force participation rateb |
|
2017q1 |
98,064,085 |
1,202,983 |
4,406,249 |
186,703 |
4.3% |
81.6% |
|
2017q2 |
98,761,548 |
1,205,564 |
3,713,936 |
168,261 |
3.6% |
81.6% |
|
2017q3 |
98,806,141 |
1,210,499 |
3,889,365 |
172,199 |
3.8% |
81.7% |
|
2017q4 |
99,642,504 |
1,223,245 |
3,383,715 |
161,282 |
3.3% |
81.9% |
|
2018q1 |
99,658,701 |
1,239,785 |
3,861,593 |
174,969 |
3.7% |
82.0% |
|
2018q2 |
100,207,438 |
1,238,934 |
3,244,219 |
154,912 |
3.1% |
81.9% |
|
2018q3 |
100,219,069 |
1,245,579 |
3,290,516 |
157,550 |
3.2% |
81.9% |
|
2018q4 |
101,122,131 |
1,265,426 |
3,169,428 |
157,316 |
3.0% |
82.4% |
|
2019q1 |
100,512,775 |
1,273,845 |
3,658,308 |
174,064 |
3.5% |
82.6% |
|
2019q2 |
100,747,363 |
1,277,851 |
2,938,523 |
152,305 |
2.8% |
82.1% |
|
2019q3 |
100,709,757 |
1,280,027 |
3,205,313 |
160,836 |
3.1% |
82.3% |
|
2019q4 |
101,900,524 |
1,296,210 |
3,011,579 |
159,084 |
2.9% |
83.0% |
|
2020q1 |
100,749,685 |
1,307,445 |
3,673,946 |
182,841 |
3.5% |
82.9% |
|
2020q2 |
90,133,406 |
1,343,191 |
11,328,118 |
375,814 |
11.2% |
80.5% |
|
2020q3 |
93,978,823 |
1,324,211 |
8,150,706 |
308,398 |
8.0% |
81.0% |
|
2020q4 |
96,377,954 |
1,288,953 |
6,044,060 |
249,036 |
5.9% |
81.2% |
|
2021q1 |
96,368,306 |
1,297,718 |
6,146,255 |
253,909 |
6.0% |
81.3% |
|
2021q2 |
97,199,049 |
1,314,487 |
5,339,831 |
235,436 |
5.2% |
81.3% |
|
2021q3 |
98,056,893 |
1,334,519 |
4,850,599 |
220,670 |
4.7% |
81.6% |
|
2021q4 |
99,793,023 |
1,358,459 |
3,666,455 |
190,383 |
3.5% |
82.0% |
|
2022q1 |
100,954,040 |
1,388,038 |
3,756,586 |
192,950 |
3.6% |
82.3% |
|
2022q2 |
101,639,286 |
1,383,479 |
3,034,404 |
171,230 |
2.9% |
82.4% |
|
2022q3 |
101,656,990 |
1,395,793 |
3,206,125 |
178,365 |
3.1% |
82.5% |
|
2022q4 |
101,985,350 |
1,411,635 |
3,037,206 |
172,249 |
2.9% |
82.6% |
|
2023q1 |
102,601,398 |
1,441,956 |
3,484,446 |
197,073 |
3.3% |
83.1% |
|
2023q2 |
103,328,630 |
1,432,041 |
3,159,340 |
176,209 |
3.0% |
83.3% |
|
2023q3 |
103,302,482 |
1,432,566 |
3,390,971 |
186,579 |
3.2% |
83.3% |
Source: GAO analysis of Current Population Survey monthly data. | GAO‑25‑106962
All margins of error are at the 95 percent confidence level.
aThe maximum margin of error is +/-0.3 percent for all estimates.
bThe maximum margin of error is +/-0.5 percent for all estimates.
Table 4: Estimated Number Employed, Number Unemployed, Unemployment Rate, Labor Force Participation Rate, and Associated Margins of Error, Ages 55 to 64, by Annual Quarter, 2017–2023
|
Year, quarter |
Estimated number employed |
Margin of error (+/-) |
Estimated number unemployed |
Margin of error (+/-) |
Estimated unemployment ratea |
Estimated labor force participation rateb |
|
2017q1 |
25,820,450 |
542,114 |
926,642 |
80,250 |
3.5% |
64.4% |
|
2017q2 |
26,096,638 |
543,051 |
743,018 |
70,883 |
2.8% |
64.5% |
|
2017q3 |
26,079,733 |
540,318 |
878,188 |
77,103 |
3.3% |
64.6% |
|
2017q4 |
26,293,998 |
549,116 |
794,183 |
74,113 |
2.9% |
64.7% |
|
2018q1 |
26,218,830 |
553,709 |
899,081 |
79,801 |
3.3% |
64.6% |
|
2018q2 |
26,612,579 |
562,133 |
736,586 |
72,080 |
2.7% |
65.0% |
|
2018q3 |
26,578,962 |
561,822 |
778,175 |
72,115 |
2.8% |
64.9% |
|
2018q4 |
26,880,041 |
568,075 |
737,473 |
73,766 |
2.7% |
65.4% |
|
2019q1 |
26,720,121 |
564,151 |
798,760 |
74,660 |
2.9% |
65.3% |
|
2019q2 |
26,833,955 |
569,764 |
685,800 |
68,252 |
2.5% |
65.2% |
|
2019q3 |
26,967,447 |
577,747 |
719,946 |
69,273 |
2.6% |
65.5% |
|
2019q4 |
27,064,042 |
574,918 |
636,141 |
65,027 |
2.3% |
65.5% |
|
2020q1 |
26,790,484 |
573,342 |
818,397 |
78,220 |
3.0% |
65.4% |
|
2020q2 |
24,178,632 |
577,767 |
2,952,308 |
166,888 |
10.9% |
64.3% |
|
2020q3 |
25,320,809 |
585,627 |
2,064,473 |
139,163 |
7.5% |
64.9% |
|
2020q4 |
25,584,552 |
571,946 |
1,514,922 |
113,745 |
5.6% |
64.3% |
|
2021q1 |
25,550,474 |
580,576 |
1,443,439 |
112,611 |
5.3% |
64.3% |
|
2021q2 |
25,868,592 |
584,214 |
1,257,977 |
104,275 |
4.6% |
64.7% |
|
2021q3 |
26,091,851 |
600,456 |
1,044,759 |
93,611 |
3.8% |
64.8% |
|
2021q4 |
26,182,099 |
608,063 |
806,590 |
82,700 |
3.0% |
64.6% |
|
2022q1 |
26,832,455 |
628,730 |
853,341 |
85,543 |
3.1% |
65.4% |
|
2022q2 |
26,835,605 |
618,690 |
692,585 |
74,034 |
2.5% |
65.2% |
|
2022q3 |
26,622,902 |
621,978 |
658,073 |
74,281 |
2.4% |
64.8% |
|
2022q4 |
26,799,001 |
631,358 |
593,510 |
70,156 |
2.2% |
65.3% |
|
2023q1 |
26,479,683 |
628,643 |
746,127 |
81,704 |
2.7% |
65.5% |
|
2023q2 |
26,470,920 |
623,203 |
638,357 |
74,387 |
2.4% |
65.4% |
|
2023q3 |
26,663,599 |
632,092 |
657,588 |
76,137 |
2.4% |
66.1% |
Source: GAO analysis of Current Population Survey monthly data. | GAO‑25‑106962
All margins of error are at the 95 percent confidence level.
aThe maximum margin of error is +/-0.7 percent from January 2017 to March 2020 and +/-0.8 percent from April 2020 to September 2023.
bThe maximum margin of error is +/-0.8 percent for all estimates.
Table 5: Estimated Number Employed, Number Unemployed, Unemployment Rate, Labor Force Participation Rate, and Associated Margins of Error, Aged 65 and Older, by Annual Quarter, 2017–2023
|
Year, quarter |
Estimated number employed |
Margin of error (+/-) |
Estimated number unemployed |
Margin of error (+/-) |
Estimated unemployment ratea |
Estimated labor force participation rateb |
|
2017q1 |
9,088,884 |
289,807 |
397,178 |
48,181 |
4.2% |
19.4% |
|
2017q2 |
9,277,263 |
297,211 |
343,113 |
47,273 |
3.6% |
19.5% |
|
2017q3 |
9,278,299 |
294,351 |
318,474 |
44,045 |
3.3% |
19.3% |
|
2017q4 |
9,317,491 |
294,984 |
316,572 |
44,268 |
3.3% |
19.2% |
|
2018q1 |
9,381,210 |
297,734 |
342,823 |
44,770 |
3.5% |
19.2% |
|
2018q2 |
9,724,385 |
305,715 |
300,542 |
41,443 |
3.0% |
19.6% |
|
2018q3 |
9,761,778 |
312,630 |
368,856 |
47,695 |
3.6% |
19.7% |
|
2018q4 |
9,971,918 |
312,918 |
296,821 |
40,812 |
2.9% |
19.8% |
|
2019q1 |
10,096,400 |
315,374 |
372,875 |
48,658 |
3.6% |
20.0% |
|
2019q2 |
10,114,580 |
316,738 |
301,899 |
42,294 |
2.9% |
19.8% |
|
2019q3 |
10,475,048 |
327,085 |
301,155 |
41,253 |
2.8% |
20.3% |
|
2019q4 |
10,721,662 |
328,053 |
291,455 |
39,170 |
2.6% |
20.5% |
|
2020q1 |
10,590,119 |
331,751 |
361,510 |
48,054 |
3.3% |
20.3% |
|
2020q2 |
8,881,829 |
312,079 |
1,348,349 |
105,725 |
13.2% |
18.8% |
|
2020q3 |
9,729,066 |
324,092 |
880,823 |
86,141 |
8.3% |
19.3% |
|
2020q4 |
10,095,409 |
328,637 |
592,773 |
65,807 |
5.5% |
19.3% |
|
2021q1 |
9,823,791 |
322,917 |
539,151 |
63,720 |
5.2% |
18.7% |
|
2021q2 |
9,927,168 |
326,142 |
541,654 |
65,165 |
5.2% |
18.7% |
|
2021q3 |
10,143,186 |
331,863 |
463,171 |
58,460 |
4.4% |
18.8% |
|
2021q4 |
10,619,565 |
346,283 |
341,765 |
50,543 |
3.1% |
19.3% |
|
2022q1 |
10,388,503 |
345,958 |
350,934 |
50,851 |
3.3% |
19.2% |
|
2022q2 |
10,424,447 |
342,970 |
311,876 |
45,806 |
2.9% |
19.0% |
|
2022q3 |
10,612,993 |
341,075 |
330,205 |
46,119 |
3.0% |
19.2% |
|
2022q4 |
10,900,698 |
354,760 |
301,045 |
44,498 |
2.7% |
19.5% |
|
2023q1 |
10,715,448 |
356,787 |
303,097 |
48,036 |
2.8% |
19.1% |
|
2023q2 |
10,767,012 |
352,736 |
294,063 |
43,521 |
2.7% |
19.1% |
|
2023q3 |
10,944,609 |
355,982 |
343,796 |
49,056 |
3.0% |
19.3% |
Source: GAO analysis of Current Population Survey monthly data. | GAO‑25‑106962
All margins of error are at the 95 percent confidence level.
aThe maximum margin of error is 0.5 percent from January 2017 to March 2020 and from July 2021 to September 2023, and +/-0.9 percent from April 2020 to June 2021.
bThe maximum margin of error is +/-0.6 percent for all estimates.
Table 6: Estimated Labor Force Participation Rate by Racial and Ethnic Group and Age Group, by Annual Quarter, 2017–2023
|
|
Ages 25–54 |
Ages 55–64 |
Ages 65 and older |
||||||||||
|
Year, quarter |
White |
Black |
Hispanic |
Asian |
White |
Black |
Hispanic |
Asian |
White |
Black |
Hispanic |
Asian |
|
|
2017q1 |
83.2% |
78.9% |
79.6% |
79.7% |
66.2% |
54.5% |
63.1% |
67.5% |
19.7% |
17.9% |
19.1% |
17.6% |
|
|
2017q2 |
83.2% |
79.4% |
79.4% |
79.5% |
66.3% |
55.1% |
62.0% |
68.1% |
19.6% |
19.1% |
18.9% |
20.2% |
|
|
2017q3 |
83.2% |
80.2% |
79.0% |
79.8% |
66.2% |
56.2% |
63.1% |
68.1% |
19.5% |
16.9% |
19.3% |
21.5% |
|
|
2017q4 |
83.6% |
80.0% |
79.1% |
79.0% |
66.4% |
55.6% |
63.9% |
68.0% |
19.4% |
17.7% |
18.3% |
19.5% |
|
|
2018q1 |
83.6% |
80.2% |
79.6% |
79.4% |
66.5% |
55.7% |
62.3% |
67.6% |
19.6% |
17.1% |
18.0% |
19.0% |
|
|
2018q2 |
83.5% |
79.8% |
80.0% |
79.7% |
66.6% |
57.3% |
62.9% |
66.7% |
20.0% |
17.4% |
18.6% |
19.4% |
|
|
2018q3 |
83.5% |
80.1% |
79.2% |
80.6% |
66.5% |
57.1% |
64.1% |
66.1% |
19.7% |
18.4% |
18.6% |
22.4% |
|
|
2018q4 |
84.2% |
80.3% |
80.0% |
79.6% |
66.8% |
56.2% |
65.2% |
71.1% |
20.0% |
17.6% |
18.9% |
20.8% |
|
|
2019q1 |
84.2% |
80.3% |
80.4% |
80.5% |
66.8% |
56.3% |
65.4% |
69.1% |
20.2% |
18.2% |
18.8% |
23.4% |
|
|
2019q2 |
84.0% |
79.8% |
79.4% |
80.2% |
66.4% |
58.5% |
65.5% |
65.5% |
20.2% |
17.0% |
19.0% |
19.4% |
|
|
2019q3 |
84.1% |
79.7% |
79.7% |
80.4% |
66.8% |
58.5% |
65.2% |
66.2% |
20.3% |
19.0% |
19.8% |
22.1% |
|
|
2019q4 |
84.7% |
81.1% |
80.8% |
80.4% |
67.0% |
55.2% |
65.5% |
70.7% |
20.6% |
19.6% |
20.3% |
21.7% |
|
|
2020q1 |
84.8% |
80.1% |
80.7% |
80.2% |
66.3% |
57.8% |
67.7% |
67.7% |
20.2% |
18.9% |
20.8% |
23.8% |
|
|
2020q2 |
82.9% |
76.7% |
77.2% |
78.5% |
65.7% |
56.5% |
65.2% |
62.4% |
19.1% |
17.0% |
18.3% |
18.3% |
|
|
2020q3 |
83.3% |
77.4% |
78.0% |
79.4% |
66.2% |
57.1% |
63.9% |
68.5% |
19.4% |
18.5% |
19.8% |
20.4% |
|
|
2020q4 |
83.2% |
78.1% |
78.7% |
79.0% |
65.9% |
55.3% |
63.5% |
67.4% |
19.5% |
17.6% |
19.9% |
19.3% |
|
|
2021q1 |
83.4% |
78.3% |
78.2% |
80.6% |
65.5% |
56.6% |
64.8% |
66.1% |
18.8% |
17.4% |
18.7% |
18.4% |
|
|
2021q2 |
83.1% |
79.1% |
78.4% |
80.4% |
65.7% |
57.3% |
65.0% |
68.2% |
18.7% |
19.0% |
19.4% |
16.8% |
|
|
2021q3 |
83.2% |
79.0% |
78.9% |
81.6% |
66.1% |
56.2% |
64.5% |
71.0% |
18.7% |
19.1% |
19.1% |
19.8% |
|
|
2021q4 |
83.7% |
78.9% |
79.5% |
82.0% |
65.8% |
55.5% |
66.1% |
69.9% |
19.2% |
19.0% |
17.9% |
22.1% |
|
|
2022q1 |
83.9% |
80.1% |
80.1% |
81.6% |
66.7% |
58.9% |
66.4% |
65.4% |
19.1% |
18.9% |
19.7% |
19.1% |
|
|
2022q2 |
83.6% |
80.9% |
80.1% |
82.3% |
66.0% |
60.1% |
65.7% |
68.8% |
19.0% |
18.5% |
19.0% |
19.8% |
|
|
2022q3 |
83.7% |
80.7% |
80.3% |
82.8% |
65.8% |
58.1% |
65.1% |
68.3% |
19.0% |
19.8% |
18.9% |
21.6% |
|
|
2022q4 |
84.2% |
80.7% |
80.2% |
81.7% |
66.3% |
58.5% |
65.9% |
67.6% |
19.3% |
18.9% |
19.8% |
22.6% |
|
|
2023q1 |
84.5% |
81.7% |
80.9% |
82.6% |
66.0% |
60.7% |
66.4% |
70.6% |
19.2% |
18.9% |
19.4% |
16.7% |
|
|
2023q2 |
84.5% |
82.3% |
81.1% |
83.0% |
66.2% |
60.2% |
65.7% |
69.7% |
19.0% |
18.9% |
19.5% |
19.9% |
|
|
2023q3 |
84.8% |
81.3% |
81.3% |
83.1% |
66.7% |
61.2% |
66.2% |
71.0% |
18.8% |
20.5% |
21.5% |
20.5% |
|
Source: GAO analysis of Current Population Survey monthly data. l GAO‑25‑106962
Notes: The maximum margins of error at the 95 percent confidence level for estimates, by racial group and age, are as follows: White, ages 25–54, +/-0.5 percentage points; White, ages 55–64, +/-1.0 percentage points; White, 65 and older, +/-0.6 percentage points; Black, ages 25–54, +/-1.3 percentage points; Black, ages 55–64, +/-2.6 percentage points; Black, 65 and older, +/-1.8 percentage points; Hispanic, ages 25–54, +/-0.9 percentage points; Hispanic, ages 55–64, +/-2.3 percentage points, Hispanic, 65 and older, +/-2.1 percentage points; Asian, ages 25–54, +/-1.4 percentage points; Asian, ages 55–64, +/-3.6 percentage points; Asian, 65 and older, +/-3.0 percentage points. Other races and ethnicities are not reported because we were unable to produce separate, reliable estimates for those groups.
Table 7: Estimated Labor Force Participation Rate by Sex and Age Group, by Annual Quarter, 2017–2023
|
|
Ages 25–54 |
Ages 55–64 |
Ages 65 and older |
||||||
|
Year, quarter |
Male |
Female |
Male |
Female |
Male |
Female |
|||
|
2017q1 |
88.6% |
74.8% |
70.1% |
59.1% |
23.7% |
15.9% |
|||
|
2017q2 |
88.6% |
74.8% |
70.7% |
58.7% |
24.1% |
15.8% |
|||
|
2017q3 |
88.6% |
74.9% |
70.8% |
58.8% |
24.1% |
15.5% |
|||
|
2017q4 |
88.7% |
75.3% |
70.9% |
59.0% |
23.7% |
15.5% |
|||
|
2018q1 |
89.1% |
75.1% |
70.8% |
58.9% |
23.5% |
15.7% |
|||
|
2018q2 |
89.1% |
74.9% |
71.4% |
59.1% |
24.3% |
15.9% |
|||
|
2018q3 |
88.8% |
75.2% |
71.2% |
59.0% |
24.4% |
15.8% |
|||
|
2018q4 |
89.0% |
76.0% |
71.6% |
59.6% |
24.0% |
16.3% |
|||
|
2019q1 |
89.4% |
75.9% |
71.3% |
59.7% |
24.1% |
16.7% |
|||
|
2019q2 |
88.9% |
75.5% |
71.6% |
59.2% |
24.5% |
16.0% |
|||
|
2019q3 |
89.0% |
75.8% |
71.8% |
59.7% |
25.2% |
16.2% |
|||
|
2019q4 |
89.2% |
77.0% |
71.6% |
59.8% |
25.1% |
16.8% |
|||
|
2020q1 |
89.2% |
76.8% |
71.5% |
59.7% |
24.8% |
16.7% |
|||
|
2020q2 |
87.1% |
74.1% |
70.6% |
58.4% |
23.3% |
15.2% |
|||
|
2020q3 |
87.7% |
74.5% |
70.8% |
59.4% |
23.9% |
15.7% |
|||
|
2020q4 |
87.6% |
75.0% |
70.2% |
58.8% |
23.8% |
15.7% |
|||
|
2021q1 |
87.6% |
75.2% |
70.1% |
58.8% |
22.9% |
15.2% |
|||
|
2021q2 |
87.9% |
75.0% |
70.7% |
59.1% |
23.2% |
15.1% |
|||
|
2021q3 |
88.2% |
75.1% |
70.8% |
59.3% |
23.5% |
15.0% |
|||
|
2021q4 |
88.2% |
76.0% |
70.2% |
59.4% |
23.8% |
15.6% |
|||
|
2022q1 |
88.5% |
76.3% |
71.1% |
60.0% |
23.9% |
15.3% |
|||
|
2022q2 |
88.6% |
76.2% |
70.8% |
59.9% |
23.5% |
15.2% |
|||
|
2022q3 |
88.6% |
76.4% |
70.7% |
59.2% |
23.7% |
15.5% |
|||
|
2022q4 |
88.5% |
76.7% |
71.5% |
59.3% |
23.8% |
15.8% |
|||
|
2023q1 |
88.9% |
77.3% |
71.4% |
59.9% |
23.2% |
15.7% |
|||
|
2023q2 |
89.2% |
77.4% |
71.4% |
59.7% |
23.0% |
15.8% |
|||
|
2023q3 |
89.4% |
77.3% |
71.5% |
60.8% |
23.1% |
16.1% |
|||
Source: GAO analysis of Current Population Survey monthly data. | GAO‑25‑106962
Notes: The maximum margins of error at the 95 percent confidence level for estimates, by gender and age group, are as follows: male, ages 25–54, +/-0.5 percent; female, ages 25–54, +/-0.6 percent; male, ages 55–64, +/-1.1 percent; female, ages 55–64, +/-1.1 percent; male, ages 65 and older, +/-0.8 percent; female, 65 and older, +/-0.6 percent.
Appendix III: Survey of Consumer Finances Estimates of Retirement Savings, Assets Held, and Quarantine-Related Experiences
We analyzed 2019 and 2022 Survey of Consumer Finances (SCF) data to estimate median incomes for all income quartiles, including prime-age (aged 25 to 54) and older (aged 55 and older) households. Also, we developed estimates regarding the extent to which prime-age (aged 25 to 54) and older (aged 55 and older) households had retirement accounts and the estimated median balances of those retirement accounts. In addition, we estimated the median total value of assets held by households across occupations, gender, and family structures. Furthermore, we analyzed a portion of the responses to the Quarantine-Related Experience Questions in the 2022 SCF data to observe older households’ (aged 55 to 64) and oldest households’ (65 and older) pandemic experiences. This appendix presents selected results from our analysis.
Median income for older households with and without retirement accounts. In our analysis of the SCF, we estimated the median income for older households (aged 55 and older) for each income quartile, and we observed whether these households had a positive retirement account balance (see fig. 17).
Figure 17: Estimated Median Income of Older Households (55 and Older) with a Positive Retirement Account Balance, by Income Quartile, 2019 and 2022
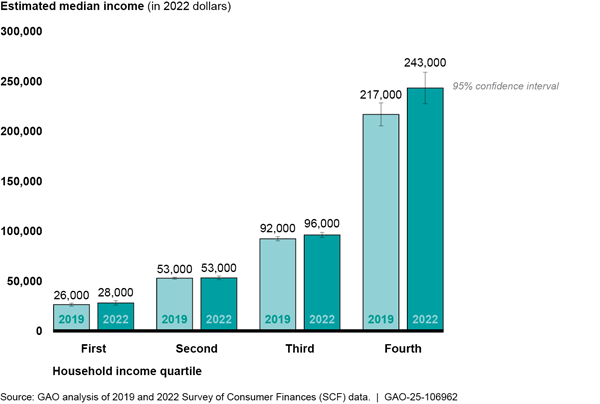
Note: These older households (aged 55 and older) reported having a balance greater than $0 in retirement accounts in both the 2019 and 2022 SCFs.
In addition, we estimated the median income for older households (aged 55 and older) for each income quartile without a positive balance in their retirement account (see fig. 18).
Figure 18: Estimated Median Income of Older Households (Aged 55 and Older) Without a Positive Retirement Account Balance, by Income Quartile, 2019 and 2022
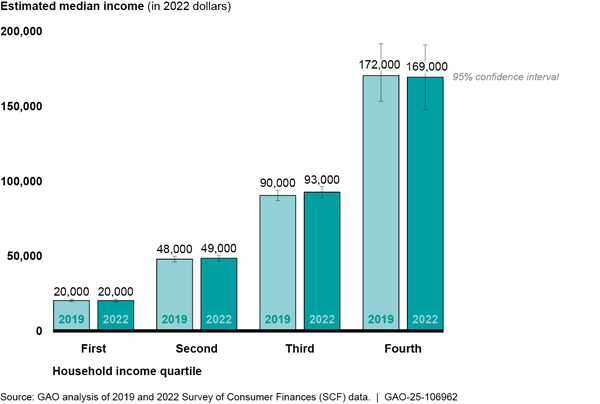
Note: These older households (head of household aged 55 and older) reported having a balance equal to $0 in retirement accounts in both the 2019 and 2022 SCFs.
Prime-age households’ retirement account prevalence and median balance. We analyzed the percentage of prime-age households (aged 25 to 54) that had a positive retirement account balance across income quartiles using 2019 and 20222 SCF data (see fig. 19).
Figure 19: Estimated Percentage of Prime-Age Households (Aged 25–54) with a Positive Balance in Their Retirement Account, by Income Quartile, 2019 and 2022
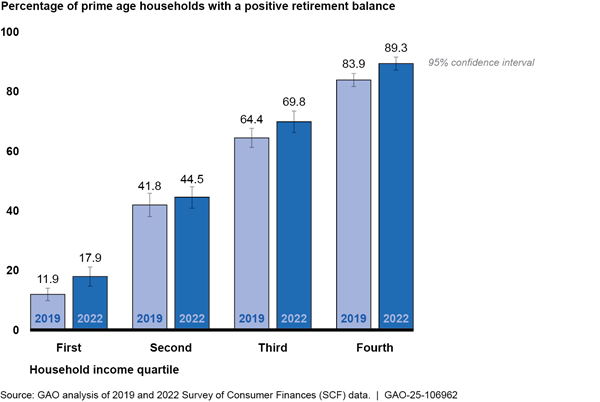
Note: These prime-age households (aged 25 to 54) reported having a balance greater than $0 in retirement accounts in both the 2019 and 2022 SCFs.
In addition, we reviewed the median retirement account balances for prime-age (aged 25 to 54) households that had a positive balance by income quartile (see fig. 20).
Figure 20: Estimated Median Retirement Account Balance for Prime-Age Households (Aged 25–54), by Income Quartile, 2019 and 2022
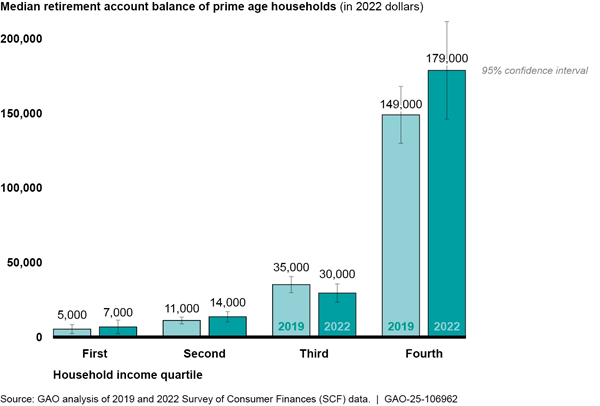
Note: These prime-age households (aged 25 to 54) reported having a balance greater than $0 in retirement accounts in both the 2019 and 2022 SCFs.
In addition, we developed estimates for the median income for each income quartile of prime-age (aged 25 to 54) households with a positive retirement account balance (see fig. 21).
Figure 21: Estimated Median Income of Prime-Age Households (Aged 25–54) with a Positive Retirement Account Balance, by Income Quartile, 2019 and 2022
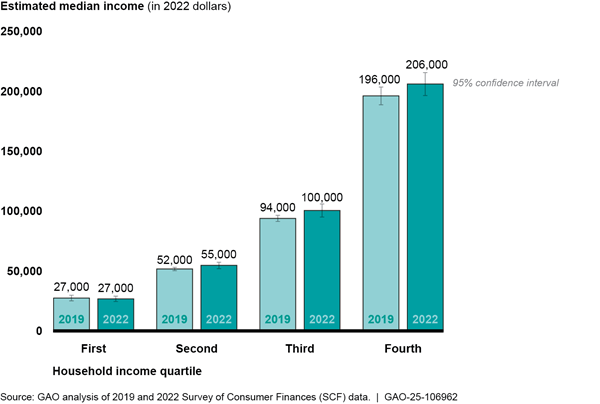
Note: These prime-age households (head of household aged 25 to 54) reported having a balance greater than $0 in a retirement account in both the 2019 and 2022 SCFs.
Additionally, we developed estimates for the median income of each income quartile for prime-age households (aged 25 to 54) without a positive balance in their retirement account (see fig. 22).
Figure 22: Estimated Median Income of Prime-Age Households (Aged 25–54) Without a Positive Retirement Account Balance, by Income Quartile, 2019 and 2022
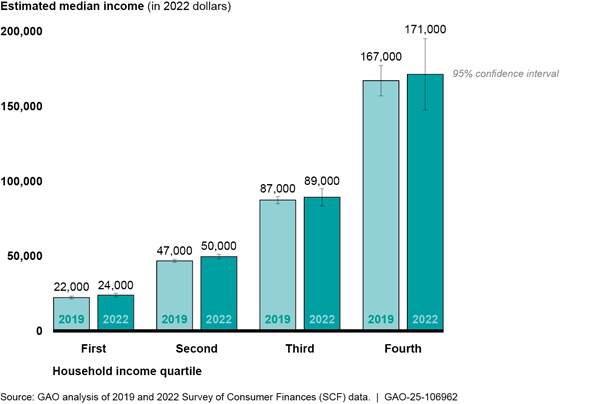
Note: These prime-age households (head of household aged 25 to 54) reported having a balance equal to $0 in a retirement account in both the 2019 and 2022 SCFs.
Median income by education and age. We analyzed the incomes of prime-age (aged 25 to 54), older (aged 55 to 64), and oldest (aged 65 and older) households by educational level using 2019 and 2022 SCF data (see fig. 23).
Figure 23: Estimated Median Income by Households by Age Group and Highest Level of Educational Attainment, 2019 and 2022
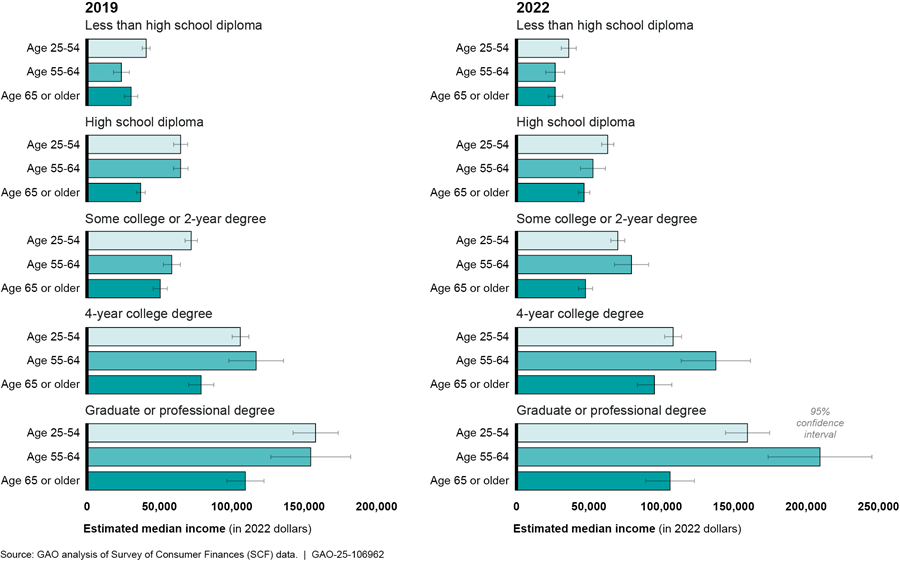
Note: For the purposes of this report, we used the head of household’s age and educational attainment as the household’s age and educational attainment.
Median total value of assets by age and occupation. Using the SCF data, we analyzed the median total value of assets held by households across occupations and age groups, including prime-age (aged 25 to 54), older (aged 55 to 64) and oldest (aged 65 and older) households for both 2019 and 2022 (see fig. 24).
Figure 24: Estimated Median Total Value of Assets Held by Households by Occupation and Age Group, 2019 and 2022
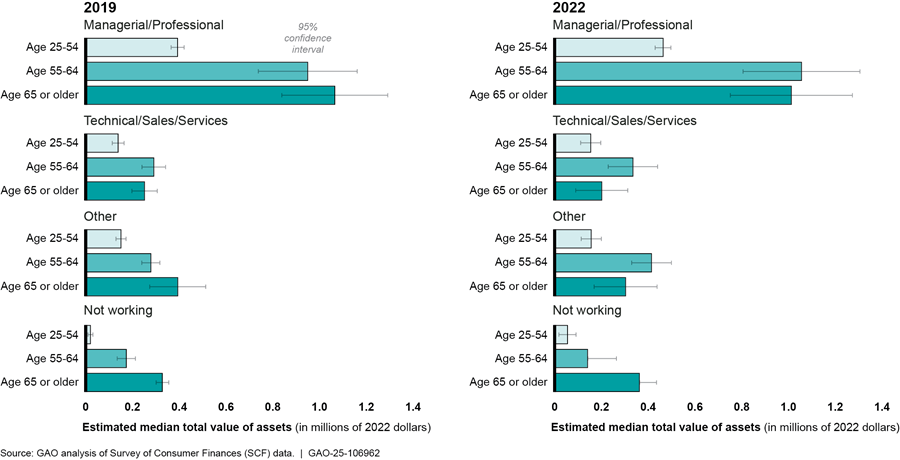
Note: For the purposes of this report, we used the head of household’s age and occupation as the household’s age and occupation.
Median total value of assets by gender, age, and family structure. We analyzed whether the presence of children influenced asset holdings by age and gender group.
Figure 25: Estimated Median Total Value of Assets Held by Households by Gender, Age, and Family Structure, 2019 and 2022
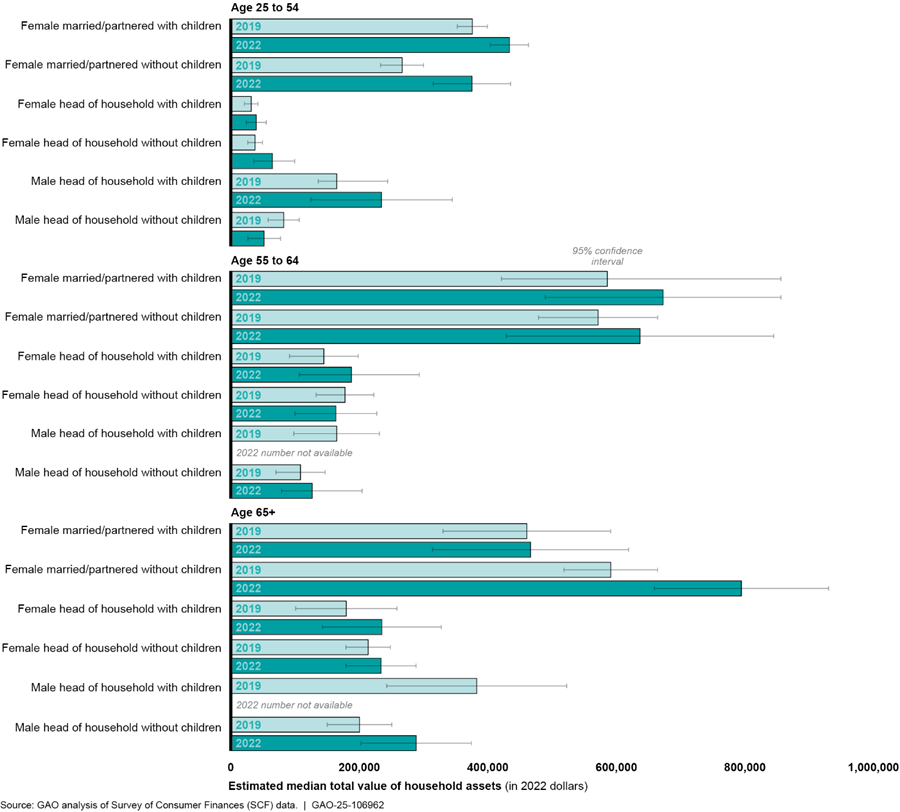
Note: We estimated the total value of assets held by gender, age, and family structure of the head of household. The SCF uses sex, which is defined as male and female.
COVID-19 pandemic experiences. The 2022 SCF included additional questions to capture pandemic experiences at the household level, including questions about the early onset of the pandemic.[99] We analyzed the pandemic experiences of older (aged 55 to 64) and oldest (aged 65 and older) households as well as their employment status during the pandemic across income quartiles (see figs. 26 and 27).
Figure 26: Oldest Households’ (Aged 65 and Older) Pandemic Experiences with Employment, by Income Quartile, 2022
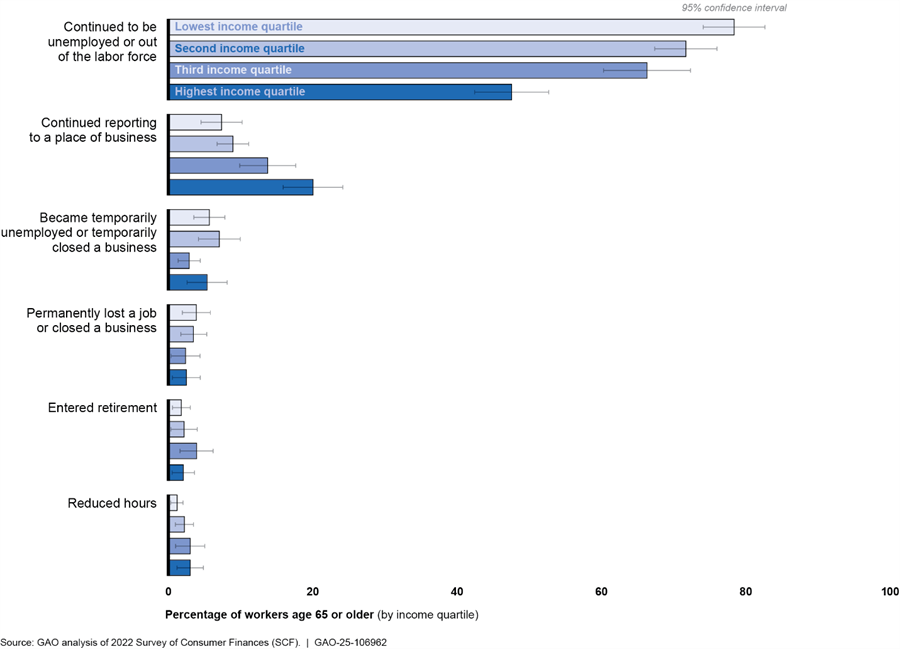
Note: We are not reporting several estimates because they are statistically indistinguishable from 0 due to high sampling error.
Figure 27: Older Households’ (Aged 55–64) Pandemic Experiences with Employment, by Income Quartile, 2022
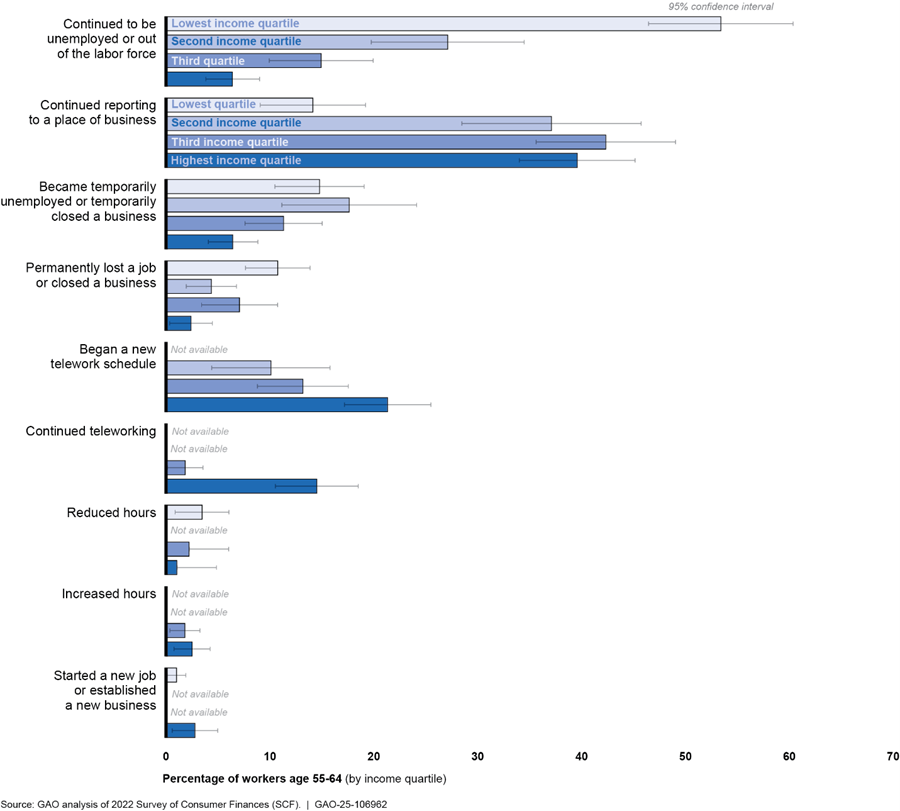
Note: We are reporting estimates listed as “not available” because they are statistically indistinguishable from 0 due to high sampling error.
Appendix IV: Experts’ Responses Regarding Policy Options to Enhance Older Workers’ Employment Outcomes
The following table provides a tally of experts’ responses to our written questionnaire listing 30 policy options aimed at enhancing employment outcomes for discouraged or unemployed older workers. Experts ranked each of the 30 options on a scale including “highly effective,” “moderately effective,” “a little effective,” “not at all effective,” “option is outside my area of expertise,” or “don’t know/no response.” Table 8 provides the total tallies regarding experts’ ratings of each policy option at each level of effectiveness. We grouped the policy options into four thematic areas: (1) policies to encourage employers to hire and/or retain older workers, (2) policies to increase oversight and protections of older workers’ employment outcomes, (3) policies to reduce older workers’ barriers to finding employment, and (4) policies for Department of Labor (DOL) initiatives that could enhance older workers’ employment.
|
|
Highly effective |
Moderately effective |
A little effective |
Not at all effective |
Option is outside my area of expertise |
Don’t know/no response |
Total effectiveness ratings for this option |
||||||
|
Policies to encourage employers to hire and/or retain older workers |
|||||||||||||
|
Congress provides funding, for example through wage subsidies or tax credits, to employers that hire long-term unemployed older workers. |
5 |
5 |
8 |
5 |
1 |
1 |
25 |
||||||
|
Congress provides tax credits to businesses that employ a high percentage of older workers (such as 50 percent or more). |
4 |
3 |
10 |
5 |
1 |
2 |
25 |
||||||
|
Congress removes the requirement that Medicare generally be the secondary payer for workers 65+ who are covered by an employer health plan. |
8 |
7 |
4 |
2 |
1 |
3 |
25 |
||||||
|
Congress lowers the age of Medicare eligibility (e.g., to age 55) to reduce the associated insurance costs of hiring, and encourage employers to retain, older workers. |
5 |
3 |
7 |
4 |
1 |
5 |
25 |
||||||
|
Reduce the cost of employing older workers by allowing employers to opt out of paying Social Security payroll tax once a worker has accumulated 35 years of covered earnings. |
4 |
9 |
3 |
7 |
0 |
2 |
25 |
||||||
|
Allow for a mandatory retirement age (e.g., equal to the full Social Security retirement age) to be established for new hires who are within 10 years of that age, to reduce employers’ long-term commitment to newly hired older workers. |
0 |
2 |
2 |
16 |
1 |
4 |
25 |
||||||
|
Policies to increase oversight and protections of older workers’ employment outcomes |
|||||||||||||
|
Congress establishes an Office for Older Workers to coordinate programs to support older workers across departments, establish performance indicators for these programs, and conduct an intensive review of all Department of Labor (DOL) services to older workers. |
6 |
2 |
10 |
5 |
1 |
1 |
25 |
||||||
|
Congress establishes a permanent interagency working group to support older workers by improving coordination and cooperation among federal and state agencies. |
6 |
1 |
6 |
10 |
1 |
1 |
25 |
||||||
|
DOL develops and collects measures of older workers’ productivity through established workforce surveys so that employers have such information. |
2 |
2 |
10 |
10 |
0 |
1 |
25 |
||||||
|
DOL’s Bureau of Labor Statistics (BLS) regularly collects and analyzes the number and characteristics of unemployed older Americans in workforce investment areas to allow better targeting of services (e.g., by worker occupation, industry, or demographics). |
2 |
6 |
9 |
5 |
2 |
1 |
25 |
||||||
|
Congress expands the Job Accommodation Network (that collects data on the costs of accommodations and other disability-related employment issues), to provide resources on job accommodations and related costs for older workers. |
2 |
6 |
6 |
7 |
2 |
2 |
25 |
||||||
|
Congress revises language in the Disability Act to enhance requirements for reasonable accommodations thereby providing older workers with more workplace flexibility and removing employment barriers.a |
6 |
4 |
7 |
7 |
2 |
2 |
25 |
||||||
|
Congress passes legislation that prohibits employers and employment agencies from screening workers out of the candidate pool solely because they are unemployed. |
3 |
5 |
3 |
10 |
1 |
3 |
25 |
||||||
|
Policies to reduce older workers’ barriers to finding employment |
|||||||||||||
|
Congress enacts a Job Seekers’ Allowance to provide a stipend that supports low-wage older workers who do not qualify for unemployment insurance benefits during their job search. |
3 |
5 |
7 |
8 |
1 |
1 |
25 |
||||||
|
Congress enacts a reemployment bonus program for older Americans that provides a bonus to Unemployment Insurance claimants who accept new jobs within a 3-6 month time period. |
2 |
5 |
10 |
5 |
1 |
2 |
25 |
||||||
|
Congress enacts a wage insurance program to temporarily compensate older Americans that accepted new full-time jobs that pay less than their previous jobs within 27 weeks of filling for Unemployment Insurance. |
1 |
13 |
7 |
2 |
2 |
0 |
25 |
||||||
|
Congress requires long-term unemployed (27 or more weeks) older Americans to enroll in publicly funded or subsidized retraining programs as a condition of receiving Unemployment Insurance.b |
2 |
6 |
8 |
6 |
1 |
1 |
24 |
||||||
|
DOL develops a training program for low-skilled older workers to facilitate a job change at both mid- and late-career. |
2 |
7 |
10 |
5 |
0 |
1 |
25 |
||||||
|
DOL establishes an older worker online coaching program that works with older workers and workforce professionals through web resources and DOL’s CareerOneStop: 55+ Workers website to find training resources for older workers. |
2 |
7 |
7 |
7 |
0 |
2 |
25 |
||||||
|
Congress increases funding for the Senior Community Service Employment Program (SCSEP) to expand eligibility or increase wages. |
5 |
3 |
8 |
2 |
5 |
2 |
25 |
||||||
|
Congress removes the enrollment priority given to veterans and qualified spouses in the SCSEPb |
2 |
0 |
4 |
7 |
5 |
6 |
24 |
||||||
|
Congress changes Workforce Investment Act of 1998 and Senior Community Service Employment Program (SCSEP) performance measures to eliminate any disincentives to placing older workers in part-time employment. |
4 |
5 |
9 |
1 |
3 |
3 |
25 |
||||||
|
Policies for DOL initiatives that could enhance older workers’ employment |
|||||||||||||
|
DOL develops a comprehensive, visible campaign to educate employers on the strengths and/or appropriateness of older workers. |
2 |
5 |
12 |
6 |
0 |
0 |
25 |
||||||
|
DOL identifies legal, regulatory, logistical, or other barriers to the employment of older workers and reports on approaches for reducing those barriers and any associated regulatory changes. |
3 |
9 |
8 |
2 |
0 |
3 |
25 |
||||||
|
DOL increases efforts to encourage American Job Centers to prioritize job-matching services to older workers with existing skills to available jobs. |
5 |
6 |
8 |
3 |
1 |
2 |
25 |
||||||
|
DOL improves program evaluation measures about existing employment and training programs for older job seekers. |
5 |
5 |
12 |
2 |
0 |
1 |
25 |
||||||
|
DOL provides information to employers and stakeholders about effective strategies for supporting older workers. |
4 |
4 |
10 |
4 |
0 |
3 |
25 |
||||||
|
DOL develops new, or improves existing, job search assistance programs to support older Americans. |
5 |
8 |
8 |
3 |
0 |
1 |
25 |
||||||
|
DOL encourages partnerships between American Job Centers and Small Business Administration to provide entrepreneurial development services to older Americans. |
2 |
6 |
9 |
5 |
1 |
2 |
25 |
||||||
|
DOL encourages increased collaboration between SCSEP and American Job Centers by locating Job Center staff at SCSEP job sites that have current hiring opportunities. |
4 |
1 |
9 |
1 |
5 |
5 |
25 |
||||||
Source: GAO analysis of experts’ responses to GAO’s questionnaire. I GAO‑25‑106962
In the written questionnaire, experts selected from a list of 30 policy options. These 30 policy options were selected on a scale, including “highly effective,” “moderately effective,” “a little effective,” “not at all effective,” “option is outside my area of expertise,” or “don’t know/no response,” by experts. We sent our written questionnaire to 32 experts and received 25 responses. We selected most of our policy options presented in our prior work (GAO‑12‑445) and from a September 2023 National Academy of Social Insurance panel report to identified policy options that experts proposed to enhance the employment outcomes of older workers. We also identified policy options through discussions with experts who are active in researching the issue. GAO did not develop and does not endorse any of these policy options.
aThis option discusses the Americans with Disabilities Act of 1990.
bThis option only received 24 of 25 responses because one expert did not provide a response.
GAO Contact
Tranchau (Kris) T. Nguyen at nguyentt@gao.gov.
The Government Accountability Office, the audit, evaluation, and investigative arm of Congress, exists to support Congress in meeting its constitutional responsibilities and to help improve the performance and accountability of the federal government for the American people. GAO examines the use of public funds; evaluates federal programs and policies; and provides analyses, recommendations, and other assistance to help Congress make informed oversight, policy, and funding decisions. GAO’s commitment to good government is reflected in its core values of accountability, integrity, and reliability.
Obtaining Copies of GAO Reports and Testimony
The fastest and easiest way to obtain copies of GAO documents at no cost is through our website. Each weekday afternoon, GAO posts on its website newly released reports, testimony, and correspondence. You can also subscribe to GAO’s email updates to receive notification of newly posted products.
Order by Phone
The price of each GAO publication reflects GAO’s actual cost of production and distribution and depends on the number of pages in the publication and whether the publication is printed in color or black and white. Pricing and ordering information is posted on GAO’s website, https://www.gao.gov/ordering.htm.
Place orders by calling (202) 512-6000, toll free (866) 801-7077,
or
TDD (202) 512-2537.
Orders may be paid for using American Express, Discover Card, MasterCard, Visa, check, or money order. Call for additional information.
Connect with GAO
Connect with GAO on X,
LinkedIn, Instagram, and YouTube.
Subscribe to our Email Updates. Listen to our Podcasts.
Visit GAO on the web at https://www.gao.gov.
To Report Fraud, Waste, and Abuse in Federal Programs
Contact FraudNet:
Website: https://www.gao.gov/about/what-gao-does/fraudnet
Automated answering system: (800) 424-5454
Media Relations
Sarah Kaczmarek, Managing Director, Media@gao.gov
Congressional Relations
A. Nicole Clowers, Managing Director, CongRel@gao.gov
General Inquiries
[1]The Secretary of Health and Human Services declared COVID-19 a public health emergency under Section 319 of the Public Health Services Act on January 31, 2020, and the President declared COVID-19 a national emergency under the National Emergencies Act and a nationwide emergency under Section 501(b) of the Robert T. Stafford Disaster Relief and Emergency Assistance Act on March 13, 2020.
[2]GAO, Unemployed Older Workers: Many Experience Challenges Regaining Employment and Face Reduced Retirement Security, GAO‑12‑445 (Washington, D.C.: Apr. 25, 2012).
[3]Pub. L. No. 116-136, § 19010(b), 134 Stat. 281, 580 (2020).
[4]Displaced workers are workers who have lost a job in the past 3 years; however, they may be unemployed, employed, or not in the labor market at the time of the survey. The 2022 Displaced Worker Supplement was the most recent at the time of our analysis.
[5]The 2022 SCF was the most recent at the time of our analysis.
[6]More specifically, the policy options are focused on federal efforts that directly support older workers’ ability to maintain employment or to become reemployed during a period of unemployment and prevent them from experiencing long-term unemployment.
[7]See GAO‑12‑445 and The Older Workers’ Retirement Security Task Force, Older Workers in Physically Challenging Jobs Need Stronger Social Insurance Supports (Washington, D.C.: National Academy of Social Insurance, 2023).
[8]The Age Discrimination in Employment Act of 1967 prohibits employers from discriminating in employment on the basis of age, defined as being age 40 and over. 29 U.S.C. §§ 623, 631(a).
[9]We selected experts to provide a range of perspectives and experiences, including academics with expertise on older workers and retirement security, leaders from nonprofit organizations with programs to support these workers, and experts from organizations representing employers that hire older workers.
[10]DOL oversees other programs and activities to enhance older workers’ employment outcomes, including the Senior Community Service Employment Program, which is a community service and work-based job training program for low-income, unemployed older Americans, as well as the American Job Centers, which provide free help to job seekers including training referrals, career counseling, job listings, and similar employment-related services at their 2,300 locations.
[11]GAO issued a three-part report examining the financial challenges the Social Security program faces, criteria that policymakers may wish to consider when evaluating reforms to the program, and options for reform. See GAO, Social Security Series Part 1: The Dilemma, GAO‑23‑106667 (Washington, D.C.: May 2023); Social Security Series Part 2: Criteria for Evaluating Reform Proposals, GAO‑24‑106778 (Washington, D.C.: November 2023), and Social Security Series Part 3: Options for Reform, GAO‑24‑107240 (Washington, D.C.: July 2024).
[12]In this report, we use the term “Social Security retirement benefits” to refer to an individual’s retirement (old-age) benefits, but not other Social Security benefits such as spousal benefits or disability benefits, unless otherwise noted.
[13]To be fully insured under Social Security, a worker must have worked the equivalent of at least one quarter for each calendar year elapsing between when a worker turns 21 and when he or she reaches age 62, becomes disabled, or dies—whichever occurs first.
[14]The full retirement age increased gradually, first from 65 years for those born in 1937 and earlier to 66 years for those born in 1943 through 1954. It increased gradually again to 67 years for those born in 1960 or later.
[15]The maximum period for receiving Unemployment Insurance benefits was extended through temporary federal programs during prior economic downturns, including the 2007–2009 recession and the recent COVID-19 pandemic.
[16]These estimates have a margin of error of +/-0.3 percentage points, +/-0.8 percentage points, and +/-0.5 percentage points, respectively. The estimated unemployment rate for oldest workers (aged 65 and older) rose from 2.9 percent (+/-0.6 percentage points) in April 2019 to a peak of 15.6 percent (+/-1.4 percentage points) in April 2020 and then decreased to 4.7 percent (+/-0.8 percentage points) in April 2021. All margins of error in this report are calculated at the 95 percent confidence level. All CPS estimates are subject to sampling error. We present monthly estimates for employment rates and populations to represent the variation among months. We generally present other estimates on an annual quarterly basis to highlight overall trends. The unemployment rate is defined as the number of unemployed individuals divided by the total number of people in the labor force (either employed or able to work and actively searching for work in the last 4 weeks).
[17]This estimate has a margin of error of +/-0.4 percent. The unemployment rate for workers aged 65 and older also rebounded to pre-pandemic levels by April 2023 when it was an estimated 2.1 percent (+/-0.5 percent margin of error).
[18]In the second quarter of 2020, at the pandemic’s peak, 72 percent of workers aged 25 to 54 reported losing their job or being laid off as their reason for being unemployed compared to 78 percent of workers aged 55 to 64 and 85 percent of those 65 and older. These estimates have a margin of error of 1.4 percentage points, 2.2 percentage points, and 2.6 percentage points, respectively. We also note that, unlike long-term unemployment during the Great Recession of 2007–2009, older workers during the pandemic generally did not experience long-term unemployment—defined as being unemployed for 27 weeks or more—at greater rates than the prime-age workforce. See GAO‑12‑445.
[19]The labor force participation rate can be derived using information collected in the monthly CPS. The labor force participation rate is defined by the CPS as the number of people in the labor force as a percentage of the civilian noninstitutional population and represents the percentage of the population who are either working or actively looking for work.
[20]As measured from the second quarter 2019 to second quarter of 2020. For estimates of the labor force participation of those aged 25 to 54, 55 to 64, and 65 and older, see app. II.
[21]See GAO‑12‑445. That report noted that the increased labor force participation of older workers aged 55 and older during the 2007–2009 recession also continued a long-term trend that began in the 1990s and thus cannot be attributed solely to that recession or declines in financial markets at that time.
[22]These estimates have a margin of error of +/-7 percent, +/-4 percent, and +/-2 percent, respectively, according to our analysis. This trend of a greater proportion of workers aged 65 and older being reentrants than those aged 55 to 64 or those aged 25 to 54 held for 5 out of 7 quarters from the first quarter of 2022 to the third quarter of 2023, the end of the review period. CPS categorizes people who are unemployed by the reason they became unemployed.
[23]When a worker retires or exits the labor force, he or she is no longer counted as unemployed. This situation can contribute to a reduction in unemployment and also contributes to a reduction in the labor force participation rate; the unemployment rate may decrease, but the labor force participation rate may also have decreased. Most experts we spoke with said that because older individuals faced higher risks of significant adverse health effects from COVID-19, including death, a greater proportion of them chose to leave their jobs voluntarily after the onset of the pandemic rather than stay on the job and risk infection and its possible consequences. We used a standard set of questions to interview seven policy experts to ensure we consistently captured their views. To characterize interview views throughout this report, we defined modifiers (e.g., “several”) to quantify users’ views as follows: “nearly all” experts represents six interviews; “most” experts represents four to five interviews; “several” experts represents three interviews, and “few” experts represents two interviews.
[24]The margin of error for this estimate is +/-2.65 percent. See Rebecca Perron, Understanding the Great Resignation and Impact of COVID-19 on Work for the 50+ (Wave 1) (Washington, D.C.: AARP Research, 2022). In the second survey in July and August 2022, the percentage reporting that they had retired earlier due to the pandemic decreased to 17 percent (+/-2.95 percent margin of error). In the third survey in April and May 2023, this increased to 21 percent (+/-2.92 percent margin of error). See Lona Choi-Allum, Understanding the Great Resignation and Impact of COVID-19 on Work for the 50+ (Wave 2) (Washington, D.C.: AARP Research, 2022), and Understanding the Great Resignation and Impact of COVID-19 on Work for the 50+ (Wave 3) (Washington, D.C.): AARP Research, 2023).
[25]The likelihood of retiring (for any age group) increased only 1 percentage point—a 12 percent increase—with retirements concentrated in those aged 70 and older. The study analyzed CPS data for respondents who had completed initial interviews between January 2017 and March 2019 and follow-up interviews between January 2018 and March 2020 (pre-pandemic), and those who had completed initial interviews before April 2019 and March 2020 and follow-up interviews during the pandemic period between April 2020 and March 2021. The study re-weighted the matched longitudinal sample to accurately reflect the demographic profile of the full set of individuals observed in the initial month after applying baseline CPS population weights. See Owen F. Davis, Laura D. Quinby, Matthew S. Rutledge, and Gal Wittstein, How did COVID-19 affect the labor force participation of older workers in the first year of the pandemic? (Cambridge University Press, 2023).
[26]More specifically, an estimated 19.0 percent (+/-3.6 percent margin of error) of displaced workers aged 55 and older in the January 2022 Displaced Worker Supplement (displaced between 2019 and 2021) reported that they had retired, compared to 15.7 percent (+/-3.7 percent) in the January 2020 Displaced Worker Supplement (displaced between 2017 and 2019) and 13.6 percent (+/1.7 percent) in the January 2010 Displaced Worker Supplement (displaced between 2007 and 2009). Displaced workers are defined as wage and salary workers 20 years of age and older who lost or left jobs because their plant or company closed or moved, there was insufficient work for them to do, or their position or shift was eliminated. Due to CPS data limitations, our definition of “retired” includes only people who are no longer in the labor force. Therefore, this definition does not include retired persons who have part-time work. BLS officials stated that while the CPS allows for respondents to indicate “retirement” as a reason for not being in the labor force, there are limitations to these data. The CPS does not ask all individuals in the sample whether they are “retired,” according to BLS officials. While respondents in the CPS may refer to retirement when answering questions about their reasons for not being in the labor force, the survey was not designed to identify the retirement population, according to BLS officials. The main focus on the CPS is to measure labor market activity, not labor market inactivity, and the survey does not comprehensively capture the retired population, according to BLS officials.
[27]These researchers from the Federal Reserve Bank of New York noted in March 2023 that the U.S. labor force participation rate at that time stood at 62.5 percent, 0.8 percentage points below its February 2020 level, and that this “participation gap” translated to 2.1 million workers out of the labor force. As the report noted, the aging population from the baby boomers reaching retirement age in recent years put downward pressure on labor force participation. The report further noted that higher retirement rates compared to the pre-pandemic period had a “modest” effect as well on the overall U.S. labor force participation rate during the period examined. See Mary Amiti, Sebastian Heise, Giorgio Topa, and Julia Wu, What Has Driven the Labor Force Participation Gap since February 2020? (Federal Reserve Bank of New York Liberty Street Economics, 2023), accessed March 29, 2024, from https://libertystreeteconomics.newyorkfed.org/2023/03/what‑has‑driven‑the‑labor‑force‑participation‑gap‑since‑february‑2020/.
[28]Underutilization includes individuals working part-time who would prefer to work full-time and individuals who wanted to work and were available for work but did not actively seek employment in the last month for various reasons, such as believing no jobs were available (marginally attached workers).
[29]The associated margins of error were +/-118,000 and +/-73,000 for the second quarter 2020, respectively, and +/-82,000 and +/-51,000 for the second quarter 2021, respectively.
[30]For example, there were an estimated 620,000 (+/-60,000) workers aged 55–64 employed part time for economic reasons in the second quarter of 2019, 1.6 million (+/-100,000 margin of error) in the second quarter of 2020, and 514,000 (+/-66,000) in the second quarter of 2023. These were substantial numbers compared to the estimated 211,000 (+/-32,000), 243,000 (+/-39,000), and 197,000 (+/-40,000) marginally attached workers aged 55–64 during these time periods; 65,000 (+/-18,000), 71,000 (+/-21,000), and 56,000 (+/-20,000) discouraged workers aged 55–64 during these time periods; and 145,000 (+/-26,000), 172,000 (+/-33,000), and 141,000 (+/-34,000) conditionally interested workers aged 55–64 during the time period. Our analysis of CPS data found that the oldest workers—those aged 65 and older—were also more likely than those aged 55–64 or those aged 25–54 to report working 1 to 19 hours per week.
[31]The margins of error for these estimates are +/-4.5 percentage point and +/-2.7 percentage points, respectively. We note that this question is asked of respondents who currently have a job.
[32]The margins of error for these estimates are +/-9.5 percentage points and +/-4.7 percentage points, respectively. This effect was higher for workers who were displaced during the pandemic from 2019 to 2021 compared to those who lost their jobs from 2017 to 2019. For those displaced from 2017 to 2019, an estimated 56.5 percent (+/-9.6 percent margin of error) of workers aged 55 and older and 47.8 percent (+/-5.0 percent) of workers aged 25 to 54 had lower earnings at the job at which they regained employment.
[33]These estimates are by annual quarter and have a maximum margin of error of +/-0.8 percentage points for any annual quarter.
[34]The more precise estimate for the share of displaced workers aged 55 and older from 2019 to 2021 from the sector is 20.9 percent (+/-4.3 percentage points).
[35]The associated margins of error for manufacturing sector for displacements from 2017 to 2019 and from 2019 to 2021 were +/-4.2 percent and +/-3.8 percent, respectively. The associated margins of error for leisure and hospitality sector for displacements from 2017 to 2019 and from 2019 to 2021 respectively were +/-2.7 percent and +/-3.6 percent, respectively.
[36]This is as measured by our estimates for the second quarter of 2019, the second quarter of 2020, and the second quarter of 2023. We specifically tested for statistical differences for Black workers’ labor force participation in the second quarter of 2020 and the second quarter of 2023 and found them to not be statistically different. We compare quarterly estimates by the second quarter 2020 to account for the pandemic onset and the second quarter of 2023, which is the quarterly estimate closest to the review period end of September 2023 that maintains second-quarter seasonality.
[37]This is as measured by our estimates for the second quarter of 2019, the second quarter of 2020, and the second quarter of 2023.
[38]We defined the claiming rate for benefits as the ratio of the number of workers filing a claim for SSA benefits to the estimated number of eligible workers in the same time period. The full retirement age—the age at which a claimant is eligible for non-reduced benefits—generally increased from age 66 to age 67 over the analysis period. For our analysis, we calculated individuals’ age, in whole years, at the time of the initial claim for Social Security benefits; we used age 66 and age 67. We rounded those aged 66 years and 8 months to age 66, for example. As such, applicants at full retirement age would be considered age 66 for the period of our analysis.
[39]The Pandemic Emergency Unemployment Compensation program generally authorized additional weeks of unemployment insurance benefits for those who had exhausted their regular unemployment benefits through December 2020 and was subsequently extended until September 2021.
[40]More specifically, the estimated rates for those age 66 filing initial Social Security retirement benefit claims increased slightly in the third quarter of 2020, and the claim rate surpassed the pre-pandemic level by the first quarter of 2021.
[41]Relatedly, an April 2023 study found that relative to pre-pandemic levels after accounting for typical monthly fluctuations, there was no overall change in applications for Social Security retirement benefits during the first year of the pandemic, but there was a 3 percent increase in applications during the second year of the pandemic. The researchers analyzed a sample of SSA Monthly Data for Retirement Insurance Applications from January 2015 to March 2022 of people aged 60 to 69. The researchers found that this was consistent with the idea that some workers who had left the labor force during the first year were waiting some time before reporting retirement. See Gopi Shah Goda, Emilie Jackson, Lauren Hirsch Nicholas, and Sarah Stith, “Older workers’ employment and Social Security spillovers through the second year of the Covid-19 pandemic,” Journal of Pension Economics and Finance (2023). In addition, the SSA Office of the Chief Actuary published a slide that depicted their analysis of the percentage of the insured population receiving a retired worker benefit (and excluding those receiving a different benefit) at each age from 62 through 70. The slide indicated that the percentage of the insured population aged 66 receiving a retired worker benefit declined over the period of our analysis. The difference between this trend and our analysis finding an increasing rate of claim filings at age 66 may be attributable to methodology, data, and other differences in how the measures were calculated.
[42]The exact reasons for this behavior are unknown. The exhaustion of regular Unemployment Insurance benefits is a possible explanation, but there may be other reasons for these observed trends. As noted earlier in the report, in addition to the longstanding federal-state Unemployment Insurance program, four other unemployment insurance programs were created in the wake of the pandemic to address gaps in worker pay caused by the pandemic. For more information, see GAO‑22‑104438, GAO‑22‑104251, GAO‑22‑105162, and GAO‑24‑107471. To qualify for retirement benefits under the Old-Age and Survivors Insurance program, workers must typically have earned a minimum of 40 quarters of coverage (also referred to as credits) over their lifetime working in a job covered by Social Security. To qualify for disability benefits, workers generally need less time in covered employment, but they must have recent work activity.
[43]The information we obtained via these interviews reflects the views of the experts and should not be interpreted as GAO endorsing any of them. Relatedly, other researchers have estimated that the additional pandemic-related Unemployment Insurance benefits valued at $600 weekly replaced 100 percent of pre-pandemic income for 69 percent of individuals (of any age). See Peter Ganong, Pascal Noel, and Joseph Vavra, “US unemployment insurance replacement rates during the pandemic,” Journal of Public Economics 191 (2020) 104273. The study also found that there was sizeable variation across industries and occupations; for example, the median retail worker could collect 166 percent of their prior wage in Unemployment Insurance whereas, according to the study’s lead author, the replacement rate for IT workers was 66 percent. The estimates in the study have a maximum margin of error of 3.1 percentage points.
[44]DOL Employment and Training Administration officials told us that individuals of all age ranges experienced a similar change in claims and covered employment rates during this time. In March 2023, BLS published an analysis of 2022 Unemployment Insurance data based on a supplement to the CPS conducted in February and March 2022, examining the characteristics of Unemployment Insurance applicants and benefit recipients. The analysis found that in 2022, the likelihood of applying for Unemployment Insurance benefits increased with age, with those aged 55 and older applying at increased rates than those aged 16 to 24 or those aged 25 to 54. See Bureau of Labor Statistics, Characteristics of Unemployment Insurance Applicants and Benefit Recipients (March 29, 2023), accessed from https://www.bls.gov/news.release/uisup.htm on October 22, 2024.
[45]More specifically, we analyzed the claiming rates on a quarterly basis for the following age groups at month of initial filing: 55–59, 60–61, 62–64, and 65–66. We chose these age categories to isolate and better estimate the extent to which individuals nearing the full retirement age began claiming benefits compared to individuals who were younger than them.
[46]For the purposes of this report, we reported households that had a retirement account with a positive account balance. Retirement accounts include IRAs, Keoghs, and future and current account-type pensions. We recognize that there may be households that report they have a retirement account, but their account balance is $0. In our analysis of older households with positive retirement account balances, we divided these households into four groups based on income, called income quartiles. Using SCF data, we estimated that among older households (aged 55 and older), there are 85 percent (+/-3 percent margin of error) in the lowest income quartile, 59 percent (+/-5 percent margin of error) in the second-lowest income quartile, 30 percent (+/-5 percent) in the second-highest income quartile, and 11 percent (+/-3 percent margin of error) in the highest income quartile that did not have a positive retirement account balance in 2022. All dollar values are adjusted for inflation to 2022 dollars. For more information, see app. III.
[47]For the purposes of this report, we grouped older households into income quartiles. We also described them as the “two lower income quartiles” and “the two higher income quartiles.” The two lower income quartiles refer to the lowest- and second-lowest income quartiles, and the two higher income quartiles refer to the highest- and second-highest income quartiles. For detailed results, see app. III.
[48]For detailed results, see app. III. Since the SCF is a survey of U.S. families every 3 years, and each year of data in our analysis used a different set of households, we created a new income distribution for each year of data. We previously found that the percentage of low-income households with a retirement account with a positive balance had declined between 2007 and 2019. We analyzed SCF data and reported the estimated percentage of low-income older households aged 51–64 with a retirement account dropped from about 21 percent in 2007 to 10 percent in 2019 (in the wake of the Great Recession). During the same period, the percentage of higher-income households with a retirement account remained relatively unchanged. For more information, see GAO, Older Workers: Retirement Account Disparities Have Increased by Income and Persisted by Race Over Time, GAO‑23‑105342 (Washington, D.C.: July 2023).
[49]The SECURE 2.0 Act of 2022 generally requires new 401(k) and 403(b) plans to meet automatic enrollment requirements for plan years beginning after December 31, 2024. Pub. L. No. 117-328, div. T, § 101(a) 136 Stat. 4459, 5275-77 (codified at 26 U.S.C. § 414A). Certain plans, including governmental and church plans, are excepted from these requirements. According to the U.S. Internal Revenue Service, automatic enrollment allows employers to deduct a certain percentage (or dollar amount) from each eligible employee’s paycheck and deposit it into the employee’s retirement account. Employees can opt out of the automatic deduction from their salary or change the amount they have deducted. Automatic enrollment is a feature that can be added to new or existing 401(k) and certain other retirement plans.
[50]According to a 2023 study by Vanguard Research, older workers aged 57–70 were participating in retirement savings at higher levels in 2021 than 2006 (approximately 83 percent and 69 percent). Moreover, those aged 57 to 70 who had a retirement plan with automatic enrollment in 2021 had a median balance of $143,000 compared to those whose plan had voluntary enrollment, with a median balance of $133,00 in 2021. Jeffery W. Clark and Kevin D. Kukulka, Generational Changes in 401k Behaviors (April 2023), accessed July 1, 2024, from https://corporate.vanguard.com/content/dam/corp/research/pdf/generational_changes_in_401(k)_behaviors.pdf.
[51]Specifically, we found that the estimated median retirement account balances of older households in the highest income quartile was $523,000 (+/-$74,000 margin of error) in 2019 and $583,000 (+/-$85,000 margin of error) in 2022. However, because the two higher income quartiles started with much higher retirement account balances, households in those income quartiles may have encountered larger increases in account balances in absolute terms. We did not identify statistically significant differences in account balances by income quartile from 2019 to 2022. For more details on our estimates of the median account balances for older households, see app. III.
[52]Specifically, Vanguard found that the average retirement account balance of defined contribution account holders in its plans aged 55–64 was $190,505 in 2017, $197,322 in 2019, and $244,750 in 2023. For the oldest account holders, aged 65 and older, the average retirement account balance was $209,984 in 2017, $216,720 in 2019, and $272,588 in 2023. Similarly, another large plan record keeper, Fidelity, found that the average retirement balance of participants in its 401(k) plans aged 55–59 years old increased from $175,700 to $193,500 and later to $235,300 in the first quarters of 2017, 2019 and 2024, respectively.
[53]Yimeng Yin, Anqi Chen, and Alicia H. Munnell, The National Retirement Risk Index: An Update from the 2022 SCF (Chestnut Hill, MA: Center for Retirement Research at Boston College, February 2024). When constructing their retirement risk index, researchers used statistically weighted data from the 2019 and 2022 SCF to project retirement income replacement rates. The annual estimates from the underlying model are the source of the cited difference between 2019 and 2022.
[54]Under rules from the U.S. Internal Revenue Service, a hardship distribution is a withdrawal from an account holder’s elective deferral account made because of an “immediate and heavy” financial need. It is limited to the amount necessary to satisfy that financial need. The withdrawal is taxed to the account holder and is not paid back to their retirement account. In 2020, the CARES Act temporarily expanded plan distribution and loan options that 401(k) plans could offer to participants affected by the pandemic to help mitigate some of the financial difficulties that workers experienced due to the pandemic. Pub. L. No. 116–136, § 2202, 134 Stat. 281, 340-43. For more information, see GAO, 401(k) Plans: Additional Federal Actions Would Help Participants Track and Consolidate Their Retirement Savings, GAO‑24‑103577 (Washington, D.C.: January 2024).
[55]For these analyses of differences among demographic groups, we developed estimates for prime-age households (aged 25–54), older households (aged 55–64), and oldest households (aged 65 and older). The SCF surveys the head of household, defined as the economically dominant individual in a household. In a couple (married or living together) the reference person is taken to be either the male in a mixed-sex couple or the older individual in the case of a same-sex couple. When measuring the age of a household, we are using the head of household’s age. When measuring asset holdings of a household, we used total value of assets held by the household that takes into account all financial and non-financial assets, including the total value of their retirement account holdings. For additional information about prime-age, older, and oldest households, see app. III.
[56]For the purposes of this report, we analyzed oldest (65 and older) and older (aged 55-64) households’ household income and divided them into four income quartiles across age groups. For the oldest households (aged 65 and older), the lowest income group had an estimated median income of about $22,000 (+/-$1,200 margin of error) in 2019 and $22,000 (+/-$1,600 margin of error) in 2022, and the highest income group had an estimated median income of $193,000 (+/-$13,000 margin of error) in 2019 and $218,000 (+/-$4,600 margin of error) in 2022. For older households (aged 55 to 64), the lowest income group had an estimated median income of $20,000 (+/-$1,600 margin of error) in 2019 and $21,000 in 2022 and the highest income group had a median income of $23,000 (+/- 15,000 margin of error) in 2019 and $244,000 (+/-$18,000 margin of error) in 2022.
[57]The margins of error for these estimates are +/-$287,000 and +/-$354,000, respectively.
[58]The margins of error are +/-$234,000 and +/-$248,000, respectively.
[59]For the purposes of this report, we determined the educational attainment level of the household by using the head of household’s highest level of educational attainment. The SCF’s definition of levels of educational attainment includes high school diploma, some college or 2-year degree, 4-year college degree, and graduate or professional degree. We categorized all education levels less than a high school diploma or equivalent under “less than high school” for the purposes of this analysis. For estimated median incomes by educational attainment level, see app. III.
[60]For the purposes of this report, we examined the age and race of households based on the age and race of the head of household. The 2022 SCF defines race as White non-Hispanic, Black/African American, Hispanic, Asian, and Other. The SCF combines multiple groups to create the Other category, which includes Alaska Native American Indian, Native Hawaiian, Pacific Islander, other races, and all respondents reporting more than one racial identification. Earlier versions of the SCF defined race with Asian under the Other category. For the 2022 survey year, the SCF oversampled Asian households, and we were able to pull this group from the Other category. For more information, see Kevin B. Moore and Karen M. Pence, “Improving the Measurement of Racial Disparities in the Survey of Consumer Finances,” FEDS Notes (Washington D.C.: Board of Governors of the Federal Reserve System, June 21, 2021).
[61]In addition to Asian households, White households held more in median total asset values in 2022 than Black/African American and Hispanic households. We also found that among households aged 55 and older, Black/African American and Latino households held less in retirement savings compared to White Households across all income quartiles in 2022.
[62]For the purposes of this report, we estimated the total value of assets held by each sex of the head of household. The SCF defines sex as male and female. In the SCF dataset, the head of household defaults to the male in a mixed-sex couple or the older individual in a same-sex couple. We examined the sex of household heads and included both single and married or partnered households. To correct for how the SCF assigns the reference person, we also identified all adult females who are a spouse/partner living in the same residence with a male and assigned them to the second household group, as well as all adult males who are not partnered with females such as male same-gender couples who are married or partnered and assigned them to the third household group, and included them in our analysis of older households’ employment and financial assets. For more information, see app. III.
[63]The written questionnaire refers to older workers as workers aged 55 and older.
[64]We sent our written questionnaire to 32 experts in older workers’ retirement security and received 25 responses. We also interviewed seven of these experts. GAO identified experts from think tanks, universities, and nonprofits. See app. I for the list of respondents. In our written questionnaire, experts selected from a list of 30 policy options then chose from a sliding scale of how effective each option would be at enhancing the employment outcomes of discouraged or unemployed older workers. The scale of effectiveness included “highly effective,” “moderately effective,” “a little effective,” or “not at all effective.” See app. IV for our full list of 30 policy options with experts’ opinions of effectiveness.
[65]For the purposes of this report, we call policy options “favored” if 12 or more experts ranked the policy option as highly or moderately effective. The sum of rankings reflects the opinions of the experts, and no empirical testing was done to verify whether any individual policy option would be effective.
[66]In our questionnaire responses, 15 out of 25 experts ranked as “highly effective” or “moderately effective” the policy option for Congress to remove the requirement that Medicare generally be the secondary payer for workers aged 65 and older who are covered by an employer health plan. This policy option received more highly effective rankings than any other policy option in our questionnaire. See GAO‑11‑726T and GAO‑12‑333 for more information. 42 U.S.C. § 1395y(b).
[67]As we previously reported, structural unemployment arises when barriers prevent workers from matching their skills to available jobs, such as workers’ current skills or geographical mismatches to available job openings. In contrast, cyclical unemployment arises when there is a decrease in the overall demand for goods and services in an economy. Due to such decreases, employers may temporarily lay off workers or cut back their employees’ hours until the economy improves. See GAO‑12‑445 for more information.
[68]Twenty-five of 32 experts responded to our written questionnaire, and we interviewed seven of them to discuss some of the policy options in detail. See apps. I and IV for more details on experts selected for the written questionnaire and expert interviews.
[69]We previously found that some employers were reluctant to hire older workers due to older workers having higher health care costs, according to experts we interviewed. In addition, many of these experts said that a policy proposal to eliminate the requirement that Medicare generally be the secondary payer for benefits for workers aged 65 and older covered by a group health plan could improve employers’ willingness to hire older workers. See GAO‑12‑445.
[70]For workers aged 65 and over and covered by their own or their spouse’s employer’s group health plan, federal law generally requires that the employer’s group health plan be the primary payer and Medicare be the secondary payer for benefits. 42 U.S.C. §1395y(b); 42 C.F.R. §§ 411.170, .172, .175.
[71]However, the four experts who favored this option also cautioned that it could impose a potentially higher tax burden on the public and increase federal spending. As we have previously reported, Medicare and other federal health care programs also face continually increasing health care costs. As the population continues to age, projected Medicare spending grows as a share of GDP, such that we projected that spending on federal health care—as a share of GDP—will increase 47 percent between 2023 and 2052. See GAO‑24‑106987 for more information.
[72]More specifically, this expert stated that older job seekers may have different aims and interests than younger job seekers, and the employment program and employment center performance metrics may not be aligned with older job seekers’ aims, creating a disincentive for employment program or job center staff to fully support older job seekers.
[73]The Senior Community Service Employment Program is a community service and work-based job training program for low-income, unemployed older Americans. In addition, these same experts were among the 13 experts that favored the policy option that DOL develops new or improves existing job search assistance programs to support older Americans in our written questionnaire. They stated that this policy option targets support to older job seekers and thus could reduce long-term unemployment, which disproportionally affects older Americans. 42 U.S.C. § 3056.
[74]More specifically, we analyzed CPS monthly data from January 2017 to September 2023, the most recent data at the time of our final data pull for our analysis.
[75]While the survey is monthly, for households, this is 4 months on, 8 months off, and 4 months on again.
[76]We chose the 2008 and 2010 supplements because they were close to the Great Recession of 2009. We chose the 2020 and 2022 supplements because they were the most recent at our time of analysis.
[77]We recognize that in any given consecutive iterations of the Displaced Worker Supplement, there is a year of overlap in the time period in which workers may have been displaced. However, each wave of the Displaced Worker Supplement consists of an independent sample of distinct individuals.
[78]All margins of error in this report are calculated at the 95 percent confidence level.
[79]See GAO, Income Security: Older Adults and the 2007-2009 Recession, GAO‑12‑76 (Washington, D.C.: Oct. 17, 2011) and Unemployed Older Workers: Many Experience Challenges Regaining Employment and Face Reduced Retirement Security, GAO‑12‑445 (Washington, D.C.: Apr. 25, 2012).
[80]In November 2022, we reported that some Social Security benefit programs experienced an increase in claims while others saw a decline from March 2018 through December 2021. See GAO, Social Security Administration: Remote Service Delivery Increased during COVID-19, but More Could Be Done to Assist Vulnerable Populations, GAO‑23‑104650 (Washington, D.C.: Nov. 17, 2022).
[81]In April 2024, we obtained additional Modernized Claims System data from 2017 to 2023 for this report; however, we determined earlier years’ data were unreliable. In a May 2024 conversation with us, SSA officials stated that SSA maintains a 3-years plus 6-month storage on a rolling basis of completed claims data in the system. After any 3-year and 6-month period, data are archived using a computer tape system. SSA officials stated that the data we received in April 2024 may be more representative from approximately September 2021 onward since these data are more complete, as they would include any individual claimant records that were updated or corrected due to new information or identified inconsistencies, but that as we further analyzed the datasets, we could use our best judgment. As such, for our analysis, we generally relied on the SSA administrative data obtained for our November 2022 report from January 2018 to September 2021 and the data acquired in April 2024 from October 2021 to December 2023.
[82]We defined the claiming rate for benefits as the ratio of the number of workers filing a claim for SSA benefits to the estimated number of eligible workers in the same period (quarterly or annual). The full retirement age—the age at which a claimant is eligible for non-reduced benefits—was generally increasing from age 66 to age 67 over the analysis period. For our analysis, we calculated individuals’ age, in whole years, at the time of the initial claim for Social Security benefits; we used age 66 and age 67. We rounded those aged 66 years and 8 months to age 66, for example. As such, applicants at full retirement age would be considered age 66 for the period of our analysis.
[83]According to SSA documentation, the estimated number of fully insured individuals for retirement and disability insured for Disability Insurance benefits is from the 2024 Trustees report, intermediate assumptions, at the end of the year, by single year of age. In addition, the SSA Office of the Chief Actuary published a slide that depicted the percentage of the insured population receiving a retired worker benefit (and excluding those receiving a different benefit) at each of age from 62 through 70. The slide indicated that the percentage of the insured population aged 66 receiving a retired worker benefit declined over the period of our analysis. The difference between this trend and the increasing rate of claim filings at age 66 indicated by our analysis may be attributable to methodology, data, and other differences in how the measures were calculated. We did not reconcile these differences.
[84]This report, also known as the “ETA 203 report,” reports information regarding the continued claims for regular Unemployment Insurance by individuals aged 55–59, 60–64, and 65 and older, among others, and is available on a quarterly basis at https://www.dol.gov/agencies/eta. This report includes information for continued Unemployment Insurance claimants, not initial claims. Continued claims are made after a claimant has filed an initial claim and the state has determined them to be eligible. We considered using DOL’s AR5159 report on Unemployment Insurance Claims and Payment Activities, but the population covered by that report is all Unemployment Insurance claimants of whatever age—which skews from the population aged 55 and older that we are most interested in. Accordingly, these data were not suitable for our purposes. DOL officials told us the agency does not have reliable methods to track the number of claimants, by age, for pandemic-era benefit programs. Accordingly, our analysis is only of those claiming regular Unemployment Insurance benefits.
[85]The SCF uses the primary economic unit as the unit of analysis, and the reference person is part of the primary economic unit. For example, in the case of a household composed of a married couple who owns their home, a minor child, a dependent adult child, and a financially independent parent of one of the members of the couple, the primary economic unit would be the couple and the two children. The household consists of an economically dominant single individual or couple (married or living as partners) in a household and all other individuals in the household who are financially interdependent with that individual or couple. According to the SCF codebook, the reference person is either the male in a mixed-sex couple or the older individual in a same-sex couple.
[86]The 2022 SCF’s Quarantine-Related questions asked households about their health and employment status, relief on required payments, experiences of financial hardship, receipt of early stimulus benefits, and child-related responsibilities, among other things, since the onset of the pandemic in early 2020. According to SCF documentation, most SCF interviews were conducted in 2022, with the remainder conducted in early 2023.
[87]Household income for previous calendar year includes wages, self-employment and business income, taxable and tax-exempt interest, dividends, realized capital gains, food stamps and other support programs provided by the government, pension income and withdrawals from retirement accounts, Social Security income, alimony and other support payments, and miscellaneous sources of income.
[88]The race and ethnicity groups in the SCF are White, Black or African American, Hispanic or Latino, Asian, and Other households, where Other includes Asians, American Indians, Alaska Natives, Native Hawaiians, Pacific Islanders, other races, and all respondents reporting more than one racial identification. For the 2022 survey year, the SCF oversampled Asian households, and we were able to produce separate and reliable estimates for this group. For more information, see Kevin B. Moore and Karen M. Pence, “Improving the Measurement of Racial Disparities in the Survey of Consumer Finances,” FEDS Notes (Washington D.C.: Board of Governors of the Federal Reserve System, June 21, 2021).
[89]The SCF uses sex instead of gender. The SCF defines sex based on the biological sex of the reference person as male and female, and throughout our report, we refer to the households’ reference person as “men” and “women,” respectively. In the SCF dataset, survey responses are collected from the reference person whether they are single or married/living with a partner.
[90]In addition to these semi-structured interviews in which we asked experts a standard set of questions, we also interviewed the Harvard Joint Center for Housing Studies to obtain perspectives on the challenges older Americans faced regarding their personal finances and housing during the COVID-19 pandemic. We also held two pre-test interviews with experts to obtain their perspectives on the written questionnaire prior to its launch.
[91]The written questionnaire refers to older workers as workers aged 55 and older.
[92]We limited the number of expert responses to two per organization.
[93]See app. IV for the full list of 30 policy options with experts’ opinions of effectiveness.
[94]The Older Workers’ Retirement Security Task Force, Older Workers in Physically Challenging Jobs Need Stronger Social Insurance Supports (Washington, D.C.: National Academy of Social Insurance, 2023).
[95]GAO, Unemployed Older Workers: Many Experience Challenges Regaining Employment and Face Reduced Retirement Security, GAO‑12‑445 (Washington, D.C.: Apr. 25, 2012).
[96]Since GAO has assessed the Unemployment Insurance program, we excluded policy options aimed at addressing it in this report. For recent GAO work, see GAO‑22‑106159 and GAO‑22‑105162, for example.
[97]The Age Discrimination in Employment Act of 1967 prohibits employers from discriminating in employment on the basis of age, defined as being age 40 and over. 29 U.S.C. §§ 623, 631(a).
[98]We further note that when interviewing organizations with significant expertise, we limited the number of questionnaire responses to two per organization.
[99]The 2022 SCF’s Quarantine-Related questions asked households about their health and employment status, relief on required payments, experiences of financial hardship, receipt of early stimulus benefits, and child-related responsibilities, among other things, since the onset of the pandemic in early 2020. According to SCF documentation, most SCF interviews were conducted in 2022, with the remainder conducted in early 2023.