WATER INFRASTRUCTURE RESILIENCE
Agencies Could Better Assess Efforts to Assist Communities Vulnerable to Natural Disasters
Report to Congressional Requesters
United States Government Accountability Office
A report to congressional requesters.
For more information, contact: Chris Currie at curriec@gao.gov or J. Alfredo Gómez at gomezj@gao.gov.
What GAO Found
The U.S. Environmental Protection Agency (EPA), Federal Emergency Management Agency (FEMA), and U.S. Department of Agriculture (USDA) provided different types of financial assistance to improve drinking water and wastewater infrastructure in fiscal years 2014 through 2023. Specifically, 14 of the agencies’ programs provided $35 billion in grants (at least 22,000 projects) and $29 billion in direct loans (about 4,800 projects) during this period.
EPA, FEMA, and USDA took steps to reduce barriers to financial assistance faced by vulnerable communities—those likely to face challenges preparing for and recovering from disasters, such as rural and low-income areas. In this report, GAO used the term “vulnerable communities” to refer to communities defined in some programs’ authorizing statutes that may receive additional assistance under these programs. These statutes were not affected by recent executive orders or actions. Agencies provided technical assistance and allowed grantees to use assistance from other federal programs to meet requirements to provide matching funds, known as nonfederal cost share. However, FEMA has not adequately communicated about the option to use assistance from USDA programs to meet cost-share requirements in certain cases.
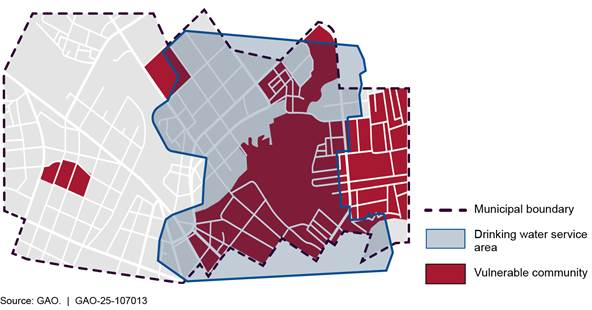
EPA, FEMA, and USDA used national or state measures to assess the extent to which vulnerable communities benefitted from certain programs. However, EPA, FEMA, and USDA officials said that limited data about the geographical areas served by drinking water and wastewater utilities made it difficult to accurately assess who benefited from their programs. EPA created a mapping tool with the geographical service areas of drinking water systems, which may differ from municipal boundaries (see fig.). EPA plans to complete a similar tool for wastewater service areas in summer 2025. Using EPA’s mapping tools could enable EPA, FEMA, and USDA to more accurately identify the communities, including vulnerable communities, their programs are benefiting.
Why GAO Did This Study
Drinking water and wastewater utilities have experienced disruption or failure after disasters, threatening public health. For example, disasters in Mississippi in 2022 and North Carolina in 2024 left residents without potable water for weeks. Federal agencies provide assistance for utilities to build resilience against natural disasters—including communities in rural and low-income areas vulnerable to disasters.
This report examines, among other things, (1) financial assistance that EPA, FEMA, and USDA provided to improve water infrastructure; (2) the extent to which these agencies addressed barriers vulnerable communities face accessing and participating in selected programs; and (3) how these agencies assessed the extent to which assistance reached vulnerable communities.
GAO analyzed fiscal year 2014–2023 data for EPA, FEMA, and USDA programs that provided financial assistance for water infrastructure projects—the most recent data available during the review. GAO also reviewed relevant executive orders and agencies’ plans and actions taken to address barriers faced by vulnerable communities. Finally, GAO interviewed a nongeneralizable sample of 14 utilities selected based on factors including vulnerability and disaster experience.
What GAO Recommends
GAO is making eight recommendations, including that FEMA communicate about options to meet cost-share requirements, and that EPA, FEMA, and USDA use service area map tools. EPA and FEMA disagreed with using the tools. USDA did not comment. GAO maintains its recommendations are valid, as discussed in this report.
This is a work of the U.S. government and is not subject to copyright protection in the United States. The published product may be reproduced and distributed in its entirety without further permission from GAO. However, because this work may contain copyrighted images or other material, permission from the copyright holder may be necessary if you wish to reproduce this material separately.
Abbreviations
|
DHS |
Department of Homeland Security |
|
EPA |
U.S. Environmental Protection Agency |
|
FEMA |
Federal Emergency Management Agency |
|
USDA |
U.S. Department of Agriculture |
August 11, 2025
The Honorable Bennie G. Thompson
Ranking Member
Committee on Homeland Security
House of Representatives
The Honorable Robert Garcia
Ranking Member
Committee on Oversight and Government Reform
House of Representatives
The Honorable Jamie Raskin
House of Representatives
Drinking water utilities and wastewater utilities can be vulnerable to disruption or failure following natural disasters, leaving communities without service and threatening public health. For example, in August 2022 the largest drinking water treatment plant in Jackson, Mississippi, failed following heavy rains and flooding. As a result, the over 150,000 residents of Jackson were without potable water for more than 2 weeks.[1] This outage was preceded by frequent water service interruptions over many years, with the City of Jackson issuing over 500 boil water alerts per year from 2015 through 2021, according to one study.[2]
More recently, in September 2024 Hurricane Helene caused catastrophic flooding in western North Carolina—including in rural and low-income areas—severely damaging major water transmission lines, reservoirs, and treatment facilities. Over 100,000 residents were left without potable water for nearly 2 months. Restoring drinking water was particularly challenging due to the hurricane’s damage to roads and bridges that, combined with western North Carolina’s mountainous geography, isolated communities and hindered repair crews’ access to damaged infrastructure.
Federal agencies, including the U.S. Environmental Protection Agency (EPA), the Federal Emergency Management Agency (FEMA) within the Department of Homeland Security, and the U.S. Department of Agriculture (USDA), administer a variety of programs that provide financial and technical assistance to improve drinking water and wastewater infrastructure. Such assistance can be used to improve the resilience of this infrastructure—in other words, the ability to prepare for anticipated hazards, adapt to changing conditions, and withstand and recover rapidly from disruptions.[3]
Certain communities are disproportionately susceptible to the impacts of disasters and face significant challenges achieving resilience. These communities are located in both rural and urban areas and span diverse social and demographic groups. The terminology used to describe these communities varies. Such communities may be referred to in statutes as “disadvantaged,” “economically stressed,” or “rural,” among other terms, and may be defined in various ways. We use the term “vulnerable communities” throughout this report to refer to communities that are likely to experience heightened challenges in preparing for, withstanding, and recovering from disasters, particularly in relation to water infrastructure. We use program-specific terminology and definitions where applicable. In some cases, a vulnerable community may be the entity that applies for financial assistance—such as a rural, small town. In other cases, the entity that applies for assistance might not meet the program’s definition of vulnerable, but it might contain a vulnerable community within it—such as a city that has low-income neighborhoods within it.
In 2020, FEMA’s National Advisory Council reported that federal disaster relief is often disproportionately provided to larger communities that have considerable resources. The council reported that smaller, less resource-rich, and rural communities often cannot access financial assistance to appropriately prepare for disasters, leading to inadequate disaster response and recovery.[4] This report also stated that disaster vulnerability is associated with income, poverty, race, ethnicity, and physical ability, among other factors. Further, the report states that the same factors that disadvantage members of society on a daily basis increase the exposure of these populations to physical hazards and to the social, economic, political, and psychological impacts of disaster events.
In addition, FEMA has reported that historically disadvantaged populations may be particularly vulnerable to disasters and may require additional support to adequately prepare for and recover from disasters.[5] The number and cost of weather and climate disasters are increasing in the U.S., according to the National Oceanic and Atmospheric Administration, which may further challenge vulnerable communities’ ability to be resilient to disasters.[6]
You asked us to examine how federal agencies have provided assistance to increase the resilience of drinking water and wastewater utilities that are vulnerable to the effects of natural disasters. You also asked us to examine how agencies implemented prior executive orders in these sectors. This report examines (1) financial assistance that EPA, FEMA, and USDA provided in fiscal years 2014 through 2023 to improve drinking water and wastewater infrastructure; (2) financial challenges related to infrastructure resilience faced by selected water utilities, including those in vulnerable communities; (3) the extent to which EPA, FEMA, and USDA addressed barriers that may prevent vulnerable communities from accessing and participating in selected programs; and (4) how EPA, FEMA, and USDA assessed the extent to which financial assistance from selected programs reached vulnerable communities.
To examine financial assistance that EPA, FEMA, and USDA provided to improve drinking water and wastewater infrastructure, we reviewed prior GAO work and publicly available documents, including program authorizing statutes, regulations, program descriptions, and Federal Register notices.[7] We determined that, during the period of our review, 19 programs could provide financial assistance for water infrastructure, and 15 of these programs had done so.[8] We did not analyze data from one of these programs—FEMA’s Public Assistance—because of limitations in the data that made it unfeasible to determine the amount of assistance provided for water infrastructure. We therefore analyzed financial assistance data for 14 programs.
We selected the period of fiscal year 2014 through fiscal year 2023 to account for variations of natural disasters and to include years before and during the Justice40 Initiative, among other factors.[9] The Justice40 Initiative centered on the goal that 40 percent of the benefits of certain federal investments—including certain investments in water infrastructure—should flow to disadvantaged communities.[10] To examine federal financial assistance, we reviewed and analyzed EPA, FEMA, and USDA budgetary data and compared it to publicly available data when available.
To identify the financial challenges related to infrastructure resilience faced by selected water utilities, including those in vulnerable communities, we interviewed representatives from 14 drinking water and wastewater utilities.[11] We selected utilities to obtain a variety of perspectives based on factors such as geographic location, population size, and recent experiences with natural disasters and the financial assistance programs in our review. Findings from these interviews are not generalizable to other drinking water and wastewater utilities. However, the interviews provided valuable insight into the challenges faced by such utilities.
To examine the extent to which EPA, FEMA, and USDA addressed barriers that may prevent vulnerable communities from accessing and participating in selected programs, we identified 10 of these agencies’ programs that provided financial assistance for water infrastructure during our review period and that were selected to participate in the Justice40 Initiative. We reviewed these programs’ authorizing statutes to identify any requirements to provide assistance to vulnerable communities and any definitions of such communities. We also analyzed documentation of actions the agencies took to address barriers faced by vulnerable communities, such as program policies, technical assistance efforts, and interagency agreements. We interviewed relevant agency officials and technical assistance providers, and we asked the utility representatives that we interviewed about any challenges they experienced when applying for and managing awards from federal assistance programs in our scope.
We assessed EPA, FEMA, and USDA actions against Standards for Internal Control in the Federal Government related to information and communication.[12] We also assessed the agencies’ actions against selected key practices for effectively managing and assessing the results of federal efforts.[13] We identified the key practice about generating new evidence as relevant to this objective.
To examine how the three agencies assessed the extent to which financial assistance from selected programs flowed to vulnerable communities, we interviewed agency officials and reviewed agency documentation related to analyses they conducted. We assessed the agencies’ actions against selected key practices for effectively managing and assessing the results of federal efforts. We determined that the key practices related to generating new evidence and using evidence to assess program results were relevant to this objective.[14]
We also conducted a statistical analysis of the distribution of financial assistance from two EPA programs from fiscal year 2014 through fiscal year 2023.[15] Additionally, we analyzed data from two FEMA and USDA programs to describe recipient counties’ socioeconomic characteristics.[16] Appendix I describes our objectives, scope, and methodology in more detail. Appendix II contains details on our methodology for the analyses described in this paragraph.
We assessed the reliability of the data used in our analyses by (1) performing electronic testing for errors in accuracy and completeness, (2) reviewing related documentation about the data and the systems that produced them, (3) interviewing agency officials knowledgeable about the data, and (4) working closely with agency officials to identify and resolve data discrepancies. We determined that the data were sufficiently reliable for the purposes of analyzing financial assistance that EPA, FEMA, and USDA provided to improve drinking water and wastewater infrastructure, and the extent to which benefits of selected programs flowed to vulnerable communities from fiscal year 2014 through fiscal year 2023.
We conducted this performance audit from August 2023 to August 2025 in accordance with generally accepted government auditing standards. Those standards require that we plan and perform the audit to obtain sufficient, appropriate evidence to provide a reasonable basis for our findings and conclusions based on our audit objectives. We believe that the evidence obtained provides a reasonable basis for our findings and conclusions based on our audit objectives.
Background
Drinking Water and Wastewater Infrastructure
Approximately 50,000 community drinking water systems and 16,500 public wastewater systems provide clean and safe water to communities across the U.S.[17] Drinking water and wastewater infrastructure are the largest financial investments by communities nationwide, according to a 2014 study by the Water Research Foundation.[18] Such infrastructure includes water tanks, pipes, pumps, and buildings that contain electrical, chemical, and mechanical equipment to treat and test water. Local governments and their utilities generally pay the majority of the costs to repair, replace, and upgrade this infrastructure, primarily by charging rates for drinking water and wastewater services. Various federal programs also provide financial assistance for projects that help improve this infrastructure.
In addition to repairing or replacing old or degraded water infrastructure, other types of modifications can improve resilience to the effects of natural disasters. For example, drinking water utilities can improve infrastructure resilience by installing flood stop plates and sealing doors, modifying source water intake pipes to enhance drought and flood resilience, and improving the ability to treat water with high sediment levels after wildfires. Wastewater utilities can improve infrastructure resilience by reinforcing sewer lines that cross rivers, constructing wetlands to improve stormwater management, and relocating facilities outside of floodplains, among other things. In addition, elevating critical equipment and power generators above flood levels and obtaining backup power generators can improve infrastructure resilience for both types of utilities.
Federal Roles in the Water Sector
EPA, FEMA, and USDA have different roles in supporting drinking water and wastewater infrastructure, in accordance with their different missions.
· EPA generally focuses on renewing and maintaining water infrastructure to deliver clean drinking water and to safely treat and discharge wastewater, in accordance with its mission to protect human health and the environment. For example, EPA’s Drinking Water State Revolving Fund and Clean Water State Revolving Fund programs provide grants to states, which then make low-interest loans or grants to local communities and utilities for drinking water and wastewater infrastructure projects, among other eligible activities.[19]
· In accordance with its mission to help people before, during, and after disasters, FEMA’s role in supporting drinking water and wastewater infrastructure focuses on repairing or replacing infrastructure damaged during natural disasters and enhancing resilience against future damage. During the period of our review, FEMA programs that supported this role included the Building Resilient Infrastructure and Communities program, which provided pre-disaster hazard mitigation assistance, and the Hazard Mitigation Grant Program, which provides post-disaster hazard mitigation assistance.[20]
· USDA provides financial and technical assistance to support water infrastructure in communities with a population of 10,000 or less, in accordance with its Rural Development mission area. For example, USDA’s Water and Waste Disposal Loan and Grant Program provides grants, loans, and loan guarantees for eligible drinking water and wastewater projects in rural areas. Direct loans are obligated through three interest rate tiers. Two tiers are subsidized, including one tier for low-income communities impacted by health or sanitary issues, according to USDA officials.
See appendix III for descriptions of all 19 EPA, FEMA, and USDA programs we identified that could provide financial assistance for drinking water and wastewater infrastructure during the period of our review.
Statutes and Prior Executive Orders Related to Assistance to Vulnerable Communities
The authorizing statutes for certain federal programs that provide assistance for water infrastructure include provisions to provide financial assistance in various ways for vulnerable communities, as defined in those statutes. For example, the Safe Drinking Water Act, as amended, requires states to use from 12 percent to 35 percent of EPA’s grants for their drinking water revolving funds as additional subsidies for disadvantaged communities if the states receive sufficient loan applications from these communities.[21] Similarly, the Clean Water Act, as amended, requires states to use from 10 percent to 30 percent of EPA’s grants for their clean water revolving funds to provide additional subsidies to municipalities that meet certain affordability criteria if the state receives sufficient applications for assistance from these communities and if EPA capitalization grants to all states for the fiscal year exceed $1 billion.[22]
In addition, the Stafford Act, as amended—which authorizes FEMA’s hazard mitigation assistance programs, including those that provide financial assistance for water infrastructure—states that one of its purposes is to improve the natural hazard resilience of vulnerable communities.[23] It also authorizes FEMA to contribute a greater share of the total cost of mitigation activities under the Building Resilient Infrastructure and Communities program carried out in Economically Disadvantaged Rural Communities[24] or within, or that primarily benefit, Community Disaster Resilience Zones.[25]
Lastly, USDA programs that provide loans and grants for water infrastructure are to prioritize applications from rural communities having a population of 5,500 or less and meeting certain other criteria.[26] Various appropriations acts have directed USDA to allocate at least 10 percent of the appropriations for these loans and grants for assistance in territories or persistent poverty counties, which are counties in which at least 20 percent of the population has lived in poverty over the past 30 years.[27] Further, USDA’s regulation that implements its Water and Waste Disposal Loan and Grant Program states that the program’s purpose is to provide financial assistance for projects serving the most financially needy communities.[28]
Until their revocation, several executive orders had called for federal agencies to prioritize financial assistance for vulnerable communities, including assistance to improve drinking water and wastewater infrastructure. Specifically:
· Executive Order 14008, which established the Justice40 Initiative, was issued in 2021.[29] This initiative centered on the goal that 40 percent of the benefits of certain federal investments—including investments in water infrastructure—should flow to disadvantaged communities. For programs that participated in the initiative, agencies were directed to calculate the percentage of program benefits that flowed to and accrued in disadvantaged communities and report the results to the Office of Management and Budget.[30] This order was revoked in January 2025.
· Executive Order 13985, also issued in 2021, directed the White House Domestic Policy Council to coordinate federal agencies’ efforts to remove barriers to equal opportunity and programmatic benefits for people of color, people who live in rural areas, and other underserved communities.[31] This order was revoked in January 2025.
· Executive Order 12898, issued in 1994, called for all federal agencies to make achieving environmental justice part of their mission by identifying and addressing disproportionately high and adverse human health or environmental effects of programs, policies, and activities on minority populations in the U.S.[32] This order was revoked in January 2025.
Prior GAO Work on Drinking Water and Wastewater Infrastructure Resilience
In January 2020, we reported that EPA, FEMA, and USDA did not consistently consider climate information when providing financial assistance to improve the resilience of drinking water and wastewater infrastructure.[33] To address this, we recommended that Congress consider requiring climate resilience to be incorporated in the planning of drinking water and wastewater projects that receive financial assistance from these agencies. As of February 2025, Congress had not taken action on this matter. We also recommended that EPA engage a network of technical assistance providers to help utilities incorporate climate resilience into their projects and planning. As of December 2024, EPA officials told us that EPA was building a network of technical assistance providers to help water systems address infrastructure issues, including climate resilience.
We reported in February 2015 on challenges that utilities in rural communities faced at that time related to funding drinking water and wastewater infrastructure.[34] For example, some utilities did not have the number of users needed to share the cost of major infrastructure projects. Also, some utilities lacked the technical expertise needed to apply for financial assistance.
In 2021 we reported that some applicants found the application process for certain FEMA programs to be too complex and lengthy.[35] We recommended that FEMA establish a plan to identify and implement steps to reduce the complexity of, and time required for, its grant applications.[36] In May 2022, FEMA officials said they revised the grant award process for the Flood Mitigation Assistance and Building Resilient Infrastructure and Communities programs to provide for “round 1” approvals, reducing the application time frame by 2–3 months for certain applicants.
Also in 2021, we reported that certain FEMA programs did not collect or analyze demographic data to identify or address barriers that vulnerable populations and others experienced in accessing these programs.[37] We made two priority recommendations: (1) that FEMA develop and implement a plan to ensure the availability and use of data to identify such barriers and (2) that FEMA establish routine processes to address any barriers it identifies. FEMA agreed with our recommendations. In February 2025, FEMA officials told us that the agency had developed but had not yet implemented a plan for data collection, sharing, and analysis to identify potential equity issues.
Billions Provided in Fiscal Years 20142023 to Improve Water Infrastructure
EPA, FEMA, and USDA Provide Different Types of Financial Assistance for Drinking Water and Wastewater Infrastructure
EPA, FEMA, and USDA provide different types of financial assistance for projects focused on building or improving drinking water and wastewater infrastructure, as shown in figure 1.
Figure 1: Types of Financial Assistance Provided by EPA, FEMA, and USDA for Drinking Water and Wastewater Infrastructure Projects
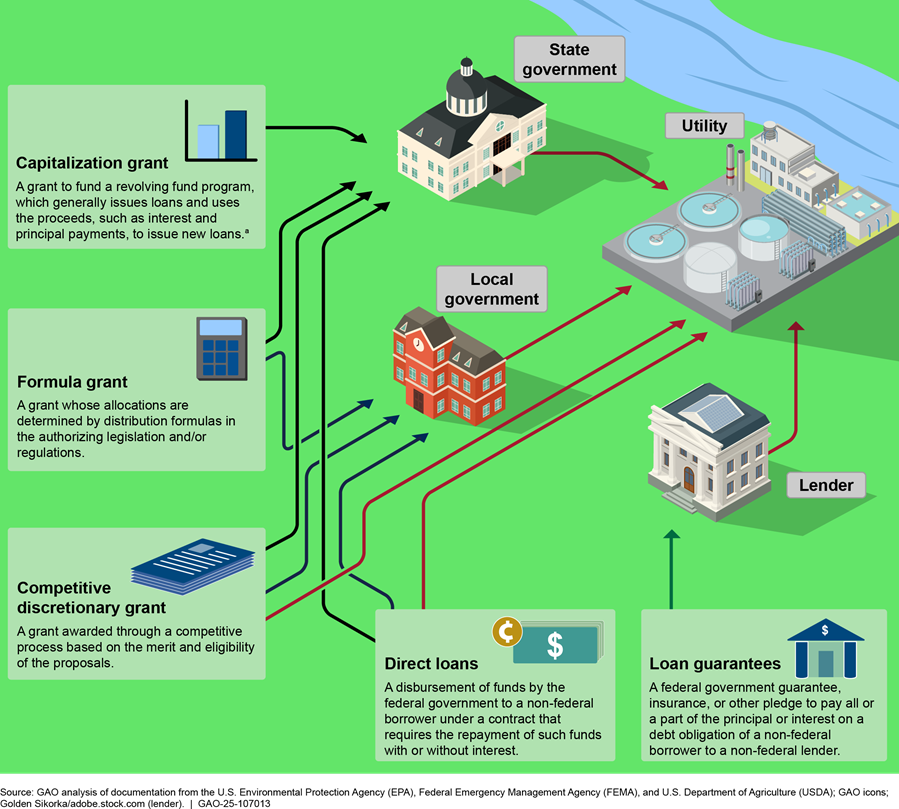
aThe defining feature of a revolving fund is its ability to retain and use ongoing receipts after the initial capitalization. Federal law authorizes and provides appropriations to agencies to award capitalization grants to eligible entities such as state governments and nonprofit organizations to establish a revolving fund. These entities use their revolving funds to issue loans and other authorized financial assistance for eligible projects to improve water infrastructure and other activities. Loan repayments and interest flow back into the revolving fund which can be used to provide additional loans and financial assistance.
Most Financial Assistance Was Provided as Capitalization Grants and Direct Loans
EPA, FEMA, and USDA provided assistance mainly in the form of capitalization grants and direct loans. Of the 18 programs we reviewed that could provide financial assistance, 17 are grant programs.[38] Thirteen of these grant programs made financial assistance available in fiscal years 2014 through 2023. Specifically, EPA, FEMA, and USDA obligated about $35 billion in grants during this period.[39] Three programs obligated 95 percent of these grant funds: (1) EPA’s Clean Water State Revolving Fund, (2) EPA’s Drinking Water State Revolving Fund, and (3) USDA’s Water and Waste Disposal Loan and Grant Program.[40] About $30 billion of these obligations were in the form of capitalization grants, according to our analysis. States used capitalization grant-funded revolving funds to provide financial assistance for at least 17,121 projects during our review period.[41] The remainder of the grant funds provided financial assistance for 5,348 projects. See appendix IV for maps showing the nationwide distribution of grants and direct loans provided by EPA, FEMA, and USDA for water infrastructure during our review period.
In addition to the 13 grant programs that provided financial assistance, we identified four other grant programs through which the agencies could provide financial assistance for water infrastructure but that had not made any obligations as of the end of fiscal year 2023. These programs are: (1) EPA’s Clean Water Infrastructure Resilience and Sustainability program, (2) EPA’s Drinking Water System Infrastructure Resilience and Sustainability program, (3) EPA’s Midsize and Large Drinking Water System Infrastructure Resilience and Sustainability Program, and (4) FEMA’s Safeguarding Tomorrow Revolving Loan Fund program.[42] For the first of these programs, which was authorized in 2021, EPA officials said that no funds had been appropriated as of March 2025. For the second program, EPA began making obligations in April 2025, according to EPA officials. EPA had not selected its first round of grant recipients for the third program as of the end of fiscal year 2023. For the fourth program, FEMA began selecting recipients in 2023 and began providing funds in April 2024. Figure 2 shows the amount of obligations made from fiscal year 2014 through fiscal year 2023 for the 17 grant programs we reviewed.
Figure 2: Obligations for Selected EPA, FEMA, and USDA Grant Programs for Projects to Improve Water Infrastructure, Fiscal Years 2014–2023
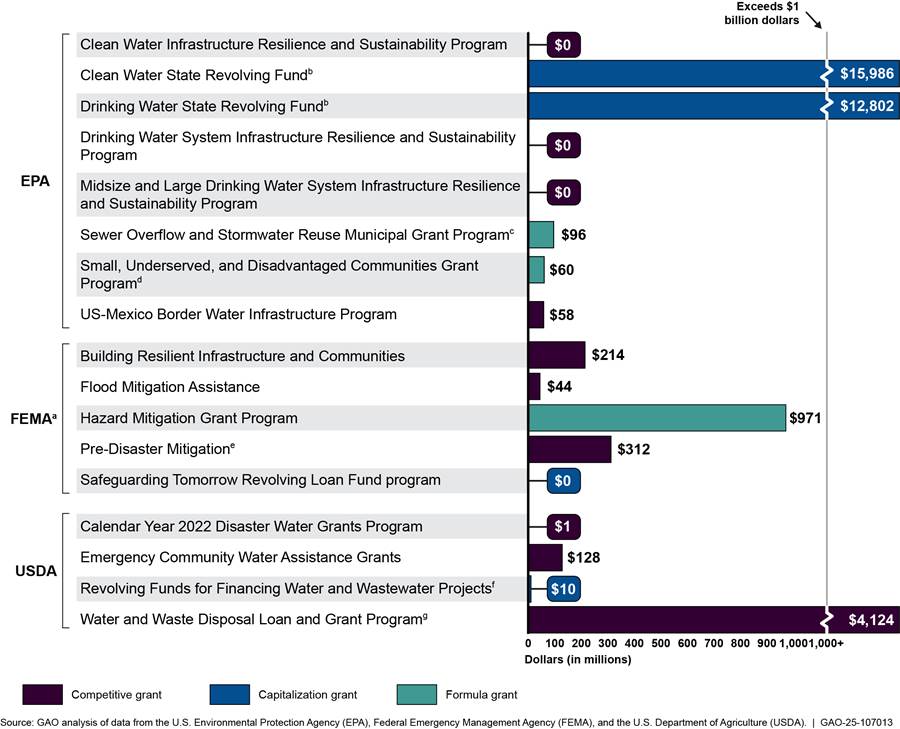
Note: This figure does not include programs that provide financial assistance for projects focused on water quality improvement activities such as lead removal, emerging contaminants, or watershed quality. Figures are not adjusted for inflation.
aFEMA also made obligations for drinking water and wastewater infrastructure projects, among other types of projects, through its Public Assistance during this period. However, we are not including this program in this figure because we were unable to identify the amount of obligations for water infrastructure projects made through this program due to limitations of the program’s data.
bEPA uses a formula to award a capitalization grant for each state revolving loan fund program. See 33 U.S.C. §§ 1381(a), 1384, 1285 (Clean Water State Revolving Funds); 42 U.S.C. § 300j-12(a)(1) (Drinking Water State Revolving Funds).
cEPA uses a formula to award grants to states that considers the state’s need for municipal combined sewer overflow controls, sanitary sewer overflow controls, and stormwater and any other appropriate information. 33 U.S.C § 1301(g)(2). States then award competitive grants to municipalities for planning, design, and construction of treatment works to intercept, transport, control, treat, or reuse municipal combined sewer overflows, sanitary sewer overflows, or stormwater, among other eligible activities. 33 U.S.C § 1301(a)(1). EPA can also award grants directly to municipalities for these purposes. 33 U.S.C § 1301(a)(2).
dEPA uses a formula to award grants to states to assist communities that are underserved and either small or disadvantaged that are unable to finance activities needed to comply with Safe Drinking Water Act requirements. 42 U.S.C. § 300j-19a. States are to use the grants to award competitive grants to support eligible public water systems within their jurisdiction. See EPA, Small, Underserved, and Disadvantaged Communities Grant Program Implementation Document (Dec. 2021).
ePre-Disaster Mitigation was a competitive grant program through the fiscal year 2019 grant cycle. It was considered to have been replaced by the Building Resilient Infrastructure and Communities program starting in the fiscal year 2020 cycle, but starting in fiscal year 2022, it awarded grants to recipients enumerated in the joint explanatory statements accompanying the relevant appropriations acts. Since then, it has been called Pre-Disaster Mitigation Congressionally Directed Spending.
fUSDA’s Revolving Funds for Financing Water and Wastewater Projects program uses a competitive selection process to award capitalization grants to qualified private or nonprofit entities, which then provide loans to eligible water and wastewater systems for pre-development costs for short-term small capital improvement projects and other projects that are not part of the regular operations and maintenance. See 7 U.S.C. § 1926(a)(2)(B); 7 C.F.R. pt. 1783.
gUSDA uses a formula to allocate funds to each Rural Development state office to issue competitive grants and direct loans. See 7 C.F.R. § 1780.18(a)(2).
During the period of our review, EPA’s Water Infrastructure Finance and Innovation Act program provided financial assistance in the form of direct loans, and USDA’s Water and Waste Disposal Loan and Grant Program provided grants, direct loans, and loan guarantees. For fiscal years 2014 through 2023, these two programs approved direct loans that totaled about $29.4 billion, which accounts for about 46 percent of the financial assistance provided across the programs we reviewed. Direct loans provided financial assistance for 4,848 projects during our review period. Unlike grants, direct loans are to be repaid to the federal government, with or without interest.
These two programs also offer loan guarantees, which are federal guarantees or insurance for the payment of all or part of a debt obligation of non-federal borrowers to non-federal lenders. Loan guarantee programs help borrowers obtain access to credit with more favorable terms than they may otherwise obtain in private lending markets. This is because the federal government guarantees to pay the lender if the borrower defaults, which makes extending credit more attractive to lenders.
Because direct loans are to be repaid and loan guarantees provide insurance that may not be necessary, the loan value of direct loans and loan guarantees, shown in figure 3, is generally larger than the cost to the government for this assistance.
Federal agencies are required to annually estimate the long-term cost, sometimes referred to as subsidy costs, of a new group of loans or loan guarantees based on expected loan performance.[43] Agencies also annually update, or reestimate, the cost of loans made in prior years. These annual updates take into account actual loan performance as well as revised assumptions about economic factors and future loan performance. The full costs of the loans will not be known until the end of the loan terms.
Figure 3: Loan Value of EPA and USDA Direct Loans and Loan Guarantees Approved for Projects to Improve Water Infrastructure, Fiscal Years 2014–2023
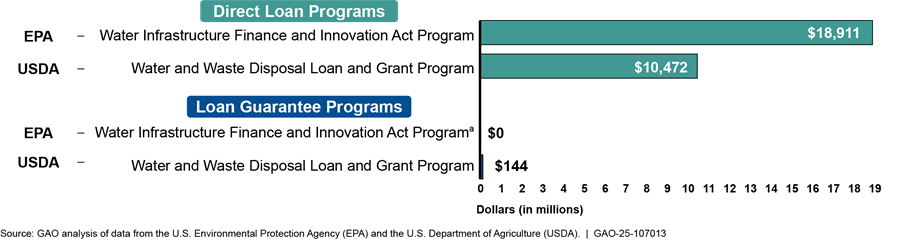
Note: This figure does not include programs that provide financial assistance for projects focused on water quality improvement activities such as lead removal, emerging contaminants, or watershed quality. Figures are not adjusted for inflation.
aThe Water Infrastructure Finance and Innovation Act Program may provide loan guarantees in certain cases. See 42 U.S.C. § 3908(e)(1). The program did not issue loan guarantees from fiscal year 2014 through fiscal year 2023.
The loan value of direct loans and obligations for grants for water infrastructure generally rose from fiscal year 2014 through fiscal year 2023 for the programs we reviewed, as shown in figure 4. EPA’s Water Infrastructure Finance and Innovation Act program provided 64 percent of direct loans for drinking water and wastewater infrastructure across the two direct loan programs we reviewed. According to program officials, the amount of loans provided by this program increased from fiscal year 2018 through fiscal year 2021 because of an increase in program staff levels and a decrease in interest rates during this period. Loan amounts then decreased in fiscal year 2022 and 2023 because of rising interest rates and greater availability of grant and supplemental funding such as appropriations through the 2021 Infrastructure Investment and Jobs Act, according to program officials.[44] Obligations for competitive grants for water infrastructure generally increased in that time as well—from $333 million in fiscal year 2014 to $526 million in fiscal year 2023.
Figure 4: Direct Loan and Grant Amounts for Selected Drinking Water and Wastewater Infrastructure Financial Assistance Programs, Fiscal Years 2014–2023
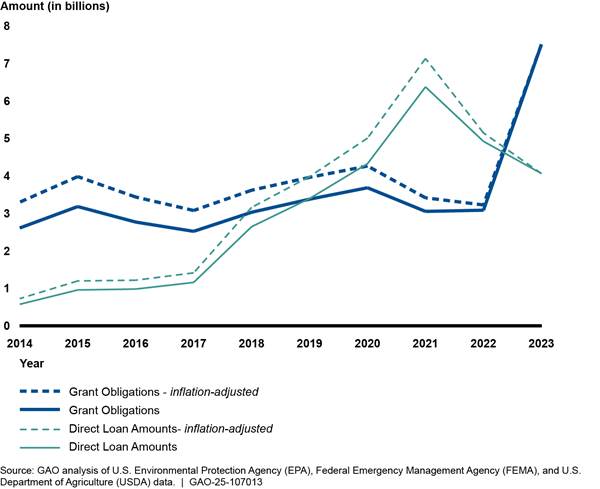
Note: This graphic depicts financial assistance from 12 grant programs, one direct loan program, and one program that provided grants and direct loans. The EPA programs depicted are the Clean Water State Revolving Fund; Drinking Water State Revolving Fund; Sewer Overflow and Stormwater Reuse Municipal Grant program; Small, Underserved, and Disadvantaged Communities Grant program; the U.S.-Mexico Border Water Infrastructure Program; and the Water Infrastructure Finance and Innovation Act program. The FEMA programs depicted are the Building Resilient Infrastructure and Communities, Flood Mitigation Assistance, and Pre-Disaster Mitigation programs, and the Hazard Mitigation Grant Program. The USDA programs depicted are the Calendar Year 2022 Disaster Water Grants program, Emergency Community Water Assistance Grants program, Revolving Funds for Financing Water and Wastewater Projects program, and Water and Waste Disposal Loan and Grant Program. This figure does not include programs that provide financial assistance for projects focused on water quality improvement activities such as lead removal, emerging contaminants, or watershed quality.
Utilities Identified Challenges Related to Infrastructure Resilience Costs
Repairing and Replacing Aging Infrastructure
Even with the financial assistance provided by federal government agencies, drinking water and wastewater utilities still face substantial costs to maintain, upgrade, or replace aging and deteriorating infrastructure—approximately $1.3 trillion over 20 years, according to EPA estimates.[45] As previously mentioned, local governments and their utilities generally cover the majority of costs to improve this infrastructure, primarily by charging rates for drinking water and wastewater services.
Utilities that are unable to gather sufficient revenues from rate payers may not be able to repair or replace deteriorating infrastructure. For example, the drinking water system in St. Louis, Missouri uses some equipment from the early twentieth century, according to utility representatives. Representatives said that the system was built to serve a population of 1 million people, but the city’s population has declined over time to less than half that amount, with much of the remaining population having low incomes. As a result, city officials have been reluctant to raise rates, and revenue from rate increases has been used to pay for operations and maintenance rather than to purchase new infrastructure, according to representatives.
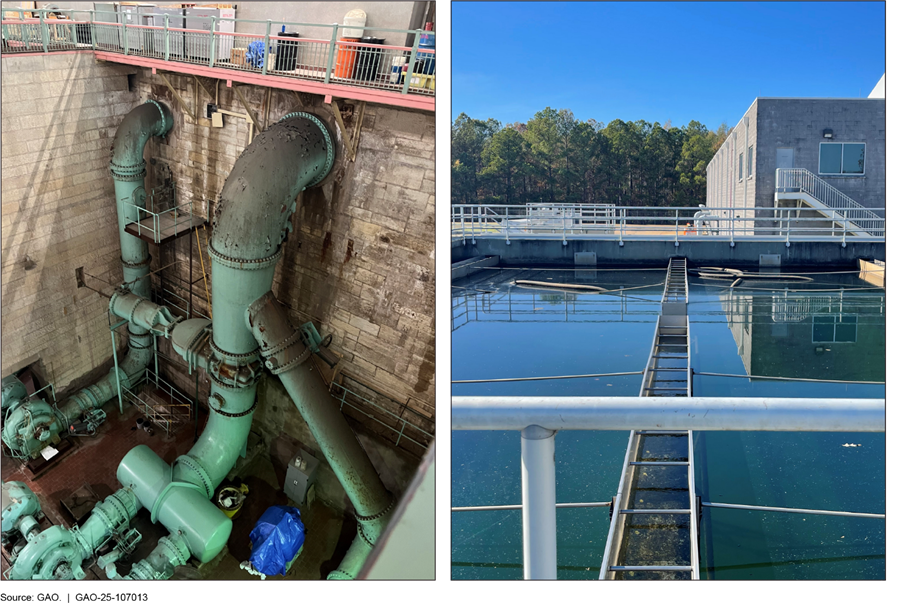
Failing to implement infrastructure upgrades can have catastrophic results. For example, officials from Jackson, Mississippi, said that their drinking water system failed during a period of heavy rain because the utility had not been able to update its infrastructure. Specifically, among other factors, the plant did not have backup pumps installed which could have provided additional capacity when its intake pumps became clogged with debris. It also did not have the technology to automatically measure and adjust the chemical composition of the water, according to utility representatives. As previously mentioned, Jackson’s water treatment plant failed following heavy rains and flooding in August 2022, leaving over 150,000 residents without potable water for more than 2 weeks. Parts of St. Louis’ and Jackson’s drinking water treatment plants are shown in figure 5.
Representatives from five of the 14 utilities we met with cited roadblocks to obtaining financing for infrastructure upgrades that can occur at the local level, such as local elected officials denying requests to increase the rates that community members pay to utilities. In addition, two representatives we spoke with said local officials might not approve proposed investments in water infrastructure because, among other factors, the results of such investments are not readily visible to the public.
Operations and Maintenance Costs
Representatives from three of the five technical assistance providers we spoke with said that the cost of routine operations and maintenance can also be a challenge for drinking water and wastewater utilities, particularly those in vulnerable communities.[46] Most of the financial assistance provided by federal agencies cannot be used for maintaining or operating this infrastructure. For example, the statutes authorizing EPA’s Drinking Water State Revolving Fund and Water Infrastructure Finance and Innovation Act programs exclude operations and maintenance expenses from eligible uses of the financial assistance.[47] In addition, the statute authorizing EPA’s Clean Water State Revolving Fund program requires the applicant to have adequate provisions and plans approved by EPA and the state to ensure proper and efficient operation and maintenance after the financed project has been constructed.[48] Together, these three programs provided 74 percent of the total grant and loan amounts for drinking water and wastewater infrastructure from fiscal year 2014 through fiscal year 2023 across the 14 programs we reviewed that provided financial assistance during this period.
For some federal programs, EPA and USDA are authorized to provide financial assistance for certain operations and maintenance costs. For example, direct loan recipients for the USDA Water and Waste Disposal Loan and Grant Program can generally use loan funds for initial operating expenses for the financed project for up to 1 year if they are unable to pay these expenses.[49] In another example, EPA’s Midsize and Large Drinking Water System Infrastructure Resilience and Sustainability Program may award grants to a public water system serving communities with a population of 10,000 or more for the operation or maintenance of eligible infrastructure projects that increase the system’s resilience to natural hazards and extreme weather events, among other activities.[50] As of January 2025, EPA had not yet made any obligations for this program.
Affordability of Loan Repayments
|
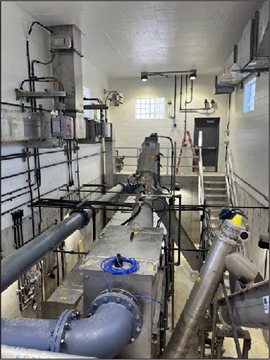
Wastewater Treatment Plant Improvements Partially Funded by USDA Loan
In 2019, USDA provided assistance through its Water and Waste Disposal Loan and Grant Program to Secretary, Maryland, for improvements to a wastewater treatment plant. This plant also serves East New Market, Maryland. As of March 2024, USDA had obligated $7 million in grants and provided $1.1 million in loans for the project. Source: GAO photo; U.S. Department of Agriculture (USDA) data. | GAO‑25‑107013 |
Representatives from eight of the 14 utilities we interviewed told us that loan repayments for water infrastructure—including repayments of loans available through revolving fund programs—can be costly for some communities to take on. For example, representatives we spoke with from a utility serving a community of fewer than 1,000 people told us that their community’s payments for a $1 million USDA loan for a new wastewater treatment plant represent a significant portion of the community’s entire budget.
In another example, a large municipal utility stated that the cost of its loan repayments disproportionately burdens vulnerable communities within their city because rates must be increased across the utility’s entire service area to cover loan repayments for multiple large capital projects. Further, representatives from another utility told us they had to “pick and choose” which projects and sources of financial assistance to pursue because of the high costs associated with their current federal loan repayment. As previously mentioned, 46 percent of the financial assistance we reviewed from fiscal year 2014 through fiscal year 2023 (about $29 billion) was from direct loan programs, and an additional $30 billion was from capitalization grant programs, which allow states to issue loans to eligible utilities.
EPA, USDA, and FEMA Took Steps to Address Barriers Faced by Vulnerable Communities, and FEMA Could Take Additional Steps
EPA, FEMA, and USDA have taken steps to address barriers that vulnerable populations may face in accessing and participating in selected programs that provide financial assistance for water infrastructure.[51] For example, all three agencies identified and addressed some barriers that may prevent vulnerable communities from fully benefitting from these programs. The agencies have also provided technical assistance to help potential applicants, including those in vulnerable communities, access and manage financial assistance. However, FEMA could communicate better about options for meeting cost-share requirements and could improve its assessment of program withdrawals.
EPA Took Steps to Address Barriers Faced by Vulnerable Communities
EPA identified barriers that may have prevented vulnerable communities—as defined by each of the programs we reviewed—from fully benefitting from certain programs.[52] Specifically, EPA documentation that we reviewed stated that vulnerable communities often lack technical, managerial, and financial capacity to apply for and implement its loan programs.
To address these barriers, EPA provided increased technical assistance. Technical assistance refers to programs, activities, and services provided by federal agencies to strengthen the capacity of grant applicants and recipients and to improve recipients’ performance of grant and loan functions. For example, in November 2022 EPA selected 29 technical assistance providers, called Environmental Finance Centers, to help vulnerable communities develop and submit project proposals, including for applications for EPA’s State Revolving Fund programs. See appendix V for a list of EPA, FEMA, and USDA programs that provide technical assistance to help communities apply for and manage financial assistance for drinking water and wastewater infrastructure.
In addition, when the Justice40 Initiative was active, EPA’s Drinking Water System Infrastructure Resilience and Sustainability program applied additional points to applications for proposed projects that would benefit certain types of communities.[53] For example, if the project would benefit underserved, small, and disadvantaged communities and would support the Justice40 Initiative, its application could have been awarded up to four points out of a total of 100 possible points.
FEMA Addressed Some Barriers That Vulnerable Communities Face but Could Improve Communication about Cost-Share Options
FEMA documentation identified several barriers that may prevent vulnerable communities from fully benefitting from the financial assistance programs we reviewed,[54] including:
· Some subapplicants lack the administrative capacity needed to complete the grant application process. For example, the environmental and historic preservation review process is complex, sometimes taking over a year to complete, even for well-resourced communities.[55]
· FEMA’s benefit-cost analysis requirement of its application process may be a barrier for communities with smaller populations, who may need assistance navigating the complexity required to complete the analysis and who often cannot reach the cost-effectiveness threshold requirement.[56]
· Vulnerable communities may lack funds to meet FEMA’s requirement for nonfederal cost share—the portion of the costs of a project not borne by the federal government.
Representatives from five of the 14 utilities we interviewed said cost-share requirements can be a challenge.[57] For example, representatives from one utility told us the cost share for a million-dollar infrastructure project could be more than the entire annual operating budget of a small town. We have previously reported that these issues pose barriers to participation in FEMA programs and that they may dissuade some applicants from seeking financial assistance from FEMA.[58]
To help address these and other challenges, FEMA’s Building Resilient Infrastructure and Communities program launched a technical assistance program in 2020.[59] This technical assistance program provided support from the pre-application through grant closeout phases, with a focus on supporting vulnerable communities.[60] One of the first communities to receive assistance was DePue, Illinois—a town with under 2,000 residents that experienced major flooding in 2008, causing raw sewage to back up into residents’ homes. Officials in DePue told us that FEMA’s technical assistance allowed DePue to complete plans for a project to relocate its current wastewater treatment plant—shown in figure 6—out of a floodplain, which would significantly mitigate the threat posed by floods. In fiscal year 2022, DePue submitted an application to FEMA for funding the relocation of this treatment plant, and FEMA subsequently awarded $23 million to DePue for this project. To further address challenges related to its benefit-cost analysis, in 2022 FEMA lowered the threshold for projects to be considered cost-effective if the project benefitted disadvantaged communities, among other criteria.[61] In June 2025, FEMA officials told us this lower threshold had been discontinued.
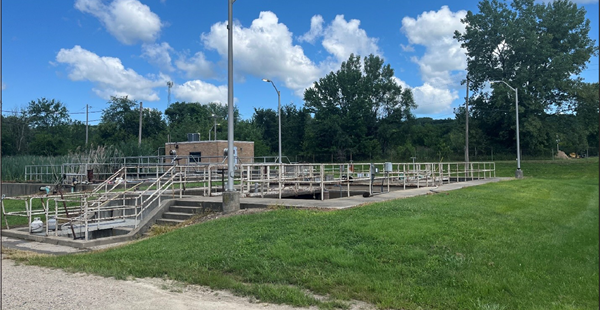
Source: GAO photo. | GAO‑25‑107013
To help address challenges related to cost share, FEMA modified cost-share requirements for certain types of recipients, consistent with statutory provisions. For example, the cost-share requirement for FEMA’s hazard mitigation assistance programs is generally 25 percent of a project’s cost. However, FEMA’s Building Resilient Infrastructure and Communities program had a cost-share requirement of 10 percent for Economically Disadvantaged Rural Communities and for projects within or primarily benefitting Community Disaster Resilience Zones.[62] For the Flood Mitigation Assistance program, FEMA may contribute up to 100 percent of project costs for severe repetitive loss structures and up to 90 percent of project costs for repetitive loss structures.[63] These options help FEMA fulfill the Stafford Act’s stated purpose of improving the natural hazard resilience of vulnerable communities.[64]
In addition, in certain circumstances, FEMA allows applicants to use funds from other federal programs to meet its cost-share requirements. For example, in 2019 FEMA and EPA established a memorandum of understanding stating that non-federal funds from state revolving funds may be used to meet cost-share requirements for FEMA programs if the activities are also eligible under the EPA programs.[65] Similarly, in October 2023 FEMA informed USDA that applicants for certain FEMA programs may use assistance from certain USDA programs to meet FEMA’s cost-share requirements for eligible water infrastructure projects.[66] These FEMA applicants seeking financial assistance from USDA programs must be rural communities and must meet other USDA eligibility requirements.
FEMA has communicated with potential applicants about some options for meeting cost-share requirements but has not adequately communicated about the option to use assistance from USDA programs. Specifically, FEMA’s 2016 guide on cost share for hazard mitigation assistance programs identifies several resources that applicants may use to meet cost-share requirements—including the nonfederal share of the state revolving funds—but it does not mention using assistance from USDA programs for water infrastructure projects. FEMA’s webpage about cost-share also does not contain this information. FEMA officials told us that as they learn of new sources of funds that may be used to meet cost-share requirements, they may add information about them to their guide on hazard mitigation programs. However, these officials did not reference specific plans to do so, nor did they mention plans to share this information through any other mechanism.
Standards for Internal Control in the Federal Government states that agencies should communicate information externally so that external parties can help agencies meet their objectives.[67] Given that representatives from several of the utilities that we spoke with mentioned FEMA’s cost-share requirements as a barrier, it is possible that utilities and other potential program recipients are not aware of the full range of federal programs they can leverage to meet cost-share requirements. By communicating with potential applicants about the full range of federal programs, such as certain USDA programs, that applicants can use to meet cost-share requirements for FEMA hazard mitigation programs, FEMA would better ensure that it is minimizing the cost share barrier for small, rural communities.
To further support applicants, FEMA offers the option to complete certain project application processes in phases. This process assists communities, including small communities, who lack technical and financial resources to provide the complete set of information required for complex project applications, according to FEMA documentation. A major benefit of this phased process is that FEMA awards grants and provides technical assistance to subapplicants to help them prepare certain technical and complex application materials, as identified in the “Phase I” portion of figure 7. Subapplicants are not required to refund FEMA for these costs if FEMA does not grant final approval for a project. FEMA’s Building Resilient Infrastructure and Communities program began offering the option for phased applications in its inaugural cycle in fiscal year 2020, and FEMA’s Flood Mitigation Assistance program began offering this option in fiscal year 2022.
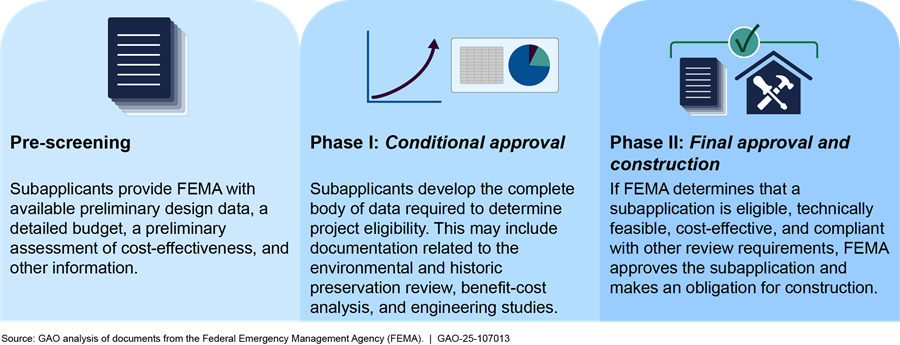
Note: Phased projects are allowable under the following FEMA programs unless otherwise indicated in the notice of funding opportunity: Hazard Mitigation Grant Program, Hazard Mitigation Grant Program Post Fire, Building Resilient Infrastructure and Communities, and Flood Mitigation Assistance. FEMA awards grants to applicants, which are generally states, which then distribute the awards to subapplicants, such as local governments.
FEMA Does Not Systematically Collect Data on Program Withdrawals
Although FEMA has taken steps to address barriers faced by vulnerable communities, some subapplicants—including those from vulnerable communities—withdrew from the FEMA programs we reviewed after FEMA had selected their subapplications for further review. FEMA officials said that subapplicants might withdraw their subapplications for reasons such as losing cost-share funding, choosing to pursue financial assistance from a different program, or losing support for the project because of a change in local political leadership.
An August 2024 FEMA report states that many program stakeholders reported that the length of time from application to award was a significant barrier. In addition, the report describes feedback from one program stakeholder who stated that the length of time from application to final approval caused some subapplicants to withdraw their applications from one of FEMA’s programs.[68] Additionally, according to FEMA data, there may have been delays between when FEMA selected a subapplication for further review and when FEMA made obligations for that project. Specifically, as of March 2025, FEMA had obligated 22 percent of the award amounts for Building Resilient Infrastructure and Communities subapplications that it had selected from fiscal year 2020 through fiscal year 2023, as shown in figure 8. For FEMA’s Flood Mitigation Assistance projects, this figure was 30 percent.
Figure 8: FEMA-Selected Project Award Amounts and Obligations for FEMA’s Building Resilient Infrastructure and Communities and Flood Mitigation Assistance Program Subapplications, Fiscal Years 2020–2023, as of March 2025
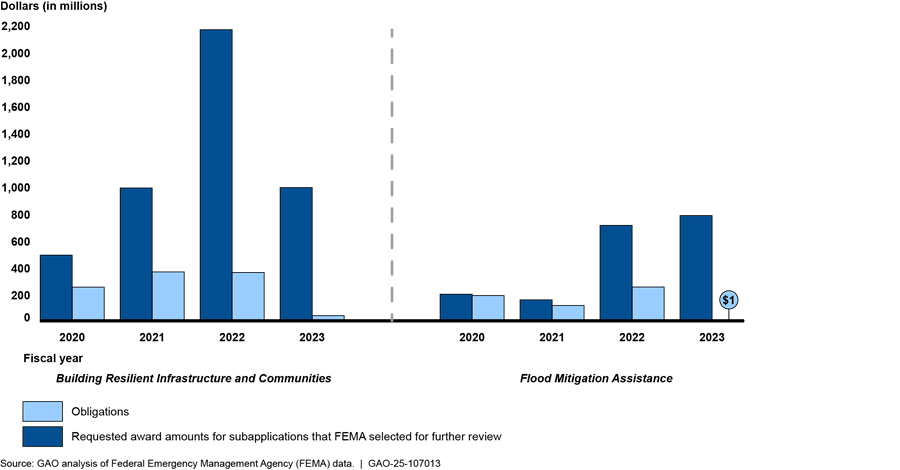
Note: This graphic depicts data as of March 2025 for subapplications for all types of projects, not just projects related to water infrastructure. The requested award amounts for subapplications that FEMA selected for further review may differ from final obligations because subapplicants may withdraw their applications or be found ineligible for financial assistance.
The FEMA hazard mitigation assistance programs we reviewed did not systematically track how many subapplicants withdrew from the programs prior to obligations being made or their reasons for withdrawal, according to a program official. FEMA officials said that program personnel sometimes add comments in FEMA’s grants management system to indicate that a subapplication was withdrawn. However, this comment field is associated with the field indicating that a subapplication was ineligible for funding and there is no field in the system specific to withdrawals. As a result, withdrawn subapplications appear as ineligible in FEMA’s system, thus overcounting ineligibility and providing no clear data on withdrawals, according to FEMA officials.
GAO’s Practices for Evidence-Based Policymaking says that federal agencies should generate evidence to help assess, understand, and identify opportunities to improve the results of federal efforts.[69] Such evidence should be complete and accurate enough to be able to provide insight into the extent to which the agency is meeting its goals. In addition, as previously mentioned, the Stafford Act calls for FEMA to improve the natural hazard resilience of vulnerable communities.
As previously discussed, vulnerable communities experience particularly pronounced barriers to completing FEMA hazard mitigation applications and meeting requirements for complex projects. These barriers may make vulnerable communities more likely to withdraw from the program than other communities. Generating more complete information about the extent to which subapplicants withdraw from the hazard mitigation assistance programs, and their reasons for withdrawal, could help FEMA identify and reduce barriers faced by program subapplicants, including vulnerable communities. This, in turn, could help improve the resilience of water infrastructure in vulnerable communities and elsewhere.
USDA Identified Barriers and Took Actions to Address Them
USDA identified barriers that vulnerable communities face through its Creating Opportunities through Rural Engagement initiative, created in November 2021. USDA created this initiative to engage with socially vulnerable, distressed, and underserved rural communities.[70] The barriers related to water infrastructure identified through this initiative include a lack of administrative capacity to apply for financial assistance, limited access to engineering firms, and a lack of capacity to manage the financial aspects of the program, according to USDA officials. USDA took actions to address these barriers, such as helping communities identify potential projects and connecting them with relevant financial resources, technical assistance, and partners. As of April 2024, USDA reported having engaged with nearly 700 communities through this initiative.
Other USDA initiatives aim to reduce barriers by providing technical and financial assistance to vulnerable communities and improving the grant application process. For example, in August 2022 EPA and USDA announced the Closing America’s Wastewater Access Gap Community Initiative.[71] This initiative provides no-cost technical assistance to help vulnerable communities identify and pursue financial assistance opportunities to address wastewater needs. Through this initiative, communities have received assistance performing rate studies to evaluate the feasibility of wastewater projects, identifying grants and financing options, and completing engineering and paperwork requirements for financial assistance applications. As of February 2025, this program had served 11 communities as part of a pilot program and planned to expand the initiative to serve 150 communities nationwide.
Further, USDA officials said they expect USDA’s Better Grants Better Service initiative to help reduce barriers for vulnerable communities because this initiative focuses on streamlining grant processes. For example, as of February 2025 this initiative had recommended that USDA revise and streamline certain grant program application forms, create an online grant administration portal and program search tool, and coordinate deadlines for grant programs. USDA’s ability to implement these recommendations is dependent on available resources, according to the initiative’s website.
Agencies Could Use Available Mapping Resources to Assess Program Beneficiaries
EPA, FEMA, and USDA used different measures and methods to assess the extent to which the benefits of selected programs reached vulnerable communities.[72] FEMA and USDA both assessed program beneficiaries using national measures. EPA used national measures for some programs and state-based measures for other programs. We analyzed data from two EPA programs and found statistically significant associations between certain characteristics of social vulnerability and the amount of financial assistance that communities received over a 10-year period. Using EPA’s mapping tool with drinking water service area boundaries could help EPA, FEMA, and USDA more accurately assess program results, including the extent to which program benefits reach vulnerable communities. In addition, when complete, a similar tool on wastewater service area boundaries could help these agencies assess the results of wastewater projects.
FEMA and USDA Used National Measures to Identify and Assess Program Beneficiaries
FEMA used various national measures to identify vulnerable communities and assess the extent to which program benefits went to these communities.[73]
Identifying vulnerable communities
· Some measures FEMA used to identify vulnerable communities are established in statute. For example—for the Building Resilient Infrastructure and Communities program—FEMA is authorized by statute to identify Community Disaster Resilience Zones and Economically Disadvantaged Rural Communities and provide up to 90 percent of the cost share for projects benefitting these communities.[74] The Flood Mitigation Assistance program is authorized by statute—for amounts appropriated under the Infrastructure Investment and Jobs Act for fiscal years 2022 through 2026—to use the Social Vulnerability Index to identify properties located within a vulnerable census tract.[75] FEMA is authorized to provide up to 90 percent of the cost share for projects benefitting these properties.[76]
· In fiscal years 2021 and 2022, to meet requirements for the Justice40 Initiative, FEMA used the Social Vulnerability Index to identify vulnerable communities. Specifically, FEMA’s Building Resilient Infrastructure and Communities program defined vulnerable communities as census tracts with a Social Vulnerability Index score of 0.6 or higher or Economically Disadvantaged Rural Communities. FEMA’s Flood Mitigation Assistance program defined vulnerable communities as property addresses within a census tract, or across multiple census tracts for certain projects, with a Social Vulnerability Index score of 0.5 or higher. Tribes and communities with census tracts that were designated as Community Disaster Resilience Zones were automatically considered to be vulnerable. FEMA officials said that in fiscal year 2023 they used the Climate and Economic Justice Screening Tool, which was developed for the Justice40 Initiative, to identify vulnerable communities and to calculate the amount of program benefits that went to these communities.[77]
Assessing program beneficiaries
· From fiscal year 2021 through fiscal year 2023, FEMA calculated the total program benefits reaching vulnerable communities by multiplying the percentage of vulnerable census tracts (as defined by the measures described above) by the total preliminary award amount for each project. For example, if 80 percent of the census tracts benefiting from a project with a $1 million preliminary award were designated as vulnerable, FEMA officials would estimate that $800,000 of that award went to vulnerable communities.
· In March 2025, we asked FEMA officials whether they planned to use the Climate and Economic Justice Screening Tool going forward to identify and assess vulnerable program beneficiaries, given that the executive order that established the Justice40 Initiative was revoked in January 2025. As of May 2025, when we sent the report to FEMA for official comment, FEMA had not provided a response.
USDA also used various national measures to identify vulnerable communities and assess program beneficiaries.
Identifying vulnerable communities
· USDA used the Distressed Communities Index prior to and during the first 2 years of the Justice40 Initiative to identify vulnerable census tracts, according to USDA officials.[78] USDA officials said they shared this information with states and USDA field staff to target outreach and engagement with vulnerable communities.
· In fiscal year 2023, USDA officials used the Climate and Economic Justice Screening Tool to identify vulnerable census tracts, according to program officials.
Assessing program beneficiaries
· To assess the extent to which program benefits reached vulnerable communities, officials identified projects that received financial assistance and that involved construction or improvement of facilities with a health or sanitary component. Officials then summed the amount of financial assistance received by each facility that was located in a vulnerable census tract, as defined by the Distressed Communities Index or the Climate and Economic Justice Screening Tool.
· In March 2025, USDA officials said they do not plan to use the Climate and Economic Justice Screening Tool or any other tools to identify disadvantaged communities. However, as previously mentioned, various appropriation acts have required the USDA to allocate a certain amount of rural water and waste disposal financial assistance for persistent poverty counties, as defined by law.[79]
EPA Used State-Based and National Measures to Assess Program Beneficiaries
Four of the seven EPA programs we reviewed either used national measures to identify vulnerable communities and assess the extent to which program benefits reached them, or they did not conduct such an assessment because the program predominantly or exclusively benefitted vulnerable communities.
· Water Infrastructure Finance and Innovation Act program. The Water Infrastructure Finance and Innovation Act of 2014, as amended, authorizes EPA to provide direct loans and loan guarantees to eligible borrowers for water infrastructure projects.[80] Under this program, EPA must use 13 selection criteria for evaluating and selecting among eligible projects to receive financial assistance, including the extent to which the project serves “economically stressed communities.”[81] This program uses standardized national measures, including median household income and poverty rate, to identify whether a prospective borrower is “economically stressed.”[82] The borrower as a whole would be designated as economically stressed—the program does not identify specific communities within the borrower’s area that are economically stressed, according to program officials. Officials said they use this information to track the extent to which vulnerable communities may have benefitted from the program.
· Drinking Water System Infrastructure Resilience and Sustainability program and Small, Underserved, and Disadvantaged Communities program. These two programs provide grants only to eligible public water systems that serve communities that are underserved and either small or disadvantaged, as determined by national measures established by law.[83] Therefore, program officials stated that all program benefits reached vulnerable communities. For both programs, the measures used to identify beneficiary communities include national safe drinking water standards, such as whether the community is served by a public water system that exceeds a regulatory maximum contaminant level.
· U.S.-Mexico Border Water Infrastructure Program. This program provides financial assistance for drinking water and wastewater infrastructure projects in both the U.S. and Mexico that are within 100 kilometers (62 miles) of the southern border.[84] Officials from this program said they do not assess the extent to which the program benefits vulnerable communities because nearly all communities that benefit from this program are vulnerable. According to program documents, this program provides financial assistance for underserved, small, and economically distressed border communities that have inadequate or no access to basic drinking water and sanitation.[85]
Three EPA programs that we reviewed used states’ data to identify vulnerable communities, including two revolving fund programs that provide capitalization grants to states, which then make low-interest loans or grants to local communities and utilities.
· Drinking Water State Revolving Fund. The statute authorizing this program defines a disadvantaged community as the service area of a public water system that meets affordability criteria established by the state in which that system is located.[86] EPA reported in 2022 on the variation in definitions of disadvantaged communities across states.[87] For example, this report stated that nearly all states used data on median household income to help identify disadvantaged communities, 27 states used data on water rates, and 16 states used data on water system size.[88] The program’s authorizing statute requires that states provide between 12 percent and 35 percent of their annual federal capitalization grant as additional subsidization for disadvantaged communities if the state receives sufficient loan applications from these communities.[89]
· Clean Water State Revolving Fund. The statute authorizing this program requires states to establish affordability criteria based on income and unemployment data, population trends, and other data determined relevant by each state to identify municipalities that would experience a significant hardship financing an eligible project if additional subsidization is not provided.[90] This program’s authorizing statute requires that states provide 10 percent to 30 percent of their annual federal capitalization grant as additional subsidies if the state receives sufficient applications for assistance from these communities and if EPA capitalization grants to all states for the fiscal year exceed $1 billion.[91]
· Sewer Overflow and Stormwater Reuse Municipal Grants program. This program provides grants to states, who then award competitive grants to municipalities for planning, design, and construction of treatment works to intercept, transport, control, treat, or reuse municipal combined sewer overflows, sanitary sewer overflows, or stormwater, among other eligible activities.[92] The statute authorizing this program requires states to give selection priority to “financially distressed community” applicants, defined as municipalities that meet affordability criteria established by the state.[93]
Officials from these three programs told us that they do not plan to use national data to assess the extent to which program benefits reached vulnerable communities. Officials from EPA’s Drinking Water State Revolving Fund and Clean Water State Revolving Fund programs said they believe states’ data are optimal for this purpose. Officials from EPA’s Sewer Overflow and Stormwater Reuse Municipal Grants program said states’ definitions and data contain valuable context that a federal definition may omit. Further, officials from EPA’s State Revolving Fund programs said that newly developed national datasets, such as the Water Infrastructure and Capacity Assessment Tool, can be used to generate assessments of the distribution of State Revolving Fund program benefits to communities nationwide.
Available Mapping Resources Could Help Agencies Assess Program Results
The three agencies have limited data on the geographical areas that are served by drinking water and wastewater utilities, which made it difficult to accurately identify which communities benefited from infrastructure projects, according to agency officials. For example, officials from one of the FEMA programs we reviewed said that they asked applicants to submit maps of projects’ benefitting areas as part of the 2023 application cycle, but these maps varied in quality. USDA officials said that a lack of data on service areas leads to inaccuracies in how USDA assesses the extent to which its projects benefit certain communities. As a result, USDA may be underreporting its overall investment in vulnerable communities, according to program officials.
Officials from one EPA program explained that a drinking water system service area may differ from the boundaries of a municipality, and both may differ from the boundaries of vulnerable communities. Specifically, officials said some applicants are large cities that have pockets or neighborhoods of populations that are vulnerable. However, because program officials do not have data on water system service areas, they assess the vulnerability of the applicant city as a whole. Such an assessment might not accurately represent the proportion of beneficiaries within the water system service area who are in vulnerable communities, as shown in figure 9.
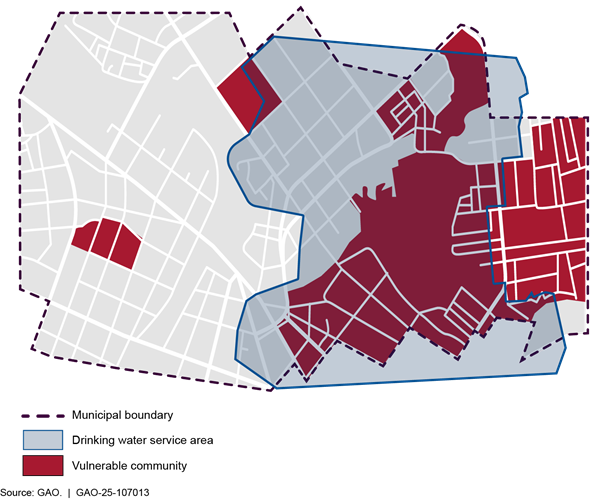
Notes: This figure depicts a hypothetical example of how different geographical areas may or may not overlap. It does not represent an actual municipality or service area. The definition of “vulnerable community” varies across federal programs. Such communities may be referred to in statutes and program guidance as “disadvantaged,” “underserved,” “hardship,” or “rural,” among other designations.
In July 2024, EPA released a mapping tool with the geographical service area boundaries of community drinking water systems.[94] It contains the service area boundaries for around 99 percent of the population served by community water systems, according to EPA’s website. EPA officials said they are using a similar approach to develop a mapping tool for wastewater utilities’ service area boundaries, which they estimated would be complete in summer 2025.[95]
An EPA document identified potential uses for this tool, including:[96]
· identifying population groups that may be affected by threats to drinking water infrastructure, such as children, elderly, or low-income populations;
· evaluating and improving drinking water infrastructure planning, including determining grant eligibility and prioritization of state revolving fund allocation;
· analyzing natural disaster risks within a drinking water service area; and
· fostering interagency collaboration related to community water systems.
Officials from FEMA and USDA programs we reviewed said they did not use EPA’s drinking water mapping tool because they were not aware it existed. Once we informed FEMA officials about the drinking water tool and the planned wastewater tool, they said that using them may not be feasible because FEMA does not identify which of its hazard mitigation projects are intended to improve drinking water or wastewater infrastructure. We asked FEMA in March 2025 for more information about the feasibility of identifying water-related projects and using EPA’s mapping tools; as of May 2025, when we sent the report to FEMA for official comment, FEMA had not responded to our questions. Water infrastructure is one of 16 critical infrastructure sectors, meaning that it is “so vital to the U.S. that the incapacity or destruction of such systems and assets would have a debilitating impact on security, national economic security, [and/or] national public health or safety.”[97] Identifying projects that are related to drinking water and wastewater infrastructure—as well as using EPA’s mapping tools to determine which communities are benefitting from these investments, as described below—would enable FEMA to more accurately assess the agency’s investments in this critical infrastructure sector.
When we informed USDA officials about these tools, they expressed a concern that the methods EPA used to develop them might result in inaccurate service area boundary data for the rural communities USDA serves. However, the EPA officials that developed the drinking water service area tool said that the methodology they use performs well in small, rural areas because it is relatively easy to identify a community water system in such areas. This is because these areas are typically served by a single water utility and are spatially isolated from other community water systems and developed areas, simplifying their delineation and identification, according to EPA officials.
In addition, EPA officials said that a certain level of technical skill would be required to use the mapping tools to assess program beneficiaries. In May 2025, EPA officials pointed us to instructions on a public EPA website for federal agencies and other potential users on how to join census data with the service area data from the mapping tools.[98] Joining this data could help users more accurately assess the populations that could benefit or have benefitted from financial assistance, including the extent to which these populations are vulnerable, according to EPA officials. However, these officials said that the instructions alone likely would not be sufficient to enable users to perform such an analysis because each user has unique needs, and EPA could not address each of these needs in its written instructions. To bridge this gap, EPA officials said they provide individualized assistance to potential users of its mapping tools, such as other federal agencies, to help them use the tools to meet their specific needs. As of May 2025, information on how to contact the EPA officials who can provide such assistance was available on a public EPA webpage.[99]
GAO’s Evidence-Based Policymaking: Practices to Help Manage and Assess the Results of Federal Efforts says that federal agencies should generate evidence to help assess, understand, and identify opportunities to improve the results of federal efforts.[100] Such evidence should be complete and accurate enough to be able to provide insight into the extent to which the agency is meeting its goals. By consulting with EPA officials with expertise on EPA’s mapping tools and then using the tools to assess program beneficiaries, FEMA and USDA programs that provide financial assistance for water infrastructure could more accurately assess who benefits from these programs, including vulnerable communities as defined by each program.[101] For example, FEMA could use the mapping tools to understand whether the beneficiaries of its assistance are Economically Disadvantaged Rural Communities or Community Disaster Resilience Zones. Similarly, USDA could use the tools to assess whether the beneficiaries of its assistance are persistent poverty counties. Ultimately, these assessments could help ensure that vulnerable communities receive financial assistance for water infrastructure and become more resilient to the effects of natural disasters.
EPA officials expressed different concerns related to using EPA’s service area mapping tools to help assess the extent to which financial assistance from the State Revolving Fund programs reached vulnerable communities. Specifically, they said that doing so would require EPA to develop a national definition of vulnerable communities, which is contrary to the programs’ statutory requirement for states to define such communities as being those which meet the states’ affordability criteria.[102] Further, they said that EPA cannot require states to use specific data or factors to define and identify vulnerable communities. However, EPA can assist states that wish to assess the distribution of financial assistance within their state. For example, EPA already conducts annual reviews of each state’s revolving fund program, which include discussions with states about challenges and opportunities. EPA guidance could help states use the mapping tools to assess the extent to which the beneficiaries of their programs are vulnerable communities, as defined by each program and each state. Furthermore, EPA could provide tailored technical assistance to states on how to use the mapping tools. Discussing the results of such assessments with the states, for example, during the annual review process could help states explore options to better support vulnerable communities.[103]
We reported in 2023 that two key practices for agencies to manage and assess the results of their efforts are generating and using evidence to understand program results and assess progress toward their goals.[104] For example, we reported that agencies can conduct an evaluation to assess the extent to which a program achieves desired outcomes. Further, according to these key practices, agencies should assess whether such evidence is of sufficient coverage and quality to assess program goals, including whether the evidence is accurate and complete. As previously mentioned, states are required under certain conditions to provide a percentage of financial assistance from their EPA capitalization grant for the states’ drinking water and clean water revolving fund programs to vulnerable communities.[105] EPA relies on states’ data to track the extent to which states provide assistance to such communities. States can conduct assessments of their programs’ distribution of financial assistance, but not all states have complete data on utilities’ service area boundaries. Providing guidance and assistance to states on how to use EPA’s mapping tools to assess the extent to which the beneficiaries of these programs are vulnerable communities, as defined by each state for each program, would enable EPA to have better evidence about the extent to which states are meeting these requirements. Such evidence could ultimately help EPA ensure that vulnerable communities become more resilient to the effects of natural disasters.
We conducted a statistical analysis of data from EPA’s Drinking Water State Revolving Fund program, which provides an example of how EPA’s drinking water service area mapping tool can be used as part of an assessment of program results. Specifically, we identified census tracts that overlapped with drinking water systems associated with projects that received financial assistance from fiscal year 2014 through fiscal year 2023. In doing so, we identified instances in which communities with certain aspects of vulnerability received less financial assistance than other communities. Specifically, we found that, compared to average communities, communities with a greater percentage of non-white or Hispanic/Latino populations received about $50,000 less financial assistance (5 percent less), on average.[106] However, we found that some communities with aspects of vulnerability received more financial assistance. Specifically, more socially vulnerable communities—that is, those higher on the social vulnerability index scale—received about $121,000 more (12 percent more), and high-poverty communities received about $31,000 more assistance (3 percent more), on average.[107]
For the Clean Water State Revolving Fund program, we found that compared to average communities, communities with a greater percentage of non-white or Hispanic/Latino populations received about $203,000 more financial assistance (12 percent more), on average.[108] More socially vulnerable communities received about $248,000 less (16 percent less) on average, and high-poverty communities received about $247,000 less per community on average (16 percent less).[109] See appendix II for more information on our methodology and findings related to this analysis, and for findings of a more limited analysis that we conducted of two FEMA and USDA programs. We were unable to conduct a statistical analysis of FEMA and USDA programs due to limitations in the data, as explained in appendix I.
Our statistical analysis of EPA’s state revolving fund programs provides an example of how EPA’s service area mapping tool could generate evidence to be used by federal and state agencies to assess which communities benefit from investments in water infrastructure. Such an analysis could enable agencies to assess the results of their efforts by providing evidence to understand their progress toward meeting statutory requirements to reach communities that are vulnerable as defined by each program.
Conclusions
The increasing number and cost of natural disasters may result in more frequent disruptions in drinking water and wastewater services in the coming years. Drinking water and wastewater utilities in vulnerable communities—such as those in low-income, rural, or otherwise disadvantaged areas—are less likely to be well-maintained and resilient to the effects of such disasters.
EPA, FEMA, and USDA have provided financial assistance for water infrastructure improvements and have taken steps to identify and address barriers that vulnerable communities face when trying to access this financial assistance. FEMA could provide more complete information about the range of federal programs that applicants can use to meet cost-share requirements—a key barrier the agency identified. Additionally, FEMA is missing opportunities to better understand why some subapplicants withdraw from hazard mitigation programs. By generating more complete data on program withdrawals, FEMA could better identify common barriers and target its actions to reduce them.
Drinking water and wastewater service area mapping tools, such as those developed or under development at EPA, provide opportunities for federal programs to assist states to more accurately assess who benefits from financial assistance from these programs, including vulnerable communities as defined by each program. Given that, using the mapping tool, we identified instances in which communities with certain aspects of vulnerability received less financial assistance than other communities, we believe that conducting these assessments is an important step toward understanding who is benefitting from agencies’ programs and improving the resilience of water infrastructure nationwide. EPA could support such assessments through guidance and technical assistance on its mapping tools.
Recommendations for Executive Action
We are making a total of eight recommendations, including four to FEMA, two to USDA, and two to EPA. Specifically:
The FEMA Administrator should ensure that FEMA’s hazard mitigation assistance programs communicate with potential applicants about USDA financial assistance that may be used to fulfill nonfederal cost-share requirements in certain circumstances. (Recommendation 1)
The FEMA Administrator should ensure that FEMA’s hazard mitigation assistance programs systematically track and assess the number of, and reasons for, subapplicant withdrawals and address any related barriers, as appropriate. (Recommendation 2)
The FEMA Administrator should ensure that FEMA’s hazard mitigation assistance programs identify and track projects related to drinking water infrastructure. Then, these programs should consult with relevant EPA officials on how to use EPA’s community water system service area mapping tool to more accurately assess the beneficiaries of these projects—including vulnerable communities, as defined in the relevant laws—and use the tool for this purpose. (Recommendation 3)
The FEMA Administrator should ensure that FEMA’s hazard mitigation assistance programs identify and track projects related to wastewater infrastructure. Then, these programs should consult with relevant EPA officials on how to use EPA’s wastewater system service area mapping tool, once available, to more accurately assess the beneficiaries of these projects—including vulnerable communities, as defined in the relevant laws—and use the tool for this purpose. (Recommendation 4)
The Secretary of Agriculture should ensure that USDA financial assistance programs for drinking water infrastructure consult with relevant EPA officials on how to use EPA’s community water system service area mapping tool to more accurately assess the beneficiaries of assistance for drinking water infrastructure, including vulnerable communities, as defined in the relevant laws. Then, these USDA programs should use the tool for this purpose. (Recommendation 5)
The Secretary of Agriculture should ensure that USDA financial assistance programs for wastewater infrastructure consult with relevant EPA officials on how to use EPA’s wastewater system service area mapping tool, once it is available, to more accurately assess the beneficiaries of assistance for wastewater infrastructure, including vulnerable communities, as defined in the relevant laws. Then, these USDA programs should use the tool for this purpose. (Recommendation 6)
The Administrator of EPA should provide guidance and technical assistance to states on the agency’s community water system service area mapping tool and how to use it to assess the extent to which the beneficiaries of the Drinking Water State Revolving Fund program are disadvantaged communities, using states’ definitions of such communities as required by law. (Recommendation 7)
The Administrator of EPA should provide guidance and technical assistance to states on the agency’s wastewater system service area mapping tool, once it is available, and how to use it to assess the extent to which the beneficiaries of the Clean Water State Revolving Fund program are communities with significant financial hardship, using states’ definitions of such communities as required by law. (Recommendation 8)
Agency Comments and Our Evaluation
We provided a draft of this report to EPA, FEMA, and USDA for review and comment.
The Department of Homeland Security (DHS) provided written comments (reproduced in app. VI) on behalf of FEMA. DHS concurred with our first and second recommendations and did not concur with our third and fourth recommendations to FEMA. DHS did not provide technical comments, but FEMA officials provided updated information that we had requested during the course of our review. We incorporated this updated information into our report.
EPA provided written comments (reproduced in app. VII). EPA did not concur with our two recommendations to it. EPA also provided technical comments, which we incorporated as appropriate.
USDA did not provide written comments and did not comment on our two recommendations to it. USDA did provide technical comments, which we incorporated as appropriate.
DHS agreed with our first recommendation that FEMA communicate about USDA financial assistance that may be used as cost-share. DHS stated that FEMA is reviewing the current Hazard Mitigation Assistance cost share guide. Following this review, FEMA plans to update the guide to include information about USDA financial assistance options. FEMA then plans to share the updated guide with potential applicants on FEMA.gov, which DHS estimates will happen by December 2026. If implemented effectively, these actions should address the intent of our recommendation.
DHS also agreed with our second recommendation that FEMA track reasons for subapplicant withdrawals. DHS stated that FEMA’s Hazard Mitigation Assistance Directorate will work with the FEMA Grants Outcomes system team to add “withdrawn” as a status option for projects. FEMA plans to use the existing comment field to track the reason for withdrawals. In addition, DHS noted that FEMA will consider how to assess the number of, and reasons for, subapplicant withdrawals to determine any further action to address related barriers. DHS estimated that FEMA would complete these steps by December 2026. If implemented effectively, these actions should address the intent of our recommendation.
DHS did not concur with our third and fourth recommendations to FEMA to identify and track projects related to drinking water and wastewater infrastructure and to consult with EPA on using its mapping tools to assess project beneficiaries. DHS officials stated that FEMA tracks information that is sufficient to understand how funds are being used. Furthermore, officials stated that FEMA requires that projects be technically feasible, cost-effective, and meet environmental compliance requirements, and that the agency is not required to use EPA’s mapping tools. Officials stated that tracking drinking water or wastewater projects, or using EPA’s mapping tool, would not be an efficient or effective use of government resources.
We continue to believe that tracking drinking water and wastewater infrastructure projects, and using EPA’s mapping tools, would allow FEMA to more accurately assess who benefits from these investments for two reasons.
First, FEMA’s data are currently not specific enough to identify drinking water and wastewater projects. For example, FEMA tracks projects’ primary activities, such as generators and utility and infrastructure protection. However, both of these primary activities can include projects for systems other than drinking water and wastewater. As a result, this information does not provide enough detail to identify whether the projects support water infrastructure. In our analyses of FEMA data, we could neither definitively distinguish between drinking water and wastewater projects, nor conclude that we had identified all drinking water- and wastewater infrastructure-related projects.
Drinking water and wastewater infrastructure provide critical lifelines to communities during and in the immediate aftermath of disasters, and failure of these systems can delay recovery efforts. By tracking water and wastewater infrastructure projects, FEMA would be able to generate higher quality evidence about its programs and investments in this sector. Further, FEMA’s investments are part of the federal government’s overall investment in water and wastewater infrastructure, and its data can help develop the full picture of federal investment in this critical infrastructure sector.
Second, FEMA is also limited in its ability to identify who benefits from these projects. Using EPA’s mapping tools would help FEMA gain a more accurate understanding of who is benefitting from the agency’s investments. For example, FEMA asked applicants to submit projects’ benefitting areas for the Building Resilient Infrastructure and Communities program’s 2023 application cycle, but these maps varied in quality, according to FEMA officials. Leveraging EPA’s mapping tools would be an efficient way for FEMA to enhance the quality of its information about benefitting areas. Additional analysis of these benefitting areas could be tailored to measure FEMA’s progress toward meeting various agency goals or utilizing authorizations in law to provide additional assistance to vulnerable communities.
Furthermore, EPA identified several potential uses of the mapping tools that we believe are potentially relevant for FEMA. For example, using the tool could help FEMA more accurately identify population groups that may be affected by threats to drinking water infrastructure, such as children, elderly, or low-income populations. In addition, using the tools could allow FEMA to more accurately analyze natural disaster risks within a drinking water and wastewater service area. As we illustrate in our report, service areas can differ from municipal boundaries. Using the mapping tools would enhance FEMA’s understanding of disaster risks for this critical infrastructure sector and whether current and future resilience investments are supporting those needs.
EPA did not concur with our seventh and eighth recommendations to integrate EPA’s service area mapping tools into its annual review of State Revolving Fund programs to assess the extent to which programs are benefitting vulnerable communities, as defined by each program and each state. EPA officials cited concerns that it is not feasible to use the mapping tools to conduct such assessments as part of the annual review process, in part because the program statutes direct that states determine what criteria are used to define disadvantaged or other communities, and in part because of incomplete data and the limitations of the mapping tools.
However, we continue to believe our recommendations to use the tools are valid. We modified these recommendations and parts of our report in response to EPA’s comments.
In particular, we agree that states determine what criteria are used to define communities and note that our recommendations reflect this. However, we also believe that EPA could work with states during the annual review process to use the tools to better understand the distribution of funding each state’s definition achieved. We modified language in our report and recommendations to clarify that EPA should provide guidance and technical assistance to states on how to use the mapping tools to conduct their own assessments of their State Revolving Fund programs. We clarified in the report that the annual review process could present an opportunity for EPA to work with states on such assessments. Further, EPA disagreed with our use of the term mapping tools to refer to EPA’s community water system service area boundary dataset and sewersheds dataset, but for ease of presentation we did not change the term.
In its comments, EPA also raised concerns about its mapping tools’ limitations. However, EPA could communicate the identified limitations, and any other considerations about data, in guidance to ensure states use the tools appropriately. EPA could work with states to determine the optimal use of the tools to conduct their own assessments, using data that align with and reflect states’ definitions of vulnerable communities in accordance with program statutes. In providing guidance and technical assistance, EPA could facilitate cross-state learning and information-sharing while also generating new evidence at a national level that can be used to inform EPA’s oversight of the State Revolving Fund programs.
More broadly, EPA stated that the information contained in our report does not align with the issues outlined in the letter we sent on August 18, 2023, notifying EPA of the initiation of our work. We disagree and note that, while the order of presentation is different in our final report, our objectives, scope, and methodology directly address each of the three issues identified in the initiation letter. Specifically, we stated we would evaluate how selected agencies (1) identify water and wastewater utilities that are vulnerable to service disruptions from natural and other disasters; (2) were implementing requirements, such as from Executive Orders 14008 and 13985, related to funding for water and wastewater utilities in disadvantaged or underserved communities, and; (3) worked with state and local governments to provide funding for water and wastewater utilities in disadvantaged or underserved communities.
Finally, EPA stated that we should clarify which policies were in place currently and which were in place under the previous administration. Throughout our report, we document actions taken by EPA, FEMA, and USDA related to Executive Orders, including the two identified in our notification letter, and indicate which of these orders have since been revoked. Our report discusses the statutory requirements that are still in effect and how these relate to our recommendations.
We are sending copies of this report to the appropriate congressional committees, the Administrator of EPA, the Secretary of Homeland Security, and the Secretary of Agriculture. In addition, the report is available at no charge on GAO’s website at https://www.gao.gov.
If you or your staff have any questions about this report, please contact Chris Currie at curriec@gao.gov or J. Alfredo Gómez at gomezj@gao.gov. Contact points for our Offices of Congressional Relations and Public Affairs may be found on the last page of this report. GAO staff who made major contributions to this report are listed in appendix IX.

Chris Currie
Director, Homeland Security and Justice

J. Alfredo Gómez
Director, Natural Resources and Environment
The objectives of our review were to examine (1) the financial assistance that the U.S. Environmental Protection Agency (EPA), Federal Emergency Management Agency (FEMA), and U.S. Department of Agriculture (USDA) provided from fiscal years 2014 through 2023 to improve drinking water and wastewater infrastructure; (2) financial challenges related to infrastructure resilience faced by selected water utilities, including those in vulnerable communities; (3) the extent to which EPA, FEMA, and USDA addressed barriers that may prevent vulnerable communities from accessing and participating in selected programs; and (4) how EPA, FEMA, and USDA assessed the extent to which financial assistance from selected programs reached vulnerable communities.
Financial Assistance to Improve Drinking Water and Wastewater Infrastructure
To examine the financial assistance that EPA, FEMA, and USDA provided to improve drinking water and wastewater infrastructure, we reviewed prior GAO work and publicly available documents, including program authorizing statutes, program descriptions, and Federal Register notices. For example, we reviewed notice of funding opportunity documents, which describe allowable uses of program funding.
We focused our review on programs intended for community water systems (e.g., municipal water systems) and wastewater utilities classified as public wastewater systems because these are the primary types of systems serving communities across the U.S., and they serve the majority of the population. We also limited our scope to programs whose purpose included improving disaster resilience. We excluded programs that primarily benefitted tribal communities and projects awarded to U.S. territories, the District of Columbia, and tribal governments from our review because the programs we reviewed generally have different policies and procedures for these entities. Also, GAO recently reviewed federal assistance to tribal governments, including assistance for water infrastructure.[110] We also did not examine issues related to the cybersecurity of drinking water and wastewater systems because GAO conducted a recent review examining this topic.[111]
Using this process, we identified 19 programs that could provide financial assistance for projects to improve drinking water and wastewater infrastructure during the period of our review. Table 1 contains these programs.
Table 1: EPA, FEMA, and USDA Programs that Could Provide Financial Assistance for Drinking Water and Wastewater Infrastructure Projects, Fiscal Years 2014–2023
|
Agency |
Program |
Drinking water or wastewater |
Justice40 programa |
|
EPA |
Clean Water Infrastructure Resilience and Sustainability Programb |
Wastewater |
No |
|
Clean Water State Revolving Fund |
Wastewater |
Yes |
|
|
Drinking Water State Revolving Fund |
Drinking Water |
Yes |
|
|
Drinking Water System Infrastructure Resilience and Sustainability Programb |
Drinking Water |
Yes |
|
|
Midsize and Large Drinking Water System Infrastructure Resilience and Sustainability Programb |
Drinking Water |
No |
|
|
Sewer Overflow and Stormwater Reuse Municipal Grant Program |
Wastewater |
Yes |
|
|
Small, Underserved, and Disadvantaged Communities Drinking Water Grant Program |
Drinking Water |
Yes |
|
|
U.S.-Mexico Border Water Infrastructure Program |
Both |
Yes |
|
|
Water Infrastructure Finance and Innovation Act Program |
Both |
Yes |
|
|
FEMA |
Building Resilient Infrastructure and Communities |
Both |
Yes |
|
Flood Mitigation Assistance |
Both |
Yes |
|
|
Hazard Mitigation Grant Program |
Both |
No |
|
|
Pre-Disaster Mitigation |
Both |
No |
|
|
Public Assistance |
Both |
No |
|
|
Safeguarding Tomorrow Revolving Loan Fund programb |
Both |
No |
|
|
USDA |
Calendar Year 2022 Disaster Water Grants Program |
Both |
No |
|
Emergency Community Water Assistance Grants |
Drinking Water |
No |
|
|
Revolving Funds for Financing Water and Wastewater Projects |
Both |
No |
|
|
Water and Waste Disposal Loan and Grant Program |
Both |
Yes |
Source: GAO analysis of data from the U.S. Environmental Protection Agency (EPA), Federal Emergency Management Agency (FEMA), and U.S. Department of Agriculture (USDA). | GAO‑25‑107013
aThe Justice40 Initiative was established by Executive Order 14008, Tackling the Climate Crisis at Home and Abroad, which was revoked on January 20, 2025. 86 Fed. Reg. 7619 (Feb. 1, 2021) (revoked by Exec. Order No. 14,148, 90 Fed. Reg. 8237, 8238 (Jan. 28, 2025)). As part of the Justice40 Initiative, agencies were directed to coordinate with the Office of Management and Budget to identify programs that should be covered by the Initiative.
bThese programs had not provided financial assistance for projects related to water infrastructure as of the end of fiscal year 2023.
To identify how much financial assistance EPA, FEMA, and USDA provided for water infrastructure, we reviewed and analyzed budgetary data provided by the agencies and compared it to publicly available data when possible. For the EPA Clean Water State Revolving Fund program and the Drinking Water State Revolving Fund program, we analyzed publicly available data on annual capitalization grants from the agency’s State Revolving Fund Public Portal. For all other EPA programs in our review, we analyzed EPA-provided data that came from internal records maintained by the agency. FEMA-provided data for all of the FEMA programs in our review came from FEMA’s Enterprise Data Warehouse and the FEMA Data Exchange databases. USDA-provided data for all of the USDA programs in our review came from the agency’s Tabular Data Warehouse.
We aggregated these data at the state level to report amounts of loans and loan guarantees provided, and total amounts obligated for each grant program. We adjusted all totals for inflation using 2023 dollar values. To assess the reliability of agencies’ budget data, we (1) performed electronic testing for errors in accuracy and completeness, (2) reviewed related documentation about the data and the system that produced them, (3) interviewed agency officials knowledgeable about the data, and (4) worked closely with agency officials to identify and resolve data discrepancies before conducting our analyses. We determined that the data were sufficiently reliable for the purposes of analyzing financial assistance that EPA, FEMA, and USDA provided to improve drinking water and wastewater infrastructure from fiscal year 2014 through fiscal year 2023.
Because FEMA does not track whether its programs’ awards are specifically related to drinking water or wastewater infrastructure, we identified these projects for our analysis. To do this, we reviewed the project descriptions for all projects that received awards from FEMA’s Building Resilient Infrastructure and Communities program, Flood Mitigation Assistance program, Hazard Mitigation Grant Program, and Pre-Disaster Mitigation program from fiscal year 2014 through fiscal year 2023.[112] Specifically, using a list of FEMA-provided search terms associated with drinking water and wastewater infrastructure, we queried the awards data provided to us by FEMA to identify projects that were potentially related to drinking water and wastewater infrastructure. We then manually reviewed each project description, an open-text field used to describe the project’s purpose, scope of work, and other details. We classified whether each project was related to drinking water and/or wastewater infrastructure. During this process, we removed any false positives, such as records that contained keywords we searched on but did not appear to be related to drinking water and wastewater infrastructure.
For the manual review of this FEMA data, each analyst used the same classification scheme, which we iteratively developed and tested based on our review of documentation describing drinking water and wastewater infrastructure projects that were eligible to receive financial assistance from other programs in our review. Analysts were trained on how to conduct the classification prior to their review and conducted independent pretests to assess coder reliability. A second analyst reviewed each classification decision for accuracy. If there were any discrepancies between the first and second analyst, a third analyst conducted a blind review and made a final classification decision. After this manual review, we calculated the total amount of obligations that FEMA made that were related to either water or wastewater infrastructure based on our analysis. However, because FEMA does not track whether awards are water-related, we cannot definitively conclude that we identified the entire universe of all water-related awards FEMA made during the period of our review.
Of the 19 programs we identified that are authorized to provide financial assistance for water infrastructure,15 made obligations in fiscal years 2014 through 2023. We did not analyze data from one additional program that had obligated funds as of fiscal year 2023—FEMA’s Public Assistance—due to limitations in the program’s data. Specifically, unlike the dataset for the other FEMA programs we reviewed, many of the open-text fields in this program’s dataset allowed for the input of up to one million characters, and most of the language in these fields was unintelligible website source code. As such, these data were not well-suited to performing a manual review. We therefore analyzed data from the 14 programs that made financial assistance available from fiscal year 2014 through fiscal year 2023, the most recent years for which data were available at the time of our review. We chose a 10-year time frame to include years prior to the Justice40 Initiative and to account for variations of natural disasters as well as other factors that may have affected federal financial assistance, such as the COVID-19 pandemic.[113]
Financial Challenges Faced by Water Utilities
To identify financial challenges faced by selected drinking water and wastewater utilities, including those in vulnerable communities, we interviewed representatives from a nongeneralizable sample of 14 drinking water and wastewater utilities in 12 communities.[114] We selected these utilities using a stratified purposeful sampling approach to capture a variety of experiences with natural disasters and the financial assistance programs in our review. For example, we selected communities that had experienced natural disasters in the last 5 years and others that had not. We also selected utilities that had received financial assistance from one or more of the programs in our review, and others that had applied but were not selected to receive assistance.
In addition to these factors, we selected communities to capture other similarities and differences, including a range of population sizes and natural disaster risk as measured by FEMA’s National Risk Index. To ensure geographic diversity, we selected at least one community from each major census region (Northeast, Midwest, South, and West). Because this was a nonprobability sample, the findings related to the 14 utilities cannot be generalized to all drinking water and wastewater utilities but provide illustrative examples of challenges selected utilities and communities faced.
The Extent to Which Selected Programs Addressed Barriers Faced by Vulnerable Communities
To examine the extent to which EPA, FEMA, and USDA addressed barriers that may prevent vulnerable communities from accessing and participating in selected programs, we identified programs that provided financial assistance for drinking water or wastewater infrastructure and that were selected to participate in the Justice40 Initiative under Executive Order 14008 before the order was revoked.[115] We determined that there were 10 such programs. We then reviewed the programs’ authorizing statutes to identify how these programs should be providing assistance to vulnerable communities and any relevant definitions of such communities. We also reviewed documentation of agency plans that were active during the period of our review, including strategic plans, and equity action plans.
We also identified 14 programs that made technical assistance available to water and wastewater utilities to improve infrastructure, including to mitigate, prepare for, and recover from disasters. We identified these programs by reviewing publicly available agency documents, such as annual budget justifications and agency guidance. In addition, we reviewed relevant GAO reports and Congressional Research Service reports to identify these programs. We also interviewed representatives from five national technical assistance provider organizations about barriers faced by vulnerable communities. See appendix V for a list of technical assistance programs.
In addition, we interviewed relevant agency officials and reviewed documentation about actions the agencies took to address barriers faced by vulnerable communities, such as program policies, technical assistance efforts, and interagency agreements. We also asked the utility representatives that we interviewed about any challenges they experienced when applying for and managing awards from the federal assistance programs in our scope. We assessed agencies’ actions against Standards for Internal Control in the Federal Government and determined that, of the five components of internal control, the “information and communication” component was significant to this audit.[116] Within this component, we determined that one principle was relevant to our audit objectives: that management should externally communicate quality information to achieve the entity’s objectives.
We also assessed EPA, FEMA, and USDA actions against selected key practices for effectively managing and assessing the results of federal efforts.[117] These key practices were distilled from hundreds of actions identified in GAO’s past work as effective for implementing federal evidence-building and performance management activities. We reviewed each of the 13 practices and identified one as relevant to this objective—specifically, that agencies generate new evidence to help assess, understand, and identify opportunities to improve the results of their efforts. Such evidence should meet relevant quality standards and be sufficient to address agency goals.
How Selected Programs Assessed the Extent to Which Financial Assistance Reached Vulnerable Communities
To examine how EPA, FEMA, and USDA assessed the extent to which financial assistance from selected programs reached vulnerable communities, we interviewed relevant agency officials and reviewed documents that agencies issued or used during our review period. These documents included methodologies for assessing program results, including interim methodologies, and the results of any analyses that programs conducted. We also reviewed documentation about various indexes that agencies used during the period of our review to conduct their analyses, such as the Social Vulnerability Index and the Climate and Economic Justice Screening Tool.
We assessed agencies’ actions against selected key practices for effectively managing and assessing the results of federal efforts and identified two as relevant to this objective.[118]
1. Generate new evidence to help assess, understand, and identify opportunities to improve the results of federal efforts. Such evidence should be complete and accurate enough to provide insight into the extent to which the agency is meeting its goals.
2. Use evidence to understand program results and assess progress toward the agency’s goals.
We also selected a small number of programs from each agency for a statistical analysis to assess the extent to which vulnerable communities received financial assistance from fiscal year 2014 through fiscal year 2023. For EPA, we selected the Clean Water State Revolving Fund program and the Drinking Water State Revolving Fund program because these programs were Justice40 pilot programs. They were also among the largest federal programs to provide financial assistance for drinking water and wastewater infrastructure during the time frame of our review. For FEMA, we selected the Building Resilient Infrastructure and Communities program because it was a Justice40 pilot program and because it provided financial assistance for infrastructure resilience projects, including for drinking water and wastewater infrastructure.[119] For USDA, we selected the Water and Waste Disposal Loan and Grant Program because it was the only Justice40-covered USDA program that provided financial assistance for drinking water and wastewater infrastructure improvements. It was also one of the largest federal financial assistance programs for water and wastewater infrastructure during the time frame of our review.
To assess the reliability of data used in our statistical analyses, including EPA’s community water system service area boundaries mapping tool and all three agencies’ financial assistance data, we (1) performed electronic testing for errors in accuracy and completeness; (2) reviewed related documentation about the data and the systems that produced them, as applicable; (3) interviewed agency officials knowledgeable about the data; and (4) worked closely with agency officials to identify and resolve data discrepancies before conducting our analyses. We determined that EPA’s service area mapping tool and the EPA State Revolving Fund program data were sufficiently reliable for the purposes of examining statistical associations between amounts of financial assistance provided at the census tract level and socioeconomic characteristics related to social vulnerability. We determined that the FEMA and USDA data were sufficiently reliable for the purpose of describing funding amounts and socioeconomic characteristics at the county level but were not reliable for the purpose of conducting an analysis of census tracts. In addition, there were not enough water-related projects to conduct a reliable statistical regression analysis of FEMA’s Building Resilient Infrastructure and Communities program. For a detailed discussion of our methodology, including data sources, model specifications, and results, see appendix II.
We conducted this performance audit from August 2023 to August 2025 in accordance with generally accepted government auditing standards. Those standards require that we plan and perform the audit to obtain sufficient, appropriate evidence to provide a reasonable basis for our findings and conclusions based on our audit objectives. We believe that the evidence obtained provides a reasonable basis for our findings and conclusions based on our audit objectives.
This appendix describes our methods for analyzing the relationship between the amount of financial assistance communities received from selected water and wastewater infrastructure programs and selected community characteristics from fiscal year 2014 through fiscal year 2023. The U.S. Environmental Protection Agency (EPA), Federal Emergency Management Agency (FEMA), and the U.S. Department of Agriculture (USDA) administered these programs.[120] To conduct this analysis for the EPA programs, we used EPA-provided data on financial assistance to conduct a nationwide geospatial and multivariate regression analysis of the relationship between the amount of financial assistance communities received at the census tract level and community characteristics. For the FEMA and USDA programs, we used agency-provided data to describe county-level characteristics of communities that received financial assistance. The following describes our definitions, data sources, and methodology.
EPA State Revolving Fund Program Analysis
Identifying Communities that Received Financial Assistance
To conduct a regression analysis assessing the relationship between the amounts of financial assistance communities received and community characteristics, we first needed to identify which communities received or most likely benefitted from financial assistance. To do this, we linked assistance amounts to recipient communities’ census tracts. Specifically, we identified census tracts that overlapped with a watershed or community water system associated with a project which had received financial assistance from fiscal year 2014 through fiscal year 2023.[121] Using EPA data on State Revolving Fund program assistance agreements, we calculated the overlapping census tract areas as “weights” that measured the proportion of the total area of a watershed or a community drinking water system for each tract.[122] We then used these calculated areas to allocate assistance amounts into census tracts. The specific data and methods we used for each program are described below.
Drinking Water State Revolving Fund program. For the Drinking Water State Revolving Fund program, we restricted our analysis to projects at drinking water facilities in water systems that had a Public Water System ID.[123] We used the EPA’s community water system service area mapping tool to identify census tracts that fall within the service area boundaries for these facilities.[124] For each project, we aggregated all financial assistance to the associated community water system. Next, we apportioned assistance amounts to each census tract within the community water system by calculating the area of intersection of each tract relative to the total area of that community water system. Finally, we aggregated all of these apportioned funds to the tract level.[125]
Clean Water State Revolving Fund program. For the Clean Water State Revolving Fund program, we identified benefitting communities as those census tracts located within a watershed in which the state provided financial assistance for a project for a municipal wastewater treatment plant. We used this methodology primarily because service area boundaries are not available nationwide for municipal wastewater treatment plants.[126] We analyzed financial assistance for projects at treatment plants that had active National Pollutant Discharge Elimination System permits from fiscal year 2014 through fiscal year 2023.[127] We then aggregated the total assistance agreement amounts at the watershed level. Next, we overlaid the watershed boundaries with census tract boundaries and identified overlapping areas for all watersheds in the U.S.
To calculate the amount of Clean Water State Revolving Fund assistance each census tract received, we proportioned the total amount of assistance associated with each watershed to the census tracts based on their overlapping areas within the watershed. We determined that the data on financial assistance, municipal wastewater treatment plant locations, and watersheds were reliable for the purpose of our analysis.
Multivariate Regression Models and Data Sources
Multivariate regression modeling is a statistical method that examines multiple variables simultaneously to estimate whether each of these variables are significantly (at the 5 percent significance level) associated with a certain outcome, controlling for the other variables. A multivariate regression analyzes the statistical association of each individual variable with the outcome. This type of modeling allowed us to test the association between community characteristics related to vulnerability, such as poverty, and the amount of financial assistance received by communities in comparison to others, while holding other variables constant. To do this, we used the geospatial and obligations data described in the section above to construct regression models and analyze multiple variables, including community characteristics related to vulnerability, described further below. As is the case with all models of this type, the regression results do not imply causal relationships.
For both programs, to measure community characteristics related to vulnerability, we used the Social Vulnerability Index, developed by the U.S. Centers for Disease Control and Prevention and is part of FEMA’s National Risk Index.[128] In addition, we used the following socioeconomic variables from the American Community Survey:[129] (1) percent of families and people whose income in the past 12 months was below the poverty level (“percent poverty”), (2) percent of people who are non-white or Hispanic/Latino, and (3) median household income. We focused on these characteristics based on our review of definitions of disadvantaged communities and hardship communities in the State Revolving Fund programs’ authorizing statutes, as well as other definitions of vulnerability, such as the Social Vulnerability Index. In addition, we assessed the collinearity of vulnerability characteristics to avoid multicollinearity among the socioeconomic variables in our regression models.
In addition to factors related to vulnerability, we also included variables in our models to control for state fixed effects which may explain persistent differences in funding levels between states over time. Specifically, we included variables in our models to control for state-specific characteristics and factors that vary at the state level or geographical area. State fixed effects also remove residual correlation in the outcomes being measured. In addition, we controlled for urbanicity of census tracts by including a measure that considers population density, urbanization, and commuting patterns.[130] We also included the dollar amount of expected annual loss from natural disasters, which were estimated based on historical losses, from FEMA’s National Risk Index. Finally, for both programs, we used robust standard errors and controls for population density that partially account for variation in measurement error across communities.
Finally, for the Clean Water State Revolving Fund program, we included the number of active National Pollutant Discharge Elimination System permits for wastewater treatment plants within watersheds to control for the amount of pollution and subsequent need for financial assistance from the program. Our results are shown in tables 2–5.
Table 2: Characteristics of Communities (Census Tracts) that Received Financial Assistance from EPA’s Drinking Water State Revolving Fund Program Nationwide, Fiscal Years 2014–2023
|
|
Average |
Standard deviation |
Number of census tracts analyzeda |
|
Total financial assistance (in millions of dollars) |
$0.94 |
$2.76 |
34,603 |
|
Percent povertyb |
10.66% |
10.69 |
34,396 |
|
Social Vulnerability Index Score (0–100)c |
51.91 |
28.95 |
34,641 |
|
Percentage of non-white or Hispanic/Latino population |
42.39% |
30.21 |
34,497 |
|
Median household income |
$77,887 |
$38,146 |
34,199 |
|
Expected annual loss |
$858,111 |
$1,325,826 |
34,641 |
|
Rural-Urban Category |
Percentage |
Number of census tracts analyzeda |
|
|
Rural |
8.26% |
2,863 |
|
|
Small town |
8.10% |
2,809 |
|
|
Suburban |
7.91% |
2,742 |
|
|
Urban |
75.57% |
26,199 |
|
|
Missing |
0.16% |
56 |
|
Source: GAO analysis of data from the U.S. Environmental Protection Agency (EPA), U.S. Census Bureau American Community Survey 2018–2022 5-year survey estimates, U.S. Department of Agriculture Economic Research Services Rural-Urban Classifications, and the Federal Emergency Management Agency (FEMA) National Risk Index including the U.S. Centers for Disease Control and Prevention’s Social Vulnerability Index. | GAO‑25‑107013
aThe number of observations vary because not all census tracts have data available from the American Community Survey and FEMA National Risk Index.
bPercent poverty is measured as the percentage of families and people whose income in the past 12 months was below the federal poverty level.
cThe Social Vulnerability Index, developed by the U.S. Centers for Disease Control and Prevention, indicates the relative social vulnerability of U.S. census tracts based on 16 metrics including poverty level, unemployment, age, minority status, and disability. The index is a 0–100 (or 0–1) scale, with higher scores indicating greater vulnerability.
Table 3: Results of Multivariate Regression Analysis of Financial Assistance Provided by EPA’s Drinking Water State Revolving Fund Program Nationwide, Fiscal Years 2014–2023
|
|
Model 1 |
Model 2 |
Model 3 |
|
Characteristics |
|
|
|
|
Percentage of non-white or Hispanic/Latino population |
-0.0548*** (0.0184) |
— |
— |
|
Median household income |
-0.103*** (0.0167) |
— |
— |
|
Percent poverty |
|
0.0326*** (0.0119) |
— |
|
Social Vulnerability Index score (0–100) |
— |
— |
0.120*** (0. 0130) |
|
Expected annual loss |
0.255*** (0.0190) |
0.247*** (0.0186) |
0.252*** (0. 0191) |
|
Rural |
0.625*** (0.0525) |
0.700*** (0.0507) |
0.672*** (0.0506) |
|
Small town |
0.820*** (0.0552) |
0.904*** (0.0525) |
0.857*** (0.0532) |
|
Suburban |
0.339*** (0.0614) |
0.380*** (0.0601) |
0.408*** (0.0599) |
|
Constant |
11.95*** (0.0154) |
11.94*** (0.0148) |
11.94*** (0.0147) |
|
Observations |
34,068 |
34,250 |
34,463 |
|
R-squared |
0.105 |
0.105 |
0.106 |
Source: GAO analysis of data from the U.S. Environmental Protection Agency (EPA), U.S. Census Bureau American Community Survey 2018–2022 5-year survey estimates, U.S. Department of Agriculture Economic Research Services Rural-Urban Classifications, and the Federal Emergency Management Agency National Risk Index including the U.S. Centers for Disease Control and Prevention’s Social Vulnerability Index. | GAO‑25‑107013
Notes: Statistical significance is denoted by the following significance levels. *** p<0.01, ** p<0.05, * p<0.1. Robust standard errors are in parentheses, and state fixed effects are included in all models. Each multivariate regression model estimates the amount of financial assistance, with respect to socioeconomic and other characteristics. Due to high collinearity of the socioeconomic characteristics we examined, we were not able to combine all characteristics into one multivariate model. Median household income, percentage of non-white or Hispanic/Latino population, expected annual losses, percent poverty, and Social Vulnerability Index Score were standardized. Percent poverty is measured as the percentage of families and people whose income in the past 12 months was below the federal poverty level. In addition, median household income, expected annual losses, and total financial assistance were converted in natural logarithmic form.
Table 4: Characteristics of Communities (Census Tracts) that Received Financial Assistance from EPA’s Clean Water State Revolving Fund Program Nationwide, Fiscal Years 2014–2023
|
|
Average |
Standard deviation |
Number of census tracts analyzeda |
|
Total financial assistance (in millions of dollars) |
$1.64 |
$6.49 |
48,138 |
|
Percent povertyb |
9.88% |
10.31 |
47,728 |
|
Social Vulnerability Index Score (0–100)c |
48.72 |
28.57 |
48,138 |
|
Percentage of non-white or Hispanic/Latino population |
38% |
29.47 |
47,895 |
|
Median household income |
$81,141 |
$39,468 |
47,518 |
|
Expected annual loss |
$793,224 |
$1,398,369 |
48,138 |
|
Number of National Pollutant Discharge Elimination System permit in watershed |
6.05 |
6.3 |
48,138 |
|
Rural-Urban Category |
Percentage |
Number of census tracts analyzeda |
|
|
Rural |
8.89% |
4,281 |
|
|
Small town |
8.22% |
3,957 |
|
|
Suburban |
11.14% |
5,364 |
|
|
Urban |
71.74% |
34,536 |
|
Source: GAO analysis of data from the U.S. Environmental Protection Agency (EPA), U.S. Census Bureau American Community Survey 2018–2022 5-year survey estimates, U.S. Department of Agriculture Economic Research Services Rural-Urban Classifications, and the Federal Emergency Management Agency National Risk Index including the U.S. Centers for Disease Control and Prevention’s Social Vulnerability Index. | GAO‑25‑107013
Note: Percentages may not add to 100 percent due to rounding.
aThe number of observations vary because not all census tracts have data available from the American Community Survey and FEMA National Risk Index.
bPercent poverty is measured as the percentage of families and people whose income in the past 12 months was below the federal poverty level.
cThe Social Vulnerability Index, developed by the U.S. Centers for Disease Control and Prevention, indicates the relative social vulnerability of U.S. census tracts based on 16 metrics including poverty level, unemployment, age, minority status, and disability. The index is a 0–100 (or 0–1) scale, with higher scores indicating greater vulnerability.
Table 5: Results of Multivariate Regression Analysis of Financial Assistance Provided by EPA’s Clean Water State Revolving Fund Program Nationwide, Fiscal Years 2014-2023
|
|
Model 1 |
Model 2 |
Model 3 |
|
Characteristics |
|
|
|
|
Percentage of non-white or Hispanic/Latino population |
0.117*** (0.014) |
— |
— |
|
Median household income |
0.313*** (0.012) |
— |
— |
|
Percent poverty |
— |
-0.163*** (0.010) |
— |
|
Social Vulnerability Index score (0–100) |
— |
— |
-0.163*** (0.010) |
|
Expected annual loss |
0.384*** (0.014) |
0.416*** (0.014) |
0.371*** (0.015) |
|
Number of National Pollutant Discharge Elimination System permits in watershed |
0.111*** (0.012) |
0.132*** (0.012) |
0.138*** (0.012) |
|
Rural |
0.086* (0.044) |
-0.109*** (0.042) |
-0.079* (0.042) |
|
Small town |
0.237*** (0.046) |
0.012 (0.044) |
0.102** (0.044) |
|
Suburban |
0.689*** (0.038) |
0.585*** (0.036) |
0.582*** (0.037) |
|
Constant |
12.388*** (0.012) |
12.434*** (0.011) |
12.433*** (0.011) |
|
Observations |
47,518 |
47,728 |
48,138 |
|
R-squared |
0.166 |
0.159 |
0.156 |
Source: GAO analysis of data from the U.S. Environmental Protection Agency (EPA), U.S. Census Bureau American Community Survey 2018–2022 5-year survey estimates, U.S. Department of Agriculture Economic Research Services Rural-Urban Classifications, and the Federal Emergency Management Agency National Risk Index including the U.S. Centers for Disease Control and Prevention’s Social Vulnerability Index. | GAO‑25‑107013
Notes: Statistical significance is denoted by the following significance levels. *** p<0.01, ** p<0.05, * p<0.1. Robust standard errors are in parentheses, and state fixed effects are included in all models. Each multivariate regression model estimates the amount of financial assistance, with respect to socioeconomic and other characteristics. Due to high collinearity of the socioeconomic characteristics we examined, we were not able to combine all characteristics into one multivariate model. Median household income, percentage of non-white or Hispanic/Latino population, expected annual losses, National Pollutant Discharge Elimination System permits, percent poverty, and Social Vulnerability Index Score were standardized. Percent poverty is measured as the percentage of families and people whose income in the past 12 months was below the federal poverty level. In addition, median household income, expected annual losses, and total financial assistance were converted in natural logarithmic form.
Data and Model Limitations
Although the data quality is sufficiently reliable for the purposes of our objective, there are some limitations, often due to inconsistent data, incomplete data, or a lack of data. Some key limitations are described below.
For the Drinking Water State Revolving Fund program, EPA’s community water system service area mapping tool does not include all facilities with a Safe Drinking Water Information System Public Water System Identification number. According to EPA documentation, as of May 2024, out of the universe of community water systems as of 2023 (Quarter 4), 44,415 (93.4 percent) of the 47,538 systems are covered in the dataset, which represents 99.4 percent of the total population served by community water systems. This dataset does not include some small systems or systems located in Puerto Rico or U.S. territories. It also does not include systems that are infrequently used by consumers, since the dataset is limited to active community water systems that serve an average of 25 people for at least 60 days per year.
In addition, EPA’s Drinking Water State Revolving Fund program data did not have Public Water System Identification numbers for all assistance agreements. Therefore, these assistance amounts may not be represented by analyses linked to other data sources, such as the EPA community water system service area boundaries and American Community Survey data. Furthermore, some assistance agreements had Public Water System Identification numbers that were not able to be matched to EPA’s community water system service area boundaries. Out of 8,872 assistance agreements (around $36 billion) from fiscal year 2014 through fiscal year 2023, we were unable to match 345 water systems (around $3.6 billion) to the EPA community water system service area boundaries data. Specifically, we identified 60 assistance agreements classified in the EPA data as “Awaiting Public Water System Identification” and which therefore could not be matched with community water system boundaries and their corresponding census tracts. These 60 assistance agreements could represent 60 or fewer water systems and their projects. Another 285 assistance agreements had Public Water System Identification numbers that were not in EPA’s community water system service area boundary dataset.
For the Clean Water State Revolving Fund program, we were only able to link financial assistance to census tracts when an assistance agreement included a valid National Pollutant Discharge Elimination System permit for a municipal wastewater treatment plant. As a result, we could not include about 20 percent of the Clean Water State Revolving Fund program assistance amounts because assistance agreements either did not report these permits or reported invalid permits. In addition, we were not able to link financial assistance received by around 226 watersheds to census tracts because the watershed codes reported by those wastewater treatment plants could not be matched to other data sources.
We examined correlations of community characteristics, including correlations between (1) the percent of a community in poverty, (2) a community’s median household income, and (3) a community’s Social Vulnerability Index score. We found these characteristics are highly correlated (correlation >0.6). We found a similarly high degree of correlation between a community’s percentage of non-white or Hispanic/Latino population and its Social Vulnerability Index score. These correlations presented a challenge when identifying the separate, independent effects of these individual variables. We report regression model results with just one of these factors per model, and we might expect similar effects using alternate variables.
Other controls were included in the model that may be related to the amount of financial assistance a community received, such as state-specific characteristics. If additional variables exist that are related to the amount of financial assistance communities received but cannot be accounted for in our model, missing variable bias and other misspecification problems may also exist, which is always the case with multivariate regression models. For example, we were not able to control for each state’s financial and technical capacity to manage water resources, which may affect states’ abilities to obtain financial assistance over time. In addition, we were not able to control for regulatory violations in our models because of limitations with EPA’s violations databases. Finally, not all census tracts that received financial assistance have data available for all the socioeconomic variables in our models. As a result, we could not include all census tracts in the regression analysis.
Analysis of Selected FEMA and USDA Programs
To describe the county-level characteristics of financial assistance recipients for FEMA’s Building Resilient Infrastructure and Communities program awards and USDA’s Water and Waste Disposal Loan and Grant Program, we used available geographic data to link funding records to county boundaries.[131]
For FEMA data, we used county-level information to directly obtain census geographic information for fiscal year 2020 through fiscal year 2022.[132] Because FEMA does not track whether its programs’ awards are specifically related to drinking water or wastewater infrastructure, we identified these projects for our analysis. See appendix I for a description of the process we used to identify FEMA projects for our analysis.
For USDA data for fiscal year 2014 through fiscal year 2023, we leveraged available ZIP code information from financial assistance records and used the U.S. Department of Housing and Urban Development’s U.S. Postal Service ZIP-to-county crosswalk (from fiscal year 2014 through fiscal year 2023) to determine county locations.[133] We then reconciled these counties with the 2022 U.S. Census Bureau’s boundaries to ensure consistency in our analysis. To categorize financial assistance, we grouped recipient facilities into three main types: wastewater, drinking water, and combination systems.
For both programs, to compare county-wide estimates at the national level, we used county-level funding assignments and analyzed demographic and socioeconomic characteristics of recipient counties.[134] To measure community characteristics related to vulnerability, we used the Social Vulnerability Index, developed by the U.S. Centers for Disease Control and Prevention and part of FEMA’s National Risk Index, and the following socioeconomic variables from the American Community Survey: (1) percent of families and people whose income in the past 12 months was below the poverty level (“percent poverty”), (2) percentage of people who are non-white or Hispanic/Latino, and (3) median household income.
Because American Community Survey estimates are based on a statistical sample, we describe estimates as statistically different if their 95 percent confidence intervals do not overlap. Although the Social Vulnerability Index is based on components of the American Community Survey 2022 5-year estimates, the U.S. Centers for Disease Control and Prevention did not produce the sampling error. Therefore, the statistical reliability (margins of error) and the statistical significance of the difference in index scores between the recipient counties and all counties is unknown, and we therefore do not make comparisons with the nationwide rate.
To classify data into metropolitan and nonmetropolitan areas, we used geographic identifiers at the county level and matched them with the USDA Economic Research Service’s Rural Urban Continuum Codes.[135] To describe funding for both data, we aggregated dollar amounts at the county level and adjusted all values for inflation, reporting them in fiscal year 2023 dollars.
Based on the county level analyses of FEMA Building Resilient Infrastructure and Communities recipients described in table 6, we found:
· Poverty. Recipient counties have a statistically higher percentage of people in poverty compared to the nationwide rate.
· Non-white or Hispanic/Latino population. Recipient counties have a higher percentage of non-white or Hispanic/Latino populations compared to all counties nationwide.
· Social Vulnerability Index. The index score for recipient counties is 62 and the average index score across all counties nationwide is 50, though we do not know whether these are statistically different.
· Rural-Urban Continuum Codes. Most (28 out of the 33) recipient counties were metropolitan, and the other counties were non-metropolitan with populations of 20,000 or less.
Table 6: Characteristics of Counties that Received Financial Assistance from FEMA’s Building Resilient Infrastructure and Communities Program Compared to All Counties Nationwide, Fiscal Years 2020–2022
|
|
Recipient counties |
All counties nationwidea |
|
Poverty rateb |
14.19% |
12.53% |
|
Average Social Vulnerability Score (0–100)c |
62.38 |
50.00 |
|
Percentage non-white or Hispanic/Latino populationd |
55.67% |
41.09% |
|
Rural-Urban Category |
|
|
|
Metroe |
84.85% |
37.70% |
|
Nonmetro with population of >20,000 |
12.12% |
8.81% |
|
Nonmetro with population of 5,000–20,000 |
- |
19.92% |
|
Nonmetro with population of <5,000 |
3.03% |
33.57% |
|
Financial Assistance Characteristicsf |
|
|
|
Average amount (in millions)g |
$8.95 |
- |
|
Median amount (in millions) |
$1.52 |
- |
|
Per capita amount |
$11.60 |
- |
|
Total amount (in millions) |
$239.77 |
- |
|
Total number of counties |
33 |
3,143 |
Source: GAO analysis of data from the Federal Emergency Management Agency (FEMA). | GAO‑25‑107013
aAll counties excluding the District of Columbia and U.S. territories. Recipient counties are included.
bEstimates are based on the 2018–2022 5-year American Community Survey. All 95 percent confidence intervals have margins of errors that are within +/-0.16 percentages points. The recipient counties estimate is statistically different from the nationwide estimate. Poverty rate is measured as the percentage of families and people whose income in the past 12 months was below the federal poverty level.
cThe Social Vulnerability Index, developed by the U.S. Centers for Disease Control and Prevention, indicates the relative social vulnerability of U.S. census tracts based on 16 metrics including poverty level, unemployment, age, minority status, and disability. The index is a 0-1 scale, with higher scores indicating greater vulnerability. Although this index is based on components of the American Community Survey 2020 5-year estimates, the U.S. Centers for Disease Control and Prevention did not produce the sampling error. Therefore, the statistical reliability (margins of error) and statistical significance of the difference in index scores between the recipient counties and all counties is unknown.
dEstimates are based on the 2018–2022 5-year American Community Survey. All 95 percent confidence intervals have margins of errors that are within +/-0.04 percentage points. The recipient counties estimate is statistically different from the nationwide estimate.
eMetropolitan (metro) counties are defined based on the U.S. Department of Agriculture Economic Research Service Rural-Urban Continuum Codes. Specifically, counties classified under codes 1, 2, and 3 are considered metro areas: counties in metro areas of 1 million or more people, counties in metro areas of 250,000 to 1 million people, or counties in metro areas of less than 250,000 people. Nonmetropolitan (nonmetro) counties fall under codes 4 through 9, which are further differentiated by their urban population size and proximity to metro areas.
fAll values have been adjusted for inflation and are reported in fiscal year 2023 dollars.
gAll reported averages are weighted by population.
Based on the county-level analyses of USDA recipients described in table 7, we found:
· Poverty. Counties that received either drinking water loans, drinking water grants, or wastewater grants had statistically higher percentages of people in poverty when compared to all counties nationwide. The wastewater loan recipient counties’ poverty rate was not statistically different from the nationwide poverty rate. Counties that received a combination of drinking water and wastewater assistance, whether as loans or grants, had statistically lower percentages of people in poverty compared to the nationwide rate.
· Non-white or Hispanic/Latino population. When compared to all counties nationwide, counties that received USDA assistance had lower percentages of non-white or Hispanic/Latino populations, regardless of whether it was a drinking, wastewater, or combination loan or grant.
· Social Vulnerability Index. The average index score for USDA recipient counties ranged from 42 to 49, and the nationwide average index score is 50, though we do not know whether the recipient county average scores are statistically different from the nationwide average.
· Rural-Urban Continuum Codes. The distribution across the different rural-urban categories for each set of recipient counties generally was similar to the distribution for all U.S. counties. When compared to their respective percentages nationwide, counties that received combination drinking water and wastewater grants had a smaller percentage of metropolitan areas (38 percent versus 27 percent) and a higher percentage of non-metropolitan areas with a population of fewer than 5,000 people (34 percent versus 42 percent).[136]
Table 7: Characteristics of Counties that Received Financial Assistance from USDA’s Water and Waste Disposal Loan and Grant Program Compared to All Counties Nationwide, Fiscal Years 2014–2023
|
|
Recipient counties |
All counties nationwidea |
|||||||||||
|
|
Drinking water loans |
Drinking water grants |
Wastewater loans |
Wastewater grants |
Combination Loans |
Combination Grants |
|||||||
|
Poverty rateb |
12.79% |
13.06% |
12.68% |
13.30% |
11.01% |
10.11% |
12.53% |
||||||
|
Average Social Vulnerability Score (0-100)c |
49.37 |
49.90 |
45.05 |
45.66 |
47.26 |
42.48 |
50.00 |
||||||
|
Percentage non-white or Hispanic/Latino populationd |
37.58% |
35.27% |
30.28% |
28.50% |
26.40% |
24.10% |
41.09% |
||||||
|
Rural-Urban Category |
|
|
|
|
|
|
|||||||
|
Metroe |
34.81% |
30.67% |
36.00% |
34.38% |
30.60% |
27.45% |
37.70% |
||||||
|
Nonmetro with population of >20,000 |
10.24% |
10.11% |
11.16% |
11.67% |
8.96% |
10.78% |
8.81% |
||||||
|
Nonmetro with population of 5,000–20,000 |
22.35% |
23.67% |
23.74% |
24.22% |
20.15% |
19.61% |
19.92% |
||||||
|
Nonmetro with population of <5,000 |
32.59% |
35.56% |
29.10% |
29.74% |
40.30% |
42.16% |
33.57% |
||||||
|
Financial Assistance Characteristicsf |
|
|
|
|
|
|
|||||||
|
Average amount (in millions)g |
$6.61 |
$2.52 |
$8.23 |
$3.95 |
$3.78 |
$1.64 |
- |
||||||
|
Median amount (in millions) |
$2.63 |
$1.30 |
$2.98 |
$1.77 |
$2.66 |
$1.29 |
- |
||||||
|
Per capita amount |
$54.91 |
$28.82 |
$81.64 |
$47.14 |
$57.30 |
$30.72 |
- |
||||||
|
Total amount (in millions) |
$6,010 |
$2,026 |
$5,628 |
$2,543 |
$545 |
$219 |
- |
||||||
|
Total number of counties |
1,172 |
900 |
914 |
797 |
134 |
102 |
3,143 |
||||||
Source: GAO analysis of U.S. Department of Agriculture (USDA) data. | GAO‑25‑107013
Note: Percentages may not add to 100 percent due to rounding.
aAll counties excluding District of Columbia and U.S. territories. Recipient counties are included.
bEstimates are based on the 2018–2022 5-year American Community Survey. All 95 percent confidence intervals have margins of errors that are within +/-0.18 percentages points. All estimates for grants and loans are statistically different from the nationwide rate at the 5 percent significance level, except for wastewater loans. Poverty rate is measured as the percentage of families and people whose income in the past 12 months was below the federal poverty level.
cThe Social Vulnerability Index, developed by the U.S. Centers for Disease Control and Prevention, indicates the relative social vulnerability of U.S. census tracts based on 16 metrics including poverty level, unemployment, age, minority status, and disability. The index is a 0–1 scale, with higher scores indicating greater vulnerability. Although this index is based on components of the American Community Survey 2020 5-year estimates, the U.S. Centers for Disease Control and Prevention did not produce the sampling error. Therefore, the statistical reliability (margins of error) and the statistical significance of the difference in index scores between the recipient counties and all counties is unknown.
dEstimates are based on the 2018–2022 5-year American Community Survey. All 95 percent confidence intervals have margins of errors that are within +/-0.06 percentages points. All estimates for grants and loans are statistically different from the nationwide estimate at the 5 percent significance level.
eMetropolitan (metro) counties are defined based on the U.S. Department of Agriculture Economic Research Service Rural-Urban Continuum Codes. Specifically, counties classified under codes 1, 2, and 3 are considered metro areas: counties in metro areas of 1 million or more population, counties in metro areas of 250,000 to 1 million people, or counties in metro areas of fewer than 250,000 people. Nonmetropolitan (nonmetro) counties fall under codes 4 through 9, which are further differentiated by their urban population size and proximity to metro areas.
fAll values have been adjusted for inflation and are reported in fiscal year 2023 dollars.
gAll reported averages are weighted by population.
Appendix III: Selected EPA, FEMA, and USDA Programs That Can Provide Financial Assistance for Water Infrastructure
Table 8: Selected EPA, FEMA, and USDA Financial Assistance Programs for Drinking Water and Wastewater Infrastructure
|
Agency |
Program name |
Program Description |
|
EPA |
Clean Water Infrastructure Resilience and Sustainability |
May provide grants to municipalities or intermunicipal, interstate, or state agencies for planning, designing, or constructing eligible projects that increase the resilience of publicly owned treatment works to natural hazards or cybersecurity vulnerabilities. Projects must increase resilience by conserving water, enhancing water use efficiency, modifying or relocating publicly owned treatment works at risk of being damaged by a natural disaster, or by meeting other requirements specified in statute. |
|
EPA |
Clean Water State Revolving Fund |
Provides capitalization grants to states and Puerto Rico to establish clean water revolving loan funds. The funds may then be provided as low-interest loans—among other types of assistance—to eligible recipients for wastewater infrastructure projects. Repayments of loan principal and interest earnings may be recycled back into state revolving loan fund to finance new projects. Eligible projects include constructing municipal wastewater facilities, controlling nonpoint sources of pollution, building decentralized wastewater treatment systems, and creating green infrastructure projects. |
|
EPA |
Drinking Water State Revolving Fund |
Provides capitalization grants to states and Puerto Rico to establish drinking water revolving loan funds. The funds may then be provided as low-interest loans—among other types of assistance—to eligible recipients for drinking water infrastructure projects. Repayments of loan principal and interest earnings may be recycled back into state revolving loan fund to finance new projects. Eligible projects include constructing or replacing water storage tanks, improving drinking water treatment, and improving water distribution by fixing leaky or old pipes. |
|
EPA |
Drinking Water System Infrastructure Resilience and Sustainability |
Provides grants to public water systems serving communities that are underserved and either small or disadvantaged to improve public drinking water facilities’ resilience to natural hazards. Examples of eligible projects include those that conserve water, enhance water use efficiency, modifying or relocating existing drinking water infrastructure that has been significantly impaired by natural hazards, and designing or constructing desalinization facilities. |
|
EPA |
Midsize and Large Drinking Water System Infrastructure Resilience and Sustainability Program |
Provides grants to public water systems that serve a population of 10,000 people or more to assist in the planning, design, construction, implementation, operation, or maintenance of an eligible project that increases resilience to natural hazards, extreme weather events, and cybersecurity threats. |
|
EPA |
Sewer Overflow and Stormwater Reuse Municipal Grants Program |
Provides grants to states, who then award competitive grants to municipalities to plan, design, and construct infrastructure to control, treat, or reuse municipal combined sewer overflows, sanitary sewer overflows, and stormwater. Twenty-five percent of grants are to be available for projects located in rural communities (population of 10,000 or less) and/or in financially distressed communities. |
|
EPA |
Small, Underserved, and Disadvantaged Communities Grant Program |
Provides grants to public water systems serving communities that are underserved and either small or disadvantaged to help them meet and comply with Safe Drinking Water Act requirements. Provides assistance to communities with no household drinking water or wastewater services or that are served by a public water system that violates or exceeds National Primary Drinking Water Regulations. |
|
EPA |
U.S.-Mexico Border Water Infrastructure Program |
Provides grants to help fund the planning, design, and construction of high-priority water and wastewater infrastructure projects within 100 kilometers of U.S.-Mexico border. Provides hands-on assistance and technical oversight for pre-construction activities such as planning, engineering, environmental reviews, and design. |
|
EPA |
Water Infrastructure Finance and Innovation Act |
Provides loans and loan guarantees to help fund eligible drinking water, wastewater, and stormwater infrastructure projects. Examples of eligible projects include those that are eligible for EPA’s Clean Water and Drinking Water State Revolving Fund programs; enhanced energy efficiency projects at drinking water and wastewater facilities; and drought prevention, reduction, or mitigation projects. |
|
FEMA |
Building Resilient Infrastructure and Communities |
Provided grants to help mitigate future risks from natural disasters, including wildfires, drought, hurricanes, earthquakes, extreme heat, and flooding. Eligible projects and activities included capability- and capacity-building activities and hazard mitigation projects (including those that increase the resilience of infrastructure). |
|
FEMA |
Flood Mitigation Assistance |
Provides grants to help reduce or eliminate the risk of repetitive flood damage to buildings and structures insured under the National Flood Insurance Program. Eligible projects and activities include capability- and capacity-building activities stormwater management projects, flood diversion and storage measures, and flood protection measures for water or sanitary sewer systems. |
|
FEMA |
Hazard Mitigation Grant Program |
Provides grants to help recipients plan for and implement mitigation measures that reduce the risk of loss of life and property from future natural disasters during the reconstruction process following a declared disaster. |
|
FEMA |
Pre-Disaster Mitigation |
Provides grants to help recipients plan for and implement measures designed to reduce the risk to individuals and property from future natural hazards. Eligible projects include hazard mitigation planning and hazard mitigation projects. Starting in fiscal year 2022, it has awarded grants to recipients enumerated in the joint explanatory statements accompanying the relevant appropriations acts. |
|
FEMA |
Public Assistance |
Provides grants to assist with short-term response and long-term recovery following a declared disaster. Eligible activities may include debris removal; emergency protective measures (e.g., search-and-rescue), and repair of roads, bridges, water control facilities, and utilities. |
|
FEMA |
Safeguarding Tomorrow Revolving Loan Fund |
Provides capitalization grants to fund revolving loan funds managed by states, eligible Tribes, territories, and the District of Columbia. Loan funds may be used to finance projects to reduce mitigate future risks from natural hazards and disasters, such as drought, extreme heat, severe storms, wildfires, floods, and earthquakes. |
|
USDA |
Calendar Year 2022 Disaster Water Grants Program |
Provides grants to help eligible communities, organizations, and federally recognized Tribes pay expenses related to damage to rural water systems resulting from presidentially declared disasters that occurred between January 1, 2022, and December 31, 2022. Eligible infrastructure includes drinking water, wastewater, stormwater drainage, and solid waste facilities. |
|
USDA |
Emergency Community Water Assistance Grants |
Provides grants to help local governments, federally recognized Tribes, and other entities in eligible areas prepare for or recover from an emergency that threatens the availability of safe, reliable drinking water. Eligible areas are rural areas and towns with populations of 10,000 or less, Tribal lands in rural areas, and colonias. The eligible area must also have a median household income that is less than the state’s median household income for non-metropolitan areas. |
|
USDA |
Revolving Funds for Financing Water and Wastewater Projects |
Provides grants to help qualified private and nonprofit entities create revolving loan funds that can provide financing to extend and improve water and waste disposal systems in rural areas. Loan funds may be used for pre-development costs of water and wastewater projects and for small capital improvement projects that are not part of regular operations and maintenance. |
|
USDA |
Water and Waste Disposal Loan and Grant Program |
Provides grants, loans, and loan guarantees to state and local governmental entities, private nonprofits, and federally recognized Tribes to help fund clean and reliable drinking water systems, sanitary sewage disposal, sanitary solid waste disposal, and stormwater drainage to households and businesses in eligible rural areas. |
Source: Legal requirements and documentation from the U.S.
Environmental Protection Agency (EPA), Federal Emergency Management Agency
(FEMA), and U.S. Department of Agriculture
(USDA). | GAO‑25‑107013
Note: This table does not include programs that provide financial assistance for projects focused on water quality improvement activities, such as lead removal, emerging contaminants, or watershed quality. In April 2025, FEMA announced that it was ending the Building Resilient Infrastructure and Communities program.
Appendix IV: Maps of Selected EPA, FEMA, and USDA Grants and Direct Loans for Water Infrastructure Projects
Figure 10: Per Capita Distribution of EPA Grant Obligations for Water Infrastructure Projects, Fiscal Years 2014–2023
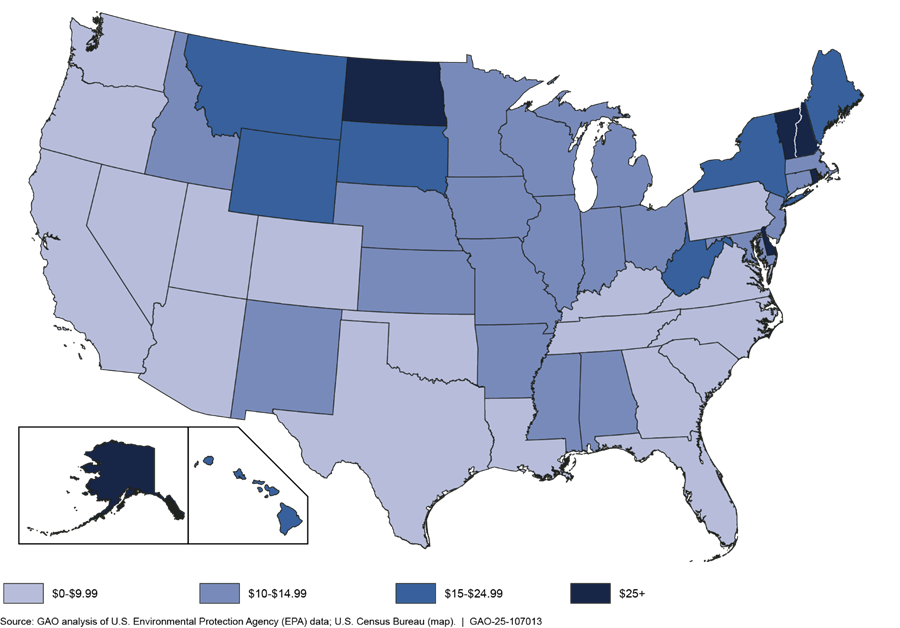
Note: This graphic depicts financial assistance from EPA’s Clean Water State Revolving Fund program; Drinking Water State Revolving Fund program; Sewer Overflow and Stormwater Reuse Municipal Grants Program; Small, Underserved, and Disadvantaged Communities Grant Program; and U.S.-Mexico Border Water Infrastructure Program. This figure does not include programs that provided financial assistance for projects focused on water quality improvement activities, such as lead removal, emerging contaminants, or watershed quality. The financial assistance depicted in this graphic was adjusted to 2023 dollars.
Figure 11: Per Capita Distribution of EPA Direct Loans for Water Infrastructure Projects, Fiscal Years 2014–2023
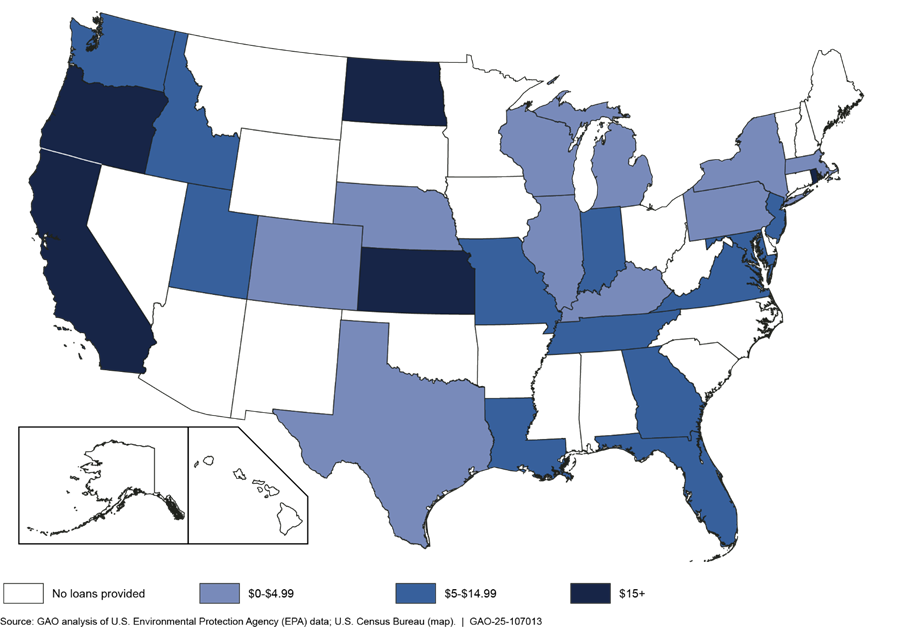
Note: This graphic depicts financial assistance from EPA’s Water Infrastructure Finance and Innovation Act program. This figure does not include programs that provided financial assistance for projects focused on water quality improvement activities, such as lead removal, emerging contaminants, or watershed quality. The financial assistance depicted in this graphic was adjusted to 2023 dollars.
Figure 12: Per Capita Distribution of FEMA Grant Obligations for Water Infrastructure Projects, Fiscal Years 2014–2023
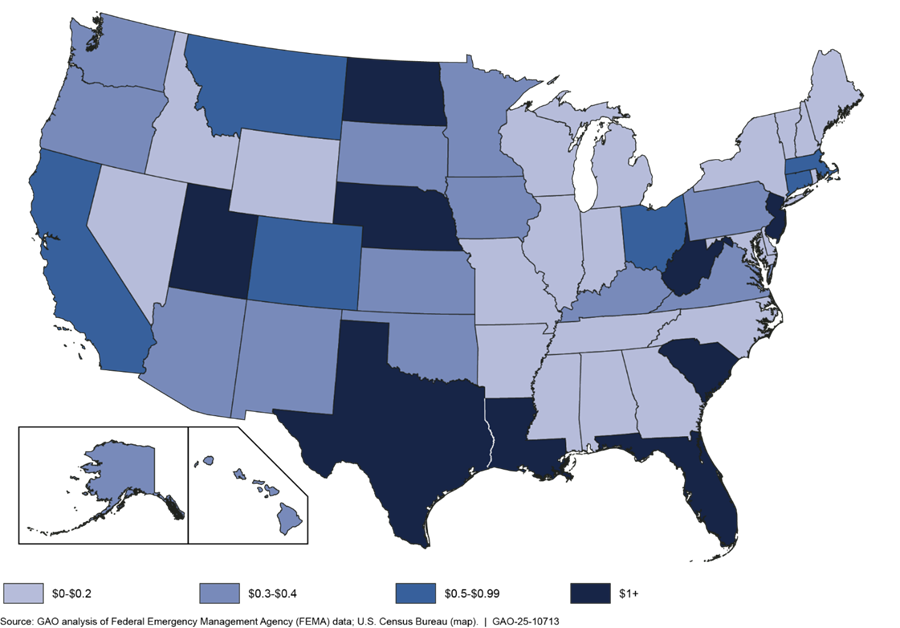
Note: This graphic depicts financial assistance from FEMA’s Building Resilient Infrastructure and Communities, Flood Mitigation Assistance, and Pre-Disaster Mitigation grant programs, as well as the agency’s Hazard Mitigation Grant Program. This figure does not include programs that provided financial assistance for projects focused on water quality improvement activities, such as lead removal, emerging contaminants, or watershed quality. The financial assistance depicted in this graphic was adjusted to 2023 dollars.
Figure 13: Per Capita Distribution of USDA Grant Obligations for Water Infrastructure Projects, Fiscal Years 2014–2023
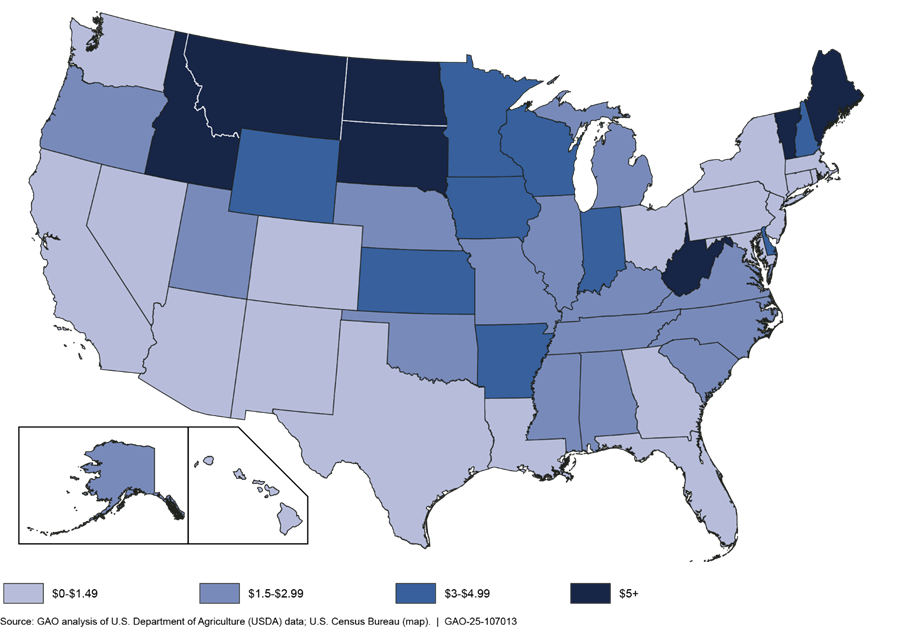
Note: This graphic depicts financial assistance from USDA’s Calendar Year 2022 Disaster Water Grants Program, Emergency Community Water Assistance Grants program, Revolving Funds for Financing Water and Wastewater Projects revolving fund program, and Water and Waste Disposal Loan and Grant Program. This figure does not include programs that provided financial assistance for projects focused on water quality improvement activities, such as lead removal, emerging contaminants, or watershed quality. The financial assistance depicted in this graphic was adjusted to 2023 dollars.
Figure 14: Per Capita Distribution of USDA Direct Loans for Water Infrastructure Projects, Fiscal Years 2014–2023
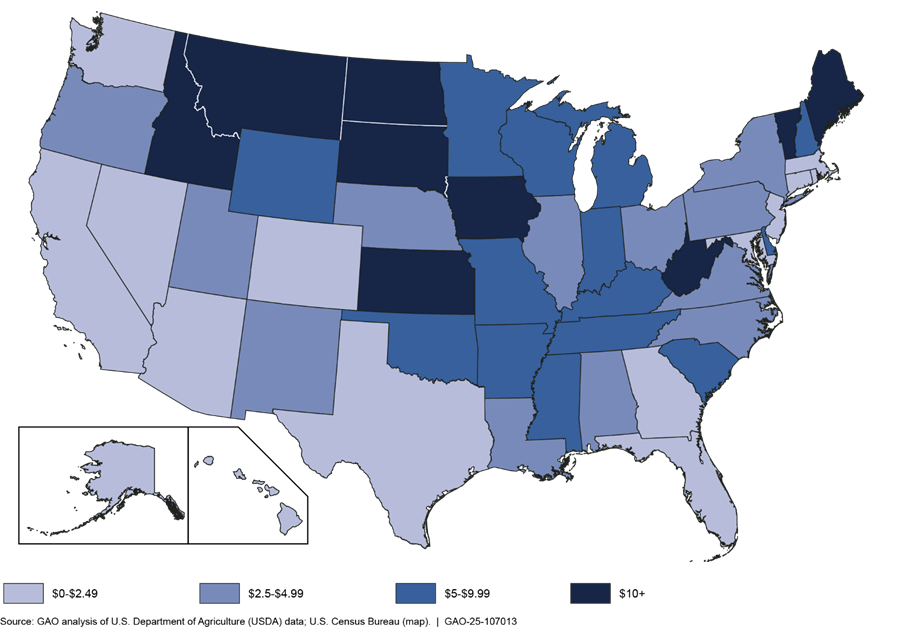
Note: This graphic depicts financial assistance from USDA’s Water and Waste Disposal Loan and Grant Program. This figure does not include programs that provided financial assistance for projects focused on water quality improvement activities, such as lead removal, emerging contaminants, or watershed quality. The financial assistance depicted in this graphic was adjusted to 2023 dollars.
Appendix V: EPA, FEMA, and USDA Initiatives and Programs That Provide Technical Assistance for Water Infrastructure
As shown in table 9, EPA, FEMA, and USDA administer a variety of technical assistance programs that help drinking water and wastewater utilities, including those in vulnerable communities. Technical assistance refers to programs, activities, and services provided by federal agencies to strengthen the capacity of grant applicants and recipients and to improve recipients’ performance of grant functions.
Table 9: Selected EPA, FEMA, and USDA Technical Assistance Initiatives and Programs for Drinking Water and Wastewater Infrastructure
|
Agency |
Program name |
Program Description |
|
EPA |
Area-Wide Optimization Program |
Provides eligible states and technical assistance providers with tools and approaches to help drinking water systems adopt water quality goals and provide an increased and sustainable level of public health protection to their consumers. These goals are meant to enhance existing water treatment and operations—which may include identifying needed infrastructure improvements—to help improve drinking water operations and regulatory compliance. |
|
EPA |
Closing America’s Wastewater Access Gap |
Provides assistance to communities with inadequate, non-existent, or failing wastewater infrastructure, including help in identifying and applying for federal financial assistance such as the Clean Water State Revolving Fund. |
|
EPA |
Drinking Water Capacity Development |
Provides tools and resources to help water systems build their technical—including infrastructure adequacy—managerial, and financial capacity; conducts oversight of state Capacity Development and Operator Certification programs; and promotes asset management and water system partnerships. |
|
EPA |
Environmental Finance Centers |
Supports communities to address water infrastructure challenges as well as help developing financial assistance applications and addressing other capacity needs. EPA selected 29 Environmental Finance Centers to provide targeted assistance to local governments, states, Tribes, territories, and non-governmental organizations. |
|
EPA |
Rural, Small, and Tribal Technical Assistance for Wastewater Systems |
Offers competitive grants to eligible nonprofit organizations to (1) help rural, small municipalities, and tribal governments access financial assistance for infrastructure improvements, and (2) help rural, small, and tribal centralized and decentralized wastewater systems build capacity to protect water quality and comply with the Clean Water Act. |
|
EPA |
Training and Technical Assistance for Small Systems |
Offers competitive grants to eligible nonprofit organizations, nonprofit private universities and colleges, and public higher education institutions to provide training and technical assistance to help small public water systems in operating and maintaining their systems to achieve and maintain compliance with the Safe Drinking Water Act. This assistance also includes improving water quality for small, publicly owned wastewater systems and onsite/decentralized wastewater systems; and supporting private drinking water well-owners to improve water quality. Aside from providing training and technical assistance, the program also works to improve financial and managerial capacity for the assistance recipients described above. |
|
EPA |
Water Infrastructure and Resiliency Finance Center |
Provides financing information (e.g., a clearinghouse of financial assistance opportunities, State Revolving Fund 101 and other learning modules, and webinars) to help utilities make decisions for drinking water, wastewater, and stormwater infrastructure. |
|
EPA |
Water Resilience |
Conducts trainings and exercises—both direct and classroom/webinar based—related to the disaster resilience of water and wastewater utilities against natural disasters. |
|
EPA |
Water Technical Assistance Engineering Support |
Facilitates community access to State Revolving Fund program resources with a focus on developing engineering materials for all communities, including disadvantaged and underserved communities, communities that have never accessed State Revolving Funds before, and communities that are not currently receiving an equivalent kind of technical assistance. |
|
FEMA |
Building Resilient Infrastructure and Communities Direct Technical Assistance |
Provided non-financial support to communities, territories, and tribal governments that may not have the resources to begin climate resilience planning and project design on their own. This could include providing support ranging from pre-application activities to grant closeout. |
|
USDA |
Calendar Year 2022 Disaster Circuit Rider Technical Assistance Grants Program |
Provides grants to qualified organizations and Tribes to assist eligible communities with water infrastructure systems damaged by Calendar Year 2022 presidentially declared disasters. Provides on-site help with activities such as identifying and evaluating solutions to impacted water, wastewater, stormwater and solid waste challenges and helping communities develop and prepare applications for related loans and grants. |
|
USDA |
Circuit Rider |
Assists rural water systems that are experiencing day-to-day operational, financial, or managerial issues including help with operation and maintenance issues, disaster assistance, and developing loan applications. |
|
USDA |
Special Evaluation Assistance for Rural Communities and Households Grants Program |
Provides grants to eligible state and local governments, Tribes, and nonprofit organizations to assist small, financially distressed rural communities cover the costs of developing applications for financial assistance. For example, funds may be used for predevelopment feasibility studies, design and engineering analysis, and technical assistance to develop applications for proposed water and waste disposal projects. |
|
USDA |
Water & Waste Disposal Technical Assistance & Training Grants |
Provides grants to qualified private nonprofit organizations to provide technical assistance and training to identify and evaluate solutions to water and waste problems in eligible rural areas and towns. These grants are to help applicants prepare applications for water and waste disposal loans and grants and to help associations improve the operation and maintenance of water and waste facilities in eligible rural areas. |
Source: GAO analysis of U.S. Environmental Protection Agency (EPA), Federal Emergency Management Agency (FEMA), and U.S. Department of Agriculture (USDA) documents. | GAO‑25‑107013
Note: This table does not include programs that provide financial assistance for projects focused on water quality improvement activities, such as lead removal, emerging contaminants, or watershed quality. In April 2025, FEMA announced that it was ending the Building Resilient Infrastructure and Communities program.
GAO Contacts
Christopher Currie, curriec@gao.gov
J. Alfredo Gómez, gomezj@gao.gov
Staff Acknowledgments
In addition to the contacts named above, Susan Iott (Assistant Director), Caryn Kuebler (Assistant Director), Liz Poulsen (Analyst-in-Charge), Kelsey Burdick (Analyst-in-Charge), Xiang Bi, Breanne Cave, Ben Crossley, Caitlin Cusati, Susan Czachor, Mae Jones, Tracey King, Ying Long, Joseph Oudin, Drew Parent, Linda Tsang, Sonya Vartivarian, Erin Villareal, and Rebecca Yurman made significant contributions to this report.
The Government Accountability Office, the audit, evaluation, and investigative arm of Congress, exists to support Congress in meeting its constitutional responsibilities and to help improve the performance and accountability of the federal government for the American people. GAO examines the use of public funds; evaluates federal programs and policies; and provides analyses, recommendations, and other assistance to help Congress make informed oversight, policy, and funding decisions. GAO’s commitment to good government is reflected in its core values of accountability, integrity, and reliability.
Obtaining Copies of GAO Reports and Testimony
The fastest and easiest way to obtain copies of GAO documents at no cost is through our website. Each weekday afternoon, GAO posts on its website newly released reports, testimony, and correspondence. You can also subscribe to GAO’s email updates to receive notification of newly posted products.
Order by Phone
The price of each GAO publication reflects GAO’s actual cost of production and distribution and depends on the number of pages in the publication and whether the publication is printed in color or black and white. Pricing and ordering information is posted on GAO’s website, https://www.gao.gov/ordering.htm.
Place orders by calling (202) 512-6000, toll free (866) 801-7077,
or
TDD (202) 512-2537.
Orders may be paid for using American Express, Discover Card, MasterCard, Visa, check, or money order. Call for additional information.
Connect with GAO
Connect with GAO on X,
LinkedIn, Instagram, and YouTube.
Subscribe to our Email Updates. Listen to our Podcasts.
Visit GAO on the web at https://www.gao.gov.
To Report Fraud, Waste, and Abuse in Federal Programs
Contact FraudNet:
Website: https://www.gao.gov/about/what-gao-does/fraudnet
Automated answering system: (800) 424-5454
Media Relations
Sarah Kaczmarek, Managing Director, Media@gao.gov
Congressional Relations
A. Nicole Clowers, Managing Director, CongRel@gao.gov
General Inquiries
[1]The U.S. Environmental Protection Agency (EPA) Office of Inspector General has reported on the underlying causes of this and other drinking water outages in Jackson, MS. See EPA Office of Inspector General, Lack of State Financial Support and Local Capacity Prolonged Jackson, Mississippi Drinking Water Issues, 24-P-0038 (Washington, D.C.: May 13, 2024) and State Program Deficiencies and Inadequate EPA Oversight of State Enforcement Contributed to the Drinking Water Crisis in Jackson, Mississippi, 24-E-0055 (Washington, D.C.: Aug. 12, 2024).
[2]M. Kim et al., “Boil water alerts and their impact on the unexcused absence rate in public schools in Jackson, Mississippi,” Nature Water, Vol. 1 (2023): https://doi.org/10.1038/s44221-023-00062-z. Some boil water alerts discussed in this study were localized, so there may have been multiple active alerts within the city at the same time.
[3]GAO, Disaster Resilience Framework: Principles for Analyzing Federal Efforts to Facilitate and Promote Resilience to Natural Disasters, GAO‑20‑100SP (Washington, D.C.: Oct. 2019).
[4]FEMA, National Advisory Council Report to the FEMA Administrator (Washington, D.C.: Nov. 30, 2020).
[5]FEMA, 2020 National Preparedness Report (Washington, D.C.: Dec. 22, 2020). This report stated that historically disadvantaged groups include minorities and the lesbian, gay, bisexual, transgender and queer community.
[6]National Oceanic and Atmospheric Administration–National Centers for Environmental Information, U.S. Billion-Dollar Weather and Climate Disasters (2024), https://www.ncei.noaa.gov/access/billions/.
[7]We focused our review on programs intended for community water systems and public wastewater systems because these are the primary types of systems serving communities across the U.S. We excluded programs that primarily benefitted tribal communities and projects awarded to U.S. territories, the District of Columbia, and tribal governments because federal programs have different policies and procedures for these entities. Also, GAO had recently reviewed federal assistance to tribal governments, including assistance for water infrastructure. See GAO, Justice40: Additional Efforts Needed to Improve Tribal Applicants’ Access to Federal Programs Under Environmental Justice Initiative, GAO‑24‑106511 (Washington, D.C.: Apr. 10, 2024).
[8]As described in more detail below, four programs had not made any obligations as of fiscal year 2023.
[9]The Justice40 Initiative was established by Executive Order 14008, Tackling the Climate Crisis at Home and Abroad, which was revoked on January 20, 2025. 86 Fed. Reg. 7619 (Feb. 1, 2021) (revoked by Exec. Order No. 14,148, 90 Fed. Reg. 8237, 8238 (Jan. 28, 2025)). The order revoking Executive Order 14008 also directs the Domestic Policy Council and the National Economic Council to review all federal actions taken pursuant to revoked orders, memoranda, and proclamations and take necessary steps to rescind, replace, or amend such actions as appropriate. 90 Fed. Reg. at 8241.
[10]The revoked Executive Order 14008 that established the Justice40 Initiative described “disadvantaged communities” as those “that have been historically marginalized and overburdened by pollution and underinvestment in housing, transportation, water and wastewater infrastructure, and health care.” Exec. Order No. 14,008, § 219, 86 Fed. Reg. at 7629.
[11]The utilities were in Cambridge, MD; DePue, IL; East New Market, MD; Flowood, MS; Fort Myers, FL; Hazard, KY; Jackson, MS; Los Angeles, CA; Pittsburgh, PA; St. Louis, MO; Secretary, MD; and Truth or Consequences, NM.
[12]GAO, Standards for Internal Control in the Federal Government, GAO‑14‑704G (Washington, D.C.: Sept. 2014).
[13]GAO, Evidence-Based Policymaking: Practices to Help Manage and Assess the Results of Federal Efforts, GAO‑23‑105460 (Washington, D.C.: July 2023).
[15]We selected EPA’s Clean Water State Revolving Fund and Drinking Water State Revolving Fund programs for this analysis because they were included in the Justice40 pilot programs and they are among the largest federal programs to provide financial assistance for drinking water and wastewater infrastructure during the time frame of our review.
[16]For FEMA, we selected the Building Resilient Infrastructure and Communities program because it was a Justice40 pilot program and because it provided financial assistance for water infrastructure projects. In April 2025, FEMA announced that it was ending the program. For USDA, we selected the Water and Waste Disposal Loan and Grant Program because it was the only Justice40-covered USDA program that provided financial assistance for water infrastructure.
[17]EPA defines a community water system as a public drinking water system that serves at least 25 year-round residents or that has at least 15 service connections used by year-round residents. 40 C.F.R. § 141.2.
[18]Water Research Foundation, Water/Wastewater Utilities and Extreme Climate and Weather Events: Case Studies on Community Response, Lessons Learned, Adaptation, and Planning Needs for the Future (Alexandria, VA: 2014).
[19]EPA provides capitalization grants to all 50 states and Puerto Rico for their state revolving fund programs. See 42 U.S.C. § 300f(13)(B); 40 C.F.R. § 35.3505. EPA also provides direct grant funding for the District of Columbia, U.S. Virgin Islands, American Samoa, Guam, and the Commonwealth of the Northern Mariana Islands. In this report, we use “states” in relation to the revolving fund programs to refer to the 50 states and Puerto Rico.
[20]In April 2025, FEMA announced that it was ending the Building Resilient Infrastructure and Communities program. As of August 2025, GAO has ongoing work on the Building Resilient Infrastructure and Communities program and the impact of FEMA’s discontinuation of the program, as well as the application of the Impoundment Control Act of 1974, 2 U.S.C. §§ 681–688.
[21]42 U.S.C. § 300j-12(d). The Safe Drinking Water Act, as amended, defines a “disadvantaged community” as the service area of a public water system that meets the affordability criteria established by the state. 42 U.S.C. § 300j-12(d)(3). Communities that are vulnerable to natural disasters may or may not align with states’ affordability criteria. Additional subsidies for eligible communities include principal forgiveness, negative interest rate loans, grants, and other loan forgiveness. The Safe Drinking Water Act, as amended, refers to the “drinking water treatment revolving loan fund” or the “State loan fund.” 42 U.S.C. § 300j-12(a)(1)(B). For the purposes of this report, we refer to this fund as the “Drinking Water State Revolving Fund.”
[22]33 U.S.C. § 1383(i). Municipalities that do not meet the state’s affordability criteria can seek additional subsidies to benefit individual residential ratepayers or under other conditions. Id. § 1383(i)(1)(A)(ii), (B). For example, states may also provide eligible municipalities and other entities additional subsidies to implement a process, material, technique, or technology that (1) addresses water- or energy-efficiency goals; (2) mitigates stormwater runoff; or (3) encourages sustainable project planning, design, and construction. Id. § 1383(i)(1)(B). Additional subsidies include principal forgiveness, negative interest rate loans, grants, and other loan forgiveness. The Clean Water Act, as amended, refers to the “water pollution control revolving loan funds” or “water pollution control revolving fund.” Id. § 1383. For the purposes of this report, we refer to this fund as the “Clean Water State Revolving Fund.”
[23]42 U.S.C. § 5121(b)(7).
[24]42 U.S.C. § 5133(h)(2). Small impoverished communities, which FEMA calls Economically Disadvantaged Rural Communities, are those with 3,000 or fewer people with residents having an average per capita annual income no more than 80 percent of the national per capita income, based on the best available data. See 42 U.S.C. § 5133(a).
[25]Community Disaster Resilience Zones are census tracts that are most in need and at risk for the effects of natural hazards. Pub. L. No. 117-255, 136 Stat. 2363 (2022) (codified at 42 U.S.C. § 5136). FEMA may also provide financial and technical assistance to state, territorial, Tribal, and local governments that plan to perform a mitigation project within, or primarily benefiting, a Community Disaster Resilience Zone. Id. at § 5136(h).
[26]See 7 U.S.C. § 1926(a)(13) (providing that for water, waste disposal, and wastewater facility loans and grants authorized under 7 U.S.C. § 1926(a)(1)-(2), USDA must give highest priority to rural communities having a population of not more than 5,500 that have community water supply systems for which, due to unanticipated diminution or deterioration of its water supply, immediate action is needed, or community waste disposal systems that, due to unanticipated occurrences, are not adequate to the needs of the community).
[27]See, e.g., Consolidated Appropriations Act, 2024, Pub. L. No. 118-42, div. B, tit. VII, § 736, 138 Stat. 25, 110 (2024).
[28]7 C.F.R. § 1780.2.
[29]Exec. Order No. 14,008, Tackling the Climate Crisis at Home and Abroad, 86 Fed. Reg. 7619 (Feb. 1, 2021) (revoked by Exec. Order No. 14,148, Initial Rescissions of Harmful Executive Orders and Actions, 90 Fed. Reg. 8237 (Jan. 28, 2025)).
[30]Office of Management and Budget, Council on Environmental Quality, and Climate Policy Office, Interim Implementation Guidance for the Justice40 Initiative, M-21-28 (Washington, D.C.: July 20, 2021).
[31]Exec. Order No. 13,985, Advancing Racial Equity and Support for Underserved Communities Through the Federal Government, 86 Fed. Reg. 7009 (Jan. 25, 2021) (revoked by Exec. Order No. 14,148, Initial Rescissions of Harmful Executive Orders and Actions, 90 Fed. Reg. 8237, 8238 (Jan. 28, 2025)).
[32]Exec. Order No. 12,898, Federal Actions to Address Environmental Justice in Minority Populations and Low-Income Populations, 59 Fed. Reg. 7629 (Feb. 16, 1994) (revoked by Exec. Order No. 14,173, Ending Illegal Discrimination and Restoring Merit-Based Opportunity, 90 Fed. Reg. 8633, 8634 (Jan. 31, 2025)). Another executive order called for executive branch agencies to terminate, to the maximum extent allowed by law, all “environmental justice” offices and positions; “equity” actions, initiatives, or programs; and “equity-related” grants or contracts within 60 days of this order. See Exec. Order No. 14,151, Ending Radical and Wasteful Government DEI Programs and Preferencing, 90 Fed. Reg. 8339 (Jan. 29, 2025).
[33]GAO, Water Infrastructure: Technical Assistance and Climate Resilience Planning Could Help Utilities Prepare for Potential Climate Change Impacts, GAO‑20‑24 (Washington, D.C.: Jan. 16, 2020). Similarly, EPA’s Office of Inspector General reported in April 2024 that states often did not include climate resilience in their plans for certain EPA water infrastructure programs. See EPA Office of Inspector General, Half the States Did Not Include Climate Adaptation or Related Resilience Efforts in Their Clean Water State Revolving Fund Intended Use Plans, 24-P-0031 (Washington, D.C.: Apr. 8, 2024).
[34]GAO, Rural Water Infrastructure: Federal Agencies Provide Funding but Could Increase Coordination to Help Communities, GAO‑15‑450T (Washington, D.C.: Feb. 27, 2015).
[35]GAO, Disaster Resilience: FEMA Should Take Additional Steps to Streamline Hazard Mitigation Grants and Assess Program Effects, GAO‑21‑140 (Washington, D.C.: Feb. 2, 2021).
[36]These findings and this recommendation pertained to FEMA’s Public Assistance, Hazard Mitigation Grant Program, Flood Mitigation Assistance program, and Pre-Disaster Mitigation program.
[37]GAO, Disaster Recovery: Additional Actions Needed to Identify and Address Potential Recovery Barriers, GAO‑22‑104039 (Washington, D.C.: Dec. 15, 2021).
[38]Of the 19 federal programs we identified that are authorized to provide financial assistance to improve water infrastructure, we did not review data from one program—FEMA’s Public Assistance—because the program’s data did not enable us to identify obligations for water infrastructure. We reviewed obligations data from the remaining 18 programs, 17 of which are grant programs. One of these 17 grant programs—USDA’s Water and Waste Disposal Loan and Grant Program—may also provide loans and loan guarantees.
[39]An obligation is a definite commitment that creates a legal liability of the government for the payment of goods and services ordered or received, such as when an agency signs a contract or awards a grant. Payment may be made immediately or in the future.
[40]Other federal agencies also provide financial assistance for improvements to drinking water and wastewater infrastructure. For example, the U.S. Department of the Treasury’s Coronavirus State and Local Fiscal Recovery Funds Program, created by the American Rescue Plan Act of 2021, reported investing $5.2 billion in drinking water and wastewater infrastructure through September 2024. Other agencies that provide financial assistance for drinking water and wastewater include the U.S. Department of Commerce’s Economic Development Administration, the Department of Defense’s Army Corps of Engineers, the Department of Health and Human Services’ Indian Health Service, the Department of Housing and Urban Development, and the Department of the Interior’s Bureau of Reclamation.
[41]States awarded 17,121 assistance agreements through their Clean Water and Drinking Water State Revolving Fund programs in fiscal years 2014 through 2023, according to our analysis of EPA-provided data. This analysis excluded award recipients from federally recognized Tribes, U.S. territories, and Washington, D.C. USDA’s Revolving Funds for Financing Water and Wastewater Projects also awarded 27 capitalization grants to three organizations during our review period.
[42]See 33 U.S.C. § 1302a(b) (Clean Water Infrastructure Resilience and Sustainability program); 42 U.S.C. § 300j-19a(l) (Drinking Water System Infrastructure Resilience and Sustainability program); 42 U.S.C. § 300j-19g(b) (Midsize and Large Drinking Water System Infrastructure Resilience and Sustainability Program); 42 U.S.C. § 5135 (Safeguarding Tomorrow Revolving Loan Fund program).
[43]See 2 U.S.C. §§ 661a(5)(A), 661b(d). See also OMB Circular No. A-129, Policies for Federal Credit Programs and Non-Tax Receivables (2024); OMB Circular No. A-11, Preparation, Submission and Execution of the Budget (2024). The subsidy cost of a direct loan is the net present value, at the time when the direct loan is disbursed from the financing account, of the estimated loan disbursements, repayments of principal, payments of interest, recoveries or proceeds of asset sales, and other payments by or to the government over the life of the loan. These estimated cash flows include the effects of estimated defaults, prepayments, fees, penalties, and expected actions by the government and the borrower within the terms of the loan contract. The credit subsidy cost of a loan guarantee is the net present value, at the time a guaranteed loan is disbursed by the lender, of the following cash flows: (1) estimated payments by the government to cover defaults, delinquencies, interest subsidies, or other payments and (2) the estimated payments to the government, including origination and other fees, penalties, and recoveries. GAO, Credit Reform: Current Method to Estimate Credit Subsidy Costs Is More Appropriate for Budget Estimates Than a Fair Value Approach, GAO‑16‑41 (Washington, D.C.: Jan. 29, 2016).
[44]The Infrastructure Investment and Jobs Act appropriated more than $43 billion for EPA’s Clean Water State Revolving Fund and Drinking Water State Revolving Fund programs from fiscal year 2022 through fiscal year 2026. The act appropriated about $11.7 billion for each program over 5 fiscal years. It also appropriated $19 billion for the Drinking Water State Revolving Fund for projects related to lead service line replacements ($15 billion) and addressing emerging contaminants ($4 billion), and $1 billion for the Clean Water State Revolving Fund to address emerging contaminants. Pub. L. No. 117-58, div. J, tit. VI, 135 Stat. 429, 1399-1401 (2021).
[45]Every 4 years, EPA conducts surveys to identify drinking water and wastewater infrastructure needs that will occur within the next 20 years and the costs associated with these needs. EPA is required to report the results of these surveys to Congress. 33 U.S.C. §§ 1375, 1389; 42 U.S.C. § 300j-12(h), (i)(4). EPA reported $625 billion in drinking water infrastructure needs in 2023 and $630.1 billion in wastewater infrastructure needs in 2024.
[46]EPA, FEMA, and USDA administer a variety of technical assistance programs that help drinking water and wastewater utilities in vulnerable communities access financial assistance. Federal agencies provide technical assistance in the form of programs, activities, and services to (1) strengthen the capacity of grant applicants and recipients and (2) improve recipients’ performance of grant functions. See appendix V for a list of EPA, FEMA, and USDA programs that provide technical assistance to help communities apply for and manage financial assistance for drinking water and wastewater infrastructure.
[47]42 U.S.C. § 300j-12(a)(2)(B); 33 U.S.C. § 3905(2), (3). We did not conduct a comprehensive assessment of the extent to which EPA, FEMA, and USDA are authorized to provide financial assistance for operations and maintenance expenses in the remaining programs we reviewed.
[48]33 U.S.C. § 1284(a)(4).
[49]See 7 C.F.R. § 1780.9(e)(2)(ii).
[50]This program was established by the 2021 Infrastructure Investment and Jobs Act. It may award grants to public water systems serving communities with a population of 10,000 or more. Pub. L. No. 117-58, § 50107, 135 Stat. 429, 1144 (2021) (codified at 42 U.S.C. § 300j-19g(a)(1), (c)).
[51]This report section focuses on programs that were selected to participate in the Justice40 Initiative, which was established in an executive order that was subsequently revoked. Exec. Order No. 14,008, Tackling the Climate Crisis at Home and Abroad, 86 Fed. Reg. 7619 (Feb. 1, 2021) (revoked by Exec. Order No. 14,148, 90 Fed. Reg. 8237, 8238 (Jan. 28, 2025)). The authorizing statutes for several of these programs call for the agencies to prioritize or provide additional financial assistance to vulnerable communities in various ways. See appendix I for more information on the scope and methodology of this and other report sections.
[52]The EPA programs that provide financial assistance for water infrastructure and that were selected to participate in the Justice40 Initiative are the Clean Water State Revolving Fund program; Drinking Water State Revolving Fund program; Drinking Water System Infrastructure Resilience and Sustainability program; Sewer Overflow and Stormwater Reuse Municipal Grant program; Small, Underserved, and Disadvantaged Communities Drinking Water Grant program; U.S.-Mexico Border Water Infrastructure Program, and the Water Infrastructure Finance and Innovation Act program.
[53]This program, which provides financial assistance for projects that increase resilience to natural hazards, evaluated eligible applications on a 100-point scale based on criteria and weights identified in the program’s request for applications.
[54]This section of our report focuses on FEMA programs that provide financial assistance for water infrastructure and that were selected to participate in the Justice40 Initiative; specifically, the Building Resilient Infrastructure and Communities and Flood Mitigation Assistance programs.
[55]Assistance provided through FEMA’s hazard mitigation programs is subject to the National Environmental Policy Act, which requires federal agencies to assess the environmental effects of proposed major federal actions prior to making decisions. 42 U.S.C. §§ 4321-4347. FEMA awards grants to applicants, which are generally states, which then distribute the awards to subapplicants, such as local governments.
[56]FEMA’s benefit-cost analysis is a method used to calculate the future risk reduction benefits of hazard mitigation projects and compare those benefits with the project’s costs.
[57]Three of these representatives were speaking specifically about cost-share requirements for FEMA programs. The remaining 10 utilities, five of which did not apply for FEMA grants according to utility representatives, did not comment on cost-share requirements. Of the 18 programs we reviewed, eight had cost-share requirements for certain recipient communities. Five of these eight programs were FEMA programs, two were EPA programs, and one was a USDA program.
[58]We reported on challenges related to environmental and historic preservation reviews in GAO, Disaster Recovery: Actions Needed to Improve the Federal Approach, GAO‑23‑104956 (Washington, D.C.: Nov. 15, 2022) and Hurricane Sandy: An Investment Strategy Could Help the Federal Government Enhance National Resilience for Future Disasters, GAO‑15‑515 (Washington, D.C.: July 30, 2015), and GAO‑21‑140. We reported on challenges related to FEMA’s benefit-cost analysis in Flood Mitigation: Actions Needed to Improve Use of FEMA Property Acquisitions, GAO‑22‑106037 (Washington, D.C.: Sept. 13, 2022) and GAO‑21‑140. We reported on challenges relating to cost share in GAO‑23‑104956 and GAO‑22‑106037.
[59]In April 2025, FEMA announced that it was ending the Building Resilient Infrastructure and Communities program, which included this technical assistance program.
[60]The program’s authorizing statute provides that the program may provide technical and financial assistance to states and local government to assist in the implementation of hazard mitigation measures. 42 U.S.C. § 5133(b).
[61]Projects qualified for this alternative cost-effectiveness methodology if they benefitted disadvantaged communities, addressed climate change impacts, had hard-to-quantify benefits, and/or were subject to higher costs due to the use of low carbon building materials or compliance with the Federal Flood Risk Management Standard.
[62]The Stafford Act, as amended, provides that FEMA may contribute up to 90 percent of the total cost of a mitigation project under this program for small, impoverished communities, which FEMA calls Economically Disadvantaged Rural Communities. 42 U.S.C. § 5133(h)(2). These communities are defined as communities of 3,000 or fewer people in which residents have an average per capita annual income no more than 80 percent of the national per capita income. 42 U.S.C. § 5133(a). The Stafford Act also provides that FEMA may contribute up to 90 percent of the total cost of resilience or mitigation projects under this program that are within, or that primarily benefit, Community Disaster Resilience Zones, which are census tracts considered to be most at risk for the effects of natural hazards, as determined by FEMA and as required by the Community Disaster Resilience Zone Act. 42 U.S.C. § 5136.
[63]42 U.S.C. § 4104c(d)(1), (2).
[64]42 U.S.C. § 5121(b)(7).
[65]Funds in the state revolving fund other than the capitalization grant and state’s required match for the capitalization grant, such as repayment of loans and interest payments on those loans, are considered non-federal and may be used for a FEMA program non-federal cost share. EPA and FEMA signed a new memorandum of understanding in September 2024 valid for 5 years unless mutually modified or extended. See Memorandum of Understanding Between the United States Environmental Protection Agency (EPA) and the Department of Homeland Security Federal Emergency Management Agency (FEMA) Regarding Coordination between EPA and FEMA Pertaining to State Revolving Fund Programs (September 2024).
[66]The USDA programs whose assistance may be used to satisfy cost-share requirements for FEMA hazard mitigation assistance programs are the Revolving Funds for Financing Water and Wastewater Projects program and the grant portion of the Water and Waste Disposal Loan and Grant Program. The authorizing statute for such programs provides that grants awarded under the program may be used to pay the local share requirements of another federal grant program. 7 U.S.C. § 1926(a)(16). Further, Office of Management and Budget regulations do not prohibit the use of loans and loan guarantees, such as those offered by these programs, to satisfy cost-share requirements of other federal programs. 2 C.F.R. § 200.101(b)(3).
[68]FEMA, 2023 Stakeholder Engagement Report Building Resilient Infrastructure and Communities. (Washington D.C.: Aug. 2024).
[69]GAO‑23‑105460. This report describes 13 key practices that can help federal leaders and employees develop and use evidence to effectively manage and assess the results of federal efforts. The key practices are distilled from hundreds of actions identified in GAO’s past work as effective for implementing federal evidence-building and performance-management activities.
[70]USDA, Creating Opportunities through Rural Engagement, Apr. 2024.
[71]USDA, Biden Administration Launches USDA-EPA Partnership to Provide Wastewater Sanitation to Underserved Communities, Press Release No. 0168.22 (Washington, D.C.: Aug. 2, 2022).
[72]This section of our report focuses on programs that provided financial assistance for water infrastructure and that were selected to participate in the Justice40 Initiative, which was established in an executive order that was subsequently revoked. Exec. Order No. 14,008, 86 Fed. Reg. 7619 (Feb. 1, 2021) (revoked by Exec. Order No. 14,148, 90 Fed. Reg. 8237, 8238 (Jan. 28, 2025)). The authorizing statutes for several of these programs call for the agencies to prioritize or provide additional financial assistance to vulnerable communities in various ways, as discussed above. Additionally, as part of the Justice40 Initiative, they were subject to certain reporting requirements, including reporting the percent of program benefits that went to disadvantaged communities. Agencies were to create their own determinations of what constitutes a program benefit for purposes of the Initiative. See appendix I for more information on the scope and methodology of this and other report sections.
[73]This section focuses on FEMA’s Building Resilient Infrastructure and Communities program and Flood Mitigation Assistance program because they participated in the Justice40 Initiative and they provide financial assistance for drinking water and wastewater infrastructure.
[74]Community Disaster Resilience Zones are census tracts that are most in need and at risk for the effects of natural hazards. See Pub. L. No. 117-255, 136 Stat. 2363 (2022) (codified at 42 U.S.C. § 5136). Economically Disadvantaged Rural Communities are communities of 3,000 or fewer individuals where residents have an average per capita annual income that does not exceed 80 percent of the national per capita income. See 42 U.S.C. § 5133(a).
[75]The Social Vulnerability Index was created by the U.S. Centers for Disease Control and Prevention to help public health officials and emergency response planners identify communities that will need continued support to recover from an emergency or natural disaster. In January 2025, the U.S. Centers for Disease Control and Prevention removed the Social Vulnerability Index from its website in response to Executive Order 14168, titled Defending Women from Gender Ideology Extremism and Restoring Biological Truth to the Federal Government, and subsequent guidance from the U.S. Office of Personnel Management. See 90 Fed. Reg. 8615 (Jan. 30, 2025). On February 11, 2025, in response to a temporary restraining order issued by the U.S. District Court for the District of Columbia, this website was restored. See Order Granting Plaintiff’s Motion for a Temporary Restraining Order, Doctors for Am. v. Off. of Pers. Mgmt., No. 1:25-cv-00322 (D.D.C. Feb. 11, 2025).
[76]Pub. L. No. 117-58, 135 Stat. 429, 1387-88 (2021).
[77]The Climate and Economic Justice Screening Tool was developed by the Council on Environmental Quality to support the Justice40 Initiative. It was created to help agencies identify communities experiencing burdens in eight categories: climate change, energy, health, housing, legacy pollution, transportation, water and wastewater, and workforce development. The tool identified a community as disadvantaged based on whether it met a threshold in one or more of these categories. As discussed above, on January 20, 2025, the executive order that established the Justice40 Initiative and required the Council on Environmental Quality to create the Climate and Economic Justice Screening Tool was revoked. See 90 Fed. Reg. 8237, 8238 (Jan. 28, 2025). As of January 2025, the Climate and Economic Justice Screening Tool is no longer available on the White House website.
[78]This index was developed by the Economic Innovation Group, and it uses seven metrics to characterize a community’s well-being. These metrics include education level, unemployment rate, housing vacancy rate, poverty rate, and median income. The index assigns each zip code a score from 0 to 100, with a score 100 indicating the most vulnerable communities.
[79]“Persistent poverty counties” are counties in which at least 20 percent of the population has lived in poverty over the past 30 years. See, e.g., Consolidated Appropriations Act, 2024, Pub. L. No. 118-42, div. B, tit. VII, § 736, 138 Stat. 25, 110 (2024).
[80]Water Infrastructure Finance and Innovation Act of 2014, Pub. L. No. 113-121, §§ 5021-5032, 128 Stat. 1193, 1332-1342 (codified as amended at 33 U.S.C. §§ 3901-3911).
[81]40 C.F.R. § 35.10055(a)(13).
[82]See EPA, WIFIA Handbook (Washington, D.C.: Mar. 2025). Most prospective borrowers are municipal governments, according to program officials.
[83]The Small, Underserved, and Disadvantaged Communities program provides grants to assist these communities comply with national drinking water regulations, including grants for water system infrastructure. See 42 U.S.C. § 300j-19a. The Drinking Water System Infrastructure Resilience and Sustainability program provides grants to assist these communities increase drinking water facility resilience to natural hazards. See id. § 300j-19a(l). Applicants for both programs must serve a community that is underserved (defined as a community that has an inadequate system for obtaining drinking water, does not have access to household drinking water or wastewater services, or is served by a public water system that violates the National Primary Drinking Water Regulations) and is either small (contains a population of less than 10,000 people and does not have financial capacity for the eligible project) or disadvantaged (the service area of a public water system that meets affordability criteria established by its respective state). Id. § 300j-19a(a)-(c).
[84]U.S.-Mexico Border Water Infrastructure Grant Program, EPA, last updated Jan. 10, 2025, https://www.epa.gov/small-and-rural-wastewater-systems/us-mexico-border-water-infrastructure-grant-program.
[85]EPA Office of Wastewater Management, U.S.-Mexico Border Water Infrastructure Program Annual Report 2014, EPA-832-R-15-014 (August 2015).
[86]42 U.S.C. § 300j-12(d)(3).
[87]EPA, DWSRF Disadvantaged Community Definitions: A Reference for States, EPA 810-R-22-002 (June 2022, revised Oct. 2022).
[88]Title VI of the Civil Rights Act of 1964, as amended, prohibits recipients of federal financial assistance (e.g., states and grantees) from discriminating based on race, color, or national origin in any program or activity. See 42 U.S.C. § 2000d. See also 40 C.F.R. § 7.35(b) (prohibiting financial assistance recipients from using “criteria or methods of administering its program or activity which have the effect of subjecting individuals to discrimination because of their race, color, national origin, or sex, or have the effect of defeating or substantially impairing accomplishment of the objectives of the program or activity with respect to individuals of a particular race, color, national origin, or sex”).
[90]See 33 U.S.C. § 1383(i)(1)-(2). Municipalities that do not meet the state’s affordability criteria can seek additional subsidies to benefit individual residential ratepayers or under other conditions. Id. § 1383(i)(1)(A)(ii), (B). For example, states may also provide eligible municipalities and other entities additional subsidies to implement a process, material, technique, or technology that (1) addresses water- or energy-efficiency goals; (2) mitigates stormwater runoff; or (3) encourages sustainable project planning, design, and construction. Id. § 1383(i)(1)(B). Additional subsidies include principal forgiveness, negative interest rate loans, grants, and other loan forgiveness.
[91]Id. § 1383(i)(3).
[92]33 U.S.C § 1301(a)(1).
[93]See 33 U.S.C. § 1301(a)-(c). Other entities also receive grant selection priority, including Alaska native villages. Id. § 1301(b).
[94]A community water system is a public drinking water system that serves at least 25 year-round residents or has 15 service connections and supplies the same population year-round. 40 C.F.R. § 141.2. The dataset, which we refer to as a mapping tool in our report, includes community water systems in 50 states, the District of Columbia, and Tribes. It does not include Puerto Rico and outlying territories. The dataset was developed jointly with EPA’s Office of Research and Development, Office of Water, Office of Enforcement and Compliance Assurance, and Office of Environmental Justice and External Civil Rights, according to officials. See https://www.epa.gov/ground-water-and-drinking-water/community-water-system-service-area-boundaries, last updated Feb. 7, 2025.
[95]Officials from EPA’s Office of Research Development said this tool would map sewersheds, which they define as a geographic area where all the sewers flow to a single end wastewater treatment plant. A sewershed can include multiple treatment plants in certain circumstances. There are nearly 17,000 sewersheds nationwide, according to officials.
[96]EPA Office of Water, Sample Use Cases for Community Water System Service Area Boundaries (Washington, D.C.: Apr. 2025).
[97]National Security Memorandum/NSM-22, National Security Memorandum on Critical Infrastructure Security and Resilience (Apr. 30, 2024). Executive Order 14239, Achieving Efficiency Through State and Local Preparedness, directs the Assistant to the President for National Security Affairs to review within 180 days of the order all critical infrastructure policies, including the NSM-22, and recommend for modification, as appropriate. Exec. Order No. 14, 239, 90 Fed. Reg. 13267, 13267-68 (Mar. 21, 2025). See also Uniting and Strengthening America by Providing Appropriate Tools Required to Intercept and Obstruct Terrorism (USA PATRIOT ACT) Act of 2001, Pub. L. 107-56, tit, X, § 1016, 115 Stat. 56, 400 (codified at 42 U.S.C. § 5195c(e) (defining critical infrastructure). Critical infrastructure resilience includes measures to protect against cybersecurity events. See GAO, Critical Infrastructure Protection: EPA Urgently Needs a Strategy to Address Cybersecurity Risks to Water and Wastewater Systems, GAO‑24‑106744 (Washington, D.C.: Aug. 1, 2024).
[98]https://github.com/USEPA/ORD_SAB_Model/tree/main/Census (accessed May 6, 2025). EPA officials said this methodology would provide data at the census block, census block group, and census tract levels. Data can also be provided at the ZIP code level, according to officials.
[99]https://www.epa.gov/ground-water-and-drinking-water/community-water-system-service-area-boundaries?tab=map (accessed May 5, 2025).
[101]EPA’s wastewater mapping tool might not be useful for all types of projects related to wastewater infrastructure wastewater infrastructure, since certain types of projects might not correspond to a sewershed boundary area.
[102]See 42 U.S.C. § 300j-12(d)(3) (defining “disadvantaged community” for the Drinking Water State Revolving Fund program as the public water system service area that meets the states’ affordability criteria and limiting EPA to publishing information to assist states in establishing affordability criteria); 33 U.S.C. § 1383(i)(2) (requiring states to establish affordability criteria based on income and unemployment data, population trends, and other data determined relevant by the state to assist in identifying municipalities that would experience a significant hardship raising the revenue necessary to finance an eligible Clean Water State Revolving Fund project).
[103]This guidance and technical assistance would supplement other information EPA has provided to states, which has included considerations for states seeking to reexamine how they define disadvantaged communities for drinking water state revolving fund programs to improve assistance to such communities. See EPA, DWSRF Disadvantaged Community Definitions: A Reference for States, EPA 810-R-22-002 (June 2022, revised Oct. 2022).
[105]See, e.g., 33 U.S.C. § 1383(i)(1)-(3) (requiring states to use from 10 percent to 30 percent of EPA’s grants for their clean water revolving funds to provide additional subsidies to municipalities that meet certain affordability criteria if the state receives sufficient applications for assistance from these communities and if EPA capitalization grants to all states for the fiscal year exceed $1 billion). Municipalities that do not meet the state’s affordability criteria can seek additional subsidies to benefit individual residential ratepayers or under other conditions. Id. § 1383(i)(1)(A)(ii), (B). For example, states may also provide eligible municipalities and other entities additional subsidies to implement a process, material, technique, or technology that (1) addresses water- or energy-efficiency goals; (2) mitigates stormwater runoff; or (3) encourages sustainable project planning, design, and construction. Id. § 1383(i)(1)(B).
[106]We compared communities with the sample average for a particular demographic (“an average community”) to those with a value that is one standard deviation above the sample average for that same demographic, while holding other values constant. We included census variables for the following categories: Hispanic or Latino or Not Hispanic or Latino and: Black or African American alone, American Indian and Alaska Native alone, Asian alone, Native Hawaiian and Other Pacific Islander alone, Some other race alone, or two or more races (two races including “some other race,” two races excluding “some other race,” and three or more races). See appendix II for more details on our methodology.
[107]The estimated amount of financial assistance that communities received is based on our regression analysis. For the Drinking Water State Revolving Fund program, the 95 percent statistical confidence intervals for each community characteristic are as follows: higher percentage of non-white or Hispanic/Latino: $18,174 to $82,640 less; higher Social Vulnerability Index score: $93,547 to $148,058 more; higher poverty: $8,663 to $54,038 more. See appendix II for more details on our methodology.
[108]We did not use EPA’s mapping tool with wastewater service areas for this analysis because the tool was not available at the time of our analysis.
[109]The estimated amount of financial assistance that communities received is based on our regression analysis. For the Clean Water State Revolving Fund program, the 95 percent statistical confidence intervals for each community characteristic are as follows: higher percentage of non-white or Hispanic/Latino: $153,248 to $252,847 more; higher Social Vulnerability Index score: $274,524 to $220,652 less; higher poverty: $273,436 to $221,108 less.
[110]GAO, Justice40: Additional Efforts Needed to Improve Tribal Applicants’ Access to Federal Programs Under Environmental Justice Initiative, GAO‑24‑106511 (Washington, D.C.: Apr. 10, 2024).
[111]GAO, Critical Infrastructure Protection: EPA Urgently Needs a Strategy to Address Cybersecurity Risks to Water and Wastewater Systems, GAO‑24‑106744 (Washington, D.C.: Aug. 1, 2024).
[112]The Building Resilient Infrastructure and Communities program began awarding financial assistance in fiscal year 2020. We were unable to analyze data from FEMA’s Public Assistance due to limitations in the data that inhibited our ability to classify projects as water-related.
[113]The Justice40 Initiative centered on the goal that 40 percent of the benefits of certain federal investments—including investments in water infrastructure—flow to disadvantaged communities. The Justice40 Initiative was established by Executive Order 14008, Tackling the Climate Crisis at Home and Abroad, which was revoked on January 20, 2025. 86 Fed. Reg. 7619 (Feb. 1, 2021) (revoked by Exec. Order No. 14,148, 90 Fed. Reg. 8237, 8238 (Jan. 28, 2025)). The revoked Executive Order 14008 that established the Justice40 Initiative described “disadvantaged communities” as those “that have been historically marginalized and overburdened by pollution and underinvestment in housing, transportation, water and wastewater infrastructure, and health care.” Exec. Order No. 14,008, § 219, 86 Fed. Reg. at 7629.
[114]The utilities we selected were in these communities (1) Cambridge, MD; (2) Village of DePue, IL; (3) East New Market, MD; (4) Flowood, MS; (5) Fort Myers, FL; (6) Hazard, KY; (7) Jackson, MS; (8) Los Angeles, CA; (9) Pittsburgh, PA; (10) St. Louis, MO; (11) Secretary, MD; and (12) Truth or Consequences, NM.
[115]In July 2021, the Executive Office of the President issued interim implementation guidance for the Justice40 Initiative, which identified 21 pilot programs that were to participate in the initiative. Office of Management and Budget, Council on Environmental Quality, and Climate Policy Office, Interim Implementation Guidance for the Justice40 Initiative, M-21-28 (Washington, D.C.: July 20, 2021). This guidance also called for all federal agencies to select additional programs to participate in the initiative.
[116]GAO, Standards for Internal Control in the Federal Government, GAO‑14‑704G (Washington, D.C.: Sept. 2014).
[117]GAO, Evidence-Based Policymaking: Practices to Help Manage and Assess the Results of Federal Efforts, GAO‑23‑105460 (Washington, D.C.: July 2023).
[119]Because FEMA does not track whether its programs’ awards are specifically related to drinking water or wastewater infrastructure, we identified these projects for our analysis of the Building Resilient Infrastructure and Communities program using the method described earlier in this appendix.
[120]For EPA, we selected the Clean Water State Revolving Fund program and the Drinking Water State Revolving Fund program. For FEMA, we selected the Building Resilient Infrastructure and Communities program; FEMA announced in April 2025 that it was ending this program. For USDA, we selected the Water and Waste Disposal Loan and Grant program. For a description of our methodology for selecting programs, see appendix I.
[121]A community water system is a public drinking water system that serves at least 25 year-round residents or has 15 service connections and supplies the same population year-round. 40 C.F.R. § 141.2. According to EPA, most of the U.S. population is served by community water systems.
[122]An assistance agreement refers to the financial assistance that states award to projects through the state revolving fund programs. These agreements are typically low-interest loans, but they can also include additional subsidization through grants, principal forgiveness, or negative interest loans.
[123]A Public Water System ID is a nine-character code that uniquely identifies a specific public water system within a state or EPA region. The identification number links a water provider to the federally reported system data stored in EPA’s Safe Drinking Water Information System. We restricted our analysis to water systems with identification numbers whose boundaries are identified in EPA’s community water system service area mapping tool. Out of 82,142 census tracts, 34,603 received Drinking Water State Revolving Fund program assistance from fiscal year 2014 through fiscal year 2023, and the rest did not receive any such funds.
[124]In July 2024, EPA released a mapping tool with the boundaries of community water system service areas nationwide. The tool is publicly available and includes service areas for 44,415 out of a total of 47,538 (93.4 percent) systems, which represents 99.4 percent of the total population served by community water systems. Puerto Rico and U.S. territories are not included in the tool.
[125]For the Drinking Water State Revolving Fund program, we define “community” as a census tract that intersected with a facility that had a Public Water System Identification number and that received a State Revolving Fund obligation. It is possible that other communities not in this category also benefitted indirectly, such as adjacent communities that have populations that commute into the benefitting community. It is also possible that residents of a census tract do not benefit equally from the program’s financial assistance. Our approach assumes a tract’s benefits are proportional to the intersecting area of that tract and the project water system. It also assumes that, within the intersecting area, there is uniform distribution of that apportioned fund to the beneficiaries, such as the people, pipes, and residences within that tract.
[126]To analyze watersheds, we aggregated Clean Water State Revolving Fund program financial assistance for municipal wastewater plants to the watershed level as identified through the unique 10-digit hydrologic unit code, which was consistently delineated nationwide. According to U.S. Geological Survey, hydrologic units represent the area of the landscape that drains to a portion of the stream network. Hydrologic units are arranged in a nested, hierarchical system using a progressive two-digit system where each successively smaller areal unit is identified by adding two digits to the identifying code the smaller unit is nested within. Eight levels of progressive hydrologic units are identified by unique two-digit to 12-digit codes, from region to sub-watershed. Though EPA’s data included 12- or 11-digit hydrologic unit codes, our analysis aggregated funding to 10-digit unit codes considering the size of a sub-watershed.
[127]The EPA’s National Pollutant Discharge Elimination System program, authorized by the Clean Water Act, controls water pollution by regulating facilities, such as wastewater treatment plants, that discharge pollutants into waters of the U.S. through a permit system. See 33 U.S.C. § 1342. Our analysis produced a universe of 72,749 census tracts that intersected with a watershed with at least one active permit. Out of the 72,749 census tracts with active permits, according to our calculation, 48,226 of them were in a watershed with a Clean Water State Revolving Fund project for which obligations had been made from fiscal year 2014 through fiscal year 2023. This accounted for around 80 percent of all financial assistance in that time frame. The remaining census tracts did not have projects for which financial assistance had been provided.
[128]According to FEMA’s National Risk Index documentation, social vulnerability is broadly defined as the susceptibility of social groups to the adverse impacts of natural hazards, including disproportionate death, injury, loss, or disruption of livelihood. Social vulnerability considers the social, economic, demographic, and housing characteristics of a community that influence its ability to prepare for, respond to, cope with, recover from, and adapt to environmental hazards. The Social Vulnerability Index was developed by the U.S. Centers for Disease Control and Prevention based on 16 socioeconomic characteristics of a community, such as unemployment, poverty, age, and racial and ethnic composition, among other characteristics. We downloaded the National Risk Index database, including the Social Vulnerability Index, from FEMA’s website (version March 2023).
[129]The U.S. Census Bureau’s American Community Survey measures the changing social, economic, demographic, and housing characteristics of the U.S. population. The survey is sent to a sample of addresses across the 50 states and the District of Columbia on a rolling basis, with approximately 3.5 million addresses sampled annually. Survey data are used to produce 1-year and 5-year population estimates. We used the most recent 5-year population estimates (2018 to 2022) at the census tract level.
[130]We obtained the rural-urban continuum area classification at the census tract level from USDA, and we mapped the classifications onto census tracts of 2018–2022.
[131]For FEMA’s Building Resilient Infrastructure and Communities program, we identified water and wastewater financial assistance recipients using criteria provided by FEMA officials, which included years of scope, project identification, and name of program. In total, we identified 40 awards within our scope. For USDA Water and Waste Disposal Loan and Grant Program data, we identified financial assistance recipients as those identified by USDA as currently obligated and having specified grant or loan amounts for water and/or wastewater projects. In this analysis, we excluded recipients who did not have specified obligations, as agency officials classified them as withdrawn, rejected, suspended, under review, or data that did not have a specified year of obligation. In total, we identified 5,265 awards within our scope. For both programs, we excluded award recipients from federally recognized Tribes, U.S. territories, and Washington, D.C.
[132]The location data for FEMA award recipients represent the location of the applicant, such as an organization, that applied for financial assistance, rather than the service area or the community intended to benefit from the provided services. FEMA’s Building Resilient Infrastructure and Communities program first awarded grants in fiscal year 2020. Fiscal year 2020 through fiscal year 2022 data were the most recent obligations data available at the time of our analysis.
[133]There are limitations in using ZIP-code-based facility information to describe the characteristics of USDA’s Water and Waste Disposal Loan and Grant Program recipients. According to agency officials, the ZIP code associated with a recipient or facility represents the facility’s physical location rather than the actual service area of the drinking water or wastewater treatment facility. Facilities may serve populations beyond the location in which they are located, meaning that geographic classifications based on ZIP codes do not necessarily capture the full reach of services provided. In this analysis, we prioritized the facility’s ZIP code whenever available. For 42 of the 5,265 USDA records, we were unable to match to the ZIP code crosswalk. In these cases, we relied on either the recipient’s ZIP code or the city and state information provided in their loan or grant application.
[134]County-level analysis has inherent limitations in generalizing community characteristics, as counties cover broad geographic areas with varying demographic, economic, and social conditions. More granular analyses, such as census-tract-level assessments, can provide a more precise understanding of localized disparities. However, these data were not available for either USDA’s Water and Waste Disposal Loan and Grant Program or FEMA’s Building Resilient Infrastructure and Communities program.
[135]The Rural-Urban Continuum Codes classification system is used to distinguish metropolitan and nonmetropolitan areas along a continuum based on population size and proximity to urban centers. This continuum reflects varying degrees of rurality and urban influence, meaning that some counties may not fit entirely into a single category.
[136]Projects eligible for USDA’s Water and Waste Disposal Loan and Grant Program are intended to benefit communities in rural areas, which the USDA defines for this program as a city, town, or unincorporated area that has a population of no more than 10,000 inhabitants, subject to certain exclusions and conditions. 7 U.S.C. § 1991(a)(13)(B), (D)-(I). This population-based definition differs from the Rural-Urban Continuum Codes, which categorize counties based on metropolitan influence, adjacency to urban areas, and economic integration rather than strict population thresholds.