HIGHER EDUCATION
Students’ Health Coverage Rates Have Improved, but Barriers to Coverage Remain for Some
Report to Congressional Requesters
United States Government Accountability Office
View GAO‑25‑107024. For more information, contact Melissa Emrey-Arras at (202) 512-7215 or emreyarrasm@gao.gov or John Dicken at (202) 512-7114 or dickenj@gao.gov.
Highlights of GAO‑25‑107024, a report to congressional requesters
Students’ Health Coverage Rates Have Improved, but Barriers to Coverage Remain for Some
Why GAO Did This Study
In 2022, about 19 million students were enrolled in nearly 3,900 degree-granting colleges. College costs include not just tuition and fees but expenses for basic needs, such as food, housing, and the costs of health care and coverage. The Patient Protection and Affordable Care Act contains several provisions that expand health coverage options that may be available to students, including requiring certain health plans to cover dependent children until age 26 and allowing states to expand Medicaid eligibility to certain low-income adults (expansion states).
GAO was asked to review college student access to health coverage. This report examines (1) how health coverage among students has changed since the enactment of the Patient Protection and Affordable Care Act and barriers students face in obtaining coverage, (2) factors selected colleges considered in deciding whether to offer health coverage and how these colleges helped students navigate coverage options, and (3) federal agencies’ actions to support colleges’ efforts to help students obtain coverage.
GAO analyzed the most recent data available from Census Bureau surveys on students’ health coverage and a nongeneralizable American College Health Association survey. GAO interviewed administrators from 12 colleges selected to reflect variation in size, degree program length, and other college characteristics; representatives from 17 stakeholder groups, such as student organizations and companies that administer student health plans; and officials from HHS and Education.
What GAO Found
Health coverage rates among undergraduate and graduate students have increased since the enactment of the Patient Protection and Affordable Care Act in 2010, from an estimated 81 percent in 2010 to 92 percent in 2022, according to GAO’s analysis of Census data. However, as of 2022, an estimated 1.6 million students still lacked coverage, including greater proportions of students from certain historically disadvantaged racial and ethnic groups, students in Medicaid nonexpansion states, and certain nonworking students. Multiple stakeholders and administrators at selected colleges said that some students face barriers to coverage, including costs, a lack of covered care year-round for out-of-state students, and a lack of affordable options in Medicaid nonexpansion states.
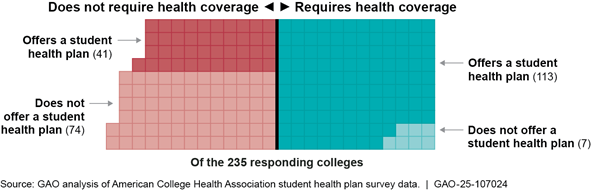
Colleges vary in whether they require health coverage or offer student health plans, according to nongeneralizable survey data from a sample of 4-year colleges (see figure). Administrators GAO interviewed from five of 12 selected colleges said their college required coverage and offered student health plans to meet state requirements or to support students’ access to health care. Administrators from the other seven selected colleges said their college did not require or offer coverage because of cost concerns or lack of student demand.
A few selected colleges provided students with information about their coverage options beyond a college’s student health plan, and about health coverage concepts more broadly. Students can still face challenges navigating their health coverage options because, according to stakeholders and college administrators, they may lack an understanding of health coverage concepts, may not prioritize obtaining health coverage, and may need to weigh complex factors to find coverage that best meets their needs.
The Departments of Health and Human Services (HHS) and Education have undertaken various efforts to increase students’ awareness of and enrollment in health coverage. For example, HHS has a webpage that guides students through their options for enrolling in certain health plans. Additionally, in 2023, Education published a letter and hosted a related webinar for colleges intended to encourage them to inform students with Medicaid about their potential loss of coverage. At the time, some students were about to be disenrolled from Medicaid due to the end of the COVID-19 public health emergency.
|
Abbreviations |
|
|
ACHA |
American College Health Association |
|
CMS |
Centers for Medicare & Medicaid Services |
|
Education |
Department of Education |
|
HHS |
Department of Health and Human Services |
|
PPACA |
Patient Protection and Affordable Care Act |
This is a work of the U.S. government and is not subject to copyright protection in the United States. The published product may be reproduced and distributed in its entirety without further permission from GAO. However, because this work may contain copyrighted images or other material, permission from the copyright holder may be necessary if you wish to reproduce this material separately.
March 21, 2025
The Honorable Patty Murray
Vice Chair
Committee on Appropriations
United States Senate
The Honorable Bernard Sanders
Ranking Member
Committee on Health, Education, Labor and Pensions
United States Senate
The Honorable Robert C. “Bobby” Scott
Ranking Member
Committee on Education and Workforce
House of Representatives
About 19 million students were enrolled in nearly 3,900 degree-granting colleges across the United States during the fall 2022 semester.[1] While the Department of Education provided about $114 billion in federal student aid in fiscal year 2023 to support broader access to higher education, students and their families remain responsible for a sizable portion of the total cost of attending college.[2] To plan for the costs of college, students must consider the total cost of attendance, which includes not only tuition and fees but expenses to cover their basic needs.
According to Education, health care—including both physical and mental health care—is one of students’ basic needs, along with food, housing, and more.[3] Researchers have found that a lack of access to basic needs, including health care, can negatively affect students’ overall well-being, as well as their college enrollment, achievement, and completion.[4] Students who lack health coverage, like other individuals without coverage, may be more likely to forgo needed health care, have difficulty accessing health care, and incur high-cost health care expenses.[5] In a prior report, we found that an estimated 20 percent of students aged 18 to 23 lacked health coverage in 2006.[6]
The Patient Protection and Affordable Care Act (PPACA), which was enacted in 2010, contains several provisions expanding health coverage options that may be available to students.[7] For example, PPACA requires private health plans that offer dependent coverage—coverage for family members of the plan’s policyholder, including an adult child—to allow dependent children to remain on a parent’s health plan until age 26. In addition, students may have access to other forms of coverage, such as student health plans offered by colleges, and may be able to access health care services at on-campus student health centers.[8]
Given the varied landscape of coverage options, you asked us to review issues related to college students’ health coverage. This report describes (1) how health coverage among students has changed since the enactment of PPACA in 2010 and the barriers students face in obtaining coverage, (2) the factors selected colleges considered in deciding whether to offer health coverage and how these colleges helped students navigate their coverage options, and (3) federal agencies’ actions to support colleges’ efforts to help students obtain health coverage.
To describe how health coverage among students has changed since the enactment of PPACA in 2010, we analyzed data from the U.S. Census Bureau’s 2010 and 2022 American Community Survey.[9] Specifically, we examined overall health coverage rates and type of coverage among students aged 18 to 64, and coverage across certain student and college characteristics.[10] Respondents to the American Community Survey can select more than one type of coverage. We assigned individuals to mutually exclusive coverage type categories, including a separate category for individuals who selected more than one type of coverage.[11] For purposes of reporting, we included individuals who selected more than one type of coverage in an “other coverage” category, along with those who selected either Medicare, TRICARE, or Department of Veterans Affairs health care.
To supplement this analysis, we used the 2023 Annual Social and Economic Supplement to the Current Population Survey.[12] Specifically, for students aged 18 to 25 with private health coverage, we used the Current Population Survey data to estimate the extent to which students received coverage under their own or someone else’s health coverage.[13] Because the Census Bureau data we used are sample-based surveys, all results in this report are estimates, which we report with a 95 percent confidence interval.[14] To assess the reliability of the Census Bureau’s survey data, we reviewed documentation and interviewed agency officials about the sample, survey methodology, and potential limitations of both surveys. We determined the data were reliable for our reporting purposes.
To describe barriers students face in obtaining health coverage as well as the factors selected colleges consider in deciding whether to offer coverage and how they help students navigate different options, we interviewed administrators at a nongeneralizable sample of 12 colleges. These administrators are involved in structuring health-related requirements for students and in helping students navigate the college health system.[15] We also reviewed data and documentation from the selected colleges about their health coverage requirements, on-campus health care services, and related information communicated to students. We selected the 12 colleges to ensure variation in college sector (e.g., public, private not-for-profit, and private for-profit), size, degree program length, health coverage requirements and offerings, and other criteria.[16] The information we obtained from the selected colleges is not generalizable to all colleges nationwide.
We also interviewed or obtained written responses from representatives of 17 stakeholder groups.[17] These included organizations that represent colleges or students, organizations that focus on college affordability or access to health coverage, organizations that received Centers for Medicare & Medicaid Services (CMS) navigator grants, third-party companies that administer student health plans, and researchers.[18] In addition, we interviewed officials from Education and the Department of Health and Human Services (HHS).
We also analyzed nongeneralizable data from 235 4-year colleges that responded to a student health plan survey conducted by the American College Health Association (ACHA) for the 2022–2023 academic year.[19] To assess the reliability of these data, we reviewed available documentation, examined the data for missing information, and interviewed ACHA representatives about the survey and potential limitations. We determined that these data were sufficiently reliable for our purposes of describing the health coverage requirements and offerings of responding colleges.
To describe federal efforts related to students’ access to health coverage, we reviewed documents and interviewed Education and HHS officials.
We conducted this performance audit from August 2023 to March 2025 in accordance with generally accepted government auditing standards. Those standards require that we plan and perform the audit to obtain sufficient, appropriate evidence to provide a reasonable basis for our findings and conclusions based on our audit objectives. We believe that the evidence obtained provides a reasonable basis for our findings and conclusions based on our audit objectives.
Background
Health Coverage Options for Students
Like for other individuals, health coverage offers students financial protection from out-of-pocket spending for needed health care and is associated with improved health outcomes, lower death rates, and improved productivity, according to HHS. Even those who are generally healthy can face unexpected injuries or illnesses. For example, a broken leg can cost $7,500 to treat, and a 3-day hospital stay can cost $30,000.[20] Unaffordable medical bills can lead to medical debt, particularly for those without health coverage.[21]
Students have various options to consider for obtaining health coverage, depending on their individual circumstances. For example, students may choose to purchase a private health plan or may have access to public health coverage. Private health plans are the most common source of health coverage in the United Sates, and most Americans with private coverage have employer-sponsored plans.[22] Students may have access to an employer-sponsored plan through their own, a spouse’s, or a parent’s employer. Students may also choose to purchase a private health plan directly from an insurer. This includes student health plans that some colleges offer to their students.
Students may have access to public health coverage through Medicaid (a federal-state program that finances the delivery of health care services to certain low-income individuals) or other public options.[23] In general, individuals must be a resident of a particular state to enroll in the state’s Medicaid program and cannot be enrolled in Medicaid in more than one state at the same time.[24] According to HHS officials, states vary as to whether they consider out-of-state college students as residing in their state.[25]
PPACA contains several provisions that expanded both private and public health coverage options or improved their affordability for the overall U.S. population, including students. For example:
· Coverage under a parent’s health plan. As previously noted, PPACA requires private health plans that offer dependent coverage of children to allow such children to remain on a parent’s health plan until age 26.[26]
· Medicaid eligibility expansion. States generally must provide Medicaid eligibility to certain categories of low-income individuals, such as pregnant women, parents, and children. PPACA permitted states to expand Medicaid eligibility to certain adults who are not eligible for Medicare and whose income does not exceed 138 percent of the federal poverty level.[27] As of November 2024, 40 states and the District of Columbia expanded Medicaid eligibility (expansion states), while the remaining 10 states did not (nonexpansion states).[28]
|
Coverage Gap In states that have expanded Medicaid eligibility to certain low-income adults, individuals with incomes below the 100 percent of federal poverty level premium tax credit threshold are generally eligible for Medicaid. In states that have not expanded Medicaid eligibility, however, depending on their states’ Medicaid eligibility criteria, individuals whose incomes are below 100 percent of the federal poverty level may not be eligible for either Medicaid coverage or premium tax credits. For example, in some states, adults without dependent children are generally not eligible for Medicaid, regardless of their income. Individuals who are neither eligible for Medicaid coverage nor premium tax credits fall into what is referred to as the coverage gap. Source: Department of Health and Human Services documents. | GAO‑25‑107024 |
· Marketplaces and premium tax credits. PPACA provides for the establishment of health insurance marketplaces in each state, which are online platforms and other tools to assist consumers in comparing and selecting among health plans offered by participating private insurers. PPACA also makes federal premium tax credits available to consumers who purchase marketplace plans and do not have access to certain other coverage options, such as affordable employer-sponsored coverage or Medicaid. These premium tax credits reduce enrollees’ payments for premiums—the amount paid to enroll in health coverage—to generally be no more than a certain percentage of their household income. Premium tax credits are generally only available to households with incomes at or above 100 percent of the federal poverty level—$15,060 for a single person in the 48 contiguous states in 2024.[29]
Costs for Health Coverage and Services
There are costs associated with having and using private health plans, such as employer-sponsored, marketplace, and student health plans. In some cases, some or all of the costs for health coverage premiums may be paid for on behalf of enrollees. For employer-sponsored coverage, employers typically pay for a share of the premium costs. For consumers who purchase health coverage through health insurance marketplaces, most receive a premium tax credit, reducing the amount enrollees pay towards their premiums.[30] In contrast, individuals who purchase a private health plan directly from an insurer outside of the marketplaces, such as a student health plan, may be required to pay the full cost of the premium. In addition to premiums, individuals enrolled in private health plans typically pay some portion of the costs for care they receive by paying deductibles and out-of-pocket costs, such as copayments and coinsurance.
In addition, when individuals access medical care, private health plans typically pay an agreed-upon amount to the facilities, health care providers, and suppliers with which they contract—referred to as a provider network (or in-network providers). Private health plans may also pay for services that individuals obtain from providers that are outside of the plan’s provider network (or out-of-network providers), but individuals may be responsible for a higher proportion of costs when seeking care from an out-of-network provider compared to an in-network provider. Some health plans may offer provider networks that are nationwide or that extend across multiple states, while other plans’ networks may be limited to a specific geographic area such as a county or region within a state. See the text box for key terms related to private health coverage.
|
Key Terms Related to Private Health Coverage In-network provider: A health care provider or facility that an insurer contracts with to furnish covered health benefits to enrollees of the insurer’s plan in return for negotiated payments. Consumers will generally pay less if they see an in-network provider. Out-of-network provider: A health care provider or facility that does not have a contract with a health plan to provide services. If a plan covers out-of-network services, the consumer usually pays more than if they see an in-network provider. If a plan does not cover out-of-network services, then the consumer may, in most nonemergency instances, be responsible for paying the full amount charged by the out-of-network provider. Covered health care service: A service that the health plan pays for (in part or in full) on behalf of enrollees. Premium: The amount an enrollee pays to maintain health coverage. Deductible: The amount an enrollee pays for certain covered health care services before the plan starts to pay. With a $2,000 deductible, for example, enrollees pay the first $2,000 for covered services, after which they usually pay only a copayment or coinsurance for covered services. For all marketplace plans and most employer-sponsored plans, preventive services are generally covered in full before the deductible is met. Out-of-pocket costs: The amount enrollees pay for a covered health care service, often after a deductible has been reached. Out-of-pocket costs can include either a copayment, which is a fixed amount (e.g., $20), or coinsurance, which is a percentage of costs (e.g., 20 percent) for a covered health care service. |
Source: GAO description of Healthcare.gov and industry terms. | GAO‑25‑107024
Costs for Medicaid coverage differ from costs for private plans. For example, Medicaid premiums and cost-sharing are generally limited, and for certain Medicaid enrollees, they are prohibited altogether.[31] In addition, Medicaid benefits can generally only be used in the state in which the eligible individual is enrolled and with Medicaid-participating providers.[32]
Health Coverage Rates Among Students Have Improved, but Differences in Coverage Rates and Barriers Remain for Some Students
Health Coverage Rates Among Students Have Improved Since 2010, with the Largest Increase Among Students with Medicaid Coverage
Since the enactment of PPACA in 2010, health coverage rates among students have improved overall. Between 2010 and 2022, the percentage of students aged 18 to 64 with health coverage increased from an estimated 81 percent to 92 percent, according to our analysis of American Community Survey data.[33]
Health coverage rates increased for all subpopulations of students we examined (see table 1). For example, coverage rates increased among undergraduate students from an estimated 80 percent in 2010 to an estimated 92 percent in 2022, and among graduate students from an estimated 89 percent to 95 percent. Additionally, over this same period, coverage rates increased among students at public colleges from an estimated 80 percent to 92 percent, and among students at private colleges from an estimated 86 percent to 94 percent.
Table 1: Estimated Percentage of Students Aged 18–64 with Health Coverage by Certain Student Characteristics, 2010 and 2022
|
|
2010 |
2022 |
Change in coverage rates from 2010–2022 |
|
All students |
81.2 (0.2) |
92.3 (0.2) |
11.1 (0.3) |
|
Age |
|
|
|
|
18–22 |
84.2 (0.3) |
93.0 (0.2) |
8.9 (0.4) |
|
23–25 |
74.4 (0.7) |
91.7 (0.5) |
17.3 (0.8) |
|
26–34 |
77.5 (0.5) |
90.0 (0.4) |
12.6 (0.7) |
|
35–64 |
82.7 (0.4) |
93.3 (0.3) |
10.7 (0.6) |
|
Sex |
|
|
|
|
Female |
81.9 (0.3) |
92.6 (0.2) |
10.7 (0.4) |
|
Male |
80.4 (0.4) |
92.0 (0.2) |
11.7 (0.4) |
|
Race and ethnicitya |
|
|
|
|
American Indian or Alaskan Nativeb |
64.6 (3.0) |
81.7 (3.3) |
17.0 (4.6) |
|
Asian |
79.3 (0.8) |
93.6 (0.5) |
14.3 (0.9) |
|
Black or African American |
75.8 (0.6) |
90.3 (0.6) |
14.5 (0.7) |
|
Hispanic or Latino |
69.0 (0.7) |
86.9 (0.5) |
17.9 (0.9) |
|
Native Hawaiian and Other Pacific Islander |
75.0 (5.9) |
93.7 (3.0) |
18.6 (6.2) |
|
Some Other Race |
76.8 (4.7) |
88.2 (2.6) |
11.4 (5.5) |
|
Two or More Races |
79.7 (1.4) |
93.1 (0.8) |
13.4 (1.6) |
|
White |
85.8 (0.2) |
94.8 (0.2) |
9.0 (0.3) |
|
Marital statusc |
|
|
|
|
Married |
85.1 (0.4) |
93.5 (0.3) |
8.4 (0.5) |
|
Not married |
80.0 (0.3) |
92.0 (0.2) |
12.0 (0.3) |
|
Employment statusd |
|
|
|
|
Full-time |
86.6 (0.3) |
93.5 (0.3) |
6.9 (0.4) |
|
Part-time |
80.5 (0.5) |
92.6 (0.3) |
12.1 (0.6) |
|
Not working or unemployed |
77.8 (0.3) |
91.0 (0.3) |
13.2 (0.4) |
|
Student type |
|
|
|
|
Undergraduate |
79.6 (0.3) |
91.7 (0.2) |
12.2 (0.3) |
|
Graduate |
88.9 (0.3) |
94.6 (0.3) |
5.7 (0.5) |
|
College type |
|
|
|
|
Public |
79.7 (0.3) |
91.9 (0.2) |
12.2 (0.3) |
|
Private |
85.7 (0.4) |
93.5 (0.3) |
7.9 (0.4) |
|
Location of studentse |
|
|
|
|
Medicaid expansion states |
82.8 (0.3) |
94.1 (0.2) |
11.3 (0.3) |
|
Medicaid nonexpansion states |
77.0 (0.4) |
88.2 (0.4) |
11.2 (0.6) |
Source: GAO analysis of data from the U.S. Census Bureau’s 2010 and 2022 American Community Survey. | GAO‑25‑107024
Notes: “Students” refers to undergraduate or graduate students. All margins of error at the 95 percent confidence level for each estimate are presented in parentheses.
aCoverage rates were estimated for eight mutually exclusive racial and ethnic groups. “Hispanic or Latino” includes all students who identified their ethnicity as Hispanic or Latino regardless of race. As a result, Hispanic or Latino students may include those who identify as one or more race. All other racial groups exclude Hispanic or Latino students. “Some Other Race” refers to individuals who did not identify as any of the race categories listed on the American Community Survey.
bStudents who reported only having Indian Health Service were defined as not having health coverage because the Indian Health Service does not provide the comprehensive health care services students may need. Rather, services are generally provided only at facilities within the Indian Health Service system or that are operated by tribes. Indian Health Service facilities most commonly provide primary care and emergency care, as well as some other services. While the Indian Health Service may pay for services provided by other providers, such services are limited by the availability of funds and are often limited to life-threatening illnesses or injuries.
c”Married” refers to anyone who was reported as either currently married or separated. “Not married” includes individuals who were never married or who were divorced or widowed.
d”Employed full-time” refers to anyone who reported working 35 hours or more per week, “part-time” refers to anyone who reported working at least 1 hour but less than 35 hours per week, and “not working” refers to those who were either unemployed or not in the labor force.
e”State” generally refers to the state where the student lived for more than 2 months. In both 2010 and 2022, “Medicaid expansion states” refers to the 38 states that, as of December 2022, expanded Medicaid eligibility to certain adults who are not eligible for Medicare and whose income does not exceed 138 percent of the federal poverty level. “Medicaid nonexpansion states” refers to the 12 states that had not expanded Medicaid to this population as of that date: Alabama, Florida, Georgia, Kansas, Mississippi, North Carolina, South Carolina, South Dakota, Tennessee, Texas, Wisconsin, and Wyoming. Two states (North Carolina and South Dakota) expanded Medicaid eligibility in 2023. However, these states were not considered Medicaid expansion states for the purposes of our analysis because the most recent data available at the time of our analysis (the 2022 American Community Survey data) predated the expansion of Medicaid in these two states.
The largest increase in coverage rates was among students who had Medicaid coverage compared to students with other types of coverage (see fig. 1). Specifically, between 2010 and 2022, the percentage of students aged 18 to 64 with Medicaid coverage increased from an estimated 7 percent to 13 percent. The number and percentage of students enrolled in Medicaid in 2022 may have increased in part due to a temporary increase in federal funding available to states during the COVID-19 public health emergency.[34] However, our analysis of American Community Survey data showed that the percentage of students with Medicaid coverage also increased prior to the pandemic, from an estimated 7 percent in 2010 to 11 percent in 2019, before increasing to an estimated 13 percent in 2022.
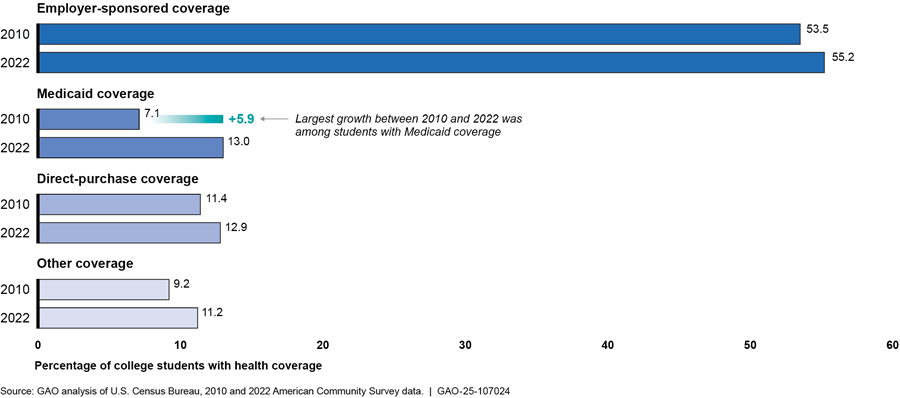
Note: “Students” refers to undergraduate or graduate students. Employer-sponsored coverage includes students who had coverage through either their own or someone else’s employer-sponsored coverage, such as a parent. “Other coverage” includes those who had health coverage through either Medicare, TRICARE, or Department of Veterans Affairs health care, as well as students who reported having more than one type of coverage. For this analysis, Medicaid includes all students who reported having means-tested public coverage, as Medicaid represents 95 percent of all means-tested coverage. Medicaid, employer-sponsored, and direct-purchase coverage types are mutually exclusive categories—that is, they include individuals who only reported having each type of coverage, respectively. All estimates have a margin of error of +/- 0.3 percentage points or less at the 95 percent level of confidence.
In comparison, employer-sponsored coverage, which remained the most common source of coverage among students, increased from an estimated 53 percent to 55 percent of students, and the percentage of students who purchased coverage directly from an insurer increased from an estimated 11 percent to 13 percent over this period (see sidebar).[35]
|
Students Obtaining Direct-Purchase Coverage A majority of students—undergraduate or graduate students—who purchased health coverage directly from an insurer did so outside of a health insurance marketplace. Specifically, an estimated 58 percent (+/- 5 percentage points) of students aged 18 to 64 with direct-purchase coverage bought their plan outside of a health insurance marketplace, according to our analysis of 2023 Current Population Survey data. This includes student health plans, which are offered by colleges outside of a marketplace. Source: GAO analysis of U.S. Census Bureau’s 2023 Current Population Survey, Annual Social and Economic Supplement data. | GAO‑25‑107024 |
Among students aged 23 to 25, the growth in health coverage rates was primarily driven by an increase in employer-sponsored coverage. Students in this age group had the largest increase in coverage rates across students of all age groups, increasing from an estimated 74 percent in 2010 to 92 percent in 2022. This group includes individuals who are now eligible under PPACA to remain on a parent’s health plan until they turn 26 (see sidebar). Among students aged 23 to 25, the percentage who had employer-sponsored coverage (which would have included coverage under a parent’s plan) increased from an estimated 44 percent in 2010 to 56 percent in 2022 (see fig. 2).
|
Most Younger Students with Private Health Coverage Were on Someone Else’s Plan According to our analysis of 2023 Current Population Survey data, an estimated 76 percent (+/- 1.8 percentage points) of younger students (undergraduate or graduate students aged 18 to 25) had private health coverage, such as employer-sponsored coverage or health coverage purchased directly from an issuer. Among these younger students, most (an estimated 80 percent, +/- 1.9 percentage points) were on someone else’s health plan, such as a parent. Source: GAO analysis of U.S. Census Bureau’s 2023 Current Population Survey, Annual Social and Economic Supplement data. | GAO‑25‑107024 |
Figure 2: Estimated Percentage of Students Aged 18–64 with Employer-Sponsored Coverage by Age Group, 2010 and 2022
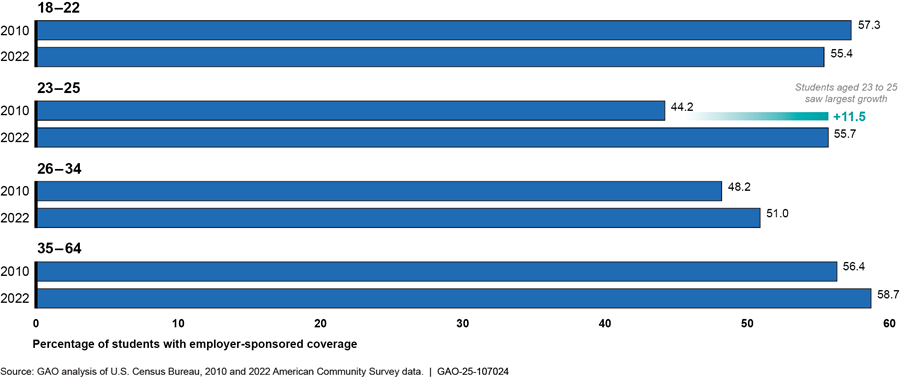
Note: “Students” refers to undergraduate or graduate students. Employer-sponsored coverage includes students who had coverage through their own or someone else’s employer-sponsored coverage, such as a parent. Individuals who reported having more than one type of health coverage, including employer-sponsored coverage, were not included in these estimates. All estimates have a margin of error of +/- 0.9 percentage points or less at the 95 percent confidence level.
Differences in Health Coverage Rates Remained for Certain Student Populations as of 2022
Although coverage rates improved from 2010 to 2022, an estimated 1.6 million students aged 18 to 64 lacked health coverage in 2022, which represented about 8 percent of all students. Differences in coverage rates remained in 2022 for (1) students from certain historically disadvantaged racial and ethnic groups, (2) students in Medicaid nonexpansion states, and (3) nonworking students aged 26 to 64.[36] For more information about the percentage of students with or without health coverage by student characteristics, see appendix I.
·
Students of certain historically disadvantaged racial and
ethnic groups. While coverage rates have improved since 2010 for all racial
and ethnic student populations we examined, American Indian or Alaskan Native,
Hispanic or Latino, and Black or African American students lacked coverage in
2022 at notably higher rates than White students (see fig. 3).[37] For example, an estimated 18 percent
of American Indian or Alaskan Native, 13 percent of Hispanic or Latino, and 10
percent of Black or African American students lacked health coverage in 2022
compared to 5 percent of White students.[38]
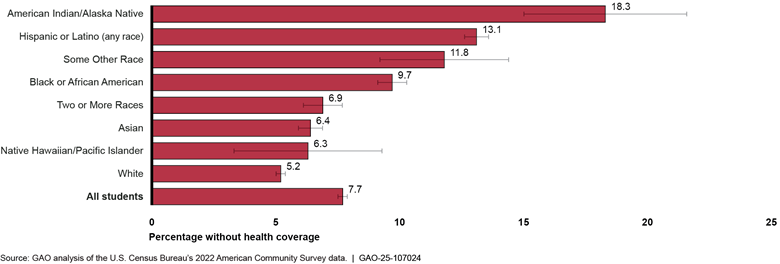
Notes: “Students” refers to undergraduate or graduate students. Coverage rates were estimated for eight mutually exclusive racial and ethnic groups. “Hispanic or Latino” includes all students who identified their ethnicity as Hispanic or Latino regardless of race. As a result, Hispanic or Latino students may include those who identify as one or more race. All other racial groups exclude Hispanic or Latino students. “Some Other Race” refers to individuals who did not identify as any of the race categories listed on the American Community Survey. Students who reported only having Indian Health Service were defined as not having health coverage because the Indian health Service does not provide the comprehensive health care services students may need. Rather, services are generally provided only at facilities within the Indian Health Service system or that are operated by tribes. Indian Health Service facilities most commonly provide primary care and emergency care. While the Indian Health Service may pay for services provided by other providers, such services are limited by the availability of funds and are often limited to life-threatening illnesses or injuries. All estimates have a margin of error of +/- 0.8 percentage points or less at the 95 percent confidence level except the following: American Indian or Alaskan Native (+/- 3.3 percentage points), Native Hawaiian or Other Pacific Islander (+/- 3.0 percentage points), and Some Other Race (2.6 percentage points).
· Students in Medicaid nonexpansion states. In 2022, students aged 18 to 64 in Medicaid nonexpansion states lacked health coverage at roughly twice the rate as those in expansion states—an estimated 12 percent of students in nonexpansion states lacked coverage compared to an estimated 6 percent of students in expansion states.[39] This difference was even greater for Hispanic or Latino students. Among these students, the percentage of those who lacked coverage in nonexpansion states (an estimated 21 percent) was more than double than in expansion states (an estimated 9 percent). For more information about health coverage rates between students in Medicaid expansion versus nonexpansion states, see appendix II.
· Nonworking students aged 26 to 64. A larger share of students aged 26 or older who were not working lacked coverage compared to similarly aged students who were working full-time. These nonworking students, given their age, generally would not be eligible under a parent’s health plan and, if not covered by a spouse’s employer-sponsored coverage, would otherwise generally not have access to employer-sponsored coverage. Specifically, among students aged 26 to 64, the share of nonworking students who lacked coverage in 2022 (an estimated 14 percent) was more than double that of students who were working full-time (an estimated 6 percent). It was also nearly double the share of younger (age 18 to 25) nonworking students who lacked coverage (an estimated 7 percent) who may be eligible to remain on a parent’s health plan.
In addition to the student populations identified in our data analysis, several stakeholders and administrators at selected colleges said that other student populations are also more likely to lack coverage. These include students who are financially independent from their parents, students who are the first in their families to attend college, and students who are attending 2-year colleges.[40]
· Financially independent students. Students who are financially independent from their parents may have a difficult time obtaining health coverage because they may not have access to a parent’s health plan, according to several stakeholders and administrators at selected colleges.[41] A few stakeholders also said that obtaining health coverage can be further complicated for these students if they need coverage not just for themselves, but also for their children.
· First-generation students. First-generation students—those who are the first in their family to go to college—may not be familiar with how to obtain or use health coverage while attending college, according to several college administrators and stakeholders. For example, one stakeholder said that the responsibility and stress of navigating available health coverage options fall on students, which can be difficult for first-generation students whose parents have not gone through this college process.
· Students at 2-year colleges. Several college administrators and stakeholders said 2-year colleges are less likely to offer a student health plan, and students may face difficulty affording coverage. A representative from a third-party company that administers student health plans noted that 2-year colleges are unlikely to offer student health plans because plan premiums are high relative to the cost of tuition and fees at many 2-year colleges. A few stakeholders said 2-year colleges are less likely than 4-year colleges to have the resources to offer a student health plan, leaving students with fewer options. A few stakeholders and college administrators noted that some students at these schools may not be able to afford health coverage, such as a student health plan if one was offered.[42]
When students do not have health coverage, they may forego medical care and experience negative educational outcomes. For example, a representative from a student group said a peer with untreated endometriosis delayed medical care until she could travel home during college breaks for care that would be paid for by her health coverage. This representative added that other students may wait to seek medical care until summer breaks when they are working and can better afford out-of-pocket costs for some health services.
Additionally, an administrator at a selected college described an instance in which a student had a health condition that caused the student to miss classes. The administrator said that this student was unable to access in-network care for this condition while at college. This could negatively affect both the student’s health and education. An administrator at another selected college said that a student she worked with who lacked coverage was diagnosed with a chronic condition. This student incurred so much medical debt while seeking treatment that he was facing challenges being able to afford tuition. This college administrator noted that students in these cases may drop out of college because they can no longer afford both their medical bills and tuition.
Students Can Face Various Barriers to Obtaining and Affording Health Coverage
Several stakeholders, college administrators, and HHS officials identified barriers students face to obtaining and maintaining health coverage, including the cost of health coverage, coverage being limited to a specific geographic area, and a lack of affordable coverage options in states that have not expanded Medicaid.
Cost of coverage. Students facing financial challenges may struggle to afford the cost of health coverage. For example, an administrator from a 2-year college shared that some of the college’s students are likely to prioritize other basic needs like food and housing over obtaining health coverage. This administrator said that 50 percent of the college’s students were experiencing food insecurity and 20 percent were experiencing homelessness. An HHS official also noted that students who struggle with the costs of coverage are more likely to put their limited income toward other more immediate needs rather than health coverage. While low-income students may be eligible for affordable health coverage through Medicaid, another college administrator said that these students can face administrative barriers to enrolling in the program. This college administrator said it can be challenging for low-income students seeking Medicaid coverage to find the correct documentation to prove income eligibility and state residency and to navigate the online enrollment system.
Lack of geographic portability. Health coverage that is limited to a specific geographic area, such as a single state or region within a state, can make it difficult for students to access care where they are—whether away at college or elsewhere. Many college administrators and stakeholders said that out-of-state students, especially those enrolled in Medicaid, may lack adequate coverage for the cost of health care while they are at college.[43] One stakeholder said this is because many health plans do not provide students with nationwide coverage, which can leave out-of-state students without access to care while they are away at college. Because of the complexity of geographic portability of coverage, a portion of the estimated 92 percent of students aged 18 to 64 who we found had health coverage in 2022 may have lacked year-round coverage if they attended college out of state (see our analysis of American Community Survey data in table 1 above).[44]
In addition, several stakeholders and college administrators said that students with Medicaid coverage who attend college outside of their home state lack adequate coverage because Medicaid generally only covers health care in the state in which they are enrolled.[45] These students must choose between remaining on Medicaid in their home state or enrolling in Medicaid in the state where they attend college. In addition, HHS officials told us that those students may not be eligible for Medicaid in the state where they attend college because the rules for Medicaid eligibility vary by state. For example, not all states allow out-of-state students to be considered state residents for purposes of determining Medicaid eligibility.
According to ACHA’s student health plan survey for the 2022–2023 academic year, 124 of the 235 responding colleges had significant concerns about students who lacked adequate coverage. When asked for the reason they had concerns, 84 of the 124 responding colleges cited students not having a provider network where the college was located. Additionally, the most common reason provided by the 20 respondents who wrote in a response was a concern for students with Medicaid coverage, particularly those who attended college out-of-state (9 of 20 colleges responded with this concern).
Lack of coverage options in Medicaid nonexpansion states. Low-income students in states that have not expanded Medicaid have limited affordable coverage options, according to several stakeholders.[46] For example, several said that students in nonexpansion states may struggle to find affordable coverage because they fall into what is referred to as the “coverage gap.” This gap occurs when individuals are not eligible for Medicaid but also do not earn enough to qualify for premium tax subsidies that reduce the amount they contribute towards their premium. In states that have not expanded Medicaid, individuals whose incomes are below 100 percent of the federal poverty level may not be eligible for either premium tax credits or Medicaid coverage, depending on their states’ Medicaid eligibility criteria; they fall into what is referred to as the Medicaid coverage gap.[47]
Officials from two CMS navigator organizations in the same nonexpansion state said students in Medicaid nonexpansion states fall into this coverage gap.[48] Officials from one navigator organization said they may recommend that low-income students who work part-time increase their work hours to earn enough to qualify for a marketplace plan premium tax credit. However, these students may then have to reduce their college enrollment to part-time. Officials from both navigator organizations also said when students fall into the coverage gap and do not have access to coverage through another source, such as enrolling in their college’s student health plan or remaining on a parent’s plan, they do not have any options for obtaining affordable coverage. In those cases, rather than connect them with coverage, these officials said they recommend that students seek care at low-cost health clinics in the area, such as Federally Qualified Health Centers.[49]
Student Needs and Costs Affected Whether Selected Colleges Offered Coverage, and a Few Colleges Shared Information on Coverage Options with Students
Several Selected Colleges Cited State Requirements or Students’ Needs as Reasons to Require and Offer Coverage, While Those Not Doing So Cited Costs
Among colleges in our review, some required and offered health coverage, while others did not. According to ACHA’s nongeneralizable student health plan survey, of 235 responding 4-year colleges, 154 offered a student health plan to domestic undergraduate students, and 120 required students to have health coverage during the 2022–2023 academic year.[50] According to the ACHA survey data, it was common for the responding colleges that had coverage requirements to also offer a student health plan (see fig. 4).
Figure 4: Responding Colleges with Health Coverage Requirements and Offerings, 2022–2023 Academic Year
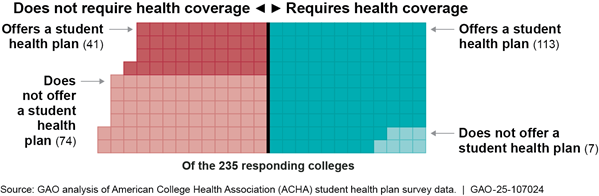
Note: The survey responses relate to health coverage requirements and student health plan offerings for domestic undergraduate students. ACHA representatives noted that colleges may be more likely to respond to their survey if they offered student health plans.
Reasons cited to require and offer coverage. Administrators at the five selected 4-year colleges that required and offered coverage said they did so to meet state requirements or support students’ success or access to health care.[51] For example:
· Administrators from three colleges noted that state regulations had at least in part driven their colleges’ decisions to require students to have health coverage and offer a health plan to students. Administrators from one of these colleges said they also require health coverage because having health care is a key determinant of student success.
· Administrators at another college said the reason their college requires health coverage and offers a student health plan is because some students may otherwise not have coverage.
· Administrators at another college that has an affiliated hospital said they offer a student health plan that covers both primary and specialty health care services to students on campus to ensure convenient access to care.
Among the 154 responding colleges in ACHA’s survey that offered a student health plan to domestic undergraduate students, 107 automatically enrolled students in their plan and then gave students various ways to opt out. For example, most responding colleges required students to provide proof of an alternate form of coverage that met a minimum standard set by the college (89 of 107 colleges), whereas most others only required students to attest that they had health coverage from an alternate source (14 of 107 colleges). Administrators we interviewed at all five selected colleges that required and offered coverage said they automatically enroll students in their student health plan and allow students with alternate forms of coverage to opt out. All five of the colleges required students to provide proof of alternate coverage; three of the colleges also verified students’ coverage information.
The reasons the selected colleges established these processes for opting out of the student health plan varied. For example, administrators from one selected college that allowed students to opt out without verifying students’ alternate coverage information said they wanted to avoid an administrative burden on students by maintaining a waiver process that is streamlined and clear. In contrast, administrators from a selected college that verified students’ alternate coverage information before allowing them to opt out of the student health plan said they did so to ensure students had adequate coverage while at college.
According to representatives from two third-party companies that administer student health plans for colleges, it is common for colleges to automatically enroll students in their health plan then allow students with alternate coverage, such as a parent’s coverage, to opt out. They said this helps ensure that there are enough students enrolled in the student health plan to keep plan costs manageable and maintain lower premium costs (see text box).
|
Student Health Plan Costs Student health plan premium costs varied across the responding colleges in ACHA’s student health plan survey. The annual premium cost for domestic undergraduate students at the responding colleges ranged from approximately $900 to more than $7,000 for the 2022–2023 academic year. The median annual premium cost among the responding colleges was about $2,700. At the five selected 4-year colleges we interviewed that required coverage and offered student health plans, annual premium costs ranged from approximately $2,800 to almost $3,600. Three of the five selected colleges that required and offered health coverage also paid for the cost of student health plan premiums for students who demonstrated a financial need. For example, one 4-year private not-for-profit college paid for the cost of premiums for students who are low-income, which an administrator estimated was around 20 percent of their undergraduate student body. However, this approach may not be feasible for all colleges. These three colleges each had endowments with more than $1 billion in assets. |
Source: GAO analysis of interviews with selected colleges and American College Health Association (ACHA) student health plan survey and Department of Education college endowment data. | GAO‑25‑107024
Reasons cited for not requiring and offering coverage. Administrators at the seven selected colleges that did not require or offer a student health plan cited two main reasons for not offering such a plan: (1) costs to either the college or students or (2) a lack of student demand for or prioritization of health coverage.[52] Administrators at several of these colleges said that they did not require coverage because they were concerned that it would increase the costs of attending college for students and did not want to create a barrier to enrollment. Additionally, one selected college encountered challenges maintaining its student health plan. This college used to offer a student health plan but stopped offering it when premiums rose so high that the plan became unaffordable for most students.
None of the three selected 2-year colleges offered a student health plan or required students to have health coverage, which an administrator at one of these colleges and a stakeholder said is common among 2-year colleges. As mentioned previously, a representative from a third-party company that administers student health plans noted that it can be challenging for 2-year colleges to offer student health plans because plan premiums are high relative to their tuition and fees. In addition, an administrator at one selected 2-year college said that he did not see a need among students for the college to offer a student health plan. Administrators at the three selected 2-year colleges noted that many of their students are low-income and may face challenges meeting basic needs. Administrators said that students in these circumstances prioritize more immediate basic needs, such as food and housing, over health coverage.
For students who lack health coverage, colleges with student health centers on campus can help provide access to certain health care services. However, stakeholders and college administrators said that student health centers do not typically provide the full range of health services students could need, and students still need health coverage to ensure access to comprehensive health care.
Nine selected colleges operated student health centers to help ensure their students had convenient access to some low- or no-cost health services while on campus, including those who lacked health coverage.[53] However, the scope of services provided at the nine student health centers varied from first aid care and referrals to local health care providers, to more comprehensive urgent and primary care services (see text box). Additionally, all 12 selected colleges provided students with some form of mental health services on campus at no cost, though the breadth of these services varied. According to one college administrator, the college provided these services due to a critical need for mental health care among students. The three selected colleges that did not have student health centers were two 2-year public colleges and one 4-year for-profit college. Administrators at these colleges said they did not have health centers because of cost considerations and a lack of student demand due to having few or no residential students.
|
Examples of Care Provided at Selected Colleges’ Student Health Centers Administrators from the nine selected colleges that provided basic health services on campus described different models of providing care and setting costs based on the needs of their students and their health center’s capacity. For example: · An administrator at one 4-year public college said the health center provided a breadth of primary and acute care services at no cost to students, regardless of whether a student has health coverage. The student health center was designed to provide affordable, preventative health care to students. The administrator said that most of the students visiting the center lacked health coverage and that only a small number of students had access to Medicaid coverage. This college was located in a state that had not expanded Medicaid eligibility to certain additional low-income adults. Additionally, this college was located in a rural area and the administrator noted that there were few health care providers that were located nearby and easily accessible to students. · Administrators at one 4-year public college said that they provided certain preventative and primary care services, such as immunizations and rapid tests for infections. They said that they charged a $20 fee for office visits and additional costs for certain services but worked with students to reduce costs based on need. · Administrators at one 2-year public college said their health center had limited financial resources and had been operating with a budget deficit for five years. They said the student health center offered some basic care, such as providing first aid services and acting as a first point of contact for students with an urgent health care need. They directed students needing further care to low-cost clinics in the surrounding area. |
Source: GAO analysis of interviews with selected colleges. | GAO‑25‑107024
While the nine selected colleges with student health centers provided certain health care services on campus, several stakeholders and college administrators noted that students need health coverage to access care beyond what health centers can typically provide. This can be important for students who require specialty care. For example, a college administrator said that students seeking specialty care, such as an appointment with a cardiologist, need to find health care providers off campus who will generally require patients to either have health coverage or to pay out-of-pocket for services before they are treated. An administrator at another selected college said that when referring students to off-campus specialists, they will help students determine whether the specialists are in-network providers for their health plan. However, a college administrator we spoke with said that it can be difficult for certain students to find in-network specialty care in the local community. This administrator explained that referring students with Medicaid coverage to specialists off campus can be challenging because there are a small number of local providers that accept Medicaid coverage, which can result in months long wait times for these specialists.
A Few Selected Colleges Shared Information with Students About Health Coverage Options and Concepts
The five selected colleges that required coverage and offered a student health plan primarily provided students with information specific to that plan, though one of these colleges provided students with other resources to help them make informed decisions about enrolling in their student health plan. In addition, across all 12 selected colleges, two colleges provided links to outside resources with information about health coverage options, and three colleges provided information to students about basic health coverage concepts, such as premiums. While the selected colleges shared health coverage information with students, students can still face challenges navigating their health coverage options because they may lack an understanding of health coverage concepts, may not prioritize obtaining health coverage, and may need to weigh complex factors to find coverage that best meets their needs, according to stakeholders and college administrators.
Information Sharing About Health Coverage Options
All five selected colleges that required and offered coverage provided students with health coverage information about their college’s student health plan. This included a summary of benefits, coverage documents, and information about enrollment deadlines.[54] Colleges shared this information with students by presenting at orientation events, distributing welcome packets for new students, and posting information on their websites.
Administrators at these five selected colleges varied in how they responded to student questions about health coverage. Administrators at two selected colleges said they answered students’ questions about Medicaid, and an administrator at another selected college said that there was an office on campus that answered students’ financial questions, including about health coverage. An administrator at another selected college said that the college provided students with a decision template where they could manually enter information about other health plans and compare it to the college’s student health plan. Additionally, administrators at one selected college said that when students wanted to compare the student health plan offered by their college to other health coverage options, they typically directed students to a third-party company that administered their student health plan. A representative from this third-party company said the company was not able to answer students’ questions about other forms of health coverage outside of the college’s student health plan.
In addition, administrators at one of these five selected colleges—a large 4-year private not-for-profit college—said that they distributed a health care decision guide with information about other health coverage options to all incoming students as part of a welcome packet. This health care decision guide compared the college’s student health plan to other health coverage scenarios for students, such as coverage under a parent’s plan. The guide is intended to help students make informed decisions about whether to enroll in the student health plan.
Across all 12 selected colleges, two provided information to students about health coverage options other than a student health plan, such as marketplace plans or Medicaid. Specifically, on their websites, both colleges provided a link to Healthcare.gov, and one provided information about premium tax credits available through a marketplace.
Information Sharing About Health Coverage Concepts
Three of the 12 selected colleges shared information with students about health coverage concepts more broadly. Two of these selected colleges educated students during new student orientation about key terms related to health plans, such as premiums, copays, coinsurance, and deductibles, according to administrators. One of these college administrators said students can be surprised by these costs. The third selected college provided general guidance on its website about key health coverage considerations, such as what a student’s total out-of-pocket costs for health care services may be and whether a plan’s provider network may be limited to a specific geographic area.
Challenges Students May Face Navigating Coverage Options
While a few selected colleges provided students with information about their coverage options or health coverage concepts more broadly, college administrators and stakeholders said students can face challenges navigating their health coverage options. Students may lack an understanding of health coverage concepts, may not prioritize obtaining health coverage, and may need to weigh complex factors to find coverage that best meets their needs. Several stakeholders and administrators from many selected colleges highlighted that many students find health coverage concepts confusing and lack an understanding of how to obtain coverage and use it to access care. According to another stakeholder, college is often the first time when students have to understand health coverage and make decisions about which option best meets their needs.
In addition, HHS officials and several college administrators and stakeholders said that it is common for students not to prioritize learning more about health coverage options because they see themselves as generally healthy and without an immediate need for coverage. A college administrator we spoke with also said that students will not seek out health coverage until they experience a health care crisis. An official from a CMS navigator organization said that helping students understand the value of preventive health care is a way to stress the importance of obtaining health coverage among a population that may feel they do not need it. However, according to several stakeholders and college administrators, it can be challenging to get students to pay attention to the coverage information that colleges share with them.
Stakeholders said students need to weigh complex factors to find coverage that best meets their needs. According to one stakeholder, the complexity of the health coverage landscape presents challenges for students when trying to find coverage that is a good fit for their individual circumstances and that also meets their college’s coverage requirements. In addition to standard health coverage considerations, such as premium costs, services covered, and whether their providers are in-network, several stakeholders said that students also need to consider a variety of personal circumstances, such as whether they have a chronic health condition that needs ongoing care. A few college administrators said students also need to consider whether a given plan will provide in-network care options while students are at home and where they plan to attend college. Several stakeholders said that students may not understand their full out-of-pocket costs when obtaining care or realize how their personal circumstances can affect those costs. These considerations can make weighing health coverage options challenging (see fig. 5).
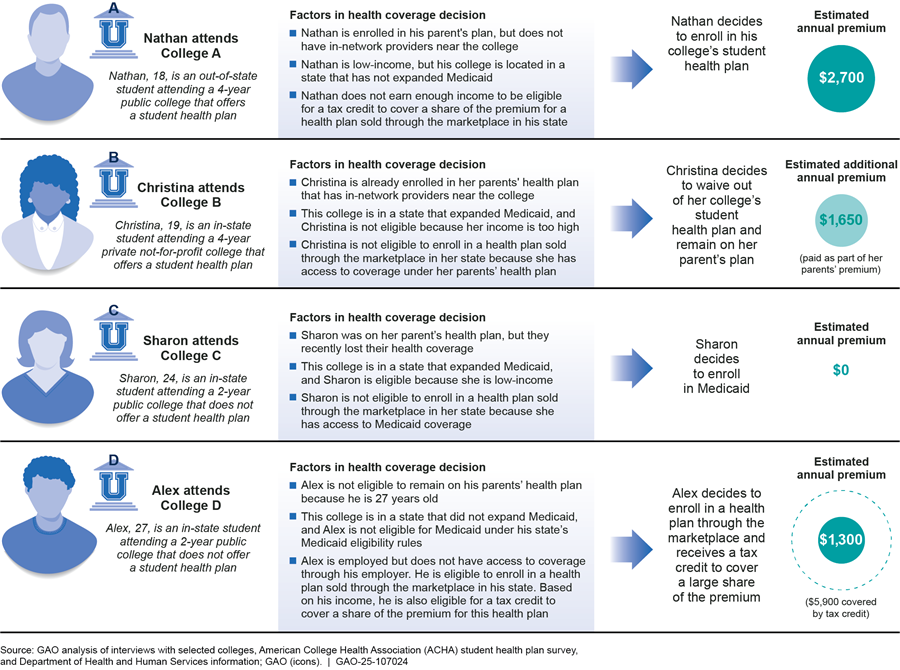
Note: “Students” refers to undergraduate or graduate students. The estimated annual premiums presented in this figure are hypothetical for illustrative purposes.
HHS and Education Have Various Efforts Related to Increasing Students’ Awareness of and Enrollment in Health Coverage
HHS has multiple efforts to reach consumers with information about health coverage options and to help enroll them in health coverage, some of which may help connect students to coverage. HHS has a webpage on Healthcare.gov guiding students through the option of enrolling in a marketplace plan. As previously discussed, a few selected colleges provided students with a link to this webpage, which includes resources for students about certain coverage options. Additionally, four navigator organizations that CMS funds are affiliated with colleges, and one of these organizations included students as one of its target populations. A representative from a navigator organization that works with students said its outreach efforts include partnering with colleges, setting up booths at new student orientation, handing out flyers about health coverage at student health centers, and working directly with students to help them enroll in coverage. HHS also has had a “Young Adult Week of Action” during which it has targeted young adults aged 18 to 34 through outreach activities to share resources about the importance of health coverage and to enroll them in coverage, among other efforts. While this effort has targeted young adults broadly, agency officials said it may reach students.[55]
In fiscal year 2021, Education launched its Basic Needs for Postsecondary Students Program, which provides colleges with financial support to create resources that help address students’ basic needs. Education officials said these basic needs include health coverage and care. Eleven colleges received funding from the Basic Needs for Postsecondary Students Program in fiscal year 2023.[56] In their proposals for how they plan to use the funding from this program, certain colleges described efforts to enhance student health centers and connect students to mental health services in the community. These colleges also described plans to use the funding to connect students to other basic needs, such as housing and food assistance. As part of this program, Education has also encouraged applicants to focus on leveraging public benefit programs.[57]
Education has also taken steps to increase students’ awareness of health coverage options. In September 2023, Education coordinated with HHS to send a letter to colleges and host a related webinar for colleges intended to encourage them to inform students with Medicaid coverage about their potential loss of coverage related to the end of the federal COVID-19 public health emergency.[58] Additionally, Education has a webpage that outlines federal benefits for which students may be eligible, including Medicaid and premium tax credits for health plans purchased through marketplaces.[59]
Agency Comments
We provided a draft of this report to Education and HHS for review and comment. Education and HHS provided technical comments, which we incorporated as appropriate.
We also provided the Census Bureau and ACHA segments of a draft of this report for technical comments. ACHA provided technical comments, which we incorporated as appropriate.
As agreed with your offices, unless you publicly announce the contents of this report earlier, we plan no further distribution until 27 days from the report date. At that time, we will send copies of this report to the appropriate congressional committees, the Secretaries of Education and Health and Human Services, and other interested parties. In addition, the report will be available at no charge on the GAO website at http://www.gao.gov.
If you or your staff have any questions about this report, please contact Melissa Emrey-Arras at (202) 512-7215 or emreyarrasm@gao.gov or John E. Dicken at (202) 512-7114 or dickenj@gao.gov. Contact points for Offices of Congressional Relations and Public Affairs may be found on the last page of this report. GAO staff who made key contributions to this report are listed in appendix III.

Melissa Emrey-Arras
Director, Education, Workforce, and Income Security

John E. Dicken
Director, Health Care
The Patient Protection and Affordable Care Act (PPACA), enacted in 2010, contains several provisions that expanded or improved the affordability of health coverage options for the overall U.S. population, including students.[60] See table 2 for information about how health coverage rates among students aged 18 to 64 changed between 2010 and 2022.
Table 2: Estimated Number of Students Aged 18–64 and Percent with or without Health Coverage, by Student and College Characteristics, 2010 and 2022
|
|
Number of students (in thousands) |
Percent with health coverage |
Percent without health coverage |
|||
|
|
2010 |
2022 |
2010 |
2022 |
2010 |
2022 |
|
All students |
23,126 (103) |
20,668 (102) |
81.2 (0.2) |
92.3 (0.2) |
18.8 (0.2) |
7.7 (0.2) |
|
Age |
|
|
|
|
|
|
|
18–22 |
10,970 (66) |
10,375 (66) |
84.2 (0.3) |
93.0 (0.2) |
15.8 (0.3) |
7.0 (0.2) |
|
23–25 |
3,190 (46) |
2,797 (52) |
74.4 (0.7) |
91.7 (0.5) |
25.6 (0.7) |
8.3 (0.5) |
|
26–34 |
4,590 (51) |
3,904 (56) |
77.5 (0.5) |
90.0 (0.4) |
22.5 (0.5) |
10.0 (0.4) |
|
35–64 |
4,376 (53) |
3,591 (46) |
82.7 (0.4) |
93.3 (0.3) |
17.3 (0.4) |
6.7 (0.3) |
|
Sex |
|
|
|
|
|
|
|
Female |
13,026 (78) |
11,560 (77) |
81.9 (0.3) |
92.6 (0.2) |
18.1 (0.3) |
7.4 (0.2) |
|
Male |
10,100 (63) |
9,108 (63) |
80.4 (0.4) |
92.0 (0.2) |
19.6 (0.4) |
8.0 (0.2) |
|
Race/ethnicitya |
|
|
|
|
|
|
|
American Indian or Alaskan Nativeb |
143 (9) |
89 (7) |
64.6 (3.0) |
81.7 (3.3) |
35.4 (3.0) |
18.3 (3.3) |
|
Asian |
1,679 (25) |
1,841 (32) |
79.3 (0.8) |
93.6 (0.5) |
20.7 (0.8) |
6.4 (0.5) |
|
Black or African American |
3,426 (51) |
2,844 (50) |
75.8 (0.6) |
90.3 (0.6) |
24.2 (0.6) |
9.7 (0.6) |
|
Hispanic or Latino |
3,215 (50) |
4,063 (55) |
69.0 (0.7) |
86.9 (0.5) |
31.0 (0.7) |
13.1 (0.5) |
|
Native Hawaiian or Other Pacific Islander |
39 (5) |
33 (4) |
75.0 (5.9) |
93.7 (3.0) |
25.0 (5.9) |
6.3 (3.0) |
|
Some Other Race |
58 (7) |
140 (11) |
76.8 (4.7) |
88.2 (2.6) |
23.2 (4.7) |
11.8 (2.6) |
|
Two or More Races |
550 (24) |
994 (30) |
79.7 (1.4) |
93.1 (0.8) |
20.3 (1.4) |
6.9 (0.8) |
|
White |
14,014 (79) |
10,664 (79) |
85.8 (0.2) |
94.8 (0.2) |
14.2 (0.2) |
5.2 (0.2) |
|
Marital statusc |
|
|
|
|
|
|
|
Married |
5,421 (73) |
4,300 (57) |
85.1 (0.4) |
93.5 (0.3) |
14.9 (0.4) |
6.5 (0.3) |
|
Not married |
17,705 (86) |
16,368 (92) |
80.0 (0.3) |
92.0 (0.2) |
20.0 (0.3) |
8.0 (0.2) |
|
Employment statusd |
|
|
|
|
|
|
|
Full-time |
6,880 (73) |
7,091 (83) |
86.6 (0.3) |
93.5 (0.3) |
13.4 (0.3) |
6.5 (0.3) |
|
Part-time |
6,560 (64) |
5,985 (60) |
80.5 (0.5) |
92.6 (0.3) |
19.5 (0.5) |
7.4 (0.3) |
|
Not working |
9,685 (84) |
7,592 (69) |
77.8 (0.3) |
91.0 (0.3) |
22.2 (0.3) |
9.0 (0.3) |
|
Student type |
|
|
|
|
|
|
|
Undergraduate |
19,054 (100) |
16,187 (92) |
79.6 (0.3) |
91.7 (0.2) |
20.4 (0.3) |
8.3 (0.2) |
|
Graduate |
4,072 (57) |
4,481 (60) |
88.9 (0.3) |
94.6 (0.3) |
11.1 (0.3) |
5.4 (0.3) |
|
Type of college |
|
|
|
|
|
|
|
Public |
17,241 (100) |
15,208 (87) |
79.7 (0.3) |
91.9 (0.2) |
20.3 (0.3) |
8.1 (0.2) |
|
Private |
5,885 (71) |
5,460 (63) |
85.7 (0.4) |
93.5 (0.3) |
14.3 (0.4) |
6.5 (0.3) |
|
Location of studentse |
|
|
|
|
|
|
|
Medicaid expansion state |
16,584 (75) |
14,468 (88) |
82.8 (0.3) |
94.1 (0.2) |
17.2 (0.3) |
5.9 (0.2) |
|
Medicaid nonexpansion state |
6,542 (59) |
6,200 (61) |
77.0 (0.4) |
88.2 (0.4) |
23.0 (0.4) |
11.8 (0.4) |
Source: GAO analysis of data from the U.S. Census Bureau’s 2010 and 2022 American Community Survey. | GAO‑25‑107024
Notes: “Students” refers to undergraduate or graduate students. All margins of error at the 95 percent confidence level for each estimate are presented in parentheses.
aCoverage rates were estimated for eight mutually exclusive racial and ethnic groups. “Hispanic or Latino” includes all students who identified their ethnicity as Hispanic or Latino regardless of race. As a result, Hispanic or Latino students may include those who identify as one or more race. All other racial groups exclude Hispanic or Latino students. “Some Other Race” refers to individuals who did not identify as any of the race categories listed on the American Community Survey.
bStudents who reported only having Indian Health Service were defined as not having health coverage because the Indian Health Service does not provide comprehensive health care services students may need. Rather, services are generally provided only by facilities within the Indian Health Service system or that are operated by tribes. Indian Health Service facilities most commonly provide primary care and emergency care, as well as some other services. While the Indian Health Service may pay for services provided by other providers, such services are limited by the availability of funds and are often limited to life-threatening illnesses or injuries.
c”Married” refers to anyone who was reported as either currently married or separated. “Not married” includes individuals who were never married or who were divorced or widowed.
d”Employed full-time” refers to anyone who reported working 35 hours or more per week, “part-time” refers to anyone who reported working at least 1 hour but less than 35 hours per week, and “not working” refers to those who were either unemployed or not in the labor force.
e”State” generally refers to the state where the student lived for more than 2 months. In both 2010 and 2022, “Medicaid expansion state” refers to the 38 states that, as of December 2022, expanded Medicaid eligibility to certain adults who are not eligible for Medicare and whose income does not exceed 138 percent of the federal poverty level. “Medicaid nonexpansion state” refers to the 12 states that had not expanded Medicaid to this population as of that date: Alabama, Florida, Georgia, Kansas, Mississippi, North Carolina, South Carolina, South Dakota, Tennessee, Texas, Wisconsin, and Wyoming. Two states—North Carolina and South Dakota—expanded Medicaid eligibility in 2023. However, these states were not considered Medicaid expansion states for the purposes of our analysis because the most recent data available at the time of our analysis—the 2022 American Community Survey data—predated the expansion of Medicaid in these two states.
The Patient Protection and Affordable Care Act (PPACA) permitted states to expand Medicaid eligibility to certain adults who are not eligible for Medicare and whose income does not exceed 138 percent of the federal poverty level.[61] Table 3 provides information about health coverage rates, as of 2022, among students aged 18 to 64 in states that expanded Medicaid eligibility to this population compared to similarly aged students in states that had not expanded Medicaid eligibility.[62]
Table 3: Estimated Health Coverage Rates Among Students Aged 18–64 in States that Had or Had Not Expanded Medicaid, 2022
|
|
Students in Medicaid expansion states |
Students in Medicaid nonexpansion states |
||
|
|
Percent with health coverage |
Percent without health coverage |
Percent with health coverage |
Percent without health coverage |
|
All students |
94.1 (0.2) |
5.9 (0.2) |
88.2 (0.4) |
11.8 (0.4) |
|
Age |
|
|
|
|
|
18–22 |
94.8 (0.2) |
5.2 (0.2) |
89.0 (0.5) |
11.0 (0.5) |
|
23–25 |
93.5 (0.6) |
6.5 (0.6) |
87.4 (1.1) |
12.6 (1.1) |
|
26–34 |
92.3 (0.4) |
7.7 (0.4) |
84.5 (1.1) |
15.5 (1.1) |
|
35–64 |
94.7 (0.3) |
5.3 (0.3) |
90.4 (0.8) |
9.6 (0.8) |
|
Sex |
|
|
|
|
|
Female |
94.5 (0.2) |
5.5 (0.2) |
88.4 (0.5) |
11.6 (0.5) |
|
Male |
93.7 (0.3) |
6.3 (0.2) |
87.9 (0.5) |
12.1 (0.5) |
|
Race/ethnicitya |
|
|
|
|
|
American Indian or Alaskan Nativeb |
81.8 (3.4) |
18.2 (3.4) |
81.4 (6.6) |
18.6 (6.6) |
|
Asian |
94.4 (0.5) |
5.6 (0.5) |
90.1 (1.3) |
9.9 (1.3) |
|
Black or African American |
93.1 (0.7) |
6.9 (0.7) |
86.7 (1.0) |
13.3 (1.0) |
|
Hispanic or Latino |
90.8 (0.5) |
9.2 (0.5) |
78.9 (1.1) |
21.1 (1.1) |
|
Native Hawaiian or Other Pacific Islander |
93.9 (3.3) |
6.1 (3.3) |
91.7 (8.3) |
8.3 (9.7) |
|
Some Other Race |
89.8 (2.8) |
10.2 (2.8) |
84.2 (6.3) |
15.8 (6.3) |
|
Two or More Races |
94.4 (0.7) |
5.6 (0.7) |
89.7 (2.0) |
10.3 (2.0) |
|
White |
95.6 (0.2) |
4.4 (0.2) |
92.6 (0.5) |
7.4 (0.5) |
|
Marital statusc |
|
|
|
|
|
Married |
94.8 (0.3) |
5.2 (0.3) |
90.7 (0.6) |
9.3 (0.6) |
|
Not married |
93.9 (0.2) |
6.1 (0.2) |
87.5 (0.4) |
12.5 (0.4) |
|
Employment statusd |
|
|
|
|
|
Full-time |
95.0 (0.3) |
5.0 (0.3) |
90.4 (0.6) |
9.6 (0.6) |
|
Part-time |
94.4 (0.3) |
5.6 (0.3) |
87.9 (0.7) |
12.1 (0.7) |
|
Not working |
93.1 (0.3) |
6.9 (0.3) |
86.2 (0.7) |
13.8 (0.7) |
|
Student type |
|
|
|
|
|
Undergraduate |
93.7 (0.2) |
6.3 (0.2) |
87.1 (0.4) |
12.9 (0.4) |
|
Graduate |
95.4 (0.3) |
4.6 (0.3) |
92.5 (0.6) |
7.5 (0.6) |
|
Type of college |
|
|
|
|
|
Public |
93.8 (0.2) |
6.2 (0.2) |
88.0 (0.4) |
12.0 (0.4) |
|
Private |
95.0 (0.3) |
5.0 (0.3) |
88.9 (0.7) |
11.1 (0.7) |
Source: GAO analysis of the U.S. Census Bureau’s 2010 and 2022 American Community Survey. | GAO‑25‑107024
Notes: “Students” refers to undergraduate or graduate students. “State” generally refers to the state where the student lived for more than 2 months. In both 2010 and 2022, “Medicaid expansion state” refers to the 38 states that, as of December 2022, expanded Medicaid eligibility to certain adults who are not eligible for Medicaid and whose income does not exceed 138 percent of the federal poverty level. “Medicaid nonexpansion state” refers to the 12 states that had not expanded Medicaid to this population as of that date: Alabama, Florida, Georgia, Kansas, Mississippi, North Carolina, South Carolina, South Dakota, Tennessee, Texas, Wisconsin, and Wyoming. Two states—North Carolina and South Dakota—expanded Medicaid eligibility in 2023. However, these states were not considered Medicaid expansion states for the purposes of our analysis because the most recent data available at the time of our analysis—the 2022 American Community Survey data—predated the expansion of Medicaid in these two states. All margins of error at the 95 percent confidence level for each estimate are presented in parentheses.
aCoverage rates were estimated for eight mutually exclusive racial and ethnic groups. “Hispanic or Latino” includes all students who identified their ethnicity as Hispanic or Latino regardless of race. As a result, Hispanic or Latino students may include those who identify as one or more race. All other racial groups exclude Hispanic or Latino students. “Some Other Race” refers to individuals who did not identify as any of the race categories listed on the American Community Survey.
bStudents who reported only having Indian Health Service were defined as not having health coverage because the Indian health Service does not provide comprehensive health care services students may need. Rather, services are generally provided only by facilities within the Indian Health Service system or that are operated by tribes. Indian Health Service facilities most commonly provide primary care and emergency care, as well as some other services. While the Indian Health Service may pay for services provided by other providers, such services are limited by the availability of funds and are often limited to life-threatening illnesses or injuries.
c”Married” refers to anyone who was reported as either currently married or separated. Not married includes individuals who were never married or who were divorced or widowed.
d”Employed full-time” refers to anyone who reported working 35 hours or more per week, “part-time” refers to anyone who reported working at least 1 hour but less than 35 hours per week, and “not working” refers to those who were either unemployed or not in the labor force.
GAO Contacts
Melissa Emrey-Arras, (202) 512-7215 or emreyarrasm@gao.gov
John E. Dicken, (202) 512-7114 or dickenj@gao.gov
Staff Acknowledgements
In addition to the contacts named above, Michael Kniss (Assistant Director), Gerardine Brennan (Assistant Director), Mary Edgerton (Analyst-in-Charge), Katie Mack (Analyst-in-Charge), Michael Alleyne, Angelica Guarino, Serena Lo, Jeffrey Tamburello, and Ravi Sharma made key contributions to this report. James Bennett, Elizabeth Calderon, Jen Cook, Andrew Emmons, Jon Muchin, Emei Li, Stacia Odenwald, Jennifer Rudisill, Meg Sommerfeld, Adam Wendel, and Emily Wilson Schwark, also contributed to this report.
The Government Accountability Office, the audit, evaluation, and investigative arm of Congress, exists to support Congress in meeting its constitutional responsibilities and to help improve the performance and accountability of the federal government for the American people. GAO examines the use of public funds; evaluates federal programs and policies; and provides analyses, recommendations, and other assistance to help Congress make informed oversight, policy, and funding decisions. GAO’s commitment to good government is reflected in its core values of accountability, integrity, and reliability.
Obtaining Copies of GAO Reports and Testimony
The fastest and easiest way to obtain copies of GAO documents at no cost is through our website. Each weekday afternoon, GAO posts on its website newly released reports, testimony, and correspondence. You can also subscribe to GAO’s email updates to receive notification of newly posted products.
Order by Phone
The price of each GAO publication reflects GAO’s actual cost of production and distribution and depends on the number of pages in the publication and whether the publication is printed in color or black and white. Pricing and ordering information is posted on GAO’s website, https://www.gao.gov/ordering.htm.
Place orders by calling (202) 512-6000, toll free (866) 801-7077,
or
TDD (202) 512-2537.
Orders may be paid for using American Express, Discover Card, MasterCard, Visa, check, or money order. Call for additional information.
Connect with GAO
Connect with GAO on Facebook, Flickr, X, and YouTube.
Subscribe to our RSS Feeds or Email Updates. Listen to our Podcasts.
Visit GAO on the web at https://www.gao.gov.
To Report Fraud, Waste, and Abuse in Federal Programs
Contact FraudNet:
Website: https://www.gao.gov/about/what-gao-does/fraudnet
Automated answering system: (800) 424-5454 or (202) 512-7700
Congressional Relations
A. Nicole Clowers, Managing Director, ClowersA@gao.gov, (202) 512-4400, U.S. Government Accountability Office, 441 G Street NW, Room 7125, Washington, DC 20548
Public Affairs
Sarah Kaczmarek, Managing Director, KaczmarekS@gao.gov, (202) 512-4800, U.S.
Government Accountability Office, 441 G Street NW, Room 7149
Washington, DC 20548
Strategic Planning and External Liaison
Stephen J. Sanford, Managing
Director, spel@gao.gov, (202) 512-4707
U.S. Government Accountability Office, 441 G Street NW, Room 7814, Washington,
DC 20548
[1]For purposes of this report, “colleges” refers to 2- and 4-year degree-granting institutions. Unless otherwise noted, “students” refers to undergraduate or graduate students enrolled in one of these institutions. Data on enrollment and degree-granting colleges are from Department of Education, National Center for Education Statistics, Digest of Education Statistics, 2023, tables 303.10 (December 2023) and 317.10 (January 2024); these were the most recent Education data available at the time of our study.
[2]Department of Education, Fiscal Year 2023 Federal Student Aid Annual Report (Washington, D.C.: Nov. 16, 2023).
[3]Education has identified six categories of basic needs for students: food assistance, housing, transportation, health (including physical and mental health), child care, and technology.
[4]Sam Riggs and Michelle Hodara, Exploring the Reach and Impact of Basic Needs Services at Postsecondary Institutions: Learnings from a Multi-State Evaluation in 2020–21 and 2021–22 (Portland, Ore.: Education Northwest, 2024).
[5]Health coverage reduces an individual’s costs for covered services when medical treatment is needed.
[6]GAO, Health Insurance: Most College Students Are Covered through Employer-Sponsored Plans, and Some Colleges and States Are Taking Steps to Increase Coverage, GAO‑08‑389 (Washington, D.C.: Mar. 28, 2008).
[7]See Pub. L. No. 111-148, 124 Stat. 119 (2010), as amended by the Health Care and Education Reconciliation Act of 2010, Pub. L. No. 111-152, 124 Stat. 1029. In this report, any references to PPACA include any amendments made by the Health Care and Education Reconciliation Act of 2010.
[8]Student health insurance coverage is a type of individual health coverage provided by a private health insurance issuer that has contracted with a college and has agreed to provide coverage to enrolled students and their dependents. See 42 C.F.R. § 147.145 (2024). For the purposes of this report, we refer to this type of coverage as “student health plans.”
[9]The 2022 American Community Survey was the most recent year of this survey data available at the time of our analysis.
[10]We focused on students aged 18 to 64 because a greater share of children younger than 18 years old and individuals aged 65 or older have public coverage, such as Medicaid and Medicare. Although most college students are younger than age 25, we included older students because, as of academic year 2021, a third of all students (or 6.4 million) were aged 25 or older and they may face different challenges obtaining health coverage than younger students who, under PPACA, may be eligible to remain on a parent’s health plan until age 26.
[11]The American Community Survey collects data on eight broad types of health coverage: employer-sponsored coverage, direct-purchase plans, TRICARE or other military health care, Medicare, means-tested public coverage, Department of Veterans Affairs health care, and Indian Health Service. The term “direct-purchase plan” refers to plans purchased by an individual directly from a private health insurer either through a marketplace—an online platform that assists consumers in comparing and selecting among health plans offered by participating private issuers as established by PPACA—or outside of a marketplace. Means-tested coverage refers to Medicaid (also referred to as “Medical Assistance”) or any kind of government-assistance health plan for those with low incomes or a disability. For this analysis, we refer to means-tested public coverage as Medicaid coverage—Medicaid represents 95 percent of all means-tested coverage.
[12]The Current Population Survey, sponsored jointly by the Census Bureau and the Bureau of Labor Statistics, is a nationally representative monthly survey administered by the Census Bureau. The 2023 Annual Social and Economic Supplement to the Current Population Survey was the most recent year of this survey data available at the time of our analysis.
[13]The estimates of overall health coverage rates among students were similar between the American Community Survey and the Current Population Survey.
[14]All percentage estimates from the American Community Survey have margins of error at the 95 percent confidence level at +/- 1.1 percentage point or less, unless otherwise noted. All other numerical estimates from this survey have margins of error within +/- 2.2 percent of those numerical estimates, unless otherwise noted.
[15]Throughout the report, we use the following terms to refer to the approximate number of selected colleges where administrators expressed a particular viewpoint: “few” refers to two to three colleges, “several” refers to four to six colleges, and “many” refers to seven to 11 colleges.
[16]Other criteria considered when selecting these colleges included whether the college was located in a state that, as of December 2022, had expanded Medicaid eligibility to certain low-income adults; geographic variation; selection of at least one college with a self-funded student health benefit plan; and selection of at least one college that works with a third-party company to administer its student health plan. Our selected colleges included four 4-year public colleges, four 4-year private not-for-profit colleges, one 4-year for-profit college, and three 2-year public colleges. Eight of our selected colleges were located in states that had expanded Medicaid eligibility to certain low-income adults (expansion states) and four were located in states that had not. Our final selection also included one Historically Black College and University and one Native American-Serving, Nontribal Institution.
[17]Throughout the report, we use the following broader terms to refer to the approximate number of stakeholders who expressed a particular viewpoint: “few” refers to two to three and “several” refers to four or more. We use these broad descriptors due to the wide variation in stakeholder types. We also use these broad descriptors when referring to statements made by both stakeholders and college administrators.
[18]PPACA required all health insurance marketplaces to establish navigator programs to conduct public education activities to raise awareness of the availability of coverage through marketplaces, among other things. See 42 U.S.C. § 18031(i). Each year, CMS makes grant awards to organizations who serve as navigators to help consumers determine their eligibility for affordable health coverage options and enroll in coverage through the marketplaces. Representatives we spoke with from third-party companies serve as student health plan administrators, brokers, and consultants.
[19]The American College Health Association (ACHA) is an organization that represents about 950 colleges and nearly 12,000 health care professionals who serve college populations, according to ACHA representatives. ACHA representatives said that 94 percent of its member colleges are 4-year colleges. They also said that ACHA administered its student health plan survey to its 4-year member institutions, as well as other 4-year colleges that are not ACHA members. ACHA’s survey data from the 2022-2023 academic year was the most recent data available at the time of our study.
[20]“People under 30: Why bother with health insurance?”, HealthCare.gov, Department of Health and Human Services, accessed on Jan. 14, 2025, https://www.healthcare.gov/young-adults/ready-to-apply/.
[21]Among adults under age 65, a greater percentage without health coverage reported having health care debt than those with coverage, according to a 2022 KFF survey. In addition, the survey found that most adults with medical debt reported that it was due to a one-time or short-term medical expense, such as a single hospital visit or treatment for an accident. Lunna Lopes, Audrey Kearney, Alex Montero, Liz Hamel, and Mollyann Brodie, Health Care Debt in the U.S.: The Broad Consequences of Medical and Dental Bills (San Francisco, CA: KFF, June 16, 2022).
[22]Employer-sponsored coverage is health coverage offered by employers to their employees; it often includes coverage for an employee’s family.
[23]Certain students aged 18 to 64 may also be eligible for other public options that include Medicare, TRICARE, or the Department of Veterans Affairs health care.
[24]See 42 C.F.R. § 435.403 (2024).
[25]States have the flexibility to determine whether individuals who are in their state solely for the purposes of education are state residents. If the state does not establish a policy regarding individuals who are in the state solely to attend school, then out-of-state students may be considered state residents.
[26]Prior to PPACA, employer-sponsored plans traditionally extended coverage to dependents through age 18, and generally continued coverage for dependents through age 22 only if they attended college full-time.
[27]In 2024, 138 percent of the federal poverty level for a single person was $20,783. States that choose to expand Medicaid eligibility to certain low-income adults receive an increased federal match for expenditures incurred to provide services to individuals who would not have been previously covered in the state.
[28]As of November 2024, the following 10 states had not opted to expand Medicaid eligibility: Alabama, Florida, Georgia, Kansas, Mississippi, South Carolina, Tennessee, Texas, Wisconsin, and Wyoming.
[29]Under PPACA, premium tax credits were generally available to individuals with household incomes from 100 to 400 percent of the federal poverty level. However, the American Rescue Plan Act of 2021 made temporary changes to premium tax credits that, among other things, expanded eligibility for premium tax credits to include certain individuals and families with incomes at or above 400 percent of the federal poverty level for tax years 2021 and 2022. The law also increased the premium tax credit amounts for individuals and families, resulting in access to certain plans with no premium contributions for those earning 100 to 150 percent of the federal poverty level. See Pub. L. No. 117-2, § 9661, 135 Stat. 4, 182. The Inflation Reduction Act of 2022 extended these provisions through the end of tax year 2025. See Pub. L. No. 117-169, § 12001, 136 Stat. 1818, 1905.
[30]In 2024, 92 percent of marketplace plan enrollees received a premium tax credit, reducing the amount enrollees paid toward their premiums from $605 to $111 per month, on average. Further, 44 percent of all marketplace plan enrollees had a premium less than or equal to $10 per month. CMS, Health Insurance Marketplaces 2024 Open Enrollment Report (Baltimore, Md.: Mar. 22, 2024).
[31]The maximum amount of out-of-pocket costs that states are allowed to charge Medicaid enrollees can vary by income and are generally capped at 5 percent of enrollees’ monthly or quarterly household income. In addition, certain Medicaid enrollees, such as children under 18 years of age and pregnant women, are exempt from out-of-pocket cost requirements.
[32]States must pay for Medicaid enrollees’ out-of-state health care services as if they were in-state services in certain circumstances, such as if the Medicaid enrollee needs emergency medical care while traveling out of state. In general, states must screen and enroll providers before providing Medicaid payments for their services.
[33]In both 2010 and 2022, health coverage rates were greater among students aged 18 to 64 who were enrolled in college compared to others of the same age who were not enrolled in college. Specifically, an estimated 78 percent of individuals aged 18 to 64 who were not enrolled in college had coverage in 2010 and an estimated 90 percent had coverage in 2022.
[34]The largest increase in the number of students with coverage was also among those with Medicaid coverage, compared to other types of coverage. For example, an estimated 1.6 million students had Medicaid coverage in 2010 and an estimated 2.7 million students had Medicaid coverage in 2022. Typically, states must redetermine eligibility for Medicaid enrollees on an annual basis and disenroll those who are no longer eligible. To receive the temporary increase in federal funding during the public health emergency, states were required to keep enrollees continuously enrolled in Medicaid. See Pub. L. No. 116-127, div. F, § 6008, 134 Stat. 178, 208 (2020). This contributed to overall Medicaid enrollment growing by more than 30 percent between February 2020 and February 2023. CMS, “February 2023 Medicaid and CHIP Enrollment Trends Snapshot,” accessed Dec. 4, 2024, https://www.medicaid.gov/medicaid/program-information/medicaid-chip-enrollment-data/medicaid-and-chip-enrollment-trend-snapshot/index.html.
[35]In 2019, prior to the pandemic and the 2020 economic recession, the percentage of students with employer-sponsored coverage was 57 percent and 12 percent were enrolled in coverage purchased directly from a private health insurer either through a health insurance marketplace or outside of a marketplace. Beginning in 2021, some students or their families who did not have access to certain other coverage options, such as affordable employer-sponsored coverage, may have been eligible for enhanced premium tax credits made available through the American Rescue Plan Act of 2021 to help pay for a private health plan purchased directly through a health insurance marketplace.
[36]In this report, the term “historically disadvantaged racial or ethnic group” includes the following categories: Black or African American, Hispanic or Latino (of any race), Asian, American Indian or Alaska Native, Native Hawaiian or Other Pacific Islander, Some Other Race, and Two or More Races.
[37]We considered students who reported only having Indian Health Service as not having health coverage because the Indian Health Service does not provide the comprehensive health care services students may need. Rather, services are generally provided only at facilities within the Indian Health Service system or that are operated by tribes. Indian Health Service facilities most commonly provide primary care and emergency care. While the Indian Health Service may pay for services provided by other providers, such services are limited by the availability of funds and are often limited to life-threatening illnesses or injuries. We estimated coverage rates for eight mutually exclusive racial and ethnic groups: Hispanic or Latino (of any race), non-Hispanic White, non-Hispanic Black or African American, non-Hispanic American Indian or Alaska Native, non-Hispanic Asian, non-Hispanic Native Hawaiian or Other Pacific Islander, non-Hispanic students who identified as Some Other Race, and non-Hispanic students who were of two more races. “Some Other Race” refers to individuals who did not identify as any of the race categories listed on the American Community Survey.
[38]For the estimated percent of American Indian or Alaskan Native students who lacked health coverage in 2022, the margin of error at the 95 percent confidence level was +/- 3.3 percentage points.
[39]“State” generally refers to the state where the student lived for more than 2 months. “Medicaid expansion states” refers to the 38 states that, as of December 2022, expanded Medicaid eligibility to certain adults who are not eligible for Medicare and whose income does not exceed 138 percent of the federal poverty level. “Medicaid nonexpansion states” refers to the 12 states that had not expanded Medicaid to this population as of that date: Alabama, Florida, Georgia, Kansas, Mississippi, North Carolina, South Carolina, South Dakota, Tennessee, Texas, Wisconsin, and Wyoming. Two states—North Carolina and South Dakota—expanded Medicaid eligibility in 2023. However, these states were not considered Medicaid expansion states for the purposes of our analysis because the most recent data we had available at the time of our analysis—the 2022 American Community Survey data—predates the expansion of Medicaid in these two states.
[40]The American Community Survey and Current Population Survey did not collect data on these specific student populations. Additionally, other available surveys with more detailed information about these student populations did not collect information about their health coverage status.
[41]Under PPACA, a plan or issuer may not deny or restrict dependent coverage for a child younger than age 26 based on the presence or absence of the child’s financial dependency on the plan participant, primary policyholder, or any other person. 42 C.F.R. § 147.120(b) (2024).
[42]Students at certain 4-year colleges that lack resources to offer a student health plan may face similar challenges obtaining health coverage.
[43]In-state students can also have limited access to in-network coverage while attending college, according to one stakeholder. For example, a health plan with a provider network that is limited to a specific region within the state may not cover the student while they are at college elsewhere in the state.
[44]In fall 2022, an estimated 21 percent of first-time degree-seeking undergraduate students attended college in a state other than their home state. U.S. Department of Education, National Center for Education Statistics, Digest of Education Statistics, 2023, table 309.10 (January 2024).
[45]In general, Medicaid beneficiaries must be residents of the state in which they receive Medicaid and cannot be enrolled in more than one state at the same time.
[46]As of November 2024, 10 states had not expanded Medicaid eligibility.
[47]According to research released in 2024 from KFF using data from 2022, an estimated 1.5 million people living in the ten states that had not opted to expand Medicaid as of the publication of their research fell into this coverage gap. Patrick Drake, Jennifer Tolbert, Robin Rudowitz, and Anthony Damico, How Many Uninsured Are in the Coverage Gap and How Many Could be Eligible if All States Adopted the Medicaid Expansion? (Washington, D.C.: KFF, February 26, 2024), accessed December 4, 2024, https://www.kff.org/medicaid/issue-brief/how-many-uninsured-are-in-the-coverage-gap-and-how-many-could-be-eligible-if-all-states-adopted-the-medicaid-expansion/.
[48]Navigators, as established in PPACA, are federally certified entities and individuals that help consumers determine their eligibility for affordable health coverage options and enroll in coverage through the marketplaces.
[49]Federally Qualified Health Centers are federally funded not-for-profit health centers or clinics that serve medically underserved areas and populations. The fees for services at a Federally Qualified Health Center are provided on a sliding scale based on an individual’s ability to pay.
[50]According to ACHA’s nongeneralizable student health plan survey, of the 235 responding 4-year colleges, 36 were minority-serving institutions. Among these 36 responding colleges, 20 offered student health plans and 16 did not. ACHA representatives noted that colleges may be more likely to respond to their student health plan survey if they offered student health plans. Two of the 12 selected colleges at which we interviewed college administrators were minority-serving institutions: a Historically Black College and University and a Native American Serving Non-Tribal Institution. One of these colleges offered a student health plan.
[51]The five selected colleges that required and offered health coverage included two 4-year public colleges and three 4-year private, not-for-profit colleges.
[52]The seven selected colleges that did not require or offer a student health plan included three 2-year public colleges, two 4-year public colleges, one 4-year private, not-for-profit college, and one 4-year for-profit college.
[53]Administrators representing the nine selected colleges with health centers said student health fees ranged from $0 to $260 per semester. In addition to a student health fee, administrators at five of the colleges said their health centers charged fees for certain services, such as medical lab testing, while administrators at one college said they charged fees for office visits and certain services but worked with students to reduce costs based on need. The three other selected colleges operating health centers did not pass along out-of-pocket fees for services onto students.
[54]PPACA requires certain health coverage issuers, including issuers of student health plans, to provide consumers with an easy-to-understand summary about a health plan’s benefits and coverage.
[55]According to HHS officials, the agency has had 22 “theme weeks of action” during which they have provided outreach and resources to individuals to encourage them to enroll in health coverage. In addition to the “Young Adult Week of Action”, HHS has held “theme weeks of action” focusing on other target populations, such as women, individuals with disabilities, and individuals of certain racial and ethnic groups. Agency officials said that students may also be reached during these “weeks of action.”
[56]According to Education officials, in fiscal year 2023, the average grant award was over $900,000.
[57]Applications for New Awards: Basic Needs for Postsecondary Students Program, 89 Fed. Reg. 47,928, 47,930 (June 4, 2024).
[58]To receive a temporary increase in federal funding during the public health emergency, states were required to keep beneficiaries continuously enrolled in Medicaid. Beginning in April 2023, states were required to resume Medicaid eligibility reviews and disenrollments.
[59]According to Education officials, in addition to being available through the Federal Student Aid website, this webpage is linked within the Free Application for Federal Student Aid in the section of the application that asks if the student receives federal means-tested benefits. “What federal benefits (means-tested benefits) might my family and I be eligible for?” Federal Student Aid, Department of Education, accessed November 21, 2024, https://studentaid.gov/help/means‑tested‑benefits.
[60]See Pub. L. No. 111-148, 124 Stat. 119 (2010), as amended by the Health Care and Education Reconciliation Act of 2010, Pub. L. No. 111-152, 124 Stat. 1029. In this report, any references to PPACA include any amendments made by the Health Care and Education Reconciliation Act of 2010. The term “students” refers to undergraduate or graduate students.
[61]In 2024, 138 percent of the federal poverty level for a single person was $20,783. States that choose to expand their programs receive an increased federal match for expenditures incurred to provide services to individuals whom the state had not previously covered.
[62]The term “students” refers to undergraduate or graduate students.