HIGHWAY FUNDING
Information on Variables for Potential New Formula Grant Programs
Report to Congressional Requesters
United States Government Accountability Office
For more information, contact Elizabeth Repko at repkoe@gao.gov.
Highlights of GAO-25-107097, a report to congressional requesters
Information on Variables for Potential New Formula Grant Programs
Why GAO Did This Study
The Infrastructure Investment and Jobs Act authorized and appropriated over $300 billion in funding for highway formula programs for fiscal years 2022 through 2026. As Congress deliberates about what to include in the next surface transportation authorization, it may create new formula programs, which it has done in some prior surface transportation authorizations.
GAO was asked about variables that could be used for potential new federal highway formula programs. This report describes: (1) the views of selected stakeholders with expertise and federal highway funding recipients on variables that could be used for potential new federal highway formula programs and (2) federal data that could measure these variables.
GAO reviewed applicable federal statutes and regulations, notices, and fact sheets to understand which variables are used to distribute funding under current highway formula programs. GAO used interviews and a survey to elicit views from selected federal highway funding recipients, subrecipients, and stakeholders. Specifically, GAO asked 31 interviewees to identify variables that could be used in formulas for potential new federal highway programs, and then surveyed them, receiving responses from 28 on their support for 96 suggested variables. GAO selected a non-generalizable mix of funding recipients, such as Tribes and state departments of transportation, based on their location. GAO also reviewed federal datasets and interviewed relevant agency officials to determine the availability of federal data to measure variables identified by interviewees.
What GAO Found
Each year, the federal government distributes billions in funding through federal highway formula grant programs (commonly referred to as formula programs) to Tribes and states to build highway infrastructure and for other purposes. These grants are distributed to recipients using statutory formulas and may be used to build and repair infrastructure and facilitate the movement of people and goods. GAO interviewed 31 selected highway program funding recipients, subrecipients, and stakeholders and then surveyed them to gauge their level of support for variables that could be used in formulas to distribute funding through potential new highway formula programs.
Most of the 28 survey respondents supported 27 variables that could be used to distribute funding for potential new programs. Almost all the supported variables related to infrastructure condition, freight movement and economic vitality, safety, and system reliability. Specifically, respondents supported variables such as total lane miles, vehicle miles traveled, and bridge condition. While selected funding recipients, subrecipients, and stakeholders identified and rated variables that could be used, they generally did not support creating new federal highway formula programs.
GAO found that federal data sources are available and can be used to measure 22 of the 27 supported variables. Most of the data are maintained by the Department of Transportation, primarily as part of its Transportation Performance Management program and the annual Highway Statistics Series. Of the five supported variables for which GAO did not identify a federal data source, agency officials noted privacy concerns or no requirement to collect such data, among other reasons for not collecting the data.
Abbreviations
|
ADHS |
Appalachian Development Highway System |
|
DOT |
Department of Transportation |
|
EPA |
Environmental Protection Agency |
|
FEMA |
Federal Emergency Management Agency |
|
FHWA |
Federal Highway Administration |
|
FY |
fiscal year |
|
GDP |
gross domestic product |
|
IIJA |
Infrastructure Investment and Jobs Act |
|
MAP-21 |
Moving Ahead for Progress in the 21st Century Act |
|
MPO |
metropolitan planning organization |
|
NEVI |
National Electric Vehicle Infrastructure Formula Program |
|
NHS |
National Highway System |
|
VMT |
vehicle miles traveled |
This is a work of the U.S. government and is not subject to copyright protection in the United States. The published product may be reproduced and distributed in its entirety without further permission from GAO. However, because this work may contain copyrighted images or other material, permission from the copyright holder may be necessary if you wish to reproduce this material separately.
May 6, 2025
The Honorable Brian Schatz
United States Senate
The Honorable Mark Kelly
United States Senate
Each year, the federal government uses federal highway formula grant programs (formula programs) to distribute billions in funding to Tribes and states to build highway infrastructure, make roads safer, and to address other goals. These programs use formulas to determine the amount of funding each recipient receives. Funding formulas are typically established through statute and expressed as equations containing one or more variables. We have previously reported that Congress can use formula programs to target funds to achieve program objectives by including specific variables in formulas that relate to the programs’ objectives.[1]
The Infrastructure Investment and Jobs Act (IIJA) authorized and appropriated over $300 billion in funding for highway formula programs for fiscal years 2022 through 2026.[2] The IIJA also created and funded four new highway formula programs. As Congress deliberates about what to include in the next surface transportation authorization, it may consider creating new formula programs.
You asked us to identify variables that could be used for potential new federal highway formula programs.[3] This report describes: (1) the views of selected stakeholders with expertise and federal highway funding recipients on variables that could be used in formulas for potential new federal highway programs and (2) federal data that could be used to measure these variables.
To identify variables for potential new federal highway formula programs, we first reviewed applicable federal statutes and regulations, notices, and fact sheets to understand what variables are used to distribute funding under current highway formula programs. We also interviewed officials with the Federal Highway Administration (FHWA) within the Department of Transportation (DOT) and the Appalachian Regional Commission.[4]
We then used a two-step process to elicit views from selected recipients and subrecipients of federal highway formula funding and stakeholders with policy expertise on variables that could be used in formulas for potential new federal highway programs. First, we interviewed 31 entities and individuals. Specifically, we spoke with 21 recipients and subrecipients of federal highway formula funding: three Tribes, five metropolitan planning organizations (MPO), and 13 state departments of transportation (state DOT).[5] We selected these funding recipients based on location to ensure geographic diversity, among other factors. In addition, we interviewed 10 stakeholders with policy expertise in federal highway grant programs, selected based on a literature search and recommendations from selected stakeholders. These stakeholders with policy experience ranged from researchers at academic institutions to those with roles at policy and advocacy organizations, consultants, as well as those who had previously worked on these issues in the Executive Branch and for Congress. The responses obtained from our 31 interviews and follow-up survey, which is described below, are not generalizable to all federal highway program funding recipients or all stakeholders with policy expertise. However, these responses provided a range of views and informed perspectives on this topic.
We asked interviewees to suggest variables that could be used to distribute funding for seven types of potential new federal highway formula programs, specifically focusing on safety; infrastructure condition; congestion reduction; system reliability; freight movement and economic vitality; environmental sustainability; and reduced project delivery delays. For instance, we asked interviewees to suggest variables that could be used to distribute funding for a potential new federal highway formula program focused on improving safety.[6] We selected these program types to correspond with national goals set by statute for the federal-aid highway program,[7] which includes a collection of federal highway formula programs that together received the most highway formula grant funding provided under the IIJA.
Second, to determine the level of support for variables identified by interviewees, we streamlined and aggregated all suggested variables.[8] We then surveyed interviewees and asked them to rate their level of support for 96 suggested variables, which could be used in formulas to distribute funding for the same seven types of potential new highway formula funding programs we asked about during our interviews. Of the 31 interviewees, 28 completed the survey. We categorized survey responses to determine the level of support—not at all, slight, moderate, or strong—that survey respondents expressed for each variable. In this report, we refer to variables that received some level of support (slight, moderate, or strong) from at least three-quarters (21) of survey respondents as supported variables.[9]
To describe the availability of federal data to measure these variables, we reviewed federal datasets and interviewed officials with DOT, the Department of Homeland Security, and the Environmental Protection Agency (EPA). See appendix I for more detail on our objectives, scope, and methodology.
We conducted this performance audit from October 2023 to May 2025 in accordance with generally accepted government auditing standards. Those standards require that we plan and perform the audit to obtain sufficient, appropriate evidence to provide a reasonable basis for our findings and conclusions based on our audit objectives. We believe that the evidence obtained provides a reasonable basis for our findings and conclusions based on our audit objectives.
Background
Surface transportation reauthorization acts provide funding for and can create, modify, or eliminate federal grant programs. This includes changing key characteristics of highway formula programs, including the formulas and variables used in them. As highlighted in figure 1, recent surface transportation reauthorization acts have created and eliminated highway formula programs, as well as changed and updated formulas for existing programs. For example, the Moving Ahead for Progress in the 21st Century Act (MAP-21), enacted in 2012, changed the formula used to distribute the funding it provided for the federal-aid highway program.[10]
Figure 1: Timeline of Selected Surface Transportation Reauthorization Act Changes to Federal Highway Formula Programs for Fiscal Years 2013-2026

Note: While the dates of enactment are within the range of 2012 through 2021, the selected changes of each act apply to specific fiscal years within the range of fiscal years 2013 through 2026.
FHWA apportions (i.e., distributes using formulas set in statute) highway formula program funding to eligible recipients. These formulas are equations containing multiple variables. Each variable affects the apportionment amount for each eligible recipient, and formulas may include weights (i.e., percentages) applied to the variables. For fiscal years 2022 through 2026, the IIJA authorized and appropriated funding for 13 highway formula programs, which FHWA administers (see table 1).[11] Nine of these programs are part of the federal-aid highway program.[12]
|
Program |
FY 2025 available funding (in millions)a |
Eligible recipients |
Selected variables used to distribute funds in FY 2025 |
|
Federal-aid highway programb |
$55,697 |
All 50 states, District of Columbia |
· Recipients’ FY 2021 federal-aid highway program apportionments |
|
Bridge Formula Program |
$5,335 |
All 50 states, District of Columbia, Puerto Rico |
· Cost of replacing all poor-condition bridges · Cost of rehabilitating all fair-condition bridges |
|
National Electric Vehicle Infrastructure Formula Program |
$900 |
All 50 states, District of Columbia, Puerto Rico |
· Recipients’ FY 2025 federal-aid highway program apportionment or Puerto Rico Highway Program funding, as applicable |
|
Tribal Transportation Program |
$579 |
Federally recognized Tribes |
· Amount received for FY 2011 under the Indian Reservation Roads program · Population · Eligible road miles · Bureau of Indian Affairs region |
|
Appalachian Development Highway System Program |
$250 |
13 states that contain at least one county in the Appalachian region |
· Estimated funds needed to complete the Appalachian Development Highway System |
Source: GAO analysis of the Infrastructure Investment and Jobs Act and related statutes. | GAO‑25‑107097
aWhere applicable, amounts are rounded to the nearest million. For four of these programs, the IIJA provided a greater amount of funding but required that some of it be set aside for another purpose, such as nonformula grant programs. The available funding amounts for these programs exclude those set-aside amounts. In addition, available funding amounts listed for four of these programs are higher than the amount actually available to eligible recipients, because they include administrative takedowns. We included those administrative takedowns because the programs’ statutes do not specify exact administrative takedown amounts but rather authorize DOT to deduct up to a certain percentage of the available funding as an administrative takedown.
bThe federal-aid highway program includes nine formula programs: the Carbon Reduction Program; the Congestion Mitigation and Air Quality Improvement Program; the Highway Safety Improvement Program; the Metropolitan Planning Program; the National Highway Freight Program; the National Highway Performance Program; the Promoting Resilient Operations for Transformative, Efficient, and Cost-Saving Transportation Formula Program; the Railway-Highway Crossings Program; and the Surface Transportation Block Grant Program.
These 13 federal highway formula programs apply a range of variables and have different purposes, project eligibilities, and in some cases, recipients.
· Variables. Federal-aid highway program formula funding is apportioned in part by using variables that include a recipient’s prior years’ apportionments.[13] For example, to calculate each state’s apportionment for the federal-aid highway program for fiscal years 2022 through 2026, one variable is the apportionment the state received for fiscal year 2021. By contrast, three highway formula programs use variables specifically related to the program’s purpose. For example, the Bridge Formula Program distributes funding using variables that include the cost of replacing all poor-condition bridges and the cost of rehabilitating all fair-condition bridges to calculate each state’s share of the annual apportionment.
· Purpose. Formula programs have varying purposes. For example, the purpose of the Bridge Formula Program is to provide funding to replace, rehabilitate, preserve, protect, and construct highway bridges. Other formula programs have broader purposes. For example, one purpose of the National Highway Performance Program is to provide funding for the condition and performance of the National Highway System (NHS).[14]
· Project eligibility. Some formula programs, such as the Surface Transportation Block Grant program, which is part of the federal-aid highway program, have broad project eligibility that includes construction of highways, bridges, tunnels, and certain ferry boats and terminal facilities as well as certain highway and transit safety improvements. Other formula programs have narrower project eligibility, such as the Railway-Highway Crossing Program. This program, also part of the federal-aid highway program, funds projects focused on the elimination of hazards associated with public railway-highway crossings. Eligible projects include installing protective devices at railway-highway crossings and replacing functionally obsolete warning devices.[15]
· Recipients. Most highway formula programs distribute funding to state DOTs.[16] However, Tribes are also eligible recipients for one highway formula program. Specifically, the Tribal Transportation Program distributes funding to federally recognized Tribes. In addition, MPOs are generally required to receive funding as subrecipients of grants that state DOTs receive through the Metropolitan Planning Program, which is one of the nine formula programs that are part of the federal-aid highway program.[17] Recipients select which projects will receive the funds, provided the project is eligible and other legal requirements are met.
Stakeholders and Funding Recipients Had a Variety of Views on Formula Variables and Potential New Highway Programs
Most Survey Respondents Expressed Support for 27 Variables
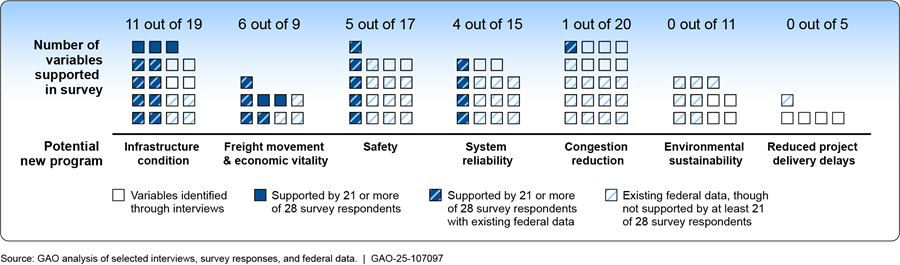
From a pool of 96 variables, our survey identified 27 supported variables—those receiving slight, moderate, or strong support from at least three-quarters of survey respondents—that could be used to distribute funding for potential new highway formula programs (see fig. 2).[18] The 27 supported variables spanned five different types of potential new highway formula programs. Twenty-six of the 27 supported variables related to four types of potential new programs, namely those focused on infrastructure condition, freight movement and economic vitality, safety, and system reliability. Additionally, in some cases, respondents supported using these variables—such as vehicle miles traveled—in more than one potential new program.
Figure 2: Number of Variables Identified in Interviews and Supported by Survey Respondents, by Type of Potential New Highway Formula Program

Note: “Supported” indicates a variable was slightly, moderately, or strongly supported by 21 or more of the 28 survey respondents, which included selected recipients of federal highway formula grants and stakeholders with expertise in highway grant funding.
Infrastructure condition. Survey respondents supported 11 variables for use in a formula to distribute funding for a potential new program focused on infrastructure condition. Respondents supported the inclusion of variables that measured a variety of infrastructure characteristics, including condition, size, and use (see table 2).
|
Variable |
Number of survey respondents expressing supporta |
|
Percentage of National Highway System (NHS) bridges classified as in good conditionb |
23 |
|
Percentage of NHS bridges classified as in poor conditionb |
23 |
|
Percentage of pavements of the Interstate System in poor condition |
23 |
|
Percentage of pavements of the non-Interstate NHS in poor conditionb |
23 |
|
Percentage of roads or bridges that are part of the National Highway Freight Networkc |
23 |
|
Vehicle miles traveled |
23 |
|
Lane miles on NHS designated as evacuation or emergency routesb |
22 |
|
Percentage of pavements of the Interstate System in good condition |
22 |
|
Deck area of NHS bridgesb |
21 |
|
Percentage of pavements of the non-Interstate NHS in good conditionb |
21 |
|
Total lane miles |
21 |
Source: GAO analysis of survey responses. | GAO‑25‑107097
a”Support” indicates a variable was slightly, moderately, or strongly supported by 21 or more of the 28 survey respondents, which included selected recipients of federal highway formula grants and stakeholders with expertise in highway grant funding.
bThe NHS consists of approximately 220,000 miles of public roads, including the 49,000-mile Interstate System as well as non-Interstate highways.
cThe National Highway Freight Network includes the Primary Highway Freight System, other Interstate portions not on the Primary Highway Freight System, Critical Rural Freight Corridors, and Critical Urban Freight Corridors.
Of these 11 supported variables, six measure the condition of bridges and pavement on the NHS, including Interstate and non-Interstate portions.[19] These six variables are performance measures for the National Highway Performance Program.[20] The other five supported variables measure the size and use of highway infrastructure, such as total lane miles and vehicle miles traveled.
Some funding recipients and stakeholders said including variables that measure the size or condition of NHS roads and bridges would help align funding with other national interests, including enabling national freight movement and interstate mobility. For example, some interviewees said that using variables focused on the condition of NHS roads and bridges could direct funds to corridors with nationwide significance. By improving the condition of these roads, some interviewees noted that such a program would also likely enhance freight movement and interstate mobility.
Freight movement and economic vitality. Survey respondents supported six variables for use in a formula to distribute funding for a potential new program focused on freight movement and economic vitality. Respondents supported the inclusion of variables that measure aspects of freight movement, including the total amount of freight movement on the NHS, freight movement times and reliability, and the size of the highway freight network (see table 3).
Table 3: Supported Variables to Distribute Funding for a Freight Movement and Economic Vitality Program
|
Variable |
Number of survey respondents expressing supporta |
|
Truck vehicle miles traveled |
25 |
|
Truck Travel Time Reliability Indexb |
24 |
|
Lane miles on the National Highway Freight Networkc |
23 |
|
Truck vehicle miles traveled on the National Highway Freight Networkc |
23 |
|
Freight throughput |
22 |
|
Tons of freight carried over National Highway Freight Networkc |
21 |
Source: GAO analysis of survey responses. | GAO‑25‑107097
a”Support” indicates a variable was slightly, moderately, or strongly supported by 21 or more of the 28 survey respondents, which included selected recipients of federal highway formula grants and stakeholders with expertise in highway grant funding.
bThe Truck Travel Time Reliability Index is calculated using data such as the lengths of selected Interstate segments and average truck travel time for those segments. This index can track the consistency or predictability in travel times as measured across specific days and time periods.
cThe National Highway Freight Network includes the Primary Highway Freight System, other Interstate portions not on the Primary Highway Freight System, Critical Rural Freight Corridors, and Critical Urban Freight Corridors.
Selected funding recipients and stakeholders noted different aspects of freight movement that could be prioritized for use in a funding formula. For example, some interviewees discussed travel time reliability for freight movement as a variable. One interviewee said that, for freight movement, travel time reliability is more important than overall speed of delivery because freight arriving when expected is more important than arriving early or late. Therefore, these interviewees identified the Truck Travel Time Reliability Index as a variable, which is an FHWA performance measure for the National Highway Freight Program.[21] Similarly, several interviewees spoke of the importance of funding roads and bridges that are of national economic importance or that serve as critical networks for the movement of freight throughout the U.S. Some of these interviewees viewed variables that measure either the amount of lane miles on designated freight routes or truck vehicle miles traveled as a way to direct funding to recipients.
Safety. Survey respondents supported five variables for use in a formula to distribute funding for a potential new program focused on safety. Respondents supported the inclusion of variables that measure rates of fatalities and serious injuries and system size (see table 4).
|
Variable |
Number of survey respondents expressing supporta |
|
Serious injuries per 100 million vehicle miles traveled |
22 |
|
Fatalities per 100 million vehicle miles traveled |
21 |
|
Fatalities per 100,000 population |
21 |
|
Serious injuries per 100,000 population |
21 |
|
Total lane miles |
21 |
Source: GAO analysis of survey responses. | GAO‑25‑107097
a”Support” indicates a variable was slightly, moderately, or strongly supported by 21 or more of the 28 survey respondents, which included selected recipients of federal highway formula grants and stakeholders with expertise in highway grant funding.
Supported variables include those that measure rates, rather than counts, of fatalities and serious injuries. The two supported variables that measure rates of fatalities and serious injuries by vehicle miles traveled are performance measures for the Highway Safety Improvement Program.
Interviewees offered different perspectives on how serious injury and fatality rates should be used in formulas. Some funding recipients and stakeholders noted that serious injury and fatality counts could be used in a ratio with vehicle miles traveled as the denominator, as is done with current safety performance measures. According to FHWA, such measures allow for consistent, data-informed comparisons across states.[22] Some stakeholders and funding recipients noted that weighting by population may better represent the significance of fatalities and serious injuries in the community as opposed to relating these events to vehicle miles driven.
System reliability. Survey respondents supported four variables for use in a formula to distribute funding for a potential new program focused on system reliability. Specifically, respondents supported variables that measure travel times and use of road networks to distribute funding for a program focused on system reliability (see table 5).
|
Variable |
Number of survey respondents expressing supporta |
|
Annual hours of peak-hour excessive delayb |
22 |
|
Truck vehicle miles traveled |
22 |
|
Travel Time Index |
21 |
|
Vehicle miles traveled |
21 |
Source: GAO analysis of survey responses. | GAO‑25‑107097
a”Support” indicates a variable was slightly, moderately, or strongly supported by 21 or more of the 28 survey respondents, which included selected recipients of federal highway formula grants and stakeholders with expertise in highway grant funding.
bMeasures traffic congestion during weekdays between 6:00–10:00 a.m. local time and between either 3:00–7:00 p.m. or 4:00–8:00 p.m. This FHWA performance measure is calculated using person-hours.
Some funding recipients and stakeholders noted the importance of directing funding to areas that need to improve reliability or may face future reliability concerns. For example, survey respondents supported using annual hours of excessive delay during peak travel time hours—a performance measure for the Congestion Mitigation and Air Quality Program. Some interviewees also said funding recipients may use funds to improve system reliability by investing in intelligent transportation systems or taking other actions to mitigate against and address weather-related disasters.
Other programs. For the three other types of potential new programs—congestion reduction, environmental sustainability, and project delivery—only one supported variable emerged in the survey responses, which was related to congestion reduction. Specifically, survey respondents supported vehicle miles traveled for use in a formula to distribute funding for a potential new program focused on congestion reduction. None of the 16 variables suggested for potential new programs focused on environmental sustainability or reduced project delivery delays were supported by most survey respondents. In our interviews and survey responses, funding recipients and stakeholders generally expressed difficulty identifying potential variables for these two types of programs.
Funding Recipients and Stakeholders Raised Concerns About Creating New Programs and Using Variables in New Formulas
Selected funding recipients and stakeholders raised concerns about adding to the existing slate of highway formula programs. For example, officials from most state DOTs that we interviewed did not support the creation of any new federal highway formula programs. Several said that based on their experience, it can be difficult to use funding distributed through new programs to implement surface transportation projects, for reasons such as trying to understand new project eligibility requirements or other program design elements. Instead, officials with several state DOTs said they would prefer more flexibility in the use of current formula funding, noting this would allow them to meet state needs and national goals. Rather than focusing on variables, several selected stakeholders noted the importance of defining and prioritizing the goals of highway funding before discussing how funds should be distributed.
Funding recipients and stakeholders also generally raised concerns about using variables to distribute funding through potential new formula programs.
· Misaligned incentives. Several funding recipients and stakeholders expressed concern that the use of variables that measure outcomes to distribute formula funding could result in misaligned incentives. For example, several interviewees noted that if funding were distributed to states based on the number of roads and bridges in poor condition, funding recipients may be incentivized to allow their infrastructure to deteriorate to secure additional funding. Under this scenario, recipients that improve road conditions could receive less federal funding. While some variables measuring the condition of roads and bridges were supported, interviewees expressed concern that distributing funds based on previous poor outcomes could result in the avoidance of projects aimed at improving future outcomes.
· Funding fluctuations. Some funding recipients and stakeholders said that using variables based on data that are periodically updated, such as population, could result in unpredictable and potentially large year-to-year changes in funding amounts. Such fluctuations in annual funding could, for example, make planning or carrying out multi-year projects more difficult. In 2024, we reported that large changes in the allotments received by certain formula funding recipients could disrupt recipients’ planning.[23]
· Lack of controllable outcomes. Some funding recipients were concerned about distributing funding based on variables that measure outcomes outside of their control, such as reducing funding for safety programs due to more crashes with fatalities or serious injuries. For example, interviewees noted that, with regards to safety, factors such as distracted or impaired driving can contribute to fatalities and injuries—but these are largely outside of state or local government control.
Several funding recipients and some stakeholders also offered strategies to mitigate some of these challenges:
· Establishing baseline funding for all recipients. These funding recipients and stakeholders suggested that a variable-based formula could include an initial funding level for each recipient, such as a baseline below which funding levels would not fall. They said this approach could help reduce fluctuations and uncertainty. In 2024, we found that taking temporary steps to limit large fluctuations in formula grant allotments could help funding recipients achieve program goals.[24]
· Using performance-based funding incentives. Some funding recipients and stakeholders stated that new formulas could be structured to incentivize improved performance. For example, these interviewees stated that a formula could have a variable-based bonus component applied to the baseline amount, where additional funding is received as recipients make progress and show improved outcomes in future years.
· Using rolling averages. One interviewee also said that using data based on rolling averages could help smooth out large data changes across years. They noted that such an approach could help mitigate project planning problems caused by potential funding fluctuations from changing data underlying the variables in a formula.
Existing Federal Data Could Be Used for Most Identified Variables
Based on our analysis and according to federal officials, federal data are available for 69 of the 96 variables included in our survey (see fig. 3). This includes federal data to measure 22 of the 27 supported variables and 47 of the 69 remaining variables that were not supported by at least three-quarters of survey respondents.[25]
Figure 3: Number and Availability of Data for Variables Identified in Interviews and Supported by Survey Respondents, by Type of Potential New Highway Formula Program
Note: “Supported” indicates a variable was slightly, moderately, or strongly supported by 21 or more of the 28 survey respondents, which included selected recipients of federal highway formula grants and stakeholders with expertise in highway grant funding.
DOT Maintains Data That Could Be Used to Measure 22 Supported Variables
DOT maintains data related to 22 of the 27 supported variables. Unless stated otherwise, FHWA reports this data as part of either the Transportation Performance Management measures or the Highway Statistics Series.[26]
Infrastructure Condition. FHWA currently maintains data for eight of the 11 variables supported for use in a formula for a potential new program focused on infrastructure condition.[27]
For the other three supported variables, we could not identify an existing federal data source. However, for two of these three variables, there are or soon will be at least some related data, according to FHWA officials.
· Related data available. While FHWA collects and reports data on lane mileage by state on the National Highway Freight Network, the agency does not report the percentage of roads and bridges in a state that are on this network. However, FHWA officials suggested using a variable that would account for only a portion of the National Highway Freight Network in a funding formula. The National Highway Freight Network comprises multiple networks—including one designated by FHWA and others designated by each state. FHWA officials noted that using data for the portion designated by FHWA—the Primary Highway Freight System—may be more reliable and consistent across states.
· Planned data collection. FHWA is working to collect data on total deck area for bridges on the NHS. According to FHWA officials, the agency plans to start reporting the data in 2026 as part of the National Bridge Inventory.
· No data available. Officials from FHWA and the Federal Emergency Management Agency (FEMA) stated they do not collect data on lane miles on the NHS designated as evacuation or emergency routes. FHWA officials stated that the agency is not required to collect this data.
Freight Movement and Economic Vitality. FHWA maintains data for four of the six variables supported for use in a formula to distribute funding for a potential new program focused on freight movement and economic vitality. Data for two variables, the Truck Travel Time Reliability Index and truck vehicle miles traveled, are reported by FHWA through the Transportation Performance Management Program and the annual Highway Statistics Series, respectively. FHWA reports data on the National Highway Freight Network by state on its website. FHWA has collected the data to calculate truck vehicle miles traveled on the National Highway Freight Network but does not publicly report them.
By contrast, FHWA does not maintain data to measure freight throughput, a supported variable. Although, FHWA officials told us they maintain data on the number of freight trucks registered to operate in the U.S., they do not track the number of freight trucks or tons of freight on specific routes or at any time. FHWA has developed, but not implemented, a method to calculate throughput based on the number of vehicles that enter and exit a route during a set time. FHWA officials stated they are not able to implement this method due to privacy concerns from freight operators and the overall difficulty of the effort.
Additionally, FHWA does not maintain data to measure the tons of freight carried over the National Highway Freight Network, another supported variable. Instead, FHWA estimates national-level trends on tons of freight moved throughout the U.S. The agency does not, however, have actual or estimated data on tons of freight moved on specific roadways, the National Highway Freight Network, or in specific states. FHWA officials explained that they only estimate the national-level trends due, in part, to privacy concerns.
Safety. Federal data sources exist for all five variables supported for use in a formula to distribute funding for a potential new program focused on safety. DOT reports data for four of these variables, related to serious injuries and fatalities on public roads and total lane miles.[28] The remaining supported variable, serious injuries per 100,000 population, can be calculated by combining two federal datasets: the number of serious injuries, reported by DOT, and state population, reported by the Census Bureau.
Some interviewees expressed concerns about the potential for data quality for safety-related variables, such as data on serious injuries, to vary among recipients. They stated that the data could vary because they are collected by the eligible recipients. For example, a stakeholder we spoke with said that counting a serious injury depends on the judgement of the first responder reporting the incident. Interviewees stated that data may not be consistent enough across jurisdictions to use in a formula. In addition, FHWA officials noted that the severity of an injury can change after it is first reported, and that change may not be reflected in the data before use in a formula. In 2019, we reported on the variability of serious injury definitions across states.[29]
To help ensure data quality for safety related variables, FHWA has developed performance measures related to serious injuries. As required by statute, FHWA issued regulations establishing performance measures for funding recipients to assess, in part, serious injuries per vehicle mile traveled and the number of such injuries.[30] The regulations also require states to use criteria published by the National Highway Traffic Safety Administration to determine whether an injury is a serious injury for the purposes of FHWA’s highway safety performance measures.
System Reliability and Congestion Reduction. Different offices within DOT maintain data for the five supported variables for use in a formula for potential new programs focused on system reliability and congestion reduction. FHWA maintains data to measure vehicle miles traveled, which is a supported variable for both potential new programs. FHWA also maintains data to measure two other supported variables for a potential new program on system reliability: (1) annual hours of peak hour excessive delay and (2) truck vehicle miles traveled. Another office within DOT, the Bureau of Transportation Statistics, reports the Travel Time Index for urban areas in each state, which was supported for use as a variable in a potential new program focused on system reliability.
Federal Agencies Maintain Data That Could Be Used to Measure 47 of 69 Remaining Variables
Federal agencies, including FHWA, the Census Bureau, and FEMA, maintain data for 47 of the remaining 69 variables that were not supported by three-quarters of survey respondents.
DOT. DOT maintains data for 25 of these variables, including data for variables such as the total number of fatalities.[31] FHWA officials stated they did not have any concerns about the quality of data for measuring these 25 variables, including in combination with Census Bureau data.
Other federal agencies. The Census Bureau maintains and annually reports data that can be used to calculate 14 variables related to population and income. In addition, FEMA collects data that could be used to measure two variables: the number of federally declared disasters and the dollar amount FEMA uses in disaster recovery. FEMA officials stated they could provide the data they collect annually and by state. Other agencies maintain data that could be used to measure six other variables.[32]
We were unable to identify federal data sources to measure the 22 remaining variables that were not supported by most survey respondents, and officials from DOT, FEMA, and EPA told us they do not maintain data to measure most of these variables. These variables would measure such things as total miles of sidewalks and the amount of time lane miles are closed to vehicle traffic. Federal officials explained why they do not collect data for some of these variables and offered their views about the potential use of some of them.
· Construction and replacement costs. FHWA officials stated the agency does not maintain data to measure variables related to the cost of construction or the cost to repair or replace roads and bridges in fair or poor condition. Furthermore, FHWA officials told us the National Highway Construction Cost Index—which measures the change over time in prices paid by states for road construction materials and services—should not be used as a variable in a funding formula. According to FHWA officials, this index was created by a third party, covers only 47 states, and is not validated by FHWA. FHWA officials told us this index is intended to describe trends in the cost of construction materials, rather than be used as a variable to measure the relative costs of highway construction in each state. In addition, FHWA officials told us they have data on how much states spend to repair roads and bridges, but these data are separate from data on the condition of roads and bridges and when they are open to traffic.
· Air quality and geologic risk. EPA officials also explained that they do not maintain data for some of the variables suggested by interviewees, including air quality index by state and risk to specific roads and other highway infrastructure. According to EPA officials, the agency maintains ambient air monitoring data submitted by tribal, state, and local air agencies. However, EPA does not typically aggregate ambient air monitoring data, including air quality index values, by state. EPA officials stated they may sometimes aggregate air quality data at the city or county level, but only in situations where they believe it is reasonable to assume consistent air quality across the city or county. In addition, EPA, FEMA, and FHWA officials told us they do not collect data on specific roads and bridges at risk for damage due to weather and geologic events. However, FHWA officials told us they plan to collect and report the seismic vulnerability of NHS bridges as part of the National Bridge Inventory starting in 2026.
Agency Comments
We provided a draft of this report to the Appalachian Regional Commission, DOT, EPA, and the Department of Homeland Security for review and comment. DOT and EPA provided technical comments, which we incorporated as appropriate. The Appalachian Regional Commission and the Department of Homeland Security did not have any comments on the report.
We are sending copies of this report to the appropriate congressional committees and the Secretaries of Transportation and Homeland Security, the Administrator of the EPA, and the Federal Co-Chair of the Appalachian Regional Commission. In addition, the report is available at no charge on the GAO website at http://www.gao.gov.
If you or your staff have any questions about this report, please contact me at RepkoE@gao.gov. Contact points for our Offices of Congressional Relations and Public Affairs may be found on the last page of this report. GAO staff who made key contributions to this report are listed in appendix IX.

Elizabeth Repko
Director, Physical Infrastructure
This report describes: (1) the views of selected stakeholders with expertise and federal highway funding recipients on variables that could be used in formulas for new federal highway programs and (2) federal data that could be used to measure these variables.
To identify variables for potential new federal highway formula grant programs, we interviewed officials with the Federal Highway Administration (FHWA) and Appalachian Regional Commission, reviewed relevant federal statutes and regulations, notices, and fact sheets to first understand which variables are used to distribute funding under current highway formula grant programs:
· the nine separate formula programs included in the federal-aid highway program:[33]
· the Carbon Reduction Program,
· the Congestion Mitigation and Air Quality Improvement Program,
· the Highway Safety Improvement Program,
· the Metropolitan Planning Program,
· the National Highway Freight Program,
· the National Highway Performance Program,
· the Promoting Resilient Operations for Transformative, Efficient, and Cost-Saving Transportation Formula Program,
· the Railway-Highway Crossings Program, and
· the Surface Transportation Block Grant Program
· the Tribal Transportation Program,
· the National Electric Vehicle Infrastructure (NEVI) Formula Program,
· the Bridge Formula Program, and
· the Appalachian Development Highway System program.
We used a two-step process of interviews followed by a survey to elicit views on variables that could be used in formulas for potential new federal highway programs. We interviewed 31 selected entities and individuals, including current recipients of federal highway formula funding and stakeholders with policy expertise.[34] Specifically, as shown in table 6, we spoke with 21 current recipients and subrecipients of federal highway formula funding: 13 state departments of transportation (state DOT), three Tribes, and five metropolitan planning organizations (MPO). Tribes and state DOTs are the recipients of certain highway formula grant programs.[35] MPOs are generally required to receive, as subrecipients, grant funding state DOTs receive through the Metropolitan Planning Program, which is one of the nine formula programs within the federal-aid highway program.[36]
|
Funding recipient |
Type |
|
Colorado River Indian Tribes (AZ and CA) |
Tribe |
|
Muscogee (Creek) Nation (OK) |
Tribe |
|
Penobscot Nation (ME) |
Tribe |
|
Arkansas Department of Transportation (DOT) |
State |
|
Florida DOT |
State |
|
Indiana DOT |
State |
|
Massachusetts DOT |
State |
|
Michigan DOT |
State |
|
Minnesota DOT |
State |
|
North Carolina DOT |
State |
|
Oklahoma DOT |
State |
|
Oregon DOT |
State |
|
Pennsylvania DOT |
State |
|
Rhode Island DOT |
State |
|
Texas DOT |
State |
|
Wyoming DOT |
State |
|
Chippewa-Eau Claire Metropolitan Planning Organization (WI) |
Metropolitan Planning Organization |
|
Florence Area Transportation Study (SC) |
Metropolitan Planning Organization |
|
Greater Bridgeport and Valley Metropolitan Planning Organization (CT) |
Metropolitan Planning Organization |
|
Southeast Metropolitan Planning Organization (MO) |
Metropolitan Planning Organization |
|
Southwest Regional Transportation Council (WA) |
Metropolitan Planning Organization |
Source: GAO. | GAO‑25‑107097
Note: For the purpose of this report, “recipient” includes both recipients and subrecipients (e.g., MPOs) of federal highway formula funding.
We selected funding recipients based on their location to ensure geographic diversity in our non-generalizable sample, among other factors. We randomly selected five Tribes based on their location and whether they received at least $1 million in Tribal Transportation Program funding in 2021. First, we identified the federally recognized Tribes that received Tribal Transportation funding of $1 million or more in fiscal year 2021. Then we organized these Tribes by Census region and randomly selected two Tribes from the West region and one Tribe each from the South and Midwest regions. Only one Tribe in the Northeast region received $1 million or more from the Tribal Transportation Program, so this Tribe was selected. We selected two Tribes from the West region because it had double the number of Tribes as the other regions. We interviewed officials with three of the Tribes we selected.[37]
We randomly selected 20 state DOTs to interview based on their Census region, selecting more states from regions with higher population levels. First, we divided the 50 states and the District of Columbia into the four Census regions: West, Midwest, Northeast, and South. Second, we randomly selected five states from the West, four states from the Midwest, three states from the Northeast, and eight from the South. The number of states per region selected was based on each region’s relative share of the total U.S. population. Of the 20 states selected, we interviewed officials from 13 state DOTs.[38]
We randomly selected five MPOs based on their location with the goal of not selecting an MPO in a state in which we planned to interview state DOT officials. To do this, we randomly selected five states from the 26 states that we did not plan to interview the state DOT. We randomly selected one state each from each of the Census regions—West, Midwest, Northeast, South—and one state was randomly selected from all 26 states. We then identified the MPOs in each of those states and randomly selected one MPO in each state. We interviewed officials with all five of the selected MPOs.
In addition, we interviewed 10 stakeholders with policy expertise in federal highway grant programs (see table 7).
|
Stakeholder |
Affiliation |
|
Peter J. Basso |
Principal, Peter J. Basso and Associates LLC and Former Assistant Secretary of Transportation for Budget and Programs |
|
Susan J. Binder |
Vice President, Federal Transportation Market and Policy, Cambridge Systematics, Inc. |
|
Jeff Davis |
Senior Fellow, Eno Center for Transportation |
|
James O’Keefe |
O’Keefe Shahmoradi Strategies |
|
Beth Osborne |
Director, Transportation for America |
|
Brian D. Taylor, PhD, FAICP |
Professor of Urban Planning & Public Policy, UCLA Institute of Transportation Studies |
|
Adie Tomer |
Senior Fellow, Brookings Institution |
|
Bill Keyrouze, Katie Economou, Ellen Zavisca, and Jason Pavluchuk |
Association of Metropolitan Planning Organizations |
|
Yonah Freemark, Amanda Hermans, Gabe Samuels, and Tomi Rajninger |
Urban Institute |
|
Chris McCray |
President, Intertribal Transportation Association |
Source: GAO. | GAO‑25‑107097
We selected stakeholders with policy expertise based on a literature search and recommendations from selected stakeholders. First, we selected an initial list of stakeholders with policy expertise through a literature search and then asked these stakeholders to identify others with policy expertise in federal highway formula programs whom we should contact. As we interviewed the second group of stakeholders, we also asked whether they could recommend other stakeholders with expertise in this policy area. Stakeholders with policy experience ranged from researchers at academic institutions, those with roles at policy and advocacy organizations, consultants, and those who had previously worked on these issues in the Executive Branch and for Congress. The responses obtained from our 31 interviews and follow-up survey, which is described below, are not generalizable to all federal highway program funding recipients or all stakeholders with policy expertise. However, these responses provided a range of views and informed perspectives on this topic.
We asked interviewees to suggest variables that could be used to distribute funding for seven types of potential new federal highway formula programs:
· safety,
· infrastructure condition,
· congestion reduction,
· system reliability,
· freight movement and economic vitality,
· environmental sustainability, and
· reduced project delivery delays.
We selected these program types to correspond with national goals set by statute for the federal-aid highway program.[39] The federal-aid highway program includes a collection of federal highway formula programs that together received the most highway formula grant funding provided under the Infrastructure Investment and Jobs Act. Specifically, for each goal, we asked if there were to be a new highway formula program focusing on that goal, what variables could be used to distribute funding. We did not provide interviewees any additional information about what potential new highway formula programs could look like, such as potential eligibility or program requirements. We also asked interviewees what, if anything, should be taken into account when using the variables they suggested in a formula; however, we did not ask them to create formulas for specific potential new programs by selecting specific variables or to propose how variables should be weighted (i.e., the positive or negative percentage applied to a variable). It is important to note that this was a theoretical exercise, and should Congress choose to establish one or more new federal highway programs, it may choose to combine two or more of these national goals or may design a program around a new goal.
To determine the level of support for variables identified by the 31 interviewees, we streamlined and aggregated the over 100 suggested variables down to 96 variables. This streamlining involved removing duplicates and combining suggested variables that measured similar concepts. We conducted two pretests of the survey to ensure questions and answer choices were clear, neutral, and interpreted consistently. We then surveyed interviewees and asked them to rate their level of support for 96 suggested variables, which could be used in formulas to distribute funding for the seven different types of potential new highway formula funding programs described above. Of the 31 interviewees, 28 completed the survey. We categorized survey responses to determine the level of support—not at all, slight, moderate, or strong—survey respondents expressed for each variable. In this report, we refer to variables that received some level of support (slight, moderate, or strong) from at least three-quarters (21) of survey respondents as supported variables. We selected this threshold to qualify a variable as “supported” to ensure we discussed those variables with the strongest and broadest level of support. When we analyzed the survey results, we determined that variables with some level of support from at least 21 respondents tended to have higher counts of “strongly support” and lower counts of “not at all support” or “no opinion” when compared to those variables with some level of support from 20 or fewer respondents.
To describe the availability of data to measure these identified variables, we reviewed relevant federal data and interviewed federal officials with the Department of Transportation, the Environmental Protection Agency, and the Department of Homeland Security. Specifically, these interviews focused on the extent to which agency data may be appropriate to use in a formula and the frequency with which the data are collected. For data that are not collected, we asked agency officials why they are not currently collected.
We conducted this performance audit from October 2023 to May 2025 in accordance with generally accepted government auditing standards. Those standards require that we plan and perform the audit to obtain sufficient, appropriate evidence to provide a reasonable basis for our findings and conclusions based on our audit objectives. We believe that the evidence obtained provides a reasonable basis for our findings and conclusions based on our audit objectives.
The Federal Highway Administration (FHWA) administers the federal-aid highway program, which includes nine formula grant programs.[40]
Program Purposes
Each of the formula programs under the federal-aid highway program has a different general purpose.
· The Carbon Reduction Program provides funding for projects to reduce transportation emissions, defined as carbon dioxide emissions from on-road highway sources.[41]
· The Congestion Mitigation and Air Quality Improvement Program provides funding for transportation projects and programs that may be used to help meet requirements of the Clean Air Act in certain areas defined under that act, among other uses.[42]
· The Highway Safety Improvement Program provides funding to achieve a significant reduction in traffic fatalities and serious injuries on all public roads, including non-state-owned public roads and roads on tribal land.[43]
· The Metropolitan Planning Program provides funding to carry out a cooperative, continuous, and comprehensive process for making transportation investment decisions in designated metropolitan areas.[44]
· The National Highway Freight Program provides funding to improve the efficient movement of freight on the National Highway Freight Network.[45]
· The National Highway Performance Program provides funding to support the condition and performance of the National Highway System (NHS); the construction of new facilities on the NHS; construction to support progress towards achievement of performance targets; and for activities to increase the resiliency of the NHS.[46]
· The Promoting Resilient Operations for Transformative, Efficient, and Cost-Saving Transportation Formula Program provides funding to make surface transportation infrastructure more resilient to changing conditions, such as sea level rise, wildfires, and other natural disasters, among other purposes.[47]
· The Railway-Highway Crossings Program provides funding for the elimination of hazards at public railway-highway grade crossings.[48]
· The Surface Transportation Block Grant Program promotes flexibility in state and local transportation decisions and provides flexible funding to best address state and local transportation needs.[49]
Eligible Recipients
State departments of transportation (DOT) are the funding recipients under these programs.[50] State DOTs generally have the discretion to permit local public agencies, such as cities or counties, to administer eligible projects using this funding. However, state DOTs are generally required to make Metropolitan Planning Program grant funds available to metropolitan planning organizations (MPO) as subrecipients to use in accordance with a formula that is developed by the state DOT and approved by FHWA and takes into consideration factors specified in federal statute, such as population.
Available Funding by Program Under the Infrastructure Investment and Jobs Act (IIJA), Fiscal Years 2022–2026
See table 8 for available funding for these programs for fiscal year 2022 through fiscal year 2026.
Table 8: Available Funding for Federal-Aid Highway Formula Programs for Fiscal Years (FY) 2022–2026 (in billions)
|
Program |
FY 2022 |
FY 2023 |
FY 2024 |
FY 2025 |
FY 2026 |
|
Federal-aid highway program |
$52.5 |
$53.5 |
$54.6 |
$55.7 |
$56.8 |
|
Carbon Reduction Program |
$1.2 |
$1.3 |
$1.3 |
$1.3 |
$1.3 |
|
Congestion Mitigation and Air Quality Program |
$2.5 |
$2.6 |
$2.6 |
$2.7 |
$2.7 |
|
Highway Safety Improvement Program |
$3.0 |
$3.0 |
$3.1 |
$3.2 |
$3.2 |
|
Metropolitan Planning Program |
$0.4 |
$0.4 |
$0.5 |
$0.5 |
$0.5 |
|
National Highway Freight Program |
$1.4 |
$1.4 |
$1.4 |
$1.5 |
$1.5 |
|
National Highway Performance Program |
$28.4 |
$29.0 |
$29.6 |
$30.2 |
$30.8 |
|
Promoting Resilient Operations for Transformative, Efficient, and Cost-Saving Transportation Formula Program |
$1.4 |
$1.4 |
$1.5 |
$1.5 |
$1.5 |
|
Railway-Highway Crossings Program |
$0.2 |
$0.2 |
$0.2 |
$0.2 |
$0.2 |
|
Surface Transportation Block Grant Program |
$13.8 |
$14.1 |
$14.4 |
$14.7 |
$15.0 |
Source: GAO analysis of Infrastructure Investment and Jobs Act and Federal Highway Administration documentation. | GAO‑25‑107097
Note: Amounts are rounded to the nearest hundred million. Amounts may not add up due to rounding. Available funding for the federal-aid highway program excludes $3.5 million that must be set aside each fiscal year from the Highway Safety Improvement Program for safety-related activities and databases.
Formulas and Variables, Fiscal Years 2022–2026
A series of formulas, set in statute, are used sequentially to calculate the total amount of formula funding each state receives under the federal-aid highway program (i.e., apportionment) and then divide the amount of each state’s apportionment among each of the nine individual formula programs for each state. Below are the formulas and variables for the federal-aid highway program’s formula funding authorized under the IIJA for fiscal years 2022 through 2026.[51]
Calculate a state’s initial apportionment. First, FHWA distributes the base apportionment for the fiscal year across the 50 states and the District of Columbia. The “base apportionment” is the total amount of federal-aid highway program formula funding authorized for a fiscal year.[52]
· A state’s initial apportionment is determined by multiplying the relevant base apportionment by that state’s share. A state’s share is equal to the ratio of its fiscal year 2021 apportionment to the combined amount of all states’ fiscal year 2021 apportionments.[53]
Adjust a state’s initial apportionment. Second, FHWA adjusts the initial apportionments to ensure that each state receives a total apportionment that meets the following requirements.
· 95 cents-on-the-dollar. Each state’s apportionment must equal at least 95 percent of the dollar amount of estimated tax payments that the state contributed to the Highway Account of the Highway Trust Fund in the most recent fiscal year for which data are available.[54]
· Minimum increases from previous year and fiscal year 2021. Each state’s total apportionment must be at least:
· 1 percent greater than its total apportionment for the previous fiscal year
· 2 percent greater than its total fiscal year 2021 apportionment.[55]
Divide a state’s apportionment among individual formula programs. Third, FHWA divides the state’s total apportionment among the nine federal-aid highway formula programs. FHWA calculates these divided amounts for every state in a specific order.
1. Calculate a state’s program apportionments for the three following programs.
· Congestion Mitigation and Air Quality Program apportionment equals total amount of funding set-aside for this program for all states for the relevant fiscal year, multiplied by the ratio of the amount of program apportionment the state received for fiscal year 2020 to all states’ program apportionment for fiscal year 2020.
· National Highway Freight Program apportionment equals total amount of funding set-aside for this program for all states for the relevant fiscal year, multiplied by the ratio of the state’s total apportionment to all states’ total apportionments for that fiscal year.
· Metropolitan Planning Program apportionment equals total amount of funding set-aside for this program for the relevant fiscal year, multiplied by the ratio of the state’s program apportionment for fiscal year 2020 to the total of all states’ program apportionments for fiscal year 2020.
2. Subtract the funding amounts set-aside for the three programs in step 1 (the three-program set-asides) from a state’s total apportionment. Then, using the state’s remaining apportionment amount, calculate the apportionments for the five following programs.
· National Highway Performance Program apportionment equals a state’s remaining apportionment after the three-program set-asides are subtracted, multiplied by 59.0771195921461 percent.
· Surface Transportation Block Grant apportionment equals a state’s remaining apportionment after the three-program set-asides are subtracted, multiplied by 28.7402203421251 percent.
· Carbon Reduction Program apportionment equals a state’s remaining apportionment after the three-program set-asides are subtracted, multiplied by 2.56266964565637 percent.
· Promoting Resilient Operations for Transformative, Efficient, and Cost-Saving Transportation Formula Program apportionment equals a state’s remaining apportionment after the three-program set-asides are subtracted, multiplied by 2.91393900690991 percent.
· Highway Safety Improvement Program official apportionment equals a state’s remaining apportionment after the three-program set-asides in Step 1 are multiplied by 6.70605141316253 percent (initial amount), minus the amounts set aside for the Railway-Highway Crossings Program and safety-related activities and clearinghouses (below).
o Safety-related activities and clearinghouses. Prior to calculating each state’s official Highway Safety Improvement Program apportionment, $3.5 million must be set aside from the initial amount of this program funding for safety-related activities and clearinghouses. This set-aside is subtracted on a proportional basis from each state’s initial program amount.[56]
· Railway-Highway Crossings Program apportionment. Prior to calculating each state’s official Highway Safety Improvement Program apportionment, at least $245 million must be set aside for the Railway-Highway Crossings Program from the initial amount of Highway Safety Improvement Program funding available for apportionment each fiscal year. The Railway-Highway Crossings Program apportionment for each state for the relevant fiscal year is determined by distributing the $245 million set-aside funding in accordance with the below formulas and minimum requirement.
· 50 percent of funds must be distributed according to a statutory formula that uses each state’s payments into the Highway Account of the Highway Trust Fund, total federal-aid lane miles, and vehicle miles traveled on federal-aid highways.
· 50 percent of funds are distributed based in the ratio that total public railway-highway crossings in each state bears to the total of such crossings in all states.
· Each state must receive at least 0.5 percent of the total amount set aside for the Railway-Highway Crossings Program.
The Federal Highway Administration (FHWA) administers the Bridge Formula Program, which was created by the Infrastructure Investment and Jobs Act (IIJA).
Program Purpose
The Bridge Formula Program provides funding to replace, rehabilitate, preserve, protect, and construct highway bridges.[57]
Eligible Recipients
State departments of transportation (DOT), the District of Columbia, and Puerto Rico are eligible funding recipients. The term “states” includes the District of Columbia and Puerto Rico.
Available Funding Under the IIJA, Fiscal Years 2022–2026
See table 9 for available funding for fiscal year 2022 through fiscal year 2026.
Table 9: Available Funding for the Bridge Formula Program for Fiscal Years (FY) 2022–2026 (in billions)
|
Program |
FY 2022 |
FY 2023 |
FY 2024 |
FY 2025 |
FY 2026 |
|
Bridge Formula Program |
$5.3 |
$5.3 |
$5.3 |
$5.3 |
$5.3 |
Source: GAO analysis of the Infrastructure Investment and Jobs Act. | GAO‑25‑107097
Note: Amounts are rounded to the nearest $100 million. The Infrastructure Investment and Jobs Act provided greater funding amounts for this program but required that some of it be set aside for a nonformula grant program. The amounts in this table exclude that set-aside and are subject to an administrative takedown.
Formulas and Variables, Fiscal Years 2022–2026
Bridge Formula Program funding is distributed to states using a statutory formula (i.e., apportioned) based on the relative cost of replacing a state’s bridges classified as in poor condition and rehabilitating a state’s bridges classified as in fair condition. Specifically:
· 75 percent of Bridge Formula Program funding must be distributed to states by the proportion that the total cost of replacing all bridges in poor condition in a state bears to the total cost to replace all such bridges in all states.
· 25 percent of the Bridge Formula Program funding is distributed by the proportion that the total cost of rehabilitating bridges in fair condition a state bears to the total cost to replace all such bridges in all states.
For the purposes of calculating the above amounts, the replacement and rehabilitation costs are based on the average unit costs of bridge costs from 2016 through 2020, as submitted by the states to FHWA, and the total deck area of bridges classified in poor or fair condition based on the National Bridge Inventory as of December 31, 2020. The funding amounts calculated using the formula above must be adjusted such that each state receives at least $45 million of this program’s funding annually for fiscal years 2022 through 2026.
The National Electric Vehicle Infrastructure (NEVI) Formula Program, administered by the Federal Highway Administration (FHWA), was created under the Infrastructure Investment and Jobs Act (IIJA).
Program Purpose
The NEVI Formula Program provides funding to strategically deploy electric vehicle charging infrastructure and to establish an interconnected network to facilitate data collection, access, and reliability.[58]
Eligible Recipients
State departments of transportation (DOT), the District of Columbia, and Puerto Rico are eligible funding recipients. The term “states” includes the District of Columbia and Puerto Rico.
Available Funding Under the IIJA, Fiscal Years 2022–2026
See table 10 for available funding for NEVI for fiscal year 2022 through fiscal year 2026.
Table 10: Available Funding for the National Electric Vehicle Infrastructure (NEVI) Formula Program for Fiscal Years (FY) 2022–2026 (in billions)
|
Program |
FY 2022 |
FY 2023 |
FY 2024 |
FY 2025 |
FY 2026 |
|
NEVI Formula Program |
$0.63 |
$0.9 |
$0.9 |
$0.9 |
$0.9 |
Source: GAO analysis of the Infrastructure Investment and Jobs Act. | GAO‑25‑107097
Note: The Infrastructure Investment and Jobs Act provided greater funding amounts for this program but required a set-aside for fiscal year 2022 for the Joint Office of Energy and Transportation and an annual set-aside for a nonformula grant program. The amounts in this table exclude those set-aside amounts and are subject to an administrative takedown.
Formulas and Variables, Fiscal Years 2022–2026
NEVI Formula Program funding is apportioned based on a state’s share of the combined amount that FHWA distributes through the federal-aid highway formula program and Puerto Rico Highway Program.
· A state’s NEVI apportionment is equal to the total NEVI apportionment for the relevant fiscal year multiplied by a state’s relevant fiscal year share of combined federal-aid highway program apportionment and Puerto Rico Highway Program funding.
The Tribal Transportation Program is co-administered by the Federal Highway Administration (FHWA) and the Department of the Interior’s Bureau of Indian Affairs.
Program Purpose
The Tribal Transportation Program funds tribal transportation facilities, such as public roads with or providing access to tribal reservations, tribal lands, and Alaska Native communities.[59]
Eligible Recipients
Five hundred seventy-four (574) federally recognized Tribes receive funding through the Tribal Transportation Program.
Available Funding Under the Infrastructure Investment and Jobs Act (IIJA), Fiscal Years 2022–2026
See table 11 for available funding for the Tribal Transportation Program for fiscal year 2022 through fiscal year 2026.
Table 11: Available Funding for the Tribal Transportation Program for Fiscal Years (FY) 2022–2026 (in millions)
|
Program |
FY 2022 |
FY 2023 |
FY 2024 |
FY 2025 |
FY 2026 |
|
Tribal Transportation Program |
$546 |
$557 |
$569 |
$579 |
$594 |
Source: GAO analysis of the Infrastructure Investment and Jobs Act and related statutes. | GAO‑25‑107097
Note: Amounts are rounded to the nearest $1 million. The Infrastructure Investment and Jobs Act provided greater funding amounts for this program but required set-asides for two nonformula grant programs. The amounts in this table exclude those set-aside amounts and are subject to an administrative takedown.
Formulas and Variables, Fiscal Years 2022–2026
The Tribal Transportation Program’s funding formula is based on several variables, including tribal population, eligible road mileage, and tribal shares within each Bureau of Indian Affairs region under the predecessor program, the Indian Reservation Roads Program.[60] Each Tribe’s apportionment is comprised of three parts. The amount for each of these three parts is calculated in a specific order.
· Transition funding. According to FHWA officials, total transition funding available for all Tribes is approximately $70 million. Each Tribe receives transition funding equal to 20 percent of a portion of its FY 2011 Indian Reservation Roads program tribal share, that is linked to factors addressing relative need and population.
· Supplemental funding. Total supplemental funding available to all Tribes is equal to $82.5 million plus 12.5 percent of the total allocation for the Tribal Transportation Program that is above $275 million.[61] Each Tribe’s share of the supplemental funding is calculated after the formula tribal shares are calculated in step 3 below.
· Formula tribal shares. The remaining funds are divided among Tribes based on a Tribe’s eligible road miles, a Tribe’s population, and a Tribe’s Bureau of Indian Affairs Region.
· 27 percent of remaining funds are divided among Tribes based on eligible road mileage identified for fiscal year 2012 in the National Tribal Transportation Facility Inventory.
· Each Tribe’s mileage share is calculated using the ratio of total eligible road mileage of each Tribe to the total eligible road mileage of all eligible Tribes and Alaska Native communities.
· This calculation of eligible road mileage must only use facilities that (1) were included in the Bureau of Indian Affairs system inventory prior to October 1, 2004; (2) are owned by a Tribal government; or (3) are owned by the Bureau of Indian Affairs.
· 39 percent of remaining funds are divided among Tribes based on the most recent tribal and Alaska Native population data within its Reservation or Statistical Area as computed under the Native American Housing Assistance and Self-Determination Act of 1996.
· Each Tribe’s population share is calculated using the ratio of the total population of each Tribe to the total population of all American Indians and Alaska Natives.
· 34 percent of remaining funds are divided equally among the 12 Bureau of Indian Affairs regions.
· Within these regions, each Tribe’s regional share is calculated using the ratio of the average total of factors linked to relative need and population from fiscal years 2005 through 2011 for a Tribe to average total of the same factors for fiscal years 2005 through 2011 for the whole region.[62]
The formula tribal shares help determine each Tribe’s share of the supplemental funding. Each Tribe’s supplemental share is calculated through the following steps:
· Calculate the total amount of formula tribal shares received by each of the 12 Bureau of Indian Affairs regions. The supplemental funding is then divided among the 12 regions in proportion to the regional total of tribal share based on the tribal shares in all 12 regions.
· A region’s supplemental funds are then distributed among the region’s Tribes based on factors such as the funding amounts those Tribes received for fiscal year 2011 pursuant to factors addressing relative need and population.
The Federal Highway Administration (FHWA) in coordination with the Appalachian Regional Commission administers the Appalachian Development Highway System (ADHS) Program.
Program Purpose
The ADHS Program provides funds to construct the ADHS, a system of designated corridors and roadways within the 13 states that make up the Appalachian Region.[63]
Eligible Recipients
The 13 states eligible to receive program funds (i.e., an apportionment) are: Alabama, Georgia, Kentucky, Maryland, Mississippi, New York, North Carolina, Ohio, Pennsylvania, South Carolina, Tennessee, Virginia, and West Virginia. In fiscal year 2025, 10 of these states received an apportionment. Mississippi, New York, and South Carolina did not receive apportionments. As states complete work on ADHS-eligible roads, they no longer receive funding through the program.
Available Funding Under the Infrastructure Investment and Jobs Act (IIJA), Fiscal Years 2022–2026
See table 12 for available funding for the ADHS Program for fiscal year 2022 through fiscal year 2026.
Table 12: Available Funding for the Appalachian Development Highway System (ADHS) Program for Fiscal Years (FY) 2022–2026 (in millions)
|
Program |
FY 2022 |
FY 2023 |
FY 2024 |
FY 2025 |
FY 2026 |
|
ADHS Program |
$250 |
$250 |
$250 |
$250 |
$250 |
Source: GAO analysis of the Infrastructure Investment and Jobs Act. | GAO‑25‑107097
Note: Available funding amounts are subject to an administrative takedown.
Formulas and Variables, Fiscal Years 2022–2026
ADHS Program funds are distributed to eligible states based on each state’s relative share of the estimated cost to complete ADHS road corridors.
The Appalachian Regional Commission provides technical assistance to FHWA in the calculation of each eligible state’s apportionment using data from three reports:
· 2013 Appalachian Development Highway System Completion Report, which provides information on states’ plans to complete ADHS infrastructure
· 2020 Appalachian Development Highway System Future Outlook, which provides an update on states’ plans to complete ADHS infrastructure
· 2021 Appalachian Development Highway System Cost-to-Complete Estimate, which provides states’ relative share of the estimated cost-to-complete
No eligible state may receive more than 30 percent of the total amount of annual ADHS program funding, and all eligible states get a minimum of $10 million each year unless they do not have any additional ADHS corridors to complete or the total cost to complete is less.
As described in appendix I, we interviewed 31 entities and individuals, including recipients and subrecipients of federal highway formula funding and stakeholders with policy expertise.[64] We interviewed them to obtain their views on variables that could be used in formulas for potential new grant programs focused on different goals, such as safety and infrastructure condition. We streamlined the variables they identified and surveyed the 31 interviewees. Twenty-eight completed the survey, for a response rate of 90 percent. Although originally presented in a web format, the questions and answer choices that follow are the same wording as shown to survey respondents. Results are tallied for each question. We omit, however, all individual responses to open-ended questions, in order to protect respondent anonymity.
Safety
In interviews with policy experts and funding recipients, we heard various opinions about potential, new federal highway formula programs. Setting aside bigger picture questions about the need for new federal highway formula programs, we would like your opinion on using the variables below to distribute funds for a potential, new safety program.
As mentioned above, we are using the national goals for the federal-aid highway program (listed under 23 U.S.C. 150(b)) as a framework to consider these potential, new programs. The national goal of safety is to achieve a significant reduction in traffic fatalities and serious injuries on all public roads.
1. Generally, in a formula to distribute funds for a potential, new federal highway program focused on safety, would you support using variables that measure outcomes (e.g., rate of fatalities or serious injuries)?
|
Yes |
17 |
|
No |
10 |
|
No Opinion |
1 |
2. Generally, in a formula to distribute funds for a potential, new federal highway program focused on safety, would you support using variables that measure system size and use (e.g., lane miles or population)?
|
Yes |
16 |
|
No |
10 |
|
No Opinion |
2 |
3. If a new federal highway formula program with a focus on safety were created, to what extent would you support, if at all, including the variables below in a formula to distribute funds?
|
|
No answer |
No opinion |
Not at all support |
Slightly support |
Moderately support |
Strongly support |
Support (sum of all levels of support) |
|
Number of fatalities |
1 |
1 |
8 |
3 |
7 |
8 |
18 |
|
Fatalities per 100 million vehicle miles traveled (VMT) |
1 |
2 |
4 |
8 |
5 |
8 |
21 |
|
Fatalities per 100,000 population |
1 |
2 |
4 |
5 |
8 |
8 |
21 |
|
Number of motorized fatalities |
0 |
2 |
9 |
4 |
8 |
5 |
17 |
|
Number of non-motorized fatalities |
0 |
2 |
8 |
5 |
6 |
7 |
18 |
|
Number of serious injuries |
0 |
1 |
8 |
3 |
9 |
7 |
19 |
|
Serious injuries per 100 million vehicle miles traveled (VMT) |
0 |
2 |
4 |
7 |
6 |
9 |
22 |
|
Serious injuries per 100,000 population |
0 |
2 |
5 |
5 |
8 |
8 |
21 |
|
Number of motorized serious injuries |
0 |
1 |
11 |
4 |
7 |
5 |
16 |
|
Number of non-motorized serious injuries |
0 |
1 |
9 |
5 |
4 |
9 |
18 |
|
Number of motor vehicle crashes |
0 |
3 |
12 |
5 |
5 |
3 |
13 |
|
Total center-line miles |
0 |
2 |
11 |
7 |
4 |
4 |
15 |
|
Total lane miles |
0 |
1 |
6 |
7 |
8 |
6 |
21 |
|
Population |
0 |
1 |
7 |
7 |
5 |
8 |
20 |
|
Population growth rate |
0 |
2 |
13 |
5 |
6 |
2 |
13 |
|
Average daily traffic |
0 |
2 |
10 |
2 |
5 |
9 |
16 |
|
Vehicle miles traveled (VMT) |
0 |
1 |
8 |
6 |
3 |
10 |
19 |
4. Optional: Share additional context for this section. [Written responses not included.]
Infrastructure Condition
In interviews with policy experts and funding recipients, we heard various opinions about potential, new federal highway formula programs. Setting aside bigger picture questions about the need for new federal highway formula programs, we would like your opinion on using the variables below to distribute funds for a potential, new program focused on infrastructure condition.
As mentioned above, we are using the national goals for the federal-aid highway program (listed under 23 U.S.C. 150(b)) as a framework to consider these potential, new programs. The national goal of infrastructure condition is to maintain the highway infrastructure asset system in a state of good repair.
5. Generally, in a formula to distribute funds for a potential, new federal highway program focused on infrastructure condition, would you support using variables that measure outcomes (e.g., road or bridge condition)?
|
Yes |
20 |
|
No |
6 |
|
No Opinion |
2 |
6. Generally, in a formula to distribute funds for a potential, new federal highway program focused on infrastructure condition, would you support using variables that measure system size and use (e.g., lane miles or vehicle miles traveled)?
|
Yes |
19 |
|
No |
7 |
|
No Opinion |
2 |
7. If a new federal highway formula program with a focus on infrastructure condition were created, to what extent would you support, if at all, including the variables below in a formula to distribute funds?
|
|
No opinion |
Not at all support |
Slightly support |
Moderately support |
Strongly support |
Support (sum of all levels of support) |
|
Percentage of pavements of the Interstate System in poor condition |
2 |
3 |
4 |
7 |
12 |
23 |
|
Percentage of pavements of the Interstate System in good condition |
2 |
4 |
5 |
10 |
7 |
22 |
|
Percentage of pavements of the non-Interstate National Highway System (NHS) in poor condition |
1 |
4 |
7 |
4 |
12 |
23 |
|
Percentage of pavements of the non-Interstate NHS in good condition |
1 |
6 |
6 |
7 |
8 |
21 |
|
Percentage of NHS bridges classified as in poor condition |
1 |
4 |
4 |
7 |
12 |
23 |
|
Percentage of NHS bridges classified as in good condition |
1 |
4 |
6 |
10 |
7 |
23 |
|
Total lane miles |
0 |
7 |
4 |
7 |
10 |
21 |
|
Deck area of NHS bridges |
3 |
4 |
3 |
8 |
10 |
21 |
|
Percentage of roads or bridges that are part of National Highway Freight Network, Critical Urban Freight Corridors, or Critical Rural Freight Network |
3 |
2 |
4 |
10 |
9 |
23 |
|
Lane miles on NHS designated as evacuation or emergency routes |
2 |
4 |
6 |
7 |
9 |
22 |
|
Cost of replacing NHS roads and bridges in poor condition |
2 |
7 |
2 |
7 |
10 |
19 |
|
Cost of rehabilitating NHS roads and bridges in fair condition |
2 |
7 |
4 |
11 |
4 |
19 |
|
National Highway Construction Cost Index |
3 |
7 |
6 |
7 |
5 |
18 |
|
Vehicle miles traveled (VMT) |
1 |
4 |
6 |
7 |
10 |
23 |
|
Vehicle throughput |
4 |
8 |
6 |
7 |
3 |
16 |
|
Population |
1 |
8 |
5 |
9 |
5 |
19 |
|
Population growth rate |
1 |
11 |
6 |
8 |
2 |
16 |
|
Median income |
2 |
15 |
4 |
4 |
3 |
11 |
|
Average daily low temperature does not exceed 32 degrees at least 20 weeks per year |
5 |
12 |
7 |
3 |
1 |
11 |
8. Optional: Share additional context for this section. [Written responses not included.]
Congestion Reduction
In interviews with policy experts and funding recipients, we heard various opinions about potential, new federal highway formula programs. Setting aside bigger picture questions about the need for new federal highway formula programs, we would like your opinion on using the variables below to distribute funds for a potential, new program to reduce congestion.
As mentioned above, we are using the national goals for the federal-aid highway program (listed under 23 U.S.C. 150(b)) as a framework to consider these potential, new programs. The national goal of congestion reduction is to achieve a significant reduction in congestion on the National Highway System.
9. Generally, in a formula to distribute funds for a potential, new federal highway program focused on congestion reduction, would you support using variables that measure outcomes (e.g., annual hours of peak-hour excessive delay)?
|
Yes |
14 |
|
No |
8 |
|
No Opinion |
6 |
10. Generally, in a formula to distribute funds for a potential, new federal highway program focused on congestion reduction, would you support using variables that measure system size and use (e.g., lane miles or population growth rate)?
|
Yes |
12 |
|
No |
11 |
|
No Opinion |
5 |
11. If a new federal highway formula program with a focus on congestion reduction were created, to what extent would you support, if at all, including the variables below in a formula to distribute funds?
|
|
No answer |
No opinion |
Not at all support |
Slightly support |
Moderately support |
Strongly support |
Support (sum of all levels of support) |
|
Annual hours of peak-hour excessive delay |
0 |
3 |
5 |
4 |
7 |
9 |
20 |
|
Percent of non-single occupancy vehicle travel |
0 |
3 |
12 |
5 |
5 |
3 |
13 |
|
Truck travel time reliability index |
0 |
5 |
3 |
5 |
6 |
9 |
20 |
|
Travel time index |
0 |
5 |
5 |
3 |
7 |
8 |
18 |
|
Number of freight trucks on the National Highway System (NHS) annually |
0 |
4 |
5 |
9 |
6 |
4 |
19 |
|
Annual change in number of freight trucks on NHS |
0 |
5 |
10 |
7 |
4 |
2 |
13 |
|
Throughput of people and goods |
0 |
5 |
6 |
6 |
7 |
4 |
17 |
|
Total center-line miles |
1 |
3 |
12 |
4 |
6 |
2 |
12 |
|
Total lane miles |
0 |
3 |
8 |
9 |
5 |
3 |
17 |
|
Total lane miles on the National Highway Freight Network |
0 |
3 |
5 |
9 |
6 |
5 |
20 |
|
Total miles of sidewalks |
0 |
3 |
12 |
7 |
2 |
4 |
13 |
|
Population |
0 |
3 |
6 |
10 |
4 |
5 |
19 |
|
Population growth rate |
0 |
3 |
7 |
10 |
6 |
2 |
18 |
|
Population density |
0 |
3 |
7 |
8 |
4 |
6 |
18 |
|
Percentage of adult population without valid driver’s license |
0 |
5 |
13 |
4 |
3 |
3 |
10 |
|
Vehicle miles traveled (VMT) |
0 |
3 |
4 |
9 |
7 |
5 |
21 |
|
Vehicle miles traveled (VMT) per capita |
0 |
4 |
4 |
6 |
8 |
6 |
20 |
|
Annual change in vehicle miles traveled (VMT) per capita |
0 |
4 |
7 |
8 |
7 |
2 |
17 |
|
Projected increase in vehicle miles traveled (VMT) over the next 10 years |
0 |
4 |
9 |
7 |
6 |
2 |
15 |
|
Access to key destinations (e.g., jobs, schools, medical care) |
0 |
5 |
3 |
6 |
6 |
8 |
20 |
12. Optional: Share additional context for this section. [Written responses not included.]
System Reliability
In interviews with policy experts and funding recipients, we heard various opinions about potential, new federal highway formula programs. Setting aside bigger picture questions about the need for new federal highway formula programs, we would like your opinion on using the variables below to distribute funds for a potential, new program focused on system reliability.
As mentioned above, we are using the national goals for the federal-aid highway program (listed under 23 U.S.C. 150(b)) as a framework to consider these potential, new programs. The national goal of system reliability is to improve the efficiency of the surface transportation system
13. Generally, in a formula to distribute funds for a potential, new federal highway program focused on system reliability, would you support using variables that measure outcomes (e.g., percentage of person-miles traveled on the Interstate that are reliable)?
|
Yes |
16 |
|
No |
7 |
|
No Opinion |
5 |
|
|
|
|
|
|
14. Generally, in a formula to distribute funds for a potential, new federal highway program focused on system reliability, would you support using variables that measure system size and use (e.g., lane miles or population density)?
|
Yes |
17 |
|
No |
8 |
|
No Opinion |
3 |
15. If a new federal highway formula program with a focus on system reliability were created, to what extent would you support, if at all, including the variables below in a formula to distribute funds?
|
|
No answer |
No opinion |
Not at all support |
Slightly support |
Moderately support |
Strongly support |
Support (sum of all levels of support) |
|
Annual hours of peak-hour excessive delay |
0 |
2 |
4 |
8 |
6 |
8 |
22 |
|
Percent of non-single occupancy vehicle travel |
0 |
2 |
11 |
8 |
3 |
4 |
15 |
|
Percentage of person-miles traveled on the Interstate that are reliable |
0 |
5 |
5 |
5 |
6 |
7 |
18 |
|
Percentage of person-miles traveled on the non-Interstate National Highway System (NHS) that are reliable |
0 |
5 |
5 |
7 |
6 |
5 |
18 |
|
Travel time index |
0 |
2 |
5 |
6 |
10 |
5 |
21 |
|
Vehicle miles traveled (VMT) |
1 |
2 |
4 |
8 |
9 |
4 |
21 |
|
Truck VMT |
0 |
2 |
4 |
7 |
9 |
6 |
22 |
|
Total lane miles |
0 |
2 |
6 |
11 |
6 |
3 |
20 |
|
Percentage of road miles that are less than 20 feet wide |
0 |
5 |
12 |
5 |
6 |
0 |
11 |
|
Amount of time lane miles are closed to vehicle traffic (annually) |
0 |
4 |
11 |
5 |
5 |
3 |
13 |
|
Population |
0 |
2 |
9 |
7 |
4 |
6 |
17 |
|
Population growth rate |
0 |
2 |
9 |
7 |
7 |
3 |
17 |
|
Number of federally declared disasters annually |
0 |
3 |
12 |
3 |
7 |
3 |
13 |
|
Dollars ($) spent to address federally declared disasters annually |
0 |
3 |
12 |
4 |
7 |
2 |
13 |
|
Gross domestic product (GDP) |
0 |
5 |
12 |
3 |
6 |
2 |
11 |
16. Optional: Share additional context for this section. [Written responses not included.]
Freight Movement and Economic Vitality
In interviews with policy experts and funding recipients, we heard various opinions about potential, new federal highway formula programs. Setting aside bigger picture questions about the need for new federal highway formula programs, we would like your opinion on using the variables below to distribute funds for a potential, new program focused on freight movement and economic vitality.
As mentioned above, we are using the national goals for the federal-aid highway program (listed under 23 U.S.C. 150(b)) as a framework to consider these potential, new programs. The national goal of freight movement and economic vitality is to improve the National Highway Freight Network, strengthen the ability of rural communities to access national and international trade markets, and support regional economic development.
17. Generally, in a formula to distribute funds for a potential, new federal highway program focused on freight movement and economic vitality, would you support using variables that measure outcomes (e.g., truck travel time reliability index)?
|
Yes |
23 |
|
No |
2 |
|
No Opinion |
3 |
18. Generally, in a formula to distribute funds for a potential, new federal highway program focused on freight movement and economic vitality, would you support using variables that measure system size and use (e.g., lane miles or truck vehicle miles traveled)?
|
Yes |
21 |
|
No |
3 |
|
No Opinion |
4 |
19. If a new federal highway formula program with a focus on freight movement and economic vitality were created, to what extent would you support, if at all, including the variables below in a formula to distribute funds?
|
|
No opinion |
Not at all support |
Slightly support |
Moderately support |
Strongly support |
Support (sum of all levels of support) |
|
Truck Travel Time Reliability Index |
2 |
2 |
4 |
9 |
11 |
24 |
|
Truck vehicle miles traveled (truck VMT) |
2 |
1 |
6 |
12 |
7 |
25 |
|
Freight throughput |
3 |
3 |
5 |
7 |
10 |
22 |
|
Truck VMT on designated freight routes (National Highway Freight Network, Critical Urban Freight Corridor, or Critical Rural Freight Corridor) |
2 |
3 |
4 |
8 |
11 |
23 |
|
Tons of freight carried over designated freight routes (National Highway Freight Network, Critical Urban Freight Corridor, or Critical Rural Freight Corridor) |
3 |
4 |
4 |
8 |
9 |
21 |
|
Lane miles on National Highway Freight Network |
2 |
3 |
7 |
9 |
7 |
23 |
|
Number of freight connections (e.g., number of commercial airports, truck-train intermodal terminals, sea and river ports) |
4 |
5 |
5 |
10 |
4 |
19 |
|
Population growth rate |
3 |
10 |
8 |
5 |
2 |
15 |
|
Gross domestic product (GDP) |
3 |
8 |
6 |
7 |
4 |
17 |
20. Optional: Share additional context for this section. [Written responses not included.]
Environmental Sustainability
In interviews with policy experts and funding recipients, we heard various opinions about potential, new federal highway formula programs. Setting aside bigger picture questions about the need for new federal highway formula programs, we would like your opinion on using the variables below to distribute funds for a potential, new program focused on environmental sustainability.
As mentioned above, we are using the national goals for the federal-aid highway program (listed under 23 U.S.C. 150(b)) as a framework to consider these potential, new programs. The national goal of environmental sustainability is to enhance the performance of the transportation system while protecting and enhancing the natural environment.
21. Generally, in a formula to distribute funds for a potential, new federal highway program focused on environmental sustainability, would you support using variables that measure outcomes (e.g., total emissions for applicable criteria pollutants)?
|
Yes |
18 |
|
No |
7 |
|
No Opinion |
3 |
22. Generally, in a formula to distribute funds for a potential, new federal highway program focused on environmental sustainability, would you support using variables that measure system size and use (e.g., percentage of lane miles on the National Highway System (NHS) at risk due to weather or geological events)?
|
Yes |
13 |
|
No |
10 |
|
No Opinion |
5 |
23. If a new federal highway formula program with a focus on environmental sustainability were created, to what extent would you support, if at all, including the variables below in a formula to distribute funds?
|
|
No opinion |
Not at all support |
Slightly support |
Moderately support |
Strongly support |
Support (sum of all levels of support) |
|
Total emissions for applicable criteria pollutants (NOx, VOC, CO, PM10, PM2.5) |
4 |
7 |
3 |
6 |
8 |
17 |
|
Air quality index |
3 |
5 |
7 |
3 |
10 |
20 |
|
Carbon emissions per federal highway funds spent |
3 |
12 |
2 |
4 |
7 |
13 |
|
Population |
4 |
11 |
3 |
8 |
2 |
13 |
|
Population density in areas with underserved racial and ethnic populations |
3 |
9 |
6 |
7 |
3 |
16 |
|
Population density in areas with higher rates of poverty |
4 |
8 |
7 |
6 |
3 |
16 |
|
Increase in transportation emissions as access to key destinations is increased |
6 |
6 |
7 |
6 |
3 |
16 |
|
Percentage of impermeable surface area |
5 |
10 |
3 |
4 |
6 |
13 |
|
Percentage increase in lane miles over last 5 years |
4 |
9 |
6 |
7 |
2 |
15 |
|
Percentage of lane miles and bridge deck area on the National Highway System (NHS) at risk for damage due to weather or geological events (e.g., flooding, tornadoes, hurricanes, earthquakes) |
5 |
3 |
10 |
5 |
5 |
20 |
|
Vehicle miles traveled (VMT) on roadways and bridges on the NHS at risk for damage due to weather or geological events (e.g., flooding, tornadoes, hurricanes, earthquakes) |
5 |
6 |
9 |
3 |
5 |
17 |
24. Optional: Share additional context for this section. [Written responses not included.]
Reduced Project Delivery Delays
In interviews with policy experts and funding recipients, we heard various opinions about potential, new federal highway formula programs. Setting aside bigger picture questions about the need for new federal highway formula programs, we would like your opinion on using the variables below to distribute funds for a potential, new program to reduce project delivery delays.
As mentioned above, we are using the national goals for the federal-aid highway program (listed under 23 U.S.C. 150(b)) as a framework to consider these potential, new programs. The national goal of reduced project delivery delays is to reduce project costs, promote jobs and the economy, and expedite the movement of people and goods by accelerating project completion through eliminating delays in the project development and delivery process, including reducing regulatory burdens and improving agencies’ work practices.
25. Generally, in a formula to distribute funds for a potential, new federal highway program focused on reduced project delivery delays, would you support using variables that measure outcomes (e.g., percentage of projects that stay within 110% of contract days)?
|
Yes |
9 |
|
No |
13 |
|
No Opinion |
6 |
26. Generally, in a formula to distribute funds for a potential, new federal highway program focused on reduced project delivery delays, would you support using variables that measure system size (e.g., population)?
|
Yes |
8 |
|
No |
14 |
|
No Opinion |
6 |
27. If a new federal highway formula program with a focus on reduced project delivery delays were created, to what extent would you support, if at all, including the variables below in a formula to distribute funds?
|
|
No opinion |
Not at all support |
Slightly support |
Moderately support |
Strongly support |
Support (sum of all levels of support) |
|
Percentage of projects requiring National Environmental Policy Act approval running an average of 2 years or less over contracted timeline |
5 |
9 |
3 |
9 |
2 |
14 |
|
Percentage of projects that qualify for a categorical exclusion running an average of 2 years or less over contracted timeline |
6 |
8 |
4 |
7 |
3 |
14 |
|
Percentage of projects within 110% of contract days |
5 |
9 |
4 |
8 |
2 |
14 |
|
Percentage of projects in the current state transportation improvement program that have a design-build element |
7 |
11 |
4 |
3 |
3 |
10 |
|
Average length of construction season |
6 |
10 |
2 |
7 |
3 |
12 |
28. Optional: Share additional context for this section. [Written responses not included.]
29. Optional: Would you like to share any final thoughts on variables to include in formulas to distribute federal highway funds for potential, new programs? Please do so here. [Written responses not included.]
Appendix VIII: Selected Stakeholder and Funding Recipient Identified Variables and Available Data Sources for Those Variables
Tables 13 through 19 show the source, if available, for variables identified by selected funding recipients and subrecipients and stakeholders. Each table shows the variables and data source by potential new program.
Table 13: Variables Identified for a Potential New Safety Formula Program, with Federal Data Sources
|
Variable |
Federal data source |
|
Average daily traffic |
Federal Highway Administration (FHWA), Highway Statistics Series · Weighted average daily traffic per lane |
|
Fatalities per 100 million vehicle miles traveled |
National Highway Traffic Safety Administration, Fatality Analysis Report System · Fatality rate per 100 million vehicle miles traveled |
|
Fatalities per 100,000 population |
National Highway Traffic Safety Administration, Fatality Analysis Report System · Fatalities and fatality rates by state Census Bureau, State Population Data · Population |
|
Number of fatalities |
National Highway Traffic Safety Administration, Fatality Analysis Report System · Fatalities and fatality rates by state |
|
Number of motor vehicle crashes |
None identified. According to Department of Transportation (DOT) officials, the National Highway Traffic Safety Administration does not collect data on motor vehicle crashes that do not result in fatalities. |
|
Number of motorized fatalities |
National Highway Traffic Safety Administration, Fatality Analysis Report System National statistics – vehicle occupants |
|
Number of motorized serious injuries |
None identified. |
|
Number of non-motorized fatalities |
National Highway Traffic Safety Administration, Fatality Analysis Report System · National statistics – nonmotorists |
|
Number of non-motorized serious injuries |
FHWA, State Highway Safety Improvement Program Annual Report · Number of non-motorized serious injuries as reported by each state |
|
Number of serious injuries |
FHWA, State Highway Safety Improvement Program Annual Report · Number of serious injuries as reported by each state |
|
Population |
Census Bureau, State Population Totals and Components of Change · Population |
|
Population growth rate |
Census Bureau, State Population Totals and Components of Change · Population growth rate |
|
Serious injuries per 100 million vehicle miles traveled |
FHWA, State Highway Safety Improvement Program Annual Report · Number of serious injuries per 100 million vehicle miles as reported by each state |
|
Serious injuries per 100,000 population |
FHWA, State Highway Safety Improvement Program Annual Report · Number of serious injuries as reported by each state Census Bureau, State Population Data · Population |
|
Total center-line miles |
FHWA, Highway Statistics Series · Public roads, Length by ownership |
|
Total lane miles |
FHWA, Highway Statistics Series · Public roads, Estimated lane-miles by functional system |
|
Vehicle miles traveled |
FHWA, Highway Statistics Series · Vehicle miles of travel by functional system |
Source: GAO analysis of Department of Transportation and Census Bureau data sources. | GAO‑25‑107097
Table 14: Variables Identified for a Potential New Infrastructure Condition Formula Program, with Federal Data Sources
|
Variable |
Federal data source |
|
Average daily low temperature does not exceed 32 degrees at least 20 weeks per year |
National Oceanic and Atmospheric Administration, National Centers for Environmental Information · Climate at a Glance: Statewide Time Series |
|
Cost of rehabilitating National Highway System (NHS) roads and bridges in fair condition |
None identified. According to Federal Highway Administration (FHWA) officials, it is not possible to match estimates or actual cost data to repair roads or bridges with their condition. |
|
Cost of replacing NHS roads and bridges in poor condition |
None identified. According to FHWA officials, it is not possible to match estimates or actual cost data to replace roads or bridges with their condition. |
|
Deck area of NHS bridges |
None identified. According to FHWA officials, the agency will collect and report deck area of NHS bridges starting in 2026. |
|
Lane miles on NHS designated as evacuation or emergency routes |
None identified. According to FHWA and Federal Emergency Management Agency officials, this information is not collected. |
|
Median income |
Census Bureau, American Community Survey · Median income |
|
National Highway Construction Cost Index |
None identified. According to FHWA officials, this index is created by a third party and not validated by FHWA. Also, it only covers 47 states, and it is meant to describe trends in construction costs, not provide actual costs in each state. |
|
Percentage of NHS bridges classified as in good condition |
FHWA, Transportation Performance Management, State Highway Infrastructure Reports · Percentage of NHS bridges classified as in good condition |
|
Percentage of NHS bridges classified as in poor condition |
FHWA, Transportation Performance Management, State Highway Infrastructure Reports · Percentage of NHS bridges classified as in poor condition |
|
Percentage of pavements of the interstate system in good condition |
FHWA, Transportation Performance Management, State Highway Infrastructure Reports · Percentage of pavements of the Interstate System in good condition |
|
Percentage of pavements of the interstate system in poor condition |
FHWA, Transportation Performance Management, State Highway Infrastructure Reports · Percentage of pavements of the Interstate System in poor condition |
|
Percentage of pavements of the non-interstate NHS in poor condition |
FHWA, Transportation Performance Management, State Highway Infrastructure Reports · Percentage of pavements of the non-Interstate NHS in poor condition |
|
Percentage of pavements of the non-interstate NHS in good condition |
FHWA, Transportation Performance Management, State Highway Infrastructure Reports · Percentage of pavements of the non-Interstate NHS in good condition |
|
Percentage of roads or bridges that are part of National Highway Freight Network |
None identified. FHWA maintains a table of National Highway Freight Network mileages by state on its website but does not report on the percentage of roads and bridges on the network. |
|
Population |
Census Bureau, State Population Totals and Components of Change · Population |
|
Population growth rate |
Census Bureau, State Population Totals and Components of Change · Population growth rate |
|
Total lane miles |
FHWA, Highway Statistics Series · Public roads, Estimated lane-miles by functional system |
|
Vehicle miles traveled |
FHWA, Highway Statistics Series · Vehicle miles of travel by functional system |
|
Vehicle throughput |
None identified. According to FHWA officials, FHWA does not calculate the number of vehicles or volume of freight on any particular route. However, they stated the capacity of the NHS can be computed using the Transportation Review Board’s Highway Capacity Manual Methods. |
Source: GAO analysis of Department of Transportation, Census Bureau, and National Centers for Environmental Information data sources. | GAO‑25‑107097
Table 15: Variables Identified for a Potential New Congestion Reduction Formula Program, with Federal Data Sources
|
Variable |
Federal data source |
|
Access to key destinations (e.g., jobs, schools, medical care) |
None identified. However, according to Environmental Protection Agency (EPA) officials, the Smart Location Database—which was created by EPA—could be used to measure access to jobs. |
|
Annual change in number of freight trucks on National Highway System (NHS) |
None identified. According to Federal Highway Administration (FHWA) officials, FHWA does not calculate the number of vehicles or volume of freight on any particular route. |
|
Annual change in vehicle miles traveled per capita |
FHWA, Highway Statistics Series · Vehicle miles of travel by functional system Census Bureau, State Population Data · Population |
|
Annual hours of peak-hour excessive delay |
FHWA, Transportation Performance Management, State Highway Reliability Reports · Annual hours of peak-hour excessive delay |
|
Number of freight trucks on the NHS annually |
None identified. According to FHWA officials, FHWA does not calculate the number of vehicles or volume of freight on any particular route. |
|
Percent of non-single occupancy vehicle travel |
FHWA, Transportation Performance Management, State Highway Reliability Reports · Percent of non-single occupancy vehicle travel |
|
Percentage of adult population without valid driver’s license |
FHWA, Highway Statistics Series · Licensed drivers – Ratio of licensed drivers to population |
|
Population |
Census Bureau, State Population Data Population |
|
Population density |
Census Bureau, State Population Totals and Components of Change · Population density |
|
Population growth rate |
Census Bureau, State Population Totals and Components of Change · Population growth rate |
|
Projected increase in vehicle miles traveled over the next 10 years |
None identified. According to FHWA officials, the agency does not project future vehicle miles traveled and does not think it would be possible to calculate by state. |
|
Throughput of people and goods |
None identified. According to FHWA officials, FHWA does not calculate the number of vehicles or volume of freight on any particular route. |
|
Total center-line miles |
FHWA, Highway Statistics Series · Public roads, Length by ownership |
|
Total lane miles |
FHWA, Highway Statistics Series · Public roads, Estimated lane-miles by functional system |
|
Total lane miles on the National Highway Freight Network |
FHWA, Freight Management and Operations website Table of National Highway Freight Network mileages by state |
|
Total miles of sidewalks |
None identified. According to FHWA officials, the agency does not collect this data and states also do not collect this data. |
|
Travel Time Index |
Bureau of Transportation Statistics · Travel Time Index |
|
Truck Travel Time Reliability Index |
FHWA, State Performance Dashboard and Reports · Truck Travel Time Reliability Index |
|
Vehicle miles traveled |
FHWA, Highway Statistics Series · Vehicle miles of travel by functional system |
|
Vehicle miles traveled per capita |
FHWA, Highway Statistics Series · Vehicle miles of travel by functional system Census Bureau, State Population Data · Population |
Source: GAO analysis of Department of Transportation, EPA, and Census Bureau data sources. | GAO‑25‑107097
Table 16: Variables Identified for a Potential New System Reliability Formula Program, with Federal Data Sources
|
Variable |
Federal data source |
|
Amount of time lane miles are closed to vehicle traffic (annually) |
None identified. According to Federal Highway Administration (FHWA) officials, the agency collects the length of miles that are open. The agency does not collect the amount of time lane miles are open or closed. |
|
Annual hours of peak-hour excessive delay |
FHWA, Transportation Performance Management, State Highway Reliability Reports · Annual hours of peak-hour excessive delay |
|
Dollars ($) spent to address federally declared disasters annually |
Federal Emergency Management Agency (FEMA) Disaster Relief Fund: Monthly · Obligations |
|
Gross domestic product (GDP) |
Bureau of Economic Analysis · GDP by state |
|
Number of federally declared disasters annually |
FEMA, Disaster Declarations for States and Counties |
|
Percent of non-single occupancy vehicle travel |
FHWA, Transportation Performance Management, State Highway Reliability Reports · Percent of non-single occupancy vehicle travel |
|
Percentage of person-miles traveled on the Interstate that are reliable |
FHWA, State Performance Dashboard and Reports · Interstate highway reliable person-miles traveled |
|
Percentage of person-miles traveled on the non-Interstate National Highway System (NHS) that are reliable |
FHWA, State Performance Dashboard and Reports · Non-interstate NHS reliable person-miles traveled |
|
Percentage of road miles that are less than 20 feet wide |
None identified. According to FHWA officials, the Highway Statistics Series will start tracking and publishing this data in the future. |
|
Population |
Census Bureau, State Population Totals · Population |
|
Population growth rate |
Census Bureau, State Population Totals and Components of Change · Population growth rate |
|
Total lane miles |
FHWA, Highway Statistics Series · Public roads, Estimated lane-miles by functional system |
|
Travel Time Index |
Bureau of Transportation Statistics · Travel Time Index |
|
Truck vehicle miles traveled |
FHWA, Highway Statistics Series · Vehicle miles of travel by functional system · Distribution of annual vehicle distance traveled |
|
Vehicle miles traveled |
FHWA, Highway Statistics Series · Vehicle miles of travel by functional system |
Source: GAO analysis of Department of Transportation, Census Bureau, Bureau of Economic Analysis, and FEMA data sources. | GAO‑25‑107097
Table 17: Variables Identified for a Potential New Freight Movement and Economic Vitality Formula Program, with Federal Data Sources
|
Variable |
Federal data source |
|
Freight throughput |
None identified. According to Federal Highway Administration (FHWA) officials, FHWA does not calculate the number of vehicles or volume of freight on any particular route. |
|
Gross domestic product (GDP) |
Bureau of Economic Analysis · GDP by state |
|
Number of freight connections (e.g., number of commercial airports, truck-train intermodal terminals, and sea and river ports) |
FHWA, Office of Planning, Environment, and Realty · Intermodal Connectors - U.S. National Highway System (NHS) connectors list |
|
Population growth rate |
Census Bureau, State Population Totals and Components of Change · Population growth rate |
|
Tons of freight carried over National Highway Freight Network |
None identified. According to FHWA officials, the data are not available for specific roadways or by state. |
|
Total lane miles on the National Highway Freight Network |
FHWA, Freight Management and Operations · Table of National Highway Freight Network mileages by state |
|
Truck Travel Time Reliability Index |
FHWA, State Performance Dashboard and Reports · Truck Travel Time Reliability Index |
|
Truck vehicle miles traveled |
FHWA, Highway Statistics Series · Vehicle miles of travel by functional system · Distribution of annual vehicle distance traveled |
|
Truck vehicle miles traveled on National Highway Freight Network |
FHWA. According to FHWA officials, the agency collects the data needed to calculate this by state. However, it is not reported publicly. |
Source: GAO analysis of Department of Transportation, Bureau of Economic Analysis, and Census Bureau data sources. | GAO‑25‑107097
Table 18: Variables Identified for a Potential New Environmental Sustainability Formula Program, with Federal Data Sources
|
Variable |
Federal data source |
|
Air quality index |
None identified. Environmental Protection Agency (EPA) officials told us ambient air quality data should not be aggregated across an entire state. |
|
Carbon emissions per federal highway funds spent |
Federal Highway Administration (FHWA), Highway Statistics Series · Revenues used for highways, all units of government EPA, National and State Level Inventory of U.S. Greenhouse Gas Emissions and Sinks |
|
Increase in transportation emissions as access to key destinations is increased |
None identified. |
|
Percentage increase in lane miles over last 5 years |
FHWA, Highway Statistics Series · Public roads, Estimated lane-miles by functional system |
|
Percentage of impermeable surface area |
U.S. Geological Survey, Multi-Resolution Land Characteristics Consortium · National Land Cover Database, Imperviousness Contiguous U.S., Alaska, and Hawaii datasets |
|
Percentage of lane miles and bridge deck area on the National Highway System (NHS) at risk for damage due to weather or geological events (e.g., flooding, tornadoes, hurricanes, earthquakes) |
None identified. FHWA and Federal Emergency Management Agency (FEMA) officials told us they do not collect data on this topic. |
|
Population |
Census Bureau, State Population Totals · Population |
|
Population density in areas with higher rates of poverty |
Census, American Community Survey · Population density of census tracts in each state with 30% or higher poverty rate |
|
Population density in areas with underserved racial and ethnic populations |
Census, American Community Survey · Population density of census tracts in each state with population 75% or more American Indian or Alaskan Native, Black or African American, and Hispanic |
|
Total emissions for applicable criteria pollutants (i.e., nitrogen oxides (NOx), volatile organic compounds (VOC), carbon monoxide (CO, and particulate matter 10 and 2.5 (PM10 and PM2.5) |
EPA, National Emissions Inventory · Data for criteria air pollutants can be aggregated to the state level from estimated pollutant amounts at the county level. |
|
Vehicle miles traveled (VMT) on roadways and bridges on the NHS at risk for damage due to weather or geological events (e.g., flooding, tornadoes, hurricanes, earthquakes) |
None identified. FHWA and FEMA officials told us they do not collect data on this topic. |
Source: GAO analysis of federal data sources. | GAO‑25‑107097
Table 19: Variables Identified for a Potential New Reduced Project Delivery Delays Program, with Federal Data Sources
|
Variable |
Federal data source |
|
Average length of construction season |
National Weather Service, Forecast Office Data · Past weather – monthly temperatures |
|
Percentage of projects in the current state transportation improvement program that have a design-build element |
None identified. According to Federal Highway Administration (FHWA) officials, these data are not collected. The data may be collected at the state level. |
|
Percentage of projects requiring National Environmental Policy Act approval running an average of 2 years or less over contracted timeline |
None identified. According to FHWA officials, agency financial systems do not include data related to delays. |
|
Percentage of projects that qualify for categorical exclusion running an average of 2 years or less over contracted timeline |
None identified. According to FHWA officials, agency financial systems do not include data related to delays. |
|
Percentage of projects within 110% of contract days |
None identified. According to FHWA officials, agency financial systems do not include data related to delays. |
Source: GAO analysis of Department of Transportation and National Weather Service data sources. | GAO‑25‑107097
GAO Contact
Elizabeth Repko, RepkoE@gao.gov
Staff Acknowledgments
In addition to the contact named above, Matt Voit (Assistant Director); Sarah Arnett (Analyst in Charge); Jason Coates; Elke Kolodinski; Gina Hoover; Delwen Jones; Jeff Larson; Theresa Osborne; Mary-Catherine P. Overcash; Pamela Snedden; Michael Soressi; Malika Williams; and Alicia Wilson made key contributions to this report.
The Government Accountability Office, the audit, evaluation, and investigative arm of Congress, exists to support Congress in meeting its constitutional responsibilities and to help improve the performance and accountability of the federal government for the American people. GAO examines the use of public funds; evaluates federal programs and policies; and provides analyses, recommendations, and other assistance to help Congress make informed oversight, policy, and funding decisions. GAO’s commitment to good government is reflected in its core values of accountability, integrity, and reliability.
Obtaining Copies of GAO Reports and Testimony
The fastest and easiest way to obtain copies of GAO documents at no cost is through our website. Each weekday afternoon, GAO posts on its website newly released reports, testimony, and correspondence. You can also subscribe to GAO’s email updates to receive notification of newly posted products.
Order by Phone
The price of each GAO publication reflects GAO’s actual cost of production and distribution and depends on the number of pages in the publication and whether the publication is printed in color or black and white. Pricing and ordering information is posted on GAO’s website, https://www.gao.gov/ordering.htm.
Place orders by calling (202) 512-6000, toll free (866) 801-7077,
or
TDD (202) 512-2537.
Orders may be paid for using American Express, Discover Card, MasterCard, Visa, check, or money order. Call for additional information.
Connect with GAO
Connect with GAO on X,
LinkedIn, Instagram, and YouTube.
Subscribe to our Email Updates. Listen to our Podcasts.
Visit GAO on the web at https://www.gao.gov.
To Report Fraud, Waste, and Abuse in Federal Programs
Contact FraudNet:
Website: https://www.gao.gov/about/what-gao-does/fraudnet
Automated answering system: (800) 424-5454
Media Relations
Sarah Kaczmarek, Managing Director, Media@gao.gov
Congressional Relations
A. Nicole Clowers, Managing Director, CongRel@gao.gov
General Inquiries
[1]GAO, Clean Water: Revolving Fund Grant Formula Could Better Reflect Infrastructure Needs, and EPA Could Improve Needs Estimate, GAO‑24‑106251 (Washington, D.C.: July 19, 2024); and Formula Grants: Funding for the Largest Federal Assistance Programs Is Based on Census-Related Data and Other Factors, GAO‑10‑263 (Washington, D.C.: Dec. 15, 2009).
[2]See Pub. L. No. 117-58, 135 Stat. 429 (2021).
[3]We initiated this work at the request of the former Chair of the Senate Appropriations Committee, Subcommittee on Transportation, Housing and Urban Development and Related Agencies.
[4]The Appalachian Regional Commission provides information to FHWA that serves as the basis of the funding amounts distributed through the Appalachian Development Highway System program.
[5]For the purposes of this report, “recipient” includes both recipients and subrecipients (e.g., MPOs) of federal highway formula funding.
[6]We also asked interviewees what, if anything, should be taken into account when using the variables they suggested in a formula. We did not ask them to create formulas for potential new programs by selecting specific variables or to propose how variables should be weighted (i.e., the positive or negative percentage applied to a variable).
[7]See 23 U.S.C. § 150(b).
[8]The selected funding recipients and stakeholders we interviewed identified more than 100 variables that could be used in formulas to distribute funding for potential new highway programs.
[9]We selected this definition of “supported variables” to enable us to focus on the variables with the strongest and broadest level of support. Throughout this report, to characterize the views of selected funding recipients (Tribes, state DOTs, and MPOs) and stakeholders, we use the following modifiers: “most” represents at least three-quarters of interviewees in a group; “several” represents at least half but less than three-quarters of interviewees in a group; and “some” represents less than half of interviewees in a group.
[10]For the purpose of this report, the federal-aid highway program is an umbrella term for a collection of formula and nonformula grant programs authorized under 23 U.S.C. Chapter 1. Under the surface transportation reauthorization act that preceded MAP-21, each individual formula program under the federal-aid highway program received authorized funding for each fiscal year covered by the act. Then different formulas with different variables, such as population, vehicle miles traveled, and lane miles, were used to calculate how each program’s authorized funding was apportioned among the 50 states and the District of Columbia. In contrast, MAP-21 authorized a single amount of funding for all federal-aid highway formula programs for each fiscal year covered by the act. This single amount was first apportioned among the states and the District of Columbia. Then, the amount of each state’s apportionment was divided among the federal-aid highway formula programs.
[11]For the purpose of this report, highway formula programs refer to the nine federal-aid highway formula programs, the Bridge Formula Program, the National Electric Vehicle Infrastructure (NEVI) Formula Program, the Tribal Transportation Program, and the Appalachian Development Highway System program. Appendices II through VI provide additional detail on the 13 highway formula programs, their purposes, and the variables used to distribute funding to recipients.
[12]For the purpose of this report, the federal-aid highway program is an umbrella term for a collection of formula and nonformula grant programs authorized under 23 U.S.C. Chapter 1.
[13]In addition to distribution using a statutory formula, the term “apportionment” may be used to refer to the amount of funding that each eligible entity receives under the highway formula program.
[14]See 23 U.S.C. § 119(b).
[15]Federal statute and FHWA regulations generally require surface transportation and other projects to be included in a state transportation improvement program, which must be jointly approved by FHWA and the Federal Transit Administration, to be eligible for the funding they administer.
[16]For the purposes of the highway formula programs discussed in this report, a “state” is defined as any of the 50 states, the District of Columbia, or Puerto Rico. While all these entities are eligible for Bridge Formula Program and NEVI Formula Program funding, Puerto Rico is not eligible to receive funding under the nine federal-aid highway formula programs, unless otherwise specifically provided. See 23 U.S.C. § 165(b)(3).
[17]State DOTs are the recipients of funding through the Metropolitan Planning Program and are generally required by statute to make the grant funding available to MPOs within their state. See 23 U.S.C. §§ 104(d)(1), 134(p). For the purpose of this report, “recipient” includes both recipients and subrecipients (e.g., MPOs) of federal highway formula funding.
[18]Several variables across potential new programs were just under this threshold. See appendix VII for our survey and results.
[19]The NHS consists of approximately 220,000 miles of public roads, including the 49,000-mile Interstate System as well as non-Interstate highways.
[20]As required by statute, FHWA issued regulations establishing performance measures for selected federal-aid highway programs. See 23 U.S.C. § 150(c); 23 C.F.R. Part 490. States (including the District of Columbia and Puerto Rico) are required to set performance targets for these measures and report to FHWA on their progress towards achieving their targets, among other information.
[21]The Truck Travel Time Reliability Index is calculated using data such as the lengths of selected Interstate segments and average truck travel time for those segments. This Index can track the consistency or predictability in travel times as measured across specific days and time periods.
[22]“National Performance Dashboard: How Are U.S. Highways Performing?” Transportation Performance Management, Federal Highway Administration, last modified June 7, 2022, https://www.fhwa.dot.gov/tpm/reporting/national/.
[25]We did not evaluate federal data collection efforts or agency decisions on what data to collect.
[26]Each dataset reported as part of FHWA’s Transportation Performance Management measures is collected with a different frequency but is reported at least every 2 years. FHWA’s Highway Statistics Series consists of annual reports containing statistical information on highway use.
[27]FHWA reports data for the following eight variables: percentage of pavements of the Interstate System in poor condition, percentage of pavements of the Interstate System in good condition, percentage of pavements of the non-Interstate NHS in poor condition, percentage of pavements of the non-Interstate NHS in good condition, percentage of NHS bridges classified as in poor condition, percentage of NHS bridges classified as in good condition, total lane miles, and vehicle miles traveled.
[28]As part of its Transportation Performance Management program, FHWA reports data for the fatalities per 100 million vehicle miles traveled, and serious injuries per 100 million vehicle miles traveled, though these data are collected by the National Highway Traffic Safety Administration as part of its Fatality Analysis Reporting System. The National Highway Traffic Safety Administration collects data that can be combined with population data collected by the Census Bureau to calculate fatalities per 100,000 population and serious injuries per 100,000 population. FHWA also maintains data on total lane miles.
[29]GAO, Traffic Safety: Improved Reporting Could Clarify States’ Achievement of Fatality and Injury Targets, GAO‑20‑53 (Washington, D.C.: Oct. 22, 2019).
[30]FHWA’s regulations containing these and other highway safety performance measures are located in 23 C.F.R. Part 490, Subpart B.
[31]Several DOT offices collect data related to variables identified by survey respondents including FHWA, the National Highway Traffic Safety Administration, and the Bureau of Transportation Statistics. Both FHWA and EPA collect data used to calculate one variable, carbon emissions per federal highway funds spent.
[32]EPA, the National Oceanic and Atmospheric Administration, the Bureau of Economic Analysis, and the U.S. Geological Survey, Multi-Resolution Land Characteristics Consortium maintain data related to six variables on air pollutants, weather, gross domestic product, and permeable surface area, respectively.
[33]For the purpose of this report, the federal-aid highway program is an umbrella term for a collection of formula and nonformula grant programs authorized under 23 U.S.C. Chapter 1.
[34]Throughout this report, to characterize the views of funding recipients and stakeholders, we use the following modifiers: “most” represents at least three-quarters of interviewees in a group; “several” represents at least half but less than three-quarters of interviewees in a group; and “some” represents less than half of interviewees in a group.
[35]For the purpose of the federal-aid highway program, a “state” is defined as any of the 50 states, the District of Columbia, or Puerto Rico. See 23 U.S.C. § 101(a)(28). While all these entities are eligible for Bridge Formula Program and NEVI Formula Program funding, Puerto Rico is not eligible to receive funding under the nine federal-aid highway formula programs, unless otherwise specifically provided. See 23 U.S.C. § 165(b)(3).
[36]For the purpose of this report, “recipient” includes both recipients and subrecipients (e.g., MPOs) of federal highway formula funding.
[37]Two Tribes that we reached out to, Klamath Tribes in Oregon and White Earth Band of Chippewa Indians in Minnesota, did not speak with us.
[38]Two state DOTs declined to speak with us: Arizona and New Mexico. Three state DOTs agreed to speak with us and scheduled interviews, but then did not attend or reschedule: Alaska, Delaware, and Maryland. We reached out to the District of Columbia but were not able to schedule an interview. We decided not to reach out to Wisconsin because we had already scheduled an interview with an MPO in Wisconsin.
[39]See 23 U.S.C. § 150(b).
[40]For the purpose of this report, the federal-aid highway program is an umbrella term for a collection of formula and nonformula grant programs authorized under 23 U.S.C. Chapter 1.
[41]See 23 U.S.C. § 175.
[42]See 23 U.S.C. § 149.
[43]See 23 U.S.C. § 148.
[44]See 23 U.S.C. § 134.
[45]See 23 U.S.C. § 167.
[46]See 23 U.S.C. § 119.
[47]See 23 U.S.C. § 176(c).
[48]See 23 U.S.C. § 130.
[49]See 23 U.S.C. § 133.
[50]For the purpose of the federal-aid highway program, a “state” is defined as any of the 50 states, the District of Columbia, or Puerto Rico. However, Puerto Rico is not eligible to receive funding through the nine federal-aid highway formula programs, unless otherwise specifically provided. See 23 U.S.C. § 165(b)(3).
[51]Section 11101(a)(1) of the IIJA contains these authorized funding amounts for those fiscal years.
[52]See 23 U.S.C. § 104(h). For example, under the IIJA, the base apportionment for FY2025 is $55,700,754,881. See IIJA § 11101(a)(1)(D).
[53]See 23 U.S.C. § 104(c)(1)(A).
[54]These estimated tax payments are those attributable to highway users in the state and associated with certain taxes. See 23 U.S.C. § 104(c)(1)(B).
[55]23 U.S.C. § 104(c)(1)(B).
[56]However, the amounts for each state for safety-related activities and clearinghouses do not appear in FHWA’s notices of federal-aid highway program apportionments because this funding is classified as allocated, not apportioned. See, e.g., FHWA, N4510.880, Apportionment of Federal-Aid Highway Program Funds for Fiscal Year 2024 (Oct. 2, 2023).
[57]See Infrastructure Investment and Jobs Act, Pub. L. No. 117-58, 135 Stat. 429, 1420 (2021).
[58]Infrastructure Investment and Jobs Act, Pub. L. No. 117-58, 135 Stat. 429, 1421 (2021).
[59]See 23 U.S.C. § 202.
[60]The Indian Reservation Roads Program was renamed the Tribal Transportation Program in 2012.
[61]If the total amount available for the Tribal Transportation Program is less than or equal to $275 million, the supplemental funding is 30 percent of the total amount. For each of fiscal years 2022 through 2026, the total amount available has exceeded $275 million.
[62]This calculation relies on the funds received in fiscal years 2005 through 2011 that were distributed according to a relative need distribution factor and population adjustment factor.
[63]See Intermodal Surface Transportation Efficiency Act of 1991, § 1069(y), Pub. L. No. 102‑240, 105 Stat. 1914, 2010 (1991) (authorizing the construction of the ADHS); Infrastructure Investment and Jobs Act, Pub. L. No. 117‑58, 135 Stat. 429, 1428 (2021) (appropriating funding for this purpose).
[64]For the purpose of this report, “recipient” includes both recipients and subrecipients (e.g., MPOs) of federal highway formula funding.