ARMY CORPS OF ENGINEERS
Geographic Distribution of Construction Funding for Water Resources Projects
Report to Congressional Committees
United States Government Accountability Office
View GAO-25-107241. For more information, contact Jeff Arkin at (202) 512-6806 or arkinj@gao.gov.
Highlights of GAO-25-107241, a report to congressional committees
Geographic Distribution of Construction Funding for Water Resources Projects
Why GAO Did This Study
Through its Civil Works program, the Corps plans, designs, constructs, operates, and maintains water resources projects across the U.S. to address flood risk management, navigation, and aquatic ecosystem restoration, among other things.
The Water Resources Development Act of 2022 includes a provision for GAO to review the Corps’ funding of its water resources projects. This report examines (1) the geographic distribution of annual and supplemental funding for water resources projects carried out by the Corps in fiscal years 2018 through 2023, and (2) the factors that contributed to the geographic distribution of funding.
GAO analyzed allocation and geographic data provided by the Corps to determine the location of Corps projects that received construction funding in fiscal years 2018 through 2023. GAO reviewed the annual Energy and Water Development and Related Agencies Appropriations Acts, the accompanying explanatory statements, and the five supplemental appropriations acts that provided construction funding during that period. GAO also reviewed Corps and Army documents, policies, and guidance that described the processes used to identify Corps projects that could receive construction funding from those appropriations acts. GAO interviewed knowledgeable Corps officials about these processes to help determine the factors that contributed to the geographic distribution of construction funding.
What GAO Found
The U.S. Army Corps of Engineers (Corps) manages water resources projects— such as dams, locks, and waterways—across the U.S. to strengthen national security, protect and manage aquatic ecosystems, reduce risks from disasters, and support commerce. In fiscal years 2018 through 2023, the Corps allocated approximately $28.5 billion in appropriated construction funds to 278 projects across 47 states, Washington, D.C., the Commonwealth of Puerto Rico, and the U.S. Virgin Islands (see figure).
The geographic distribution of the Corps’ construction funding in fiscal years 2018 through 2023 resulted from factors included in appropriations legislation and Corps and Army guidance documents.
· Congress directed $8.7 billion (30.5 percent of all construction funding) to specific projects and activities in annual appropriations acts.
· For the remaining $19.8 billion (69.5 percent of funding), Congress included project eligibility criteria and other considerations in appropriations acts that influenced the distribution of funding. The Corps applied these criteria and considerations, along with others identified in Corps and Army guidance, to identify eligible projects and prioritize projects to receive construction funding. After identifying eligible projects, the Corps ranked discrete segments of work at each project to compile a list of proposed allocations. The Corps considered other factors in this process, such as environmental returns and project completion status.
|
Abbreviations |
|
|
|
|
|
Corps |
U.S. Army Corps of Engineers |
|
E&WD Appropriations Act |
Energy and Water Development and Related Agencies Appropriations Act |
|
OMB |
Office of Management and Budget |
This is a work of the U.S. government and is not subject to copyright protection in the United States. The published product may be reproduced and distributed in its entirety without further permission from GAO. However, because this work may contain copyrighted images or other material, permission from the copyright holder may be necessary if you wish to reproduce this material separately.
February 20, 2025
The Honorable Shelley Moore Capito
Chairman
The Honorable Sheldon Whitehouse
Ranking Member
Committee on Environment and Public Works
United States Senate
The Honorable Sam Graves
Chairman
The Honorable Rick Larsen
Ranking Member
Committee on Transportation and Infrastructure
House of Representatives
The U.S. Army Corps of Engineers (Corps) is one of the world’s largest public engineering, design, and construction management agencies. It provides public engineering services across the nation and the world to strengthen national security, protect and manage aquatic ecosystems, reduce risks from disasters, and support commerce.[1] More specifically, through its Civil Works program, the Corps plans, designs, constructs, operates, and maintains water resources projects to address the three primary missions of the program: (1) flood risk management; (2) support of commercial navigation; and (3) restoration, protection, and management of aquatic ecosystems.
In December 2018, we reported on the geographic distribution of the construction projects related to these three Civil Works missions that were included in the President’s budget requests for the Corps from fiscal years 2008 through 2017. We also described how the Corps prioritized construction projects for inclusion in the President’s budget requests for those years.[2]
In fiscal years 2018 through 2023, the Corps allocated approximately $28.5 billion in annual and supplemental appropriations for construction projects related to the Corps’ three primary missions, among other things.[3] Of this amount, approximately $14.4 billion came from annual appropriations and $14.1 billion from five supplemental appropriations acts.[4]
The Water Resources Development Act of 2022 includes a provision for us to review the Corps’ funding of its water resources projects.[5] This report examines: (1) the geographic distribution of annual and supplemental funding for water resources projects carried out by the Corps in fiscal years 2018 through 2023, and (2) the factors that contributed to the geographic distribution of funding.
To answer the first objective, we analyzed appropriations and allocation data provided by the Corps to identify the Corps’ water resources projects that received construction funding in fiscal years 2018 through 2023 in the U.S. and its territories.[6] Using location coordinates provided by the Corps for individual projects, we performed a geospatial analysis to determine the geographic distribution of construction funding during this period. We reviewed work package descriptions to identify examples of work performed using construction funding. We conducted electronic and manual testing of these data to identify missing values, outliers, and obvious errors. We also interviewed knowledgeable Corps officials about the data they provided and the reliability of the data. We found these data to be reliable for the purpose of describing the geographic distribution of construction funding.
To answer the second objective, we reviewed the annual Energy and Water Development and Related Agencies Appropriations Acts for fiscal years 2018 through 2023 and their accompanying explanatory statements to identify factors that may have contributed to the geographic distribution of the Corps’ construction funding during this period.[7] We similarly reviewed the five supplemental appropriation acts passed during the same period to identify such factors. We also reviewed Corps and Army documents, policies, and guidance that described the processes used to identify Corps water resources projects and work packages that could receive construction funding from these annual and supplemental appropriation acts. We interviewed knowledgeable Corps officials about these policies and processes to help determine the factors that contributed to the geographic distribution of construction funding. For more detailed information on our scope and methodology, see appendix I.
We conducted this performance audit from December 2023 to February 2025 in accordance with generally accepted government auditing standards. Those standards require that we plan and perform the audit to obtain sufficient, appropriate evidence to provide a reasonable basis for our findings and conclusions based on our audit objectives. We believe that the evidence obtained provides a reasonable basis for our findings and conclusions based on our audit objectives.
Background
Through the Civil Works Program, the Corps plans, constructs, operates, and maintains a wide range of water resources development projects, such as navigation and flood risk projects. The Corps’ Civil Works program is organized into three tiers: headquarters; eight divisions, which were established generally according to watershed boundaries; and 38 districts nationwide (see figure 1).
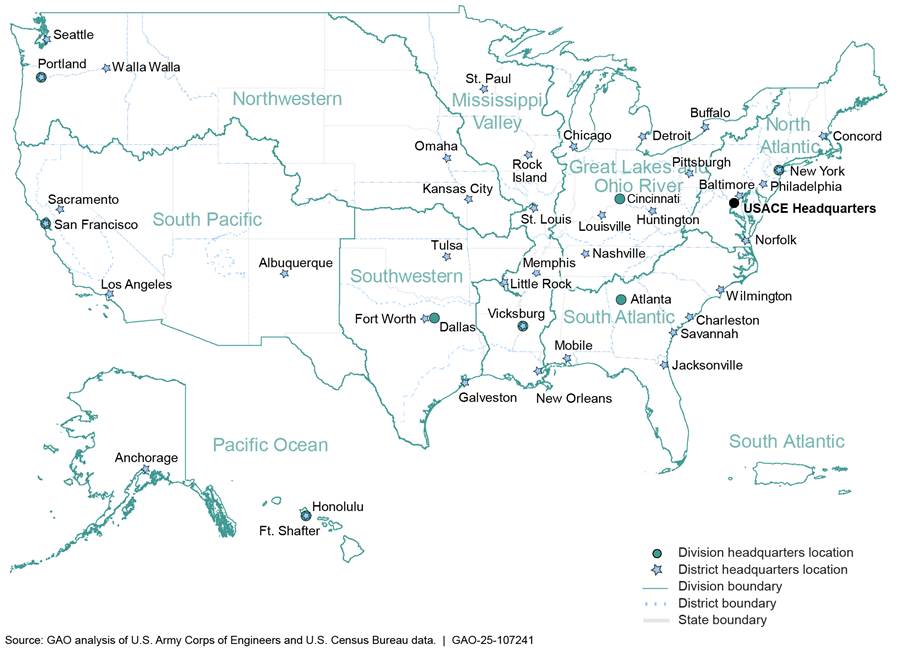
Corps headquarters primarily develops policies and guidance to implement the agency’s responsibilities and sets goals and priorities for the organization. The divisions coordinate the Civil Works projects in the districts within their respective geographic areas.
Corps districts are responsible for planning, engineering, constructing, implementing, and managing Civil Works projects within their respective geographic areas. The Corps conducts construction work at these water resources projects, which are generally locations or structures, such as dams, locks, basins, and waterways.
In fiscal years 2018 through 2023, construction at these projects included work that addressed the Corps’ three main business lines.[8]
· Flood risk management projects are located in areas that may experience riverine and coastal flooding. These projects provide water storage, among other things. Approximately $12.2 billion went to 144 projects for flood risk management construction in fiscal years 2018 through 2023.
· Navigation projects are intended to provide safe, reliable, cost-effective, and environmentally sustainable waterborne transportation systems for the movement of commercial goods. Approximately $10 billion went to 58 navigation construction projects in the same period.
· Aquatic ecosystem restoration projects are located in areas of federal significance that have some degree of habitat scarcity, connectivity, and special-status species, among other characteristics. These projects emphasize the restoration of nationally or regionally significant habitats that primarily involves modifying the hydrology or physical features of the project location. Approximately $5.5 billion went to 39 projects during this time.
In fiscal years 2018 through 2023, approximately $781 million went to other Corps Civil Works business lines—hydropower, recreation, water supply, and environmental infrastructure—as well as national programs or other work under the Corps’ Remaining Items program. Figure 2 shows the dollar amounts allocated to each business line in each of these fiscal years. In fiscal year 2022, the Infrastructure Investment and Jobs Act provided $12.4 billion in construction funding to the Corps, which was the equivalent of about 44 percent of the $28.5 billion allocated by the Corps in fiscal years 2018 through 2023.
Figure 2: Construction Funding Allocation Amounts for U.S. Army Corps of Engineers Civil Works Business Lines, Fiscal Years 2018 through 2023, Billions of Dollars
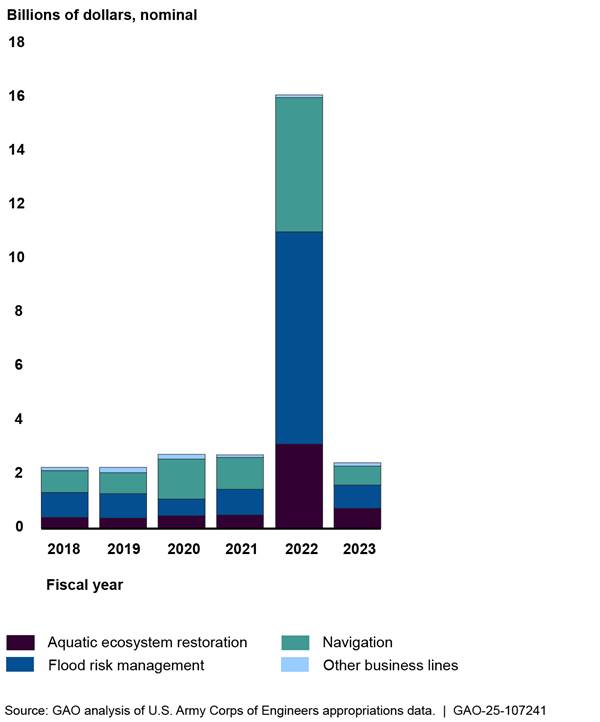
Notes: The primary Civil Works missions are the restoration, protection, and management of aquatic ecosystems; flood risk management; and support of commercial navigation. The “Other Business Lines” category represents four additional business lines that received construction funding in fiscal years 2018 through 2023—hydropower, recreation, water supply, and environmental infrastructure—as well as national programs or other work under the U.S. Army Corps of Engineers’ Remaining Items program.
In fiscal year 2022, the Infrastructure Investment and Jobs Act provided $12.4 billion in construction funding to the U.S. Army Corps of Engineers.
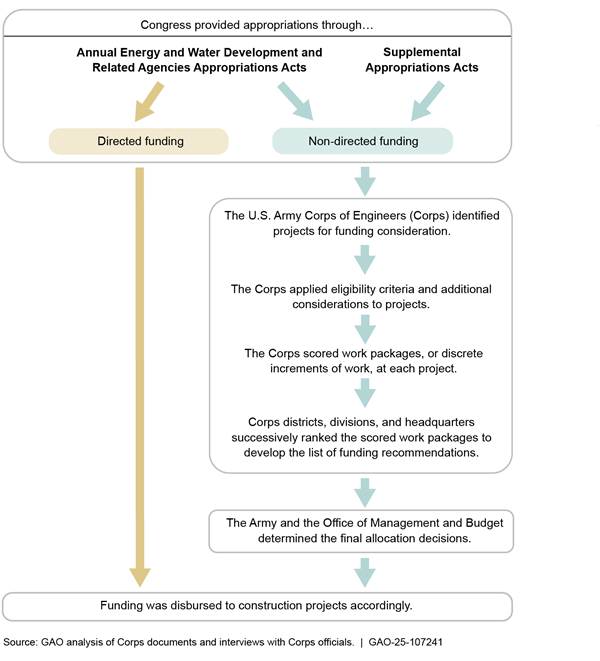
Congress provides funding for this work through annual Energy and Water Development and Related Agencies Appropriations Acts (E&WD Appropriations Act). These acts provide both directed funding—for which Congress specifies the Corps projects that will receive funding—and non-directed funding, which allows the Corps some discretion to propose projects to receive funding.[9] Congress generally provides guidance and parameters in the Explanatory Statement accompanying each annual E&WD Appropriations Act for how to allocate non-directed funding to projects.
Congress may also provide supplemental appropriations to the Corps outside of the annual appropriations process for disaster relief, non-disaster emergencies, or other purposes. Acts providing supplemental appropriations may have an impetus event such as a hurricane or flood disaster, although this is not always the case.[10] For the five acts that provided supplemental appropriations to the Corps in fiscal years 2018 through 2023, the Corps had some discretion to propose projects to receive supplemental funding.
Figure 3 illustrates the different sources of Corps appropriations and whether the Corps has discretion to propose projects to receive funding.
Figure 3: Overview of Funding Allocation Process for U.S. Army Corps of Engineers Water Resources Projects
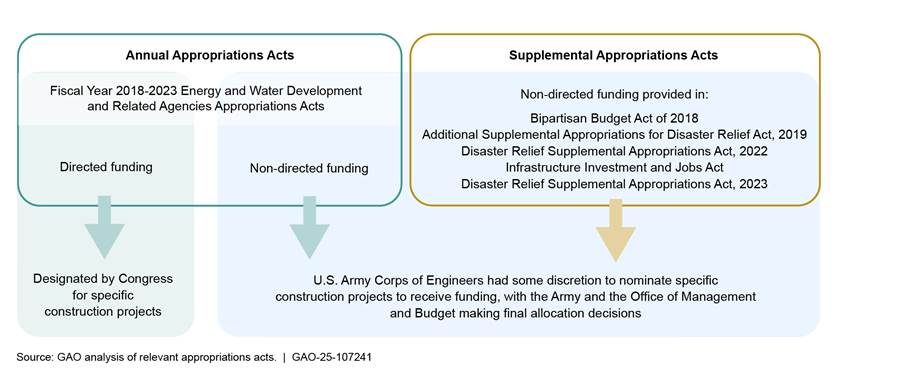
Note: Directed funding refers to funding that is already specified for specific projects and activities, including the projects and activities listed in the construction account table in the explanatory statements. Non-directed funding is funding provided under the heading “additional funding” in the explanatory statements and funding provided by the supplemental appropriations acts.
For non-directed funding from both annual and supplemental appropriation acts, the Corps proposes a list of work packages to the Army and the Office of Management and Budget for allocation purposes. These work packages are discrete increments of work that are to contribute to an overall project and that can be executed independent of funding of additional work packages. For example, one work package in fiscal year 2022 corresponded to dredging a portion of Freeport Harbor (Texas), while another work package in the same fiscal year corresponded to awarding a contract for dredging another portion of the harbor.
Construction Funding Went to Corps Projects in 47 States, Two Territories, and Washington, D.C., in Fiscal Years 2018 through 2023
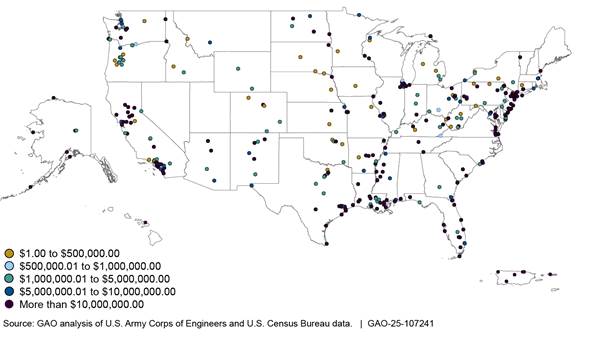
In fiscal years 2018 through 2023, the Corps allocated approximately $28.5 billion in construction funds to 278 Corps projects across 47 states, Washington, D.C., the Commonwealth of Puerto Rico, and the U.S. Virgin Islands.[11] Figure 4 shows the geographic distribution of funding among projects during this period.
Figure 4: Geographic Distribution of Construction Funding at U.S. Army Corps of Engineers Water Resources Projects, Fiscal Years 2018 through 2023
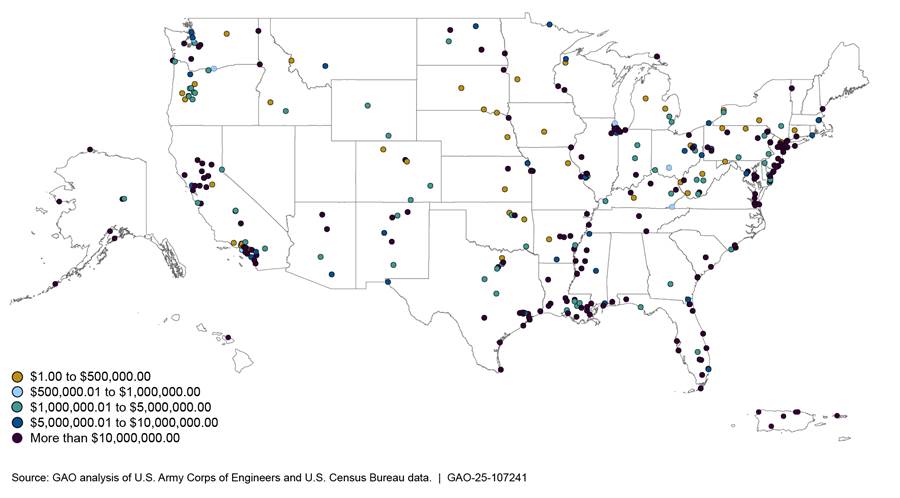
Projects that received construction funding during this period were located across the Corps’ eight divisions and 38 districts. For a list of construction projects by Corps division, the business lines addressed at each project, and the amount of funding received in fiscal years 2018 through 2023, see appendix II.
The total amount of construction funding allocated to Corps projects in an individual state or territory ranged from roughly $2.8 million (Wyoming) to $3.8 billion (Louisiana) in fiscal years 2018 through 2023. The number of Corps projects within an individual state or territory that received funding during this period ranged from one (Alabama, Hawaii, Maine, Rhode Island, Vermont, Washington, D.C., and Wyoming) to 34 (California).
Figure 5 shows the total number of Corps projects that received construction funding above $250 million and the total construction funding amounts, by state and territory, for fiscal years 2018 through 2023.
Figure 5: Total Number of Construction Projects and Construction Funding Amounts above $250 Million for the U.S. Army Corps of Engineers, by State and Territory, Fiscal Years 2018 through 2023, Millions of Dollars
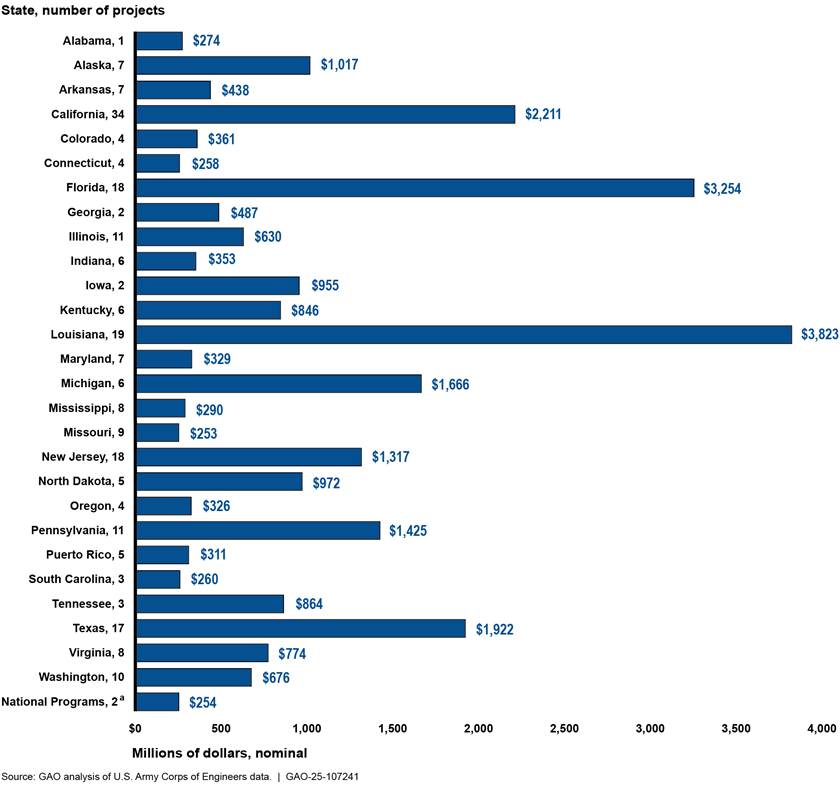
Note: Some construction projects included work that spanned multiple states in fiscal years 2018 through 2023.We assigned funding amounts to a single state based on the corresponding latitude and longitude data provided to us by the U.S. Army Corps of Engineers. For additional details on this analysis, please see appendix I of GAO‑25‑107241.
a”National Programs” includes the Aquatic Plant Control Program and the Dam Safety & Seepage/Stability Correction Program. These programs include work that may not be attributable to any specific location or state.
Figure 6 shows the total number of Corps projects that received construction funding below $250 million and the total construction funding amounts, by state and territory, for fiscal years 2018 through 2023. See appendix III for a list of states and territories that received construction funding in fiscal years 2018 through 2023, the number of projects in each state, and the dollar amounts received by projects in each state in each fiscal year.
Figure 6: Total Number of Construction Projects and Construction Funding Amounts below $250 Million for the U.S. Army Corps of Engineers, by State and Territory, Fiscal Years 2018 through 2023, Millions of Dollars
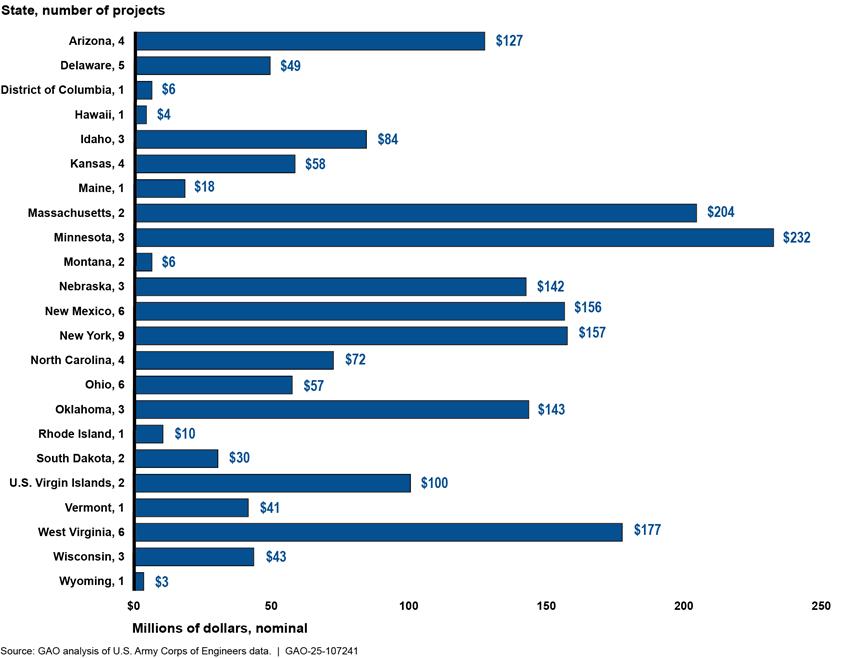
Note: Some construction projects included work that spanned multiple states in fiscal years 2018 through 2023. We assigned funding amounts to a single state based on the corresponding latitude and longitude data provided to us by the U.S. Army Corps of Engineers. For additional details on this analysis, please see appendix I of GAO‑25‑107241.
The six states that received the largest total amounts of construction funding in fiscal years 2018 through 2023 accounted for approximately 50 percent of total dollars and 34 percent of Corps projects that received funding during that period.
· Louisiana: $3.8 billion allocated to 19 projects, including construction and repair of dikes and floodgates, stabilization of levees, and restoration of marsh habitats, among other things.
· Florida: $3.3 billion allocated to 18 projects, including construction work for shore protection, hurricane storm damage reduction, and channel deepening, among other things.
· California: $2.2 billion allocated to 34 projects, including wetlands restoration, construction of dikes, and riverbank erosion repairs, among other things.
· Texas: $1.9 billion allocated to 17 projects, including channel dredging, restoration of habitats for aquatic species, and construction of oyster reefs, among other things.
· Michigan: $1.7 billion allocated to six projects, including construction work for a new lock, construction of a pump well system, and a feasibility study for dam removal to improve fish habitat and restore fish passage, among other things.
· Pennsylvania: $1.4 billion allocated to 11 projects, including dredging to accommodate lower water levels, construction of a new lock, and flood gage installation, among other things.
Congressional Direction, Eligibility Criteria, and the Corps’ Ranking Process Contributed to the Geographic Distribution of Construction Funding
The geographic distribution of the Corps’ construction funding in fiscal years 2018 through 2023 resulted from factors included in appropriations legislation and Corps and Army guidance documents. Congress directed a portion of construction funding in annual appropriation acts to specific Corps projects across the U.S. For non-directed funding in annual and supplemental appropriation acts, Congress included project eligibility criteria and other considerations in the acts that influenced the distribution of funding. The Corps applied these criteria and considerations, along with others identified in guidance documents, to identify eligible projects and prioritize work packages to receive construction funding, as shown in figure 7.
Figure 7: Process for Determining the Geographic Distribution of U.S. Army Corps of Engineers Construction Funding, Fiscal Years 2018 through 2023
Note: Directed funding refers to funding that is already specified for specific projects and activities, including the projects and activities listed in the construction account table in the explanatory statements. Non-directed funding is funding provided under the heading “additional funding” in the explanatory statements and funding provided by the supplemental appropriations acts.
Congress Directed Approximately 30 Percent of Construction Funding to Specific Projects in Fiscal Years 2018 through 2023
Directed funding accounted for $8.7 billion of the $28.5 billion (30.5 percent) in construction funding that the Corps allocated in fiscal years 2018 through 2023 (see figure 8). All $8.7 billion in directed funding was from annual appropriations acts. The Corps also allocated $5.7 billion in non-directed construction funding (20 percent of all construction funding) from the annual appropriations acts. All $14.1 billion in construction funding that the Corps allocated from supplemental appropriations acts in these years was non-directed funding (49.5 percent of all construction funding).
Figure 8: Directed and Non-Directed Construction Funding Amounts Allocated to U.S. Army Corps of Engineers Projects in Fiscal Years 2018 through 2023, Billions of Dollars
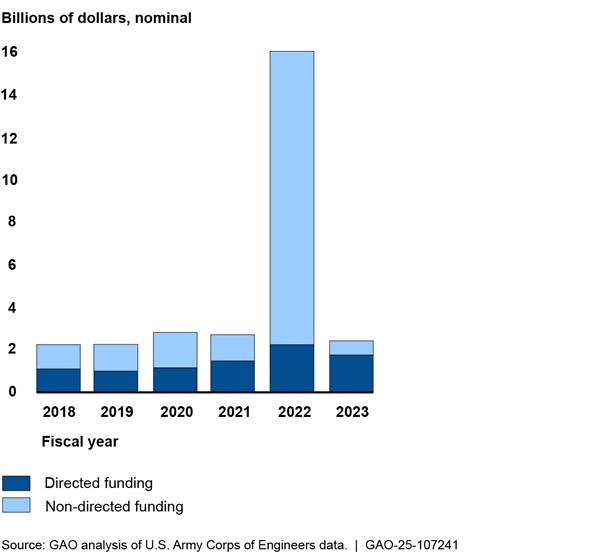
Notes: Total dollar amounts represent the sum of construction funding allocated to U.S. Army Corps of Engineers (Corps) projects from the annual and supplemental appropriation acts each fiscal year according to Corps data. The acts are the annual Energy and Water Development and Related Agencies Appropriations Acts for fiscal years 2018 through 2023, as well as the Bipartisan Budget Act of 2018 (Pub. L. No. 115-123), the Additional Supplemental Appropriations for Disaster Relief Act of 2019 (Pub. L. No. 116-20), the Disaster Relief Supplemental Appropriations Act of 2022 (Pub. L. No. 117-43), the Infrastructure Investment and Jobs Act (Pub. L. No. 117-58), and the Disaster Relief Supplemental Appropriations Act of 2023 (Pub. L. No. 117-328).
Directed funding refers to funding that is already specified for specific projects and activities, including the projects and activities listed in the construction account table in the explanatory statements. Non-directed funding is funding provided under the heading “additional funding” in the explanatory statements and funding provided by the supplemental appropriations acts.
In fiscal year 2022, the Infrastructure Investment and Jobs Act provided $12.4 billion in construction funding to the Corps.
The percentage of annual appropriations that was available as directed funding increased in fiscal years 2022 and 2023 compared to previous years, as shown in figure 9. In fiscal years 2018 through 2021, directed funding made up between approximately 42 and 55 percent of annual appropriations. In fiscal years 2022 and 2023, directed funding accounted for 92 and 86 percent of annual appropriations, respectively. Directed funding amounts in fiscal years 2022 and 2023 include Community Project Funding/Congressionally Directed Spending, in which Members of Congress could designate funding through legislative provisions for specific projects in their communities after meeting certain requirements.[12]
Figure 9: Annual Directed and Non-Directed Funding Amounts Allocated to U.S. Army Corps of Engineers Construction Projects in Fiscal Years 2018 through 2023, Billions of Dollars
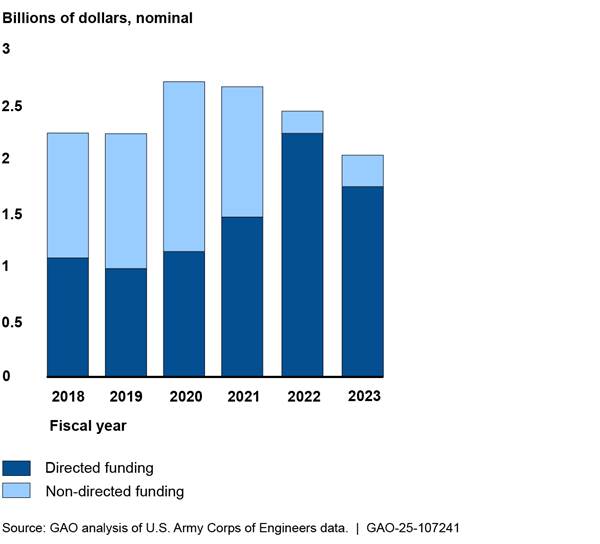
Note: Directed funding refers to funding that is already specified for specific projects and activities, including the projects and activities listed in the construction account table in the explanatory statements. Non-directed funding is funding provided under the heading “additional funding” in the explanatory statements.
The Corps Identified Projects for Non-Directed Funding Based on Eligibility Criteria and Other Considerations
For fiscal years 2018 through 2023, annual and supplemental appropriation acts that provided non-directed construction funding to the Corps included provisions about the eligibility of projects for funding and additional considerations that helped determine the geographic distribution of allocated amounts. Unlike with directed funding, for which Congress has specified the projects that shall receive funding, non-directed funding included provisions allowing the Corps to use some discretion when allocating funding.
Following the appropriation of construction funds in fiscal years 2018 through 2023, the Corps identified projects that it considered for funding eligibility based on criteria specified in annual appropriation acts, supplemental appropriation acts, and Corps and Army guidance documents. The Corps applied these eligibility criteria to the list of projects included in the President’s budget requests, as well as projects with new needs that arose since those requests, according to Corps officials. We categorized these eligibility criteria as follows:
· Previous or simultaneous funding decisions. Projects generally could receive non-directed construction funding from annual appropriations if they met one of the following criteria: (1) received funding, other than through a reprogramming, in at least one of the previous 3 fiscal years;[13] (2) had been previously funded and could reach a significant milestone, complete a discrete element of work, or produce significant outputs in the same calendar or fiscal year; or (3) were selected as a new start in accordance with the appropriations act and the additional direction provided in the explanatory statement.[14]
· Project authorization status. Four of the supplemental appropriation acts we reviewed included the following eligibility criteria for flood and storm damage reduction projects to receive non-directed construction funding, among other criteria: (1) projects were already authorized or were authorized after enactment of the appropriations law, or (2) projects had a signed Chief’s Report recommending the project to be authorized by Congress or were studied using investigations funds from that supplemental appropriations law.[15] For projects studied using investigations funds, the Secretary of the Army also had to determine such projects to be technically feasible, economically justified, and environmentally acceptable.
· Previous analysis or approval for new construction projects. For new construction projects that received non-directed construction funding from annual appropriations in fiscal years 2018 through 2021, the appropriation acts required that, when considering new construction starts, only those that could execute a project cost sharing agreement with the project’s non-federal sponsors by the end of the fiscal or calendar year could be chosen.[16] Annual appropriation acts for fiscal years 2022 and 2023 did not include language specifying any new construction projects, nor did any of the five supplemental appropriation acts in fiscal years 2018 through 2023.
Corps guidance for all annual appropriation acts during this period included additional eligibility criteria for new construction projects (see appendix IV). These criteria required that an economic analysis had been performed, that appropriate decision documents had been approved or received by a specific date, and that the project was authorized for construction, among other things.
· Geographic- or event-based eligibility. Four supplemental appropriation acts that we reviewed specified geographic- or event-based eligibility criteria.[17] These criteria usually stipulated that only projects in states or territories that had been affected by specific natural disasters were eligible for funding. For example, the Additional Supplemental Appropriations for Disaster Relief Act of 2019 provided supplemental funding designated for projects in states and territories affected by Hurricanes Florence and Michael, Typhoon Mangkhut, Super Typhoon Yutu, and Tropical Storm Gita.
Some appropriations laws or their corresponding guidance documents specified restrictions on funding projects based on their status or funding situation. For example, Army guidance documents corresponding to some supplemental appropriations acts prohibited the Corps from allocating funding to projects that had received supplemental appropriations from previous specified acts. Similarly, Energy and Water Development and Related Agencies Appropriations Acts (E&WD Appropriations Act) prohibited non-directed funding from being used for items where funding was specifically denied by Congress.
In addition, multiple Army guidance documents corresponding to supplemental appropriations acts also prohibited the funding of project components that were not related to the primary category or purpose. For example, if a construction project addressing flood and storm damage reduction included a recreational component, that recreational work would not be eligible for construction funding from those supplemental appropriation acts.
After identifying eligible projects, the Corps evaluated additional considerations outlined in enacted legislation to further determine which eligible projects to nominate for funding, according to Corps officials. We categorized these additional considerations as follows:
· Specified number of new construction projects. Appropriations acts often directed the Corps to initiate a specified number of new construction projects, and sometimes also broke out new starts by specific project categories or purposes. For example, the fiscal year 2020 E&WD Appropriations Act directed the Corps to initiate two new navigation projects; two new environmental restoration projects; and two new flood and storm damage reduction, environmental restoration, or multipurpose projects.
· Minimum funding per project category or purpose. Like new starts, annual and supplemental appropriation acts also specified that projects falling into specific categories, subcategories, or purposes receive a minimum amount of funding. For example, the E&WD Appropriations Acts for fiscal years 2018 through 2021 specified that projects with riverfront development components should receive between $2.9 million to $40.6 million.
· Priority considerations identified by Congress. In each of the E&WD Appropriations Acts for fiscal years 2018 through 2023, Congress included between 12 and 15 considerations for the Corps to use in prioritizing projects to receive non-directed funding (see appendix V).[18] These included considerations such as project benefits to the national economy; whether the Corps had the ability to complete the project or project phase with the amount of allocated funds; and the significance of the project to national security, including the strategic significance of commodities.
· Socioeconomic factors. The Infrastructure Investment and Jobs Act stated that the Corps shall nominate projects with overriding life-safety benefits and projects that benefit economically disadvantaged communities. The act also required the Corps and the Office of Management and Budget (OMB) to consider factors other than the benefit-cost ratio when determining the economic benefits of projects that benefit disadvantaged communities.[19]
· Environmental factors. The E&WD Appropriations Acts for fiscal years 2022 and 2023 encouraged the Corps to consider nominating cooperative projects that addressed environmental factors such as watershed erosion, sedimentation, flooding, and environmental degradation. Corps guidance for the fiscal years 2020 through 2023 E&WD Appropriations Acts also required the Corps to give appropriate consideration to the Corps’ environmental operating principles when nominating projects for funding.[20]
· Future project budgeting and financing considerations. Appropriations legislation sometimes contained budgeting and financing considerations for the Corps to use. For example, the E&WD Appropriations Acts for fiscal years 2018 through 2021 required the Corps to consider whether new construction projects could be affected by budgeting changes outside the annual appropriations cycle. Similarly, the annual appropriation acts for all 6 fiscal years required the Corps to consider whether the cost-sharing or non-federal sponsor of a project was able and willing to promptly provide the required cash contribution.
The Corps Scored, Ranked, and Proposed Work Packages for Funding at Eligible Projects
After determining which projects were eligible to receive non-directed construction funding and applying additional consideration to prioritize projects, the Corps scored and ranked work packages at eligible projects to compile a list of proposed allocations.[21] Corps officials told us that eligibility for construction projects to receive supplemental appropriations was narrow and targeted. In these cases, the universe of eligible projects was finite and limited and did not require extensive ranking, according to those officials. Figure 10 summarizes the Corps’ ranking process for non-directed funding from all annual and some supplemental appropriation acts.
Figure 10: U.S. Army Corps of Engineers Process for Ranking Eligible Projects to Receive Non-Directed Funding in Fiscal Years 2018 through 2023
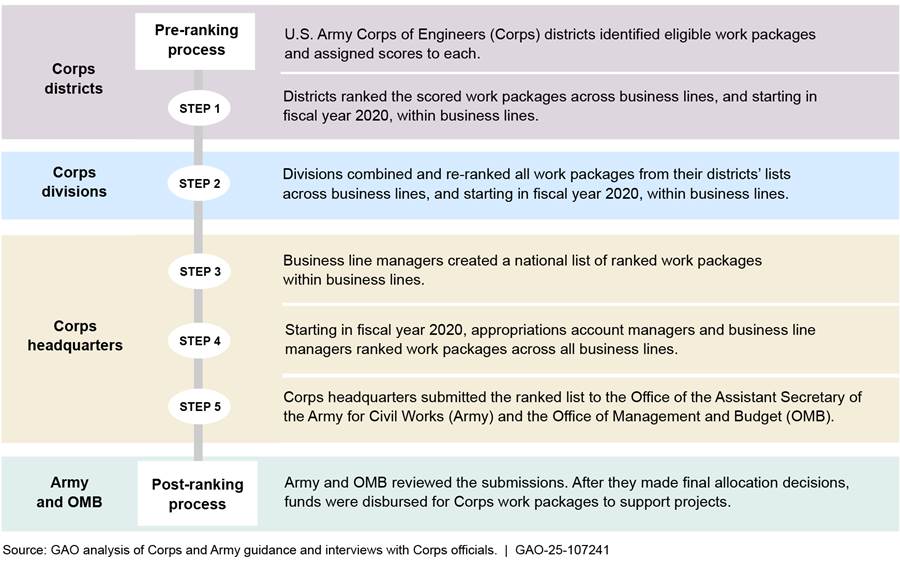
First, the Corps divided eligible projects into work packages for funding in each fiscal year. Corps districts then assigned scores to each work package based on the projects’ funding status, physical construction status, and scope.[22] Corps districts, divisions, and headquarters then successively ranked the scored work packages using instructions, guidelines, and criteria from Corps and Army guidance documents to prepare a list of work packages to potentially receive non-directed construction funding.
Generally, the ranking process in fiscal years 2018 through 2023 went as follows:
1. Corps districts ranked the scored work packages across business lines using business line-specific criteria included in Program Development Manuals (see appendix VI).[23] For example, a project’s completion status and years to completion was included as a ranking criterion in the fiscal year 2018 guidance document for the navigation business line. Starting in fiscal year 2020, districts also produced a ranked list of work packages within business lines. The districts then sent their ranked lists of work packages to the divisions.
2. Corps divisions combined and re-ranked all work packages from their districts’ lists across business lines using the same guidance and criteria described in step 1. Starting in fiscal year 2020, divisions also produced a ranked list of work packages within business lines. Divisions then sent the lists of ranked work packages to Corps headquarters.
3. Within Corps headquarters, business line managers combined all division-level ranked lists into one national list and ranked all work packages within business lines and appropriations accounts using the same criteria described in steps 1 and 2. This process resulted in the national list of funding priorities. In addition, guidance documents for annual appropriations starting in fiscal year 2020 specified a new list of criteria for the Corps to use when creating the national-level ranked list.[24] According to Corps officials, business line managers had full discretion in forming the national rankings.
After forming the national rankings, business line managers compared the national list of funding priorities to the eligibility criteria and additional considerations in the appropriation acts, according to Corps officials. For non-directed funding from annual appropriation acts, business line managers also compared the list of funding priorities to a set of Construction Performance Guidelines provided by OMB. These guidelines include criteria related to economic and environmental returns, project completion, and risks to human safety (see appendix VI).[25]
4. Appropriations account managers at Corps headquarters worked with the business line managers to produce a final funding recommendations list. In fiscal years 2020 through 2023, this included ranking work packages across all business lines. Appropriations account managers and Civil Works senior leaders revised the recommendations to address additional guidance and direction from senior leaders, as needed.
5. The Chief of Engineers reviewed and approved the list of funding recommendations, according to Corps officials. Corps headquarters submitted the approved list to the Office of the Assistant Secretary of the Army for Civil Works for its review and consideration as it developed an Army recommendation for OMB’s consideration.
The Army and OMB reviewed the submissions and determined the final allocation decisions, according to Corps officials. These allocation decisions were documented in construction work plans that specified the projects and amounts received from non-directed funding sources. Appropriations acts stated that the Corps’ work plan delineating how the funds were to be allocated was to be provided to the Committees on Appropriations for both houses of Congress within 60 days after enactment of the act. Funds were then subsequently distributed for Corps work packages to support projects accordingly.
Agency Comments
We provided a draft of this report to the Department of Defense for review and comment. The Department provided one technical comment, which we incorporated as appropriate.
We are sending copies of this report to the appropriate congressional committees, the Secretary of Defense, the Acting Assistant Secretary of the Army for Civil Works, the Chief of Engineers and Commanding General of the U.S. Army Corps of Engineers, and other interested parties. In addition, the report is available at no charge on the GAO website at https://www.gao.gov.
If you or your staff have any questions about this report, please contact me at (202) 512-6806 or arkinj@gao.gov. Contact points for our Offices of Congressional Relations and Public Affairs may be found on the last page of this report. GAO staff who made key contributions to this report are listed in appendix VII.

Jeff Arkin
Director, Strategic Issues
The Water Resources Development Act of 2022 includes a provision for us to review the U.S. Army Corps of Engineers’ (Corps) funding of its water resources projects.[26] This report examines: (1) the geographic distribution of annual and supplemental funding for water resources projects carried out by the Corps in fiscal years 2018 through 2023, and (2) the factors that contributed to the geographic distribution of funding.
To address the first objective, we performed a geospatial analysis on Corps appropriations and allocation data for fiscal years 2018 through 2023. In May 2024, the Corps provided data from its Program and Project Management Suite Civil Works Integrated Funding Module. These data included 2,478 observations for Corps projects that received allocations from the Corps’ Construction and Mississippi River & Tributaries – Construction appropriation accounts in fiscal years 2018 through 2023.[27] For the purposes of this report, we refer to funding in these accounts collectively as “construction funding.”
Appropriations data for these Corps projects included the following variables, which we used in our geospatial analysis:
· Corps project name
· Fiscal year of appropriation
· Corps district
· Business line name
· Work package title
· Work package description
· Annual appropriation amount (nominal dollars)
· “Additional funding” amount included in the explanatory statements of annual appropriation acts, referred to throughout this report as “non-directed funding” (nominal dollars)
· Supplemental appropriation amount (nominal dollars)
· Total appropriation amount (nominal dollars)
Additionally, the Corps provided latitude and longitude coordinates for 2,209 observations from the Corps Project Notebook. To identify the state for each observation with latitude and longitude data, we used Census data and geospatial software to assign each observation to a single state based on its geographical location. This approach ensured that even multistate projects, as indicated by Corps project names, were assigned to one state, preventing double counting of the number of projects and appropriation amounts across states.
For the 269 observations that did not have accompanying latitude and longitude data, we used the city and state name in the Corps project name variable, when available, to identify the location of the project. This resulted in the identification of the locations of 21 unique projects for 119 observations. When the Corps project name was ambiguous or did not have geographic identifiers, we used the work package title and description to obtain the project name or location. Specifically, we used this process for 144 observations for projects labeled, “Dam Safety & Seepage/Stability Correction Program (HQ Master AMSCO).” We then matched the dam names to locations based on data from the National Inventory of Dams from the U.S. Department of Transportation Bureau of Transportation Statistics and information from the Corps’ website. In cases where we could not determine the project’s location using these processes, we excluded the observations from the geospatial analysis.
We also reviewed work package descriptions to identify examples of construction work performed at Corps projects in fiscal years 2018 through 2023. We conducted electronic and manual testing of these data to identify missing values, outliers, and obvious errors. We also interviewed knowledgeable Corps officials about the data they provided and the reliability of the data. We found these data to be reliable for the purpose of determining the geographic distribution of construction funding.
To address the second objective, we reviewed legislation that appropriated construction funds to the Corps in fiscal years 2018 through 2023, as well as Corps policies and processes that helped determined how and where those funds were allocated. Specifically, we reviewed the annual Energy and Water Development and Related Agencies Appropriations Acts for fiscal years 2018 through 2023 and their accompanying explanatory statements to identify factors that may have contributed to the geographic distribution of the Corps’ construction funding during this period. We similarly reviewed the five supplemental appropriation acts passed during the same period that included Corps construction funding to identify such factors: the Bipartisan Budget Act of 2018 (Pub. L. No. 115-123), the Additional Supplemental Appropriations for Disaster Relief Act of 2019 (Pub. L. No. 116-20), the Disaster Relief Supplemental Appropriations Act of 2022 (Pub. L. No. 117-43), the Infrastructure Investment and Jobs Act (Pub. L. No. 117-58), and the Disaster Relief Supplemental Appropriations Act of 2023 (Pub. L. No. 117-328).
We also reviewed Corps and Army documents, policies, and guidance that described the processes used to identify Corps water resources projects and work packages that could receive construction funding from these annual and supplemental appropriation acts. We interviewed knowledgeable Corps officials about these policies and processes to help determine the factors that contributed to the geographic distribution of construction funding.
We conducted this performance audit from December 2023 to February 2025 in accordance with generally accepted government auditing standards. Those standards require that we plan and perform the audit to obtain sufficient, appropriate evidence to provide a reasonable basis for our findings and conclusions based on our audit objectives. We believe that the evidence obtained provides a reasonable basis for our findings and conclusions based on our audit objectives.
Appendix II: Corps Projects That Received Construction Funding, by Division, Fiscal Years 2018 through 2023
Table 1: U.S. Army Corps of Engineers Projects That Received Construction Funding, by Division, Fiscal Years 2018 through 2023
|
Division |
|
Construction funding, thousands of dollars |
||||||
|
Project name, location |
Business line |
Fiscal year 2018 |
Fiscal year 2019 |
Fiscal year 2020 |
Fiscal year 2021 |
Fiscal year 2022 |
Fiscal year 2023 |
Total |
|
Great Lakes and Ohio River |
||||||||
|
ALLEGHENY COUNTY, PA |
Environmental |
1,008 |
1,812 |
3,193 |
— |
— |
— |
6,013 |
|
AQUATIC PLANT CONTROL |
Remaining |
— |
300 |
— |
— |
— |
— |
300 |
|
BLUESTONE LAKE, WV |
Flood Risk |
5,725 |
7,810 |
— |
— |
— |
— |
13,535 |
|
BRANDON RD - GREAT LAKES/MISS |
Aquatic |
— |
— |
— |
— |
225,838 |
47,881 |
273,719 |
|
CALUMET HARBOR AND RIVER, IL & |
Navigation |
— |
1,100 |
— |
16,000 |
9,100 |
— |
26,200 |
|
CALUMET REGION, IN |
Environmental |
3,500 |
3,750 |
7,000 |
— |
— |
— |
14,250 |
|
CENTER HILL LAKE, TN |
Flood Risk |
28,930 |
— |
— |
— |
— |
— |
28,930 |
|
CHICAGO SHORELINE, IL |
Flood Risk |
— |
— |
— |
— |
550 |
— |
550 |
|
CHICKAMAUGA LOCK, TENNESSEE |
Navigation |
76,500 |
89,700 |
101,700 |
191,000 |
— |
— |
458,900 |
|
COOK COUNTY INFRASTRUCTURE, |
Environmental |
1,200 |
3,100 |
4,500 |
— |
— |
— |
8,800 |
|
DAM SAFETY & SEEPAGE/STABILITY |
Remaining |
4,300 |
4,700 |
300 |
— |
— |
— |
9,300 |
|
DES PLAINES RIVER, IL (PHASE II) |
Flood Risk |
— |
— |
— |
— |
— |
11,000 |
11,000 |
|
EAST BRANCH CLARION RIVER |
Flood Risk |
50,100 |
32,723 |
26,500 |
— |
— |
— |
109,323 |
|
ECORSE CREEK, MI |
Flood Risk |
— |
— |
— |
— |
1,675 |
— |
1,675 |
|
GENESEE COUNTY, MI |
Environmental |
— |
500 |
— |
— |
— |
— |
500 |
|
GREAT LAKES FISHERIES AND |
Aquatic |
— |
— |
— |
— |
2,822 |
— |
2,822 |
|
ILL WW OBRIEN L&D |
Navigation |
— |
— |
— |
— |
52,516 |
— |
52,516 |
|
INDIANA HARBOR, CONFINED |
Navigation |
— |
— |
12,305 |
— |
18,395 |
— |
30,700 |
|
INDIANA SHORELINE EROSION, IN |
Flood Risk |
2,500 |
2,150 |
2,500 |
— |
5,600 |
1,000 |
13,750 |
|
INDIANAPOLIS, WHITE RIVER |
Flood Risk |
3,172 |
— |
— |
— |
— |
— |
3,172 |
|
KENTUCKY LOCK AND DAM, |
Navigation |
39,500 |
43,600 |
61,060 |
110,100 |
465,492 |
— |
719,752 |
|
LEVISA AND TUG FORKS AND |
Flood Risk |
5,400 |
9,800 |
20,000 |
— |
— |
— |
35,200 |
|
LOCKS AND DAMS 2, 3 AND 4, |
Navigation |
98,000 |
89,000 |
111,000 |
— |
— |
— |
298,000 |
|
LOWER MUD RIVER, MILTON, WV |
Flood Risk |
— |
— |
— |
— |
— |
148,208 |
148,208 |
|
MAGNOLIA LEVEE, BOLIVAR DAM, |
Flood Risk |
— |
— |
— |
— |
7,700 |
— |
7,700 |
|
MCCOOK AND THORNTON |
Flood Risk |
44,352 |
— |
— |
— |
12,000 |
7,200 |
63,552 |
|
MOHAWK DAM, OH SEEPAGE |
Flood Risk |
7,113 |
— |
— |
— |
— |
— |
7,113 |
|
Remaining |
1,000 |
— |
— |
— |
— |
— |
1,000 |
|
|
NORTHERN WEST VIRGINIA |
Environmental |
— |
2,335 |
2,975 |
— |
— |
— |
5,310 |
|
NORTHERN WEST VIRGINIA, |
Environmental |
2,000 |
1,100 |
1,100 |
— |
— |
— |
4,200 |
|
OAKLAND COUNTY, MI |
Environmental |
600 |
600 |
500 |
— |
— |
— |
1,700 |
|
OHIO & NORTH DAKOTA |
Environmental |
7,000 |
11,200 |
9,000 |
— |
— |
— |
27,200 |
|
OHIO RIVER SHORELINE, PADUCAH, KY |
Flood Risk |
— |
— |
4,000 |
— |
— |
— |
4,000 |
|
OHIO RIVERFRONT, CINCINNATI, OH |
Recreation |
— |
— |
— |
— |
300 |
900 |
1,200 |
|
OLMSTED LOCKS AND DAM, OHIO |
Navigation |
175,000 |
50,000 |
63,000 |
— |
— |
— |
288,000 |
|
PRESQUE ISLE PENINSULA, PA |
Flood Risk |
1,500 |
1,500 |
1,250 |
1,500 |
3,000 |
— |
8,750 |
|
ROUGH RIVER, KY (DAM SAFETY) |
Flood Risk |
25,000 |
8,000 |
40,000 |
8,750 |
— |
— |
81,750 |
|
SAULT SAINTE MARIE (NEW SOO |
Navigation |
— |
32,388 |
125,333 |
169,763 |
1,173,141 |
66,971 |
1,567,596 |
|
SOUTHERN AND EASTERN |
Environmental |
3,000 |
1,870 |
— |
— |
— |
— |
4,870 |
|
SOUTHERN WEST VIRGINIA |
Environmental |
— |
1,100 |
1,100 |
— |
— |
— |
2,200 |
|
ST. MARYS RIVER, MI |
Navigation |
57,580 |
— |
— |
— |
37,300 |
— |
94,880 |
|
UPPER OHIO NAVIGATION, PA |
Navigation |
— |
— |
— |
22,000 |
947,508 |
— |
969,508 |
|
ZOAR LEVEE AT DOVER DAM, OH |
Flood Risk |
10,216 |
— |
— |
— |
— |
— |
10,216 |
|
Mississippi Valley |
||||||||
|
ASCENSION PARISH |
Environmental |
1,000 |
700 |
— |
— |
— |
— |
1,700 |
|
ATCHAFALAYA BASIN, FLOODWAY |
Aquatic |
550 |
200 |
5,000 |
539 |
1,800 |
— |
8,089 |
|
Flood Risk |
100 |
100 |
— |
— |
78,100 |
— |
78,300 |
|
|
ATCHAFALAYA BASIN, LA |
Flood Risk |
17,500 |
8,000 |
20,485 |
4,705 |
95,000 |
6,500 |
152,190 |
|
Navigation |
— |
— |
— |
25,000 |
— |
— |
25,000 |
|
|
BAYOU METO BASIN, AR |
Water Supply |
600 |
2,000 |
1,000 |
— |
24,000 |
14,000 |
41,600 |
|
BENEFICIAL USE OF DREDGED |
Navigation |
— |
— |
— |
— |
19,000 |
— |
19,000 |
|
Remaining |
— |
— |
— |
11,820 |
2,313 |
4,173 |
18,306 |
|
|
CALCASIEU RIVER AND PASS, LA |
Navigation |
— |
10,000 |
18,000 |
9,000 |
9,000 |
9,000 |
55,000 |
|
CHANNEL IMPROVEMENT, DIKES, |
Navigation |
20,310 |
4,810 |
16,000 |
18,540 |
88,600 |
2,200 |
150,460 |
|
Recreation |
— |
— |
— |
— |
3,000 |
— |
3,000 |
|
|
CHANNEL IMPROVEMENT, |
Flood Risk |
65,501 |
71,037 |
42,349 |
19,525 |
135,883 |
42,200 |
376,495 |
|
COMITE RIVER, LA |
Flood Risk |
14,000 |
— |
— |
— |
125,000 |
— |
139,000 |
|
DAM SAFETY & SEEPAGE/STABILITY |
Remaining |
600 |
150 |
— |
— |
— |
— |
750 |
|
DES MOINES AND RACCOON |
Flood Risk |
— |
— |
415 |
— |
— |
— |
415 |
|
DESOTO COUNTY WASTEWATER |
Environmental |
3,627 |
— |
3,923 |
— |
— |
— |
7,550 |
|
EAST BATON ROUGE PARISH |
Environmental |
1,500 |
1,750 |
— |
— |
— |
— |
3,250 |
|
EAST ST LOUIS, IL |
Flood Risk |
— |
95,199 |
— |
— |
— |
— |
95,199 |
|
GRAND PRAIRIE REGION, AR |
Water Supply |
600 |
1,000 |
350 |
— |
13,000 |
12,000 |
26,950 |
|
IBERIA PARISH, LA ENVIRONMENTAL |
Environmental |
250 |
500 |
500 |
— |
— |
— |
1,250 |
|
J. BENNETT JOHNSTON WATERWAY, LA |
Navigation |
900 |
— |
40,588 |
— |
2,250 |
15,500 |
59,238 |
|
LAGRANGE LOCK & DAM, ILWW, IL |
Navigation |
10,000 |
57,500 |
— |
— |
— |
— |
67,500 |
|
LIVINGSTON PARISH |
Environmental |
750 |
750 |
2,000 |
— |
— |
— |
3,500 |
|
LOUISIANA COASTAL AREA |
Aquatic |
— |
— |
— |
— |
6,000 |
8,346 |
14,346 |
|
MADISON AND ST. CLAIR COUNTIES, IL |
Aquatic |
100 |
— |
— |
— |
— |
— |
100 |
|
Environmental |
100 |
2,500 |
— |
— |
— |
— |
2,600 |
|
|
MCCLELLAN-KERR ARKANSAS |
Navigation |
— |
— |
— |
— |
341,097 |
— |
341,097 |
|
MELVIN PRICE LOCK AND DAM, IL & |
Navigation |
— |
— |
11,876 |
12,211 |
— |
— |
24,087 |
|
MISSISSIPPI ENVIRONMENTAL |
Environmental |
2,400 |
3,000 |
3,150 |
— |
— |
— |
8,550 |
|
MISSISSIPPI RIVER BETWEEN THE |
Navigation |
— |
— |
— |
— |
— |
10,000 |
10,000 |
|
MISSISSIPPI RIVER LEVEES, AR, IL, |
Flood Risk |
39,850 |
47,250 |
39,066 |
69,919 |
354,967 |
32,552 |
583,604 |
|
MISSISSIPPI RIVER SHIP CHANNEL, |
Navigation |
— |
— |
85,350 |
45,707 |
— |
— |
131,057 |
|
MONARCH - CHESTERFIELD, MO |
Flood Risk |
— |
— |
— |
— |
12,600 |
— |
12,600 |
|
MORGANZA TO THE GULF, LA |
Flood Risk |
— |
— |
— |
12,460 |
397,850 |
31,000 |
441,310 |
|
NEW ORLEANS TO VENICE, LA |
Flood Risk |
— |
— |
— |
— |
783,000 |
— |
783,000 |
|
NORTHEASTERN MINNESOTA |
Environmental |
2,442 |
3,500 |
1,720 |
— |
— |
— |
7,662 |
|
NORTHERN WISCONSIN |
Environmental |
650 |
1,050 |
3,960 |
— |
— |
— |
5,660 |
|
PEARL RIVER BASIN WATERSHED, |
Flood Risk |
— |
— |
— |
— |
221,000 |
— |
221,000 |
|
RED-OUACHITA RIVER BASIN |
Flood Risk |
— |
— |
— |
— |
7,000 |
— |
7,000 |
|
SOUTHEAST LOUISIANA, LA |
Flood Risk |
— |
16,332 |
25,000 |
30,090 |
94,300 |
45,760 |
211,482 |
|
SOUTHWEST COASTAL LOUISIANA |
Aquatic |
— |
— |
— |
— |
— |
10,000 |
10,000 |
|
Flood Risk |
— |
— |
— |
— |
296,000 |
— |
296,000 |
|
|
ST FRANCIS BASIN, AR & MO |
Flood Risk |
1,070 |
3,500 |
3,450 |
21,005 |
137,000 |
— |
166,025 |
|
ST. LOUIS, MO (COMBINED SEWER |
Environmental |
1,750 |
2,500 |
3,500 |
— |
— |
— |
7,750 |
|
UPPER MISS RIVER - ILLINOIS WW |
Aquatic |
— |
— |
— |
— |
115,100 |
18,379 |
133,479 |
|
Navigation |
— |
— |
— |
— |
771,279 |
49,300 |
820,579 |
|
|
UPPER MISSISSIPPI RIVER |
Aquatic |
33,170 |
33,170 |
33,170 |
33,170 |
33,170 |
55,000 |
220,850 |
|
WEST SHORE, LAKE |
Flood Risk |
— |
— |
— |
— |
450,000 |
— |
450,000 |
|
WHITE RIVER BACKWATER, AR |
Flood Risk |
— |
— |
— |
1,600 |
— |
— |
1,600 |
|
WOOD RIVER LEVEE, DEFICIENCY |
Flood Risk |
— |
— |
— |
— |
1,424 |
26,900 |
28,324 |
|
YAZOO BASIN - DELTA |
Flood Risk |
8,950 |
— |
— |
— |
16,150 |
7,400 |
32,500 |
|
YAZOO BASIN - UPPER YAZOO |
Flood Risk |
8,000 |
8,000 |
2,750 |
14,811 |
26,000 |
25,000 |
84,561 |
|
YAZOO BASIN, BIG SUNFLOWER |
Flood Risk |
4,200 |
4,100 |
2,942 |
3,130 |
6,000 |
— |
20,372 |
|
YAZOO BASIN, YAZOO BACKWATER |
Flood Risk |
6,000 |
— |
7,500 |
11,200 |
7,000 |
4,500 |
36,200 |
|
North Atlantic |
||||||||
|
AIWW, BRIDGES AT DEEP CREEK, VA |
Navigation |
— |
— |
— |
12,657 |
3,120 |
22,373 |
38,150 |
|
ANACOSTIA WATERSHED |
Aquatic |
— |
— |
— |
— |
30,000 |
— |
30,000 |
|
AQUATIC PLANT CONTROL |
Remaining |
— |
550 |
24,000 |
500 |
— |
600 |
25,650 |
|
ASSATEAGUE, MD |
Aquatic |
— |
600 |
600 |
600 |
1,050 |
900 |
3,750 |
|
ATLANTIC COAST OF MARYLAND, |
Flood Risk |
— |
— |
— |
11,100 |
— |
— |
11,100 |
|
BARNEGAT INLET TO LITTLE EGG |
Flood Risk |
— |
— |
— |
— |
— |
32,000 |
32,000 |
|
BDOB ORCHARD BEACH, BRONX NY |
Flood Risk |
— |
— |
— |
— |
— |
2,675 |
2,675 |
|
BOSTON HARBOR DEEP DRAFT |
Navigation |
58,000 |
37,183 |
34,814 |
68,433 |
— |
— |
198,430 |
|
BRIGANTINE INLET TO GREAT EGG |
Flood Risk |
— |
— |
12,816 |
— |
— |
— |
12,816 |
|
BRIGANTINE INLET TO GREAT EGG |
Flood Risk |
— |
— |
— |
— |
— |
12,580 |
12,580 |
|
CAPE MAY INLET TO LOWER |
Navigation |
— |
7,200 |
300 |
12,500 |
12,500 |
2,500 |
35,000 |
|
CHESAPEAKE BAY ENV |
Aquatic |
— |
— |
— |
— |
6,750 |
12,500 |
19,250 |
|
CHESAPEAKE BAY OYSTER |
Aquatic |
— |
— |
5,000 |
5,000 |
5,249 |
7,500 |
22,749 |
|
CITY OF NORFOLK, VA |
Flood Risk |
— |
— |
— |
— |
399,331 |
— |
399,331 |
|
CUMBERLAND, MD AND RIDGELEY, |
Flood Risk |
— |
— |
— |
— |
390 |
— |
390 |
|
DAM SAFETY & SEEPAGE/STABILITY |
Remaining |
2,400 |
2,900 |
350 |
— |
— |
— |
5,650 |
|
DELAWARE BAY COASTLINE, DE & |
Flood Risk |
— |
— |
— |
— |
5,000 |
— |
5,000 |
|
DELAWARE BAY COASTLINE, |
Navigation |
— |
150 |
— |
— |
4,500 |
— |
4,650 |
|
DELAWARE COAST PROTECTION, DE |
Flood Risk |
— |
— |
— |
— |
1,200 |
850 |
2,050 |
|
DELAWARE COAST, BETHANY |
Flood Risk |
— |
— |
6,700 |
— |
8,650 |
— |
15,350 |
|
DELAWARE COAST, CAPE |
Flood Risk |
— |
— |
— |
— |
4,000 |
— |
4,000 |
|
DELAWARE COAST, REHOBOTH |
Flood Risk |
— |
7,500 |
— |
— |
15,331 |
— |
22,831 |
|
DELAWARE RIVER MAIN CHANNEL, |
Navigation |
14,000 |
29,250 |
— |
— |
— |
— |
43,250 |
|
EASTERN SHORE AND SOUTHWEST |
Environmental |
200 |
— |
550 |
— |
— |
— |
750 |
|
EASTERN SHORE, MID CHESAPEAKE BAY ISLAND, MD |
Aquatic |
— |
— |
— |
— |
84,000 |
— |
84,000 |
|
FAIRFIELD AND NEW HAVEN |
Flood Risk |
— |
— |
— |
— |
160,249 |
— |
160,249 |
|
FIRE ISLAND INLET TO MONTAUK |
Flood Risk |
15,000 |
— |
— |
— |
600 |
— |
15,600 |
|
GENERAL EDGAR JADWIN DAM AND |
Flood Risk |
— |
— |
— |
11,000 |
— |
— |
11,000 |
|
GREAT EGG HARBOR INLET AND |
Flood Risk |
— |
7,000 |
— |
— |
17,000 |
— |
24,000 |
|
GREAT EGG HARBOR INLET TO |
Flood Risk |
— |
12,000 |
— |
— |
15,033 |
— |
27,033 |
|
HUDSON - RARITAN ESTUARY, NY & |
Aquatic |
— |
— |
— |
— |
25,978 |
3,275 |
29,253 |
|
LAKE CHAMPLAIN WATERSHED |
Environmental |
500 |
500 |
— |
— |
— |
— |
1,000 |
|
Flood Risk |
— |
— |
40,000 |
— |
— |
— |
40,000 |
|
|
LONG BEACH ISLAND, NY |
Flood Risk |
— |
— |
— |
— |
15,000 |
— |
15,000 |
|
LOWER CAPE MAY MEADOWS, CAPE |
Aquatic |
— |
— |
9,400 |
400 |
— |
— |
9,800 |
|
LYNNHAVEN RIVER BASIN, VA |
Aquatic |
10,000 |
14,920 |
— |
— |
— |
— |
24,920 |
|
MANASQUAN INLET TO BARNEGAT |
Flood Risk |
— |
— |
— |
— |
30,200 |
5,000 |
35,200 |
|
MOLLY ANN’S BROOK AT HALEDON, |
Flood Risk |
80 |
— |
— |
— |
— |
— |
80 |
|
MUDDY RIVER, MA |
Flood Risk |
— |
— |
6,000 |
— |
— |
— |
6,000 |
|
NEW HAVEN HARBOR DEEPENING, |
Navigation |
— |
— |
— |
— |
63,000 |
— |
63,000 |
|
NEW YORK CITY WATERSHED, NY |
Environmental |
500 |
750 |
1,500 |
— |
— |
— |
2,750 |
|
NORFOLK HARBOR AND CHANNELS, CRANEY ISLAND, VA |
Navigation |
5,000 |
— |
— |
— |
— |
30,000 |
35,000 |
|
NORFOLK HARBOR AND CHANNELS, VA (DEEPENING) |
Navigation |
— |
— |
— |
— |
225,402 |
— |
225,402 |
|
NORTHEAST COUNTIES |
Environmental |
1,160 |
— |
— |
— |
— |
— |
1,160 |
|
PAWCATUCK RIVER FLOOD STUDY, |
Flood Risk |
— |
— |
— |
— |
10,000 |
— |
10,000 |
|
PECKMAN RIVER BASIN, NJ |
Flood Risk |
— |
— |
— |
— |
146,188 |
— |
146,188 |
|
POPLAR ISLAND, MD |
Aquatic |
67,225 |
21,000 |
17,300 |
— |
4,200 |
21,345 |
131,070 |
|
Navigation |
30,975 |
— |
— |
14,500 |
— |
— |
45,475 |
|
|
PORTSMOUTH HARBOR & |
Navigation |
— |
— |
— |
18,232 |
— |
— |
18,232 |
|
RAHWAY RIVER BASIN, NJ |
Flood Risk |
— |
— |
— |
— |
63,050 |
— |
63,050 |
|
RARITAN BAY AND SANDY HOOK |
Flood Risk |
— |
— |
— |
— |
128,700 |
— |
128,700 |
|
RARITAN RIVER BASIN, GREEN |
Flood Risk |
20,000 |
29,000 |
25,000 |
30,900 |
497,000 |
— |
601,900 |
|
SANDY HOOK TO BARNEGAT INLET, |
Flood Risk |
— |
24,000 |
15,942 |
24,000 |
24,400 |
15,200 |
103,542 |
|
SOUTH CENTRAL PA |
Environmental |
1,482 |
938 |
— |
— |
— |
— |
2,420 |
|
SOUTHEASTERN PENNSYLVANIA, PA |
Environmental |
— |
1,000 |
2,100 |
— |
— |
— |
3,100 |
|
TOWNSENDS INLET TO CAPE MAY |
Flood Risk |
— |
7,000 |
— |
— |
27,000 |
1,000 |
35,000 |
|
VIRGINIA BEACH, VA (HURRICANE |
Flood Risk |
17,600 |
— |
— |
— |
— |
13,000 |
30,600 |
|
WASHINGTON, DC & VICINITY |
Flood Risk |
— |
— |
— |
— |
6,265 |
— |
6,265 |
|
WCS MAMARONECK/ SHELDRAKE, |
Flood Risk |
— |
— |
— |
— |
88,057 |
— |
88,057 |
|
WESTCHESTER COUNTY STREAMS, |
Flood Risk |
— |
— |
— |
— |
35,000 |
— |
35,000 |
|
WYOMING VALLEY, PA (LEVEE |
Flood Risk |
— |
— |
— |
— |
11,176 |
— |
11,176 |
|
Northwestern |
||||||||
|
ADAMS AND DENVER COUNTIES, CO |
Aquatic |
— |
— |
— |
— |
349,600 |
— |
349,600 |
|
ALBENI FALLS DAM - FISH |
Aquatic |
— |
— |
— |
68,100 |
— |
12,996 |
81,096 |
|
AQUATIC PLANT CONTROL |
Remaining |
— |
— |
— |
7,000 |
— |
— |
7,000 |
|
CHERRY CREEK LAKE, CO |
Remaining |
200 |
— |
— |
— |
— |
— |
200 |
|
COLUMBIA RIVER AT THE MOUTH, |
Navigation |
11,000 |
28,000 |
36,000 |
93,394 |
25,609 |
— |
194,003 |
|
COLUMBIA RIVER CHANNEL |
Navigation |
— |
— |
— |
— |
— |
4,000 |
4,000 |
|
COLUMBIA RIVER FISH MITIGATION, |
Aquatic |
70,000 |
46,000 |
41,602 |
15,377 |
74,391 |
47,400 |
294,770 |
|
DAM SAFETY & SEEPAGE/STABILITY |
Remaining |
9,650 |
10,800 |
6,600 |
— |
— |
— |
27,050 |
|
DUWAMISH AND GREEN RIVER |
Aquatic |
— |
— |
— |
— |
— |
2,000 |
2,000 |
|
FARGO, ND - MOORHEAD, MN |
Flood Risk |
35,000 |
35,000 |
100,000 |
115,000 |
437,000 |
— |
722,000 |
|
HOWARD A. HANSON DAM, WA |
Aquatic |
— |
— |
— |
— |
220,000 |
— |
220,000 |
|
KANSAS CITYS, MO & KS |
Flood Risk |
— |
— |
— |
— |
4,000 |
— |
4,000 |
|
LITTLE WOOD RIVER, ID |
Flood Risk |
— |
— |
— |
— |
— |
2,300 |
2,300 |
|
MANHATTAN, KS |
Flood Risk |
— |
18,494 |
— |
— |
— |
9,315 |
27,810 |
|
MISSOURI RIVER FISH AND WILDLIFE RECOVERY, IA, KS, MO, MT, NE, ND & SD |
Aquatic |
30,000 |
30,370 |
17,775 |
29,700 |
8,075 |
25,212 |
141,132 |
|
MISSOURI RIVER LEVEE SYSTEM, |
Flood Risk |
— |
— |
— |
— |
9,200 |
— |
9,200 |
|
MOUNT SAINT HELENS SEDIMENT |
Flood Risk |
— |
— |
— |
2,955 |
29,749 |
4,500 |
37,204 |
|
MUD MOUNTAIN DAM, WA |
Aquatic |
43,600 |
84,157 |
15,694 |
— |
45,818 |
— |
189,269 |
|
NORTH DAKOTA ENVIRONMENTAL |
Environmental |
— |
— |
6,250 |
— |
— |
— |
6,250 |
|
PIPESTEM LAKE, ND |
Flood Risk |
— |
— |
— |
40,000 |
136,496 |
— |
176,496 |
|
PUGET SOUND AND ADJACENT |
Aquatic |
— |
— |
— |
— |
9,000 |
— |
9,000 |
|
PUGET SOUND NEARSHORE MARINE HABITAT RESTORATION, WA |
Aquatic |
— |
— |
— |
— |
— |
6,000 |
6,000 |
|
RURAL MONTANA, MT |
Environmental |
— |
2,800 |
3,000 |
— |
— |
— |
5,800 |
|
SA SOURIS RIVER BASIN, ND |
Flood Risk |
— |
— |
— |
— |
61,450 |
— |
61,450 |
|
SAND CREEK WATERSHED, |
Aquatic |
— |
— |
— |
— |
115 |
— |
115 |
|
SKOKOMISH RIVER BASIN, WA |
Aquatic |
— |
13,600 |
— |
— |
— |
— |
13,600 |
|
SWOPE PARK INDUSTRIAL AREA, |
Flood Risk |
14,482 |
— |
4,000 |
— |
— |
— |
18,482 |
|
THE DALLES LOCK AND DAM, WA & |
Hydropower |
— |
1,827 |
— |
— |
1,200 |
— |
3,027 |
|
TRIBAL PARTNERSHIP PROGRAM |
Remaining |
— |
— |
5,000 |
7,029 |
8,100 |
9,000 |
29,129 |
|
TURKEY CREEK BASIN, KS & MO |
Flood Risk |
— |
— |
6,211 |
— |
— |
— |
6,211 |
|
UPPER TURKEY CREEK, KS |
Flood Risk |
— |
— |
— |
— |
23,900 |
— |
23,900 |
|
WILLAMETTE RIVER AT WILLAMETTE FALLS, OR |
Navigation |
— |
— |
— |
3,402 |
6,200 |
— |
9,602 |
|
Pacific Ocean |
||||||||
|
ALASKA COASTAL EROSION, AK |
Flood Risk |
— |
— |
— |
— |
364,290 |
— |
364,290 |
|
CHENA RIVER LAKES, AK (MOOSE |
Flood Risk |
— |
— |
— |
59,159 |
88,540 |
— |
147,699 |
|
Remaining |
1,200 |
— |
— |
— |
— |
— |
1,200 |
|
|
DAM SAFETY & SEEPAGE/STABILITY |
Remaining |
— |
— |
2,000 |
— |
— |
— |
2,000 |
|
IAO STREAM FLOOD CONTROL, |
Flood Risk |
— |
— |
— |
— |
3,770 |
— |
3,770 |
|
KENAI RIVER BLUFF EROSION, AK |
Flood Risk |
— |
— |
— |
— |
28,050 |
9,400 |
37,450 |
|
LOWELL CREEK FLOOD DIVERSION, |
Flood Risk |
— |
— |
— |
— |
185,225 |
— |
185,225 |
|
NOME HARBOR EXPANSION, AK |
Navigation |
— |
— |
— |
— |
250,000 |
— |
250,000 |
|
UNALASKA CHANNELS, AK |
Navigation |
— |
— |
— |
— |
— |
29,100 |
29,100 |
|
South Atlantic |
||||||||
|
AQUATIC PLANT CONTROL |
Remaining |
— |
— |
— |
200 |
— |
900 |
1,100 |
|
ATLANTA ENVIRONMENTAL |
Environmental |
— |
— |
5,000 |
— |
— |
— |
5,000 |
|
BREVARD COUNTY, CANAVERAL |
Flood Risk |
28,375 |
— |
— |
— |
— |
7,775 |
36,150 |
|
BRUNSWICK COUNTY BEACHES, NC |
Flood Risk |
— |
— |
— |
2,500 |
— |
— |
2,500 |
|
CANO MARTIN PENA ECOSYSTEM |
Aquatic |
— |
— |
— |
— |
163,287 |
— |
163,287 |
|
CAROLINA BEACH AND VICINITY, NC |
Flood Risk |
— |
— |
— |
— |
18,884 |
— |
18,884 |
|
CENTRAL & SOUTHERN FLORIDA, FL |
Flood Risk |
4,000 |
— |
— |
— |
— |
— |
4,000 |
|
CHARLESTON HARBOR, SC |
Navigation |
49,000 |
41,415 |
138,040 |
— |
— |
10,440 |
238,895 |
|
DAM SAFETY & SEEPAGE/STABILITY |
Remaining |
— |
66,405 |
— |
— |
— |
— |
66,405 |
|
DUVAL COUNTY, FL |
Flood Risk |
— |
— |
— |
— |
1,261 |
16,175 |
17,436 |
|
FLORIDA KEYS WATER QUALITY |
Environmental |
4,000 |
4,000 |
5,000 |
— |
— |
— |
13,000 |
|
FORT PIERCE BEACH, FL |
Flood Risk |
— |
— |
1,727 |
— |
4,886 |
— |
6,613 |
|
Navigation |
— |
— |
5,833 |
— |
8,140 |
— |
13,973 |
|
|
HERBERT HOOVER DIKE, FL |
Flood Risk |
82,000 |
96,000 |
— |
— |
— |
— |
178,000 |
|
JACKSON COUNTY INDUSTRIAL |
Environmental |
— |
200 |
6,500 |
— |
— |
— |
6,700 |
|
JACKSONVILLE HARBOR |
Navigation |
57,538 |
46,000 |
57,543 |
35,457 |
— |
— |
196,538 |
|
LAKES MARION AND MOULTRIE, SC |
Environmental |
4,945 |
— |
5,124 |
— |
— |
— |
10,069 |
|
MISSISSIPPI COASTAL |
Aquatic |
— |
— |
— |
— |
73,037 |
— |
73,037 |
|
Flood Risk |
— |
— |
— |
15,400 |
3,964 |
— |
19,364 |
|
|
MOBILE HARBOR, AL |
Navigation |
— |
— |
274,300 |
— |
— |
— |
274,300 |
|
NASSAU COUNTY, FL |
Flood Risk |
— |
— |
— |
— |
5,113 |
— |
5,113 |
|
OKALOOSA HURRICANE STORM |
Flood Risk |
— |
— |
— |
— |
— |
21,923 |
21,923 |
|
PANAMA CITY HARBOR, FL |
Navigation |
— |
4,000 |
— |
— |
— |
— |
4,000 |
|
PINELLAS COUNTY, FL |
Flood Risk |
— |
— |
— |
— |
17,135 |
— |
17,135 |
|
PORT EVERGLADES HARBOR |
Navigation |
— |
— |
29,100 |
— |
— |
— |
29,100 |
|
PORT EVERGLADES HARBOR, FL |
Navigation |
— |
— |
— |
— |
— |
9,560 |
9,560 |
|
RIO CULEBRINAS, PR |
Flood Risk |
— |
— |
— |
— |
26,455 |
— |
26,455 |
|
RIO GRANDE DE MANATI, PR |
Flood Risk |
— |
— |
— |
— |
14,823 |
— |
14,823 |
|
RIO GUAYANILLA, PR |
Flood Risk |
— |
— |
— |
— |
60,600 |
— |
60,600 |
|
SAN JUAN HARBOR, PR |
Navigation |
— |
— |
— |
— |
45,561 |
— |
45,561 |
|
SARASOTA, LIDO KEY, FL |
Flood Risk |
13,462 |
— |
1,297 |
— |
— |
— |
14,759 |
|
SAVAN GUT PHASE II, VI |
Flood Risk |
— |
— |
— |
— |
51,710 |
— |
51,710 |
|
SAVANNAH HARBOR DISPOSAL |
Navigation |
— |
10,500 |
— |
— |
— |
— |
10,500 |
|
SAVANNAH HARBOR EXPANSION, |
Navigation |
84,760 |
101,120 |
130,280 |
93,600 |
72,000 |
— |
481,760 |
|
SOUTH FLORIDA ECOSYSTEM |
Aquatic |
102,427 |
104,565 |
242,800 |
250,000 |
1,448,518 |
452,332 |
2,600,642 |
|
ST JOHN’S COUNTY, FL |
Flood Risk |
— |
— |
— |
— |
— |
6,998 |
6,998 |
|
Navigation |
— |
— |
— |
— |
— |
11,472 |
11,472 |
|
|
TURPENTINE RUN, ST. THOMAS, |
Flood Risk |
— |
— |
— |
— |
48,142 |
— |
48,142 |
|
WILMINGTON HARBOR, NC |
Navigation |
9,575 |
150 |
11,000 |
6,600 |
22,725 |
— |
50,050 |
|
South Pacific |
||||||||
|
ACEQUIAS IRRIGATION SYSTEM, NM |
Environmental |
— |
1,800 |
1,125 |
— |
— |
— |
2,925 |
|
ALAMOGORDO, NM |
Flood Risk |
— |
— |
— |
3,950 |
— |
— |
3,950 |
|
AMERICAN RIVER COMMON |
Flood Risk |
31,000 |
64,650 |
74,734 |
131,500 |
156,915 |
63,702 |
522,501 |
|
AMERICAN RIVER WATERSHED |
Flood Risk |
26,000 |
— |
— |
— |
— |
— |
26,000 |
|
AMERICAN RIVER WATERSHED |
Aquatic |
— |
— |
3,514 |
— |
37,792 |
3,058 |
44,364 |
|
Flood Risk |
5,775 |
— |
— |
— |
— |
— |
5,775 |
|
|
CENTRAL NEW MEXICO, NM |
Environmental |
3,581 |
5,209 |
— |
— |
— |
— |
8,790 |
|
DAM SAFETY & SEEPAGE/STABILITY |
Remaining |
3,400 |
3,300 |
2,530 |
— |
— |
— |
9,230 |
|
DESERT HOT SPRINGS, CA |
Environmental |
1,200 |
— |
— |
— |
— |
— |
1,200 |
|
DRY CREEK |
Aquatic |
— |
— |
28,367 |
— |
— |
— |
28,367 |
|
EL PASO COUNTY, TX |
Environmental |
938 |
4,500 |
1,200 |
— |
— |
— |
6,638 |
|
ESPANOLA VALLEY, RIO GRANDE |
Aquatic |
— |
— |
— |
56,000 |
40,000 |
— |
96,000 |
|
HAMILTON AIRFIELD WETLANDS |
Aquatic |
1,445 |
— |
6,500 |
— |
1,000 |
500 |
9,445 |
|
HAMILTON CITY, CA |
Aquatic |
16,425 |
12,616 |
— |
22,000 |
— |
— |
51,041 |
|
HARBOR/SOUTH BAY WATER |
Environmental |
— |
— |
1,000 |
— |
— |
— |
1,000 |
|
ISABELLA LAKE, CA (DAM SAFETY) |
Flood Risk |
58,000 |
118,000 |
— |
— |
— |
— |
176,000 |
|
KAWEAH RIVER, CA |
Flood Risk |
1,450 |
— |
— |
— |
— |
— |
1,450 |
|
LITTLE COLORADO RIVER |
Flood Risk |
— |
— |
— |
— |
65,750 |
— |
65,750 |
|
LOS ANGELES COUNTY DRAINAGE |
Remaining |
2,000 |
— |
— |
— |
— |
— |
2,000 |
|
LOS ANGELES RIVER ECOSYSTEM |
Aquatic |
— |
— |
— |
— |
28,000 |
— |
28,000 |
|
MURRIETA CREEK, CA |
Flood Risk |
9,900 |
— |
— |
— |
1,700 |
8,500 |
20,100 |
|
NAPA RIVER, CA |
Flood Risk |
— |
— |
— |
48,300 |
— |
— |
48,300 |
|
PAJARO RIVER AT WATSONVILLE, CA |
Flood Risk |
— |
— |
— |
— |
149,000 |
— |
149,000 |
|
PRADO DAM, CA (DAM SAFETY) |
Flood Risk |
— |
— |
— |
— |
— |
50,000 |
50,000 |
|
RESTORATION OF ABANDONED |
Remaining |
2,000 |
2,000 |
3,000 |
2,000 |
2,000 |
3,000 |
14,000 |
|
RIO DE FLAG FLAGSTAFF, AZ |
Flood Risk |
1,300 |
— |
52,000 |
— |
— |
— |
53,300 |
|
SACRAMENTO RIVER BANK |
Flood Risk |
150 |
19,265 |
— |
— |
600 |
— |
20,015 |
|
SAN CLEMENTE SHORELINE, CA |
Flood Risk |
— |
— |
— |
— |
9,306 |
— |
9,306 |
|
SAN DIEGO COUNTY, CA |
Flood Risk |
— |
— |
— |
— |
30,542 |
— |
30,542 |
|
SAN JOAQUIN RIVER BASIN, LOWER |
Flood Risk |
— |
— |
22,800 |
20,000 |
50,000 |
10,000 |
102,800 |
|
SAN LORENZO RIVER, CA |
Flood Risk |
2,500 |
— |
500 |
— |
— |
— |
3,000 |
|
SAN LUIS REY RIVER, CA |
Flood Risk |
600 |
350 |
— |
— |
12,200 |
— |
13,150 |
|
SANTA ANA RIVER MAINSTEM, CA |
Flood Risk |
98,000 |
15,000 |
4,600 |
9,250 |
826 |
— |
127,676 |
|
SANTA PAULA CREEK, CA |
Flood Risk |
— |
— |
— |
— |
500 |
— |
500 |
|
SOUTH PERRIS, CA |
Environmental |
2,782 |
3,400 |
— |
— |
— |
— |
6,182 |
|
SOUTH SAN FRANCISCO |
Flood Risk |
— |
— |
— |
— |
— |
91,169 |
91,169 |
|
STOCKTON METROPOLITIAN FLOOD CONTROL REIMBURSEMENT, CA |
Flood Risk |
10,249 |
— |
— |
— |
— |
— |
10,249 |
|
SURFSIDE - SUNSET - NEWPORT |
Flood Risk |
— |
— |
— |
— |
5,115 |
— |
5,115 |
|
Navigation |
— |
— |
— |
— |
10,385 |
— |
10,385 |
|
|
SUTTER BASIN, CA |
Flood Risk |
50,000 |
— |
— |
— |
— |
— |
50,000 |
|
TAHOE BASIN RESTORATION 108 |
Environmental |
215 |
600 |
1,025 |
— |
— |
— |
1,840 |
|
TRES RIOS, AZ |
Aquatic |
— |
— |
— |
— |
1,841 |
— |
1,841 |
|
TUCSON DRAINAGE AREA, AZ |
Flood Risk |
1,100 |
4,500 |
— |
— |
— |
— |
5,600 |
|
WEST SACRAMENTO, CA |
Flood Risk |
— |
— |
— |
— |
25,288 |
72,313 |
97,601 |
|
WESTERN RURAL WATER, AZ, NV, |
Environmental |
10,220 |
7,687 |
12,506 |
— |
— |
— |
30,413 |
|
WHITTIER NARROWS, CA (DAM |
Flood Risk |
— |
— |
— |
192,500 |
219,591 |
— |
412,091 |
|
YUBA RIVER BASIN, CA |
Flood Risk |
12,400 |
35,500 |
— |
— |
— |
— |
47,900 |
|
|
|
|
|
|
|
|
|
|
|
Southwestern |
||||||||
|
BRAYS BAYOU, HOUSTON, TX |
Flood Risk |
14,774 |
16,399 |
7,500 |
1,400 |
— |
— |
40,073 |
|
BRAZOS ISLAND HARBOR, TX |
Navigation |
— |
— |
— |
— |
68,000 |
— |
68,000 |
|
BUFFALO BAYOU AND |
Flood Risk |
18,500 |
16,908 |
2,000 |
— |
— |
— |
37,408 |
|
CEDAR BAYOU, TX |
Navigation |
— |
9,605 |
32,125 |
— |
— |
— |
41,730 |
|
CENTRAL CITY, FORT WORTH, |
Flood Risk |
— |
— |
— |
— |
403,000 |
20,000 |
423,000 |
|
CORPUS CHRISTI SHIP CHANNEL, TX |
Navigation |
22,886 |
71,849 |
53,313 |
100,366 |
— |
157,263 |
405,677 |
|
DAM SAFETY & SEEPAGE/STABILITY |
Remaining |
5,550 |
6,150 |
755 |
— |
— |
— |
12,455 |
|
FREEPORT HARBOR, TX |
Navigation |
— |
— |
19,000 |
24,906 |
73,156 |
90,660 |
207,722 |
|
GREENS BAYOU, HOUSTON, TX |
Flood Risk |
4,125 |
— |
— |
— |
— |
— |
4,125 |
|
HOUSTON - GALVESTON |
Navigation |
— |
— |
— |
— |
10,781 |
— |
10,781 |
|
HOUSTON SHIP CHANNEL, TX |
Navigation |
— |
— |
— |
19,500 |
142,515 |
10,706 |
172,721 |
|
HUNTING BAYOU, HOUSTON, TX |
Flood Risk |
— |
— |
— |
6,600 |
3,000 |
— |
9,600 |
|
LEWISVILLE DAM, TX |
Flood Risk |
— |
55,000 |
— |
— |
— |
— |
55,000 |
|
Remaining |
2,000 |
— |
— |
— |
— |
— |
2,000 |
|
|
MCCLELLAN-KERR AR RIVER NAV |
Navigation |
— |
— |
— |
— |
9,650 |
10,000 |
19,650 |
|
PINE CREEK LAKE, OK |
Flood Risk |
— |
— |
2,740 |
— |
— |
— |
2,740 |
|
SABINE - NECHES WATERWAY, TX |
Navigation |
— |
18,000 |
16,620 |
68,560 |
— |
167,402 |
270,582 |
|
SAN ANTONIO CHANNEL |
Aquatic |
14,653 |
4,445 |
26,031 |
— |
75,042 |
— |
120,171 |
|
TULSA AND WEST TULSA LOCAL |
Flood Risk |
— |
— |
— |
— |
137,402 |
— |
137,402 |
|
WHITE OAK BAYOU, TX |
Flood Risk |
— |
8,200 |
— |
27,000 |
2,095 |
— |
37,295 |
|
National Programs |
||||||||
|
AQUATIC PLANT CONTROL |
Remaining |
11,000 |
11,150 |
— |
17,300 |
30,000 |
36,500 |
105,950 |
|
DAM SAFETY & SEEPAGE/STABILITY |
Remaining |
2,000 |
6,000 |
17,995 |
45,872 |
13,000 |
38,100 |
122,967 |
Legend: — = No funding received that fiscal year
Source: GAO analysis of U.S. Army Corps of Engineers data. | GAO‑25‑107241
aThe “Remaining Items” category comprises projects that fall under the U.S. Army Corps of Engineers’ Remaining Items program. These projects may receive funding from multiple business lines or for national programs.
.
Appendix III: Corps Construction Projects and Funding, by State and Territory, Fiscal Years 2018 through 2023
Table 2: Number of U.S. Army Corps of Engineers Projects and Amount of Construction Funding Received, by State and Territory, Fiscal Years 2018 through 2023, Thousands of Dollars
|
State/Territory |
Fiscal Year 2018 |
Fiscal Year 2019 |
Fiscal Year 2020 |
Fiscal Year 2021 |
Fiscal Year 2022 |
Fiscal Year 2023 |
Totala |
|
Alabama |
|||||||
|
Number of Projects |
— |
— |
1 |
— |
— |
— |
1 |
|
Construction Funding |
— |
— |
274,300 |
— |
— |
— |
274,300 |
|
Alaska |
|||||||
|
Number of Projects |
1 |
— |
1 |
1 |
5 |
2 |
7 |
|
Construction Funding |
1,200 |
— |
2,000 |
59,159 |
916,105 |
38,500 |
1,016,964 |
|
Arizona |
|||||||
|
Number of Projects |
2 |
1 |
1 |
— |
2 |
— |
4 |
|
Construction Funding |
2,400 |
4,500 |
52,000 |
— |
67,591 |
— |
126,491 |
|
Arkansas |
|||||||
|
Number of Projects |
3 |
2 |
2 |
1 |
5 |
3 |
7 |
|
Construction Funding |
1,500 |
3,000 |
1,350 |
1,600 |
394,747 |
36,000 |
438,197 |
|
California |
|||||||
|
Number of Projects |
20 |
10 |
10 |
6 |
16 |
8 |
34 |
|
Construction Funding |
331,391 |
271,631 |
145,570 |
423,550 |
738,760 |
299,242 |
2,210,143 |
|
Colorado |
|||||||
|
Number of Projects |
2 |
1 |
— |
— |
2 |
1 |
4 |
|
Construction Funding |
2,300 |
1,050 |
— |
— |
354,600 |
3,000 |
360,950 |
|
Connecticut |
|||||||
|
Number of Projects |
1 |
1 |
— |
— |
3 |
— |
4 |
|
Construction Funding |
100 |
50 |
— |
— |
258,249 |
— |
258,399 |
|
Delaware |
|||||||
|
Number of Projects |
— |
2 |
1 |
— |
5 |
1 |
5 |
|
Construction Funding |
— |
7,650 |
6,700 |
— |
33,681 |
850 |
48,881 |
|
District of Columbia |
|||||||
|
Number of Projects |
— |
— |
— |
— |
1 |
— |
1 |
|
Construction Funding |
— |
— |
— |
— |
6,265 |
— |
6,265 |
|
Florida |
|||||||
|
Number of Projects |
7 |
6 |
6 |
3 |
5 |
7 |
18 |
|
Construction Funding |
291,802 |
320,970 |
343,300 |
285,657 |
1,485,053 |
527,135 |
3,253,917 |
|
Georgia |
|||||||
|
Number of Projects |
1 |
1 |
2 |
1 |
1 |
— |
2 |
|
Construction Funding |
84,760 |
101,120 |
135,280 |
93,600 |
72,000 |
— |
486,760 |
|
|
|||||||
|
Hawaii |
|||||||
|
Number of Projects |
— |
— |
— |
— |
1 |
— |
1 |
|
Construction Funding |
— |
— |
— |
— |
3,770 |
— |
3,770 |
|
Idaho |
|||||||
|
Number of Projects |
1 |
1 |
— |
1 |
— |
2 |
3 |
|
Construction Funding |
100 |
50 |
— |
68,100 |
— |
15,296 |
83,546 |
|
Illinois |
|||||||
|
Number of Projects |
4 |
5 |
1 |
1 |
6 |
4 |
11 |
|
Construction Funding |
55,752 |
159,398 |
4,500 |
16,000 |
301,428 |
92,981 |
630,059 |
|
Indiana |
|||||||
|
Number of Projects |
5 |
4 |
4 |
— |
2 |
1 |
6 |
|
Construction Funding |
185,172 |
57,400 |
84,805 |
— |
23,995 |
1,000 |
352,372 |
|
Iowa |
|||||||
|
Number of Projects |
— |
— |
1 |
— |
1 |
1 |
2 |
|
Construction Funding |
— |
— |
415 |
— |
886,379 |
67,679 |
954,473 |
|
Kansas |
|||||||
|
Number of Projects |
1 |
2 |
1 |
— |
1 |
1 |
4 |
|
Construction Funding |
100 |
18,544 |
6,211 |
— |
23,900 |
9,315 |
58,071 |
|
Kentucky |
|||||||
|
Number of Projects |
5 |
5 |
4 |
2 |
1 |
— |
6 |
|
Construction Funding |
73,000 |
63,320 |
125,060 |
118,850 |
465,492 |
— |
845,722 |
|
Louisiana |
|||||||
|
Number of Projects |
10 |
10 |
10 |
8 |
14 |
9 |
19 |
|
Construction Funding |
96,710 |
90,392 |
251,989 |
215,960 |
3,005,866 |
160,858 |
3,821,775 |
|
Maine |
|||||||
|
Number of Projects |
— |
— |
— |
1 |
— |
— |
1 |
|
Construction Funding |
— |
— |
— |
18,232 |
— |
— |
18,232 |
|
Maryland |
|||||||
|
Number of Projects |
1 |
2 |
3 |
4 |
6 |
3 |
7 |
|
Construction Funding |
98,200 |
21,600 |
22,900 |
31,200 |
124,889 |
29,745 |
328,534 |
|
Massachusetts |
|||||||
|
Number of Projects |
1 |
1 |
2 |
1 |
— |
— |
2 |
|
Construction Funding |
58,000 |
37,183 |
40,814 |
68,433 |
— |
— |
204,430 |
|
Michigan |
|||||||
|
Number of Projects |
3 |
4 |
2 |
1 |
3 |
1 |
6 |
|
Construction Funding |
58,280 |
33,538 |
125,833 |
169,763 |
1,212,116 |
66,971 |
1,666,501 |
|
Minnesota |
|||||||
|
Number of Projects |
3 |
3 |
2 |
1 |
1 |
1 |
3 |
|
Construction Funding |
35,712 |
36,720 |
34,890 |
33,170 |
33,170 |
55,000 |
228,662 |
|
Mississippi |
|||||||
|
Number of Projects |
6 |
4 |
6 |
4 |
5 |
3 |
8 |
|
Construction Funding |
33,177 |
15,300 |
26,765 |
44,541 |
132,150 |
36,900 |
288,833 |
|
Missouri |
|||||||
|
Number of Projects |
4 |
3 |
4 |
2 |
4 |
1 |
9 |
|
Construction Funding |
17,402 |
6,050 |
22,826 |
33,216 |
162,800 |
10,000 |
252,294 |
|
Montana |
|||||||
|
Number of Projects |
1 |
2 |
1 |
— |
— |
— |
2 |
|
Construction Funding |
100 |
2,850 |
3,000 |
— |
— |
— |
5,950 |
|
Nebraska |
|||||||
|
Number of Projects |
2 |
2 |
1 |
1 |
2 |
1 |
3 |
|
Construction Funding |
30,100 |
30,420 |
17,775 |
29,700 |
8,190 |
25,212 |
141,397 |
|
New Jersey |
|||||||
|
Number of Projects |
4 |
8 |
5 |
4 |
11 |
6 |
18 |
|
Construction Funding |
34,580 |
116,200 |
63,458 |
67,800 |
966,071 |
68,280 |
1,316,389 |
|
New Mexico |
|||||||
|
Number of Projects |
3 |
4 |
3 |
3 |
2 |
1 |
6 |
|
Construction Funding |
15,801 |
16,695 |
16,631 |
61,950 |
42,000 |
3,000 |
156,077 |
|
New York |
|||||||
|
Number of Projects |
3 |
3 |
1 |
— |
5 |
2 |
9 |
|
Construction Funding |
15,600 |
1,100 |
1,500 |
— |
132,457 |
5,950 |
156,607 |
|
North Carolina |
|||||||
|
Number of Projects |
1 |
1 |
1 |
2 |
2 |
— |
4 |
|
Construction Funding |
9,575 |
150 |
11,000 |
9,100 |
41,609 |
— |
71,434 |
|
North Dakota |
|||||||
|
Number of Projects |
2 |
2 |
3 |
2 |
3 |
— |
5 |
|
Construction Funding |
36,000 |
36,000 |
109,450 |
155,000 |
634,946 |
— |
971,396 |
|
Ohio |
|||||||
|
Number of Projects |
4 |
2 |
2 |
— |
2 |
1 |
6 |
|
Construction Funding |
26,429 |
12,550 |
9,300 |
— |
8,000 |
900 |
57,179 |
|
Oklahoma |
|||||||
|
Number of Projects |
1 |
1 |
1 |
— |
1 |
— |
3 |
|
Construction Funding |
1,450 |
1,600 |
2,740 |
— |
137,402 |
— |
143,192 |
|
Oregon |
|||||||
|
Number of Projects |
2 |
2 |
2 |
2 |
2 |
2 |
4 |
|
Construction Funding |
76,000 |
54,150 |
43,502 |
18,779 |
80,591 |
51,400 |
324,422 |
|
Pennsylvania |
|||||||
|
Number of Projects |
7 |
7 |
6 |
3 |
3 |
— |
11 |
|
Construction Funding |
155,150 |
129,123 |
144,393 |
34,500 |
961,684 |
— |
1,424,850 |
|
Puerto Rico |
|||||||
|
Number of Projects |
— |
— |
— |
— |
5 |
— |
5 |
|
Construction Funding |
— |
— |
— |
— |
310,726 |
— |
310,726 |
|
Rhode Island |
|||||||
|
Number of Projects |
— |
— |
— |
— |
1 |
— |
1 |
|
Construction Funding |
— |
— |
— |
— |
10,000 |
— |
10,000 |
|
South Carolina |
|||||||
|
Number of Projects |
2 |
2 |
2 |
— |
— |
1 |
3 |
|
Construction Funding |
53,945 |
51,915 |
143,164 |
— |
— |
10,440 |
259,464 |
|
South Dakota |
|||||||
|
Number of Projects |
1 |
1 |
1 |
1 |
1 |
1 |
2 |
|
Construction Funding |
300 |
100 |
5,000 |
7,029 |
8,100 |
9,000 |
29,529 |
|
Tennessee |
|||||||
|
Number of Projects |
3 |
2 |
2 |
2 |
1 |
1 |
3 |
|
Construction Funding |
170,931 |
160,737 |
144,049 |
210,525 |
135,883 |
42,200 |
864,325 |
|
Texas |
|||||||
|
Number of Projects |
8 |
10 |
9 |
7 |
8 |
5 |
17 |
|
Construction Funding |
81,977 |
209,456 |
158,544 |
248,332 |
777,589 |
446,031 |
1,921,929 |
|
Vermont |
|||||||
|
Number of Projects |
1 |
1 |
1 |
— |
— |
— |
1 |
|
Construction Funding |
500 |
500 |
40,000 |
— |
— |
— |
41,000 |
|
Virgin Islands |
|||||||
|
Number of Projects |
— |
— |
— |
— |
2 |
— |
2 |
|
Construction Funding |
— |
— |
— |
— |
99,852 |
— |
99,852 |
|
Virginia |
|||||||
|
Number of Projects |
4 |
1 |
1 |
1 |
4 |
4 |
8 |
|
Construction Funding |
32,800 |
14,920 |
550 |
12,657 |
634,603 |
77,873 |
773,403 |
|
Washington |
|||||||
|
Number of Projects |
3 |
5 |
2 |
2 |
6 |
3 |
10 |
|
Construction Funding |
56,050 |
128,184 |
51,694 |
96,349 |
331,376 |
12,500 |
676,153 |
|
West Virginia |
|||||||
|
Number of Projects |
3 |
5 |
3 |
— |
— |
1 |
6 |
|
Construction Funding |
9,525 |
13,995 |
5,175 |
— |
— |
148,208 |
176,903 |
|
Wisconsin |
|||||||
|
Number of Projects |
2 |
2 |
1 |
1 |
1 |
1 |
3 |
|
Construction Funding |
750 |
1,100 |
3,960 |
11,820 |
21,313 |
4,173 |
43,116 |
|
Wyoming |
|||||||
|
Number of Projects |
1 |
1 |
1 |
— |
— |
— |
1 |
|
Construction Funding |
500 |
750 |
1,500 |
— |
— |
— |
2,750 |
|
National Programsb |
|||||||
|
Number of Projects |
2 |
2 |
2 |
2 |
2 |
2 |
2 |
|
Construction Funding |
13,000 |
17,700 |
41,995 |
70,672 |
38,000 |
72,200 |
253,567 |
Legend: — = No projects or funding received that fiscal year
Source: GAO analysis of U.S. Army Corps of Engineers data. | GAO‑25‑107241
Note: Some construction projects included work that spanned multiple states in fiscal years 2018 through 2023. We assigned funding amounts to a single state based on the corresponding latitude and longitude data provided to us by the U.S. Army Corps of Engineers. As a result, Corps projects in Nevada, New Hampshire, and Utah did not have Corps projects that received construction funding in fiscal years 2018 through 2023. For additional details on this analysis, see appendix I of GAO‑25‑107241.
aThe total number of projects for each state may not equal the sum of projects across all fiscal years because some projects received funding in more than 1 fiscal year.
b”National Programs” includes the Aquatic Plant Control Program and the Dam Safety & Seepage/Stability Correction Program. These programs include work that may not be attributable to any specific location or state.
Appendix IV: Project Eligibility Criteria for Non-Directed Construction Funding, Fiscal Years 2018 through 2023
Table 3: Eligibility Criteria for New U.S. Army Corps of Engineers (Corps) Construction Projects Using Non-Directed Funding, Corps Guidance for Annual Energy and Water Development Appropriations, Fiscal Years 2018 through 2023
|
New Construction Basic Eligibility Criteria |
|
Each recommended new start requires a decision document to serve as the basis for selection. This requirement can be satisfied by one of the following: (1) an approved feasibility report with engineering annex; (2) an approved General Reevaluation Report; (3) in some cases, an approved Post-Authorization Change Report; or (4) for certain rehabilitation or design or construction deficiency correction projects, an approved evaluation report. |
|
The project or separable element is authorized for construction. No planning, engineering, design, or construction of unauthorized functions or features is proposed for construction funding. |
|
An appropriate decision document has been approved and received Executive Branch concurrence or is scheduled to be completed and approved. |
|
Planning, Engineering, and Design is fully funded and the Project Partnership Agreement is on schedule to be executed no later than the end of the budget year. |
|
The Project Manager has confirmed the sponsor’s understanding of its contractual and financial commitments and its willingness and ability to meet the funding requirements of the construction schedule, including its proportional cash share of sunk and current costs. |
|
The project is in compliance with applicable environmental statutes, an Environmental Assessment has been completed, and Finding of No Significant Impact signed, or final Environmental Impact Statement has been filed with the Environmental Protection Agency, or the applicable action will have been completed by August 31 two years before the year the annual guidance document applies to. |
|
A certified Total Project Cost Summary and Micro-Computer Aided Cost Estimating System cost estimate have been prepared, in accordance with Engineer Regulation 5-1-11 and Engineer Regulation 1110-2-1302, with approval at the appropriate levels as the basis for the subsequent work and financial flow. |
|
A Project Management Plan has been prepared and approved. |
|
No known or reasonably anticipated conditions or unresolved issues exist which might prevent either: (1) award of the first significant construction contract by the end of the budget year; or (2) the start of real estate acquisition for the first significant construction contract so that the scheduled construction contract can be awarded no later than the end of the following fiscal year in the absence of the sponsor possessing title to the required lands and easements. Planning, engineering, and design work should be far enough along in the budget year so that the orderly and continuous progression of construction is assured with the scheduled award of the first construction contract. |
|
Programmed recreation facilities either are minimum facilities needed for health and safety as defined in Engineer Regulation 1165-2-400 Recreational Planning, Development, and Management Policies, CH1, or have a non-federal partner that has agreed to provide 50 percent cost sharing and financing for its share of recreation costs and to bear 100 percent of the recreation operation and maintenance costs in accordance with the cost sharing and financing concepts in the Water Resources Development Act of 1986, as amended. |
|
In the case of a specifically authorized project, separable element, reconstruction project, rehabilitation project, or navigation mitigation project, or resumption thereof that produces economic outputs and is proposed as new construction, the most recent approved report with an economic analysis must be current. |
|
In all cases, project cost estimates exceeding the authorized cost, plus inflation, must be approved by the Deputy Commanding General for Civil and Emergency Operations. |
|
Funding for any activities where additional funding would take the project within 20 percent of the 902 limit should be included if funds will complete the project or a scheduled/funded stream to completion can be provided that demonstrates the project can complete within the 902 limit with relatively low risk and the use of those funds is compliant with Engineer Regulation 1105-2-100 Planning Guidance Notebook. |
|
Coastal and hurricane storm damage reduction projects involving sand replacement must also be approved by the Deputy Commanding General for Civil and Emergency Operations in accordance with Civil Work Policy Memorandum 15-001, which establishes the criteria for determining the maximum project cost limitations; those subject to Section 902 and those that are not. |
Source: GAO analysis of Corps guidance for Energy and Water Development Appropriations, fiscal years 2018 through 2023. | GAO‑25‑107241
Note: Each criterion applied in each fiscal year from 2018 through 2023.
Appendix V: Additional Considerations Applied to Eligible Construction Projects, Fiscal Years 2018 through 2023
Table 4: Priority Considerations for U.S. Army Corps of Engineers Non-Directed Construction Funding in Annual Energy and Water Development and Related Agencies Appropriations Acts, Fiscal Years 2018 through 2023
|
When allocating the additional funding provided in the Construction account, the U.S. Army Corps of Engineers shall consider giving priority to the following: |
|
1. benefits of the funded work to the national economy; |
|
2. extent to which the work will enhance national, regional, or local economic development; |
|
3. number of jobs created directly and supported in the supply chain by the funded activity; |
|
4. significance to national security, including the strategic significance of commodities; |
|
5. ability to obligate the funds allocated within the calendar or fiscal year, including consideration of the ability of the non-federal sponsor to provide any required cost share; |
|
6. ability to complete the project, separable element, or project phase with the funds allocated; |
|
7. legal requirements, including responsibilities to Tribes; |
|
8. effect on alleviating water supply issues in areas that have been afflicted by severe droughts in the past four fiscal years, including projects focused on the treatment of brackish water; |
|
9. for flood and storm damage reduction projects (including authorized nonstructural measures and periodic beach renourishments), |
|
a) population, safety of life, economic activity, or public infrastructure at risk, as appropriate; |
|
b) the severity of risk of flooding or the frequency with which an area has experienced flooding; and |
|
c) preservation of historically significant communities, culture, and heritage. |
|
10. for shore protection projects, projects in areas that have suffered severe beach erosion requiring additional sand placement outside of the normal beach renourishment cycle or in which the normal beach renourishment cycle has been delayed, and projects in areas where there is risk to life and public health and safety and risk of environmental contamination; |
|
11. for mitigation projects, projects with the purpose to address the safety concerns of coastal communities impacted by federal flood control, navigation, and defense projects; |
|
12. for navigation projects, the number of jobs or level of economic activity to be supported by completion of the project, separable element, or project phase; |
|
13. for projects cost shared with the Inland Waterways Trust Fund, the economic impact on the local, regional, and national economy if the project is not funded, as well as discrete elements of work that can be completed within the funding provided in this line item; |
|
14. for other authorized project purposes and environmental restoration or compliance projects, to include the beneficial use of dredged material; and |
|
15. for environmental infrastructure, projects with the greater economic impact, projects in rural communities, projects in communities with significant shoreline and instances of runoff, projects in or that benefit counties or parishes with high poverty rates, projects owed past reimbursements, projects in financially distressed municipalities, projects that improve stormwater capture capabilities, projects that provide backup raw water supply in the event of an emergency, and projects that will provide substantial benefits to water quality improvements. |
Source: GAO analysis of Energy and Water Development and Related Agencies Appropriations Acts, fiscal years 2018 through 2023. | GAO‑25‑107241
Notes: Each consideration was included in the explanatory statement of at least one Energy and Water Development and Related Agencies Appropriations Act in fiscal years 2018 through 2023. As a result, not all considerations were necessarily applicable in each fiscal year. Additionally, Congress revised some criteria over time to include additional text or elements, so the considerations listed here may not match the exact language included in each fiscal year.
“Non-directed funding” is the GAO term for funding provided under the heading “additional funding” in the explanatory statements and funding provided by the supplemental appropriations acts.
Table 5: U.S. Army Corps of Engineers Work Package Ranking Criteria for Non-Directed Construction Funding from Annual Energy and Water Development and Related Agencies Appropriations Acts, Fiscal Years 2018 through 2023
|
Work Package Ranking Criteria |
|
Aquatic Ecosystem Restoration Business Line |
|
Significance |
|
Acres |
|
Other purpose outputs |
|
Years to complete |
|
Flood Risk Management Business Line |
|
Population at risk |
|
Risk Depth, Risk Warning Time, Risk Remark (combined risk factors) |
|
Population affected |
|
Benefit-cost ratio, at 7 percent discount rate |
|
Flood Risk Management average annual benefits |
|
Levee Safety Action Classification |
|
Reliability-coastal storm risk management condition |
|
Life safety hazard index |
|
Dam Safety Action Classification rating |
|
Navigation Business Line |
|
Life safety and dam safety |
|
Benefit-cost ratio, at 7 percent discount rate |
|
Mitigation |
|
Inland Waterways Users Board priority for Inland Waterways |
|
Commercial tonnage |
|
Availability of Inland Waterways Trust Fund funding for Inland Waterways |
|
Completions and years to complete |
|
Other Business Line purpose outputs |
|
Relative risk of failure (Operational Condition Assessment, Operational Risk Assessment, & Dam Safety Action Classification) |
|
Dam Safety Action Classification rating |
|
Relative risk of failure – risk compared to other U.S. Army Corps of Engineers dams (portfolio risk assessment if available in budget year) |
|
Critical loss of pool and/or navigation |
Source: GAO analysis of Program Development Manuals, fiscal years 2018 through 2023 . | GAO‑25‑107241
Note: Each ranking criterion was included in at least one Program Development Manual corresponding to a U.S. Army Corps of Engineers business line in fiscal years 2018 through 2023. As a result, not all criteria were necessarily applicable in each fiscal year. Additionally, some criterion names changed over time to include additional text or elements, so the criterion listed here may not match the exact language included in each fiscal year. For these cases, the criteria language in the table reflects the most descriptive language in any fiscal year.
Table 6: Construction Performance Guidelines for Ranking U.S. Army Corps of Engineers Construction Projects, Fiscal Years 2018 through 2023
|
Construction Performance Guidelines |
|
Project Purpose – Ongoing construction projects, including those funded in the Inland Waterways Trust Fund, Harbor Maintenance Trust Fund, and Mississippi River and Tributaries account, are assigned based on their primary purpose to one of the three main mission areas of the U.S. Army Corps of Engineers (Corps) (flood and storm damage reduction, commercial navigation, and aquatic ecosystem restoration) or hydropower. |
|
Projects funded to address dam safety assurance, seepage control, and static instability correction problems – Projects that are funded for construction to address a dam safety action classification 1 or 2 concern will be funded to completion or receive the maximum level of funding that the Corps can efficiently and effectively spend each year. |
|
Projects funded on the basis of their economic return – Ongoing construction projects that are funded based on their economic return and have a benefit-to-cost ratio (BCR) of 2.0-to-1 or higher, calculated at a 7-percent discount rate, are eligible for funding. Projects with a BCR below this threshold will not be funded unless they are eligible for funding under other criteria of these guidelines. |
|
Projects funded on the basis of their environmental return – Ongoing construction projects with high environmental returns that restore degraded ecosystem structure, function, and/or process to a more natural condition are eligible for funding. |
|
Projects funded to address a significant risk to human safety – Flood and storm damage reduction projects that are funded to address a significant risk to human safety will receive sufficient funding to complete all features that address the principal source of the significant safety risk. |
|
Mitigation or environmental requirements – Mitigation work at ongoing construction projects, and work needed to comply with treaties or biological opinions, will be funded to meet those requirements. |
|
Non-structural flood damage reduction projects – Ongoing non-structural flood damage reduction projects will be eligible for funding if the project has a BCR of 1.0-to-1 or above, at a 7-percent discount rate. |
|
Dredged Material Disposal Facilities – Construction of Dredged Material Disposal Facilities for high and moderate use segments of commercial deep-draft, shallow-draft, and inland waterways projects will be eligible for funding. |
|
Project completions – Ongoing projects that can complete all remaining construction work during the budget year or the following year may be funded at the level needed to complete that work if the project has a BCR of 1.0-to-1 or above, at a 7-percent discount rate. |
|
Project funded on the basis of environmental justice – Projects that provide climate change benefits to disadvantaged communities. Projects which meet the thresholds identified in the Climate and Economic Justice Tool for the climate change category and/or the critical clean water and wastewater infrastructure category would be funded with a goal to achieve environmental justice at the business line level as guided by the Justice40 Initiative. |
Source: GAO analysis of Fiscal Year Civil Works Budgets of the U.S. Army Corps of Engineers. | GAO‑25‑107241
Note: Each guideline was included in at least one President’s Budget Request press book for the Corps’ Civil Works program in fiscal years 2018 through 2023. As a result, not all guidelines were necessarily applicable in each fiscal year. Additionally, some performance guideline language changed over time to include additional text or elements, so the guidelines listed here may not match the exact language included in each fiscal year. For these cases, the guideline language in the table reflects the language in the most recent fiscal year.
GAO Contact
Jeff Arkin, (202) 512-6806 or arkinj@gao.gov
Staff Acknowledgments
In addition to the contact named above, Leah Nash (Assistant Director), Alyssia Borsella (Analyst-in-Charge), Nathan Parmeter, Pille Anvelt, Caitlin Cusati, Amy Konstas, John Mingus Jr., Peter Verchinski, and Erin Villareal made key contributions to this report.
The Government Accountability Office, the audit, evaluation, and investigative arm of Congress, exists to support Congress in meeting its constitutional responsibilities and to help improve the performance and accountability of the federal government for the American people. GAO examines the use of public funds; evaluates federal programs and policies; and provides analyses, recommendations, and other assistance to help Congress make informed oversight, policy, and funding decisions. GAO’s commitment to good government is reflected in its core values of accountability, integrity, and reliability.
Obtaining Copies of GAO Reports and Testimony
The fastest and easiest way to obtain copies of GAO documents at no cost is through our website. Each weekday afternoon, GAO posts on its website newly released reports, testimony, and correspondence. You can also subscribe to GAO’s email updates to receive notification of newly posted products.
Order by Phone
The price of each GAO publication reflects GAO’s actual cost of production and distribution and depends on the number of pages in the publication and whether the publication is printed in color or black and white. Pricing and ordering information is posted on GAO’s website, https://www.gao.gov/ordering.htm.
Place orders by calling (202) 512-6000, toll free (866) 801-7077,
or
TDD (202) 512-2537.
Orders may be paid for using American Express, Discover Card, MasterCard, Visa, check, or money order. Call for additional information.
Connect with GAO
Connect with GAO on Facebook, Flickr, X, and YouTube.
Subscribe to our RSS Feeds or Email Updates. Listen to our Podcasts.
Visit GAO on the web at https://www.gao.gov.
To Report Fraud, Waste, and Abuse in Federal Programs
Contact FraudNet:
Website: https://www.gao.gov/about/what-gao-does/fraudnet
Automated answering system: (800) 424-5454 or (202) 512-7700
Congressional Relations
A. Nicole Clowers, Managing Director, ClowersA@gao.gov, (202) 512-4400, U.S. Government Accountability Office, 441 G Street NW, Room 7125, Washington, DC 20548
Public Affairs
Sarah Kaczmarek, Managing Director, KaczmarekS@gao.gov, (202) 512-4800, U.S.
Government Accountability Office, 441 G Street NW, Room 7149
Washington, DC 20548
Strategic Planning and External Liaison
Stephen J. Sanford, Managing
Director, spel@gao.gov, (202) 512-4707
U.S. Government Accountability Office, 441 G Street NW, Room 7814, Washington,
DC 20548
[1]Located within the Department of Defense, the Corps has both a military and a Civil Works program. The military program provides, among other things, engineering and construction services to other U.S. government agencies and foreign governments, while the Civil Works program is responsible for investigating, developing, and maintaining water resources projects. This report discusses only the Civil Works program.
[2]See GAO, Army Corps of Engineers: Budget Requests Included Construction Projects Located in Over 30 States, Selected Using a Multi-level Process, GAO‑19‑99 (Washington, D.C.: Dec. 19, 2018).
[3]Of this amount, $27.7 billion went to the three business lines that align with the Corps’ three primary Civil Works missions: flood risk management, navigation, and aquatic ecosystem restoration. The remaining $781 million went to the Corps’ other Civil Works business lines—hydropower, recreation, water supply, and environmental infrastructure—as well as national programs or other work under the Corps’ Remaining Items program. Unless noted otherwise, all dollar values in this report come from our analysis of Corps data.
[4]The annual appropriations acts were the Energy and Water Development and Related Agencies Appropriations Acts, 2018-2023, which were enacted as division D of Consolidated Appropriations Act, 2018 (Pub. L. No. 115-141); division A of the Energy and Water, Legislative Branch, and Military Construction and Veterans Affairs Appropriations Act, 2019 (Pub. L. No. 115-244); division C of the Further Consolidated Appropriations Act, 2020 (Pub. L. No. 116-94); division D of the Consolidated Appropriations Act, 2021 (Pub. L. No. 116-260); division D of the Consolidated Appropriations Act, 2022 (Pub. L. No. 117-103); and division D of the Consolidated Appropriations Act, 2023 (Pub. L. No. 117-328). The five supplemental appropriations acts were the Bipartisan Budget Act of 2018 (Pub. L. No. 115-123), the Additional Supplemental Appropriations for Disaster Relief Act of 2019 (Pub. L. No. 116-20), the Disaster Relief Supplemental Appropriations Act of 2022 (Pub. L. No. 117-43), the Infrastructure Investment and Jobs Act (Pub. L. No. 117-58), and the Disaster Relief Supplemental Appropriations Act of 2023, enacted as division N of the Consolidated Appropriations Act, 2023 (Pub. L. No. 117-328).
[5]Pub. L. No. 117-263, div. H, tit. LXXXI, § 8236(a)(1), 136 Stat. 2395, 3769.
[6]The Corps provided these data in May 2024. Dollar amounts in this report represent allocations made as of that month. Though the Army and the Office of Management and Budget make final allocation decisions, we refer to these amounts as allocations made by the Corps.
[7]For purposes of this report, when we say that a certain provision or requirement was included in a particular appropriations act, it is possible that it appeared in either the appropriations act itself or the accompanying explanatory statement.
[8]Construction work at an individual Corps project may address multiple business lines.
[9]For the purposes of this report, directed funding refers to funding that is already specified for specific projects and activities, including the projects and activities listed in the construction account table in the explanatory statements. Non-directed funding is funding provided under the heading “additional funding” in the explanatory statements and funding provided by the supplemental appropriations acts.
[10]For example, the Additional Supplemental Appropriations for Disaster Relief Act of 2019 (Pub. L. No. 116-20) provided supplemental funding to projects in states and territories impacted by Hurricanes Florence and Michael, Typhoon Mangkhut, Super Typhoon Yutu, or Tropical Storm Gita in fiscal year 2019. Conversely, the Infrastructure Investment and Jobs Act of 2022 (Pub. L. No. 117-58) did not have a specific impetus event as it provided funding for a broad range of infrastructural projects without event- or geographic-based eligibility criteria.
[11]For our analysis of Corps data, we assigned projects to a state using latitude and longitude coordinates provided by the Corps. As a result, Nevada, New Hampshire, and Utah did not have Corps projects that received construction funding in fiscal years 2018 through 2023. For more information about our methodology, see appendix I.
[12]These provisions designate certain amounts of funds for particular recipients, such as the Corps, to use for specific projects. The provisions are called “Community Project Funding” in the House of Representatives and “Congressionally Directed Spending” in the U.S. Senate. See GAO, Tracking the Funds, https://www.gao.gov/tracking‑funds. For the purpose of this report, we include these amounts in the category of directed funding.
[13]Reprogramming occurs when agencies shift their funds within an appropriation or fund account so that the funds could be used for purposes other than those contemplated at the time of appropriation. The 2018 through 2023 Energy and Water Development and Related Agencies Appropriations Acts specified that the Corps was not allowed to reprogram funding from each act for (1) creating or initiating a new program, project, or activity; or (2) eliminating a program, project, or activity. The acts also specified that without permission from the congressional appropriations committees, the Corps was not allowed to reprogram funding from said acts for (1) increasing funds or personnel for any program, project, or activity for which funds had been denied or restricted by the act; (2) proposing to use funds directed for a specific activity for a different purpose; or (3) augmenting or reducing existing programs, projects, or activities in excess of the amounts specified in the conference reports.
[14]The criterion regarding new starts applied only in fiscal years 2018 through 2021. Annual appropriation acts did not specify new starts in fiscal years 2022 and 2023.
[15]The Bipartisan Budget Act of 2018 (Pub. L. No. 115-123), the Additional Supplemental Appropriations for Disaster Relief Act of 2019 (Pub. L. No. 116-20), the Disaster Relief Supplemental Appropriations Act of 2022 (Pub. L. No. 117-43), and the Disaster Relief Supplemental Appropriations Act of 2023 (Pub. L. No. 117-328) included these eligibility criteria for non-directed construction funding, while the Infrastructure Investment and Jobs Act (Pub. L. No. 117-58) did not. Chief’s Reports are developed by the Corps when a water resources project would require congressional authorization or a change in the project’s existing authorization. These reports are signed by the Chief of Engineers and supplied to relevant congressional committees and the Army.
[16]Project cost sharing agreements describe the responsibilities of the federal government and the non-federal sponsors regarding the cost sharing and execution of work during a project’s construction phase. Non-federal sponsors are entities that typically share in study, design, and construction costs of Corps federal projects. These entities are generally state, tribal, or territorial organizations; local governments; quasi-public organizations chartered under state law (e.g., port authorities); and nonprofit organizations with local government consent. Eligible sponsors must have the legal and financial capability to fulfill requirements of cost-sharing and local cooperation. For fiscal years 2018 and 2019, the acts specified that the project cost sharing agreement be executed by the end of the fiscal year. For fiscal years 2020 and 2021, the acts specified that the project cost sharing agreement be executed by the end of the calendar year.
[17]The Bipartisan Budget Act of 2018 (Pub. L. No. 115-123) stated that eligible projects for construction funding must be in states and territories with more than one flood-related major disaster declared. Similarly, the Additional Supplemental Appropriations for Disaster Relief Act of 2019 (Pub. L. No. 116-20), the Disaster Relief Supplemental Appropriations Act of 2022 (Pub. L. No. 117-43), and the Disaster Relief Supplemental Appropriations Act of 2023 (Pub. L. No. 117-328) stated that eligible projects must be in states and territories that were impacted by named hurricanes, typhoons, or tropical storms.
[18]The annual appropriations acts instructed the Corps to consider giving priority to these items when allocating non-directed funding.
[19]In March 2023, the Army issued a memorandum to the Corps defining an economically disadvantaged community as meeting one or more of the following: (1) low per capita income, categorized as 80 percent or less of the national average; (2) unemployment rate above the national average, categorized as, for the most recent 24-month period for which data are available, at least 1 percent greater than the national average unemployment rate; (3) Indian country as defined in 18 U.S.C. § 1151 or in the proximity of an Alaska Native Village; (4) U.S. territories; or (5) communities identified as disadvantaged by the Council on Environmental Quality’s Climate and Economic Justice Screening Tool.
[20]The environmental operating principles have encouraged Corps employees to consider environmental factors in their work. Examples of these principles include considering environmental consequences of all Corps activities; leveraging scientific, economic, and social knowledge to understand environmental contexts in a collaborative manner; and employing an open and transparent process that respects views of individuals and groups interested in Corps activities. These principles apply to all Corps accounts and business lines.
[21]The Corps followed steps outlined in its Civil Works Direct Program Development Policy Guidance engineer circulars for both its allocation strategy and the development of its Civil Works budget for inclusion in the President’s budget request. We previously reported on the steps the Corps took to develop its Civil Works budget in fiscal years 2008 through 2017. See GAO‑19‑99. According to Corps officials, the Corps’ allocation strategy used different criteria but followed similar steps as those described in the report.
[22]Corps guidance refers to these scores as construction increments, which consist of a series of numerical priority levels for work packages. Work packages assigned lower-number increments received higher consideration for funding, and vice versa.
[23]In fiscal years 2018 and 2019, each district ranked work packages that did not have the two highest scores for funding consideration, with the assumption that the highest-scoring work packages would automatically be included in the list of funding needs. Starting in fiscal year 2020, districts ranked all work packages, including those with the two highest scores.
[24]Corps guidance refers to these as “Key Performance Criteria,” with each listed criterion to be considered in numerical order, representing the order of priority. The criteria were, in order of priority, projects addressing significant risk to life and human safety; projects addressing minimum legal, environmental, and mitigation requirements; ongoing projects whose work continues into the current fiscal budget year; projects in the last year of physical construction; and ongoing projects that can maintain the project construction schedule. Similarly, Army guidance related to the Additional Supplemental Appropriations for Disaster Relief Act of 2019 (Pub. L. No. 116-20) and the Disaster Relief Supplemental Appropriations Act of 2022 (Pub. L. No. 117-43) also specified criteria for selecting the initial Construction Investment Plan. These acts included the following project selection criteria: (1) project is authorized for flood and storm damage reduction, including shore protection; (2) project is located in an eligible state or territory; (3) life safety, benefit-cost ratio, and net benefits; (4) project’s current economic update; (5) sponsor capability; (6) status of preconstruction engineering and design; and (7) status of environmental compliance. Army guidance related to the Disaster Relief Supplemental Appropriations Act of 2022 also included a consideration about environmental justice, climate resilience, and disadvantaged communities.
[25]According to Corps officials, if an eligible construction project with a funding capability did not meet one or more of the Construction Performance Guidelines, the project could still be considered for funding if other circumstances could influence the decision. For example, if a project did not meet any of the Construction Performance Guidelines but was the only eligible project with a funding capability that could satisfy language in the appropriations act, then it would likely be nominated for consideration to receive funding.
[26]Pub. L. No. 117-263, div. H, tit. LXXXI, § 8236(a)(1), 136 Stat. 2395, 3769.
[27]Unless noted otherwise, all dollar values in this report come from our analysis of data provided by the Corps.