FEDERAL RESERVE LENDING PROGRAMS
Nearly Half of Main Street Program Loans Are Fully Repaid, but Losses Have Increased
Report to Congressional Committees
December 2024
GAO-25-107246
United States Government Accountability Office
View GAO‑25‑107246. For more information, contact Michael E. Clements at (202) 512-8678 or ClementsM@gao.gov.
Highlights of GAO‑25‑107246, a report to congressional committees
December 2024
FEDERAL RESERVE lending programs
Nearly Half of Main Street Program Loans Are Fully Repaid, but Losses Have Increased
Why GAO Did This Study
As of the end of fiscal year 2024, four of the Federal Reserve’s 13 lending facilities, all part of the Main Street Lending Program, continued to hold significant outstanding assets and loans. These facilities had approximately $4.7 billion in outstanding assets and loans, which will not mature until July 2025 or later. About $10.4 billion in collateral was pledged to secure the loans. The four facilities were among the nine that received funds appropriated through the CARES Act (section 4003). The Federal Reserve is required to monitor and report on the status of the facilities until they no longer hold outstanding assets or loans.
The CARES Act includes a provision for GAO to annually report on section 4003 loans, loan guarantees, and investments. This report examines (1) the Federal Reserve’s oversight and monitoring of the CARES Act facilities and (2) the status and performance of Main Street Lending Program loans.
GAO reviewed Federal Reserve documentation, conducted loan-level analysis of Main Street Lending Program loan performance covering July 2020 through August 2024, and interviewed Federal Reserve officials.
What GAO Found
In response to the COVID-19 pandemic, the Board of Governors of the Federal
Reserve System authorized 13 emergency lending programs—known as facilities—to ensure the flow of credit across the economy. To improve oversight of these programs, the Federal Reserve issued seven reports from December 2020 through June 2024 that evaluated its internal processes and controls, such as for risk management and cybersecurity. These reports identified 20 opportunities to enhance internal controls. GAO found that Federal Reserve Banks, which manage the facilities, have fully addressed 19 of the 20 opportunities. The remaining opportunity, which relates to a facility’s evaluation model that monitors loans’ credit quality, is currently under review. GAO also found that the Federal Reserve’s plans for ongoing monitoring of the facilities are generally aligned with federal internal control standards.
The five facilities under the Main Street Lending Program targeted small and midsize businesses and nonprofits. Of the 1,830 loans made through this program, 850 (or almost half) had been fully repaid as of August 31, 2024, the most recent data available. Further, 138 loans (or about 8 percent) had recorded a total of about $969 million in losses, a significant increase (about $781 million) year-over-year. About 46 percent (or 847 loans) remained outstanding. The program had collected about $1.89 billion in interest payments.
Main Street Lending Program Loans, First Quarter
2021–Third Quarter 2024
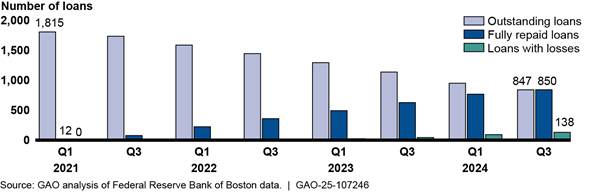
Note: Numbers may not add to the total number of loans due to varying loan statuses.
Loans to larger businesses have generally performed better than those to smaller ones. For example, businesses with annual revenues over $42.1 million at loan origination accounted for the largest share of repaid loans. In contrast, smaller businesses (annual revenues of $3.1 million or less) experienced higher rates of delinquencies and losses. Businesses in the construction sector have repaid a smaller proportion of loans and experienced higher delinquency rates compared with other sectors, such as the leisure and hospitality sector.
The higher rates of delinquencies and losses partly reflect the effects of higher interest payments and the 15 percent of each loan’s principal that came due for borrowers in the second half of 2023. Interest rates higher than those at loan origination have increased borrowers’ payments, potentially creating financial strain for businesses. Another 15 percent of each loan’s principal came due during 2024, and a balloon payment of the remaining 70 percent will come due beginning mid-2025, potentially further affecting loan performance.
Abbreviations
NAICS North American Industry Classification System
RBOPS Division of Reserve Bank Operations and Payment Systems
This is a work of the U.S. government and is not subject to copyright protection in the United States. The published product may be reproduced and distributed in its entirety without further permission from GAO. However, because this work may contain copyrighted images or other material, permission from the copyright holder may be necessary if you wish to reproduce this material separately.
December 19, 2024
Congressional Committees
In response to the economic effects of the COVID-19 pandemic, in 2020, the Board of Governors of the Federal Reserve System authorized 13 emergency lending programs, known as facilities. These facilities were intended to support the flow of credit to employers, consumers, small and midsize businesses, state and local governments, and nonprofit organizations.[1] Nine of the 13 facilities received funds appropriated by the CARES Act.[2]
The CARES Act facilities ceased purchasing assets or extending credit by January 8, 2021. Only the facilities under the Main Street Lending Program, which targeted small and midsize businesses and nonprofits, continue to hold substantial outstanding assets and loans.[3] As of September 30, 2024, the program held about $4.7 billion in outstanding assets and loans.[4] Main Street loans have a 5-year maturity, meaning any currently outstanding loans will not mature until July 2025 or later.
Section 4026(f) of the CARES Act includes a provision for us to report annually on the loans, loan guarantees, and other investments provided under section 4003 of the CARES Act.[5] This report examines (1) the Federal Reserve’s oversight and monitoring of the CARES Act facilities and (2) the status of Main Street loans and characteristics and trends in loan performance.
To address the first objective, we analyzed documentation from the Federal Reserve’s Division of Reserve Bank Operations and Payment Systems (RBOPS). This included its procedures for CARES Act facilities, planning documents, and summaries of its completed reviews. We also compared RBOPS’s monitoring plans against selected federal internal control standards.[6] Additionally, we reviewed the Federal Reserve’s periodic reports and financial statements for updates on potential and actual losses incurred by the facilities, and we received written responses from Federal Reserve officials.
For the second objective, we conducted loan-level analysis of Main Street Lending Program data as of the end of August 2024, the most recent data available from the Federal Reserve Bank of Boston. To assess the reliability of these data, we reviewed documentation, including the data dictionary, for Main Street loan data and performed electronic testing on-site for outliers, missing data, and erroneous values. We also gathered information from Federal Reserve Bank of Boston officials about the collection methodology. We determined the data were sufficiently reliable for the purpose of describing the status and characteristics of Main Street loans and their performance. A more detailed description of our objectives, scope, and methodology can be found in appendix I.
We conducted this performance audit from December 2023 to December 2024 in accordance with generally accepted government auditing standards. Those standards require that we plan and perform the audit to obtain sufficient, appropriate evidence to provide a reasonable basis for our findings and conclusions based on our audit objectives. We believe that the evidence obtained provides a reasonable basis for our findings and conclusions based on our audit objectives.
Background
The Federal Reserve System and Emergency Lending Authority
The Federal Reserve Act established the Federal Reserve System as the country’s central bank.[7] The system consists of three parts: the Federal Reserve Board, Reserve Banks, and the Federal Open Market Committee.[8] The Federal Reserve Board is a federal agency located in Washington, D.C., that oversees the operations of the Reserve Banks and shares with them the responsibility for supervising and regulating certain financial institutions and activities. The Federal Reserve System is divided into 12 districts, and each district is served by a regional Reserve Bank.
The Federal Reserve Board has the authority to authorize the Reserve Banks to extend credit more broadly than usual during emergencies.[9] Specifically, under section 13(3) of the Federal Reserve Act, during unusual and exigent circumstances, the Federal Reserve can authorize Reserve Banks to extend credit to a broader range of borrowers.[10]
Emergency Lending Facilities in Response to COVID-19
In response to the economic disruptions caused by the COVID-19 pandemic, the CARES Act authorized at least $454 billion for the Department of the Treasury to support the Federal Reserve in establishing facilities to provide liquidity to the financial system. With the Secretary of the Treasury’s approval, the Federal Reserve used its authority under section 13(3) to authorize nine facilities using funds appropriated by the CARES Act.[11] The Federal Reserve cited a number of factors in determining that unusual and exigent circumstances existed. These factors included disruption in the financial markets, reduced availability of credit, a heightened need for credit, and an increase in business expenditures.
In general, the CARES Act facilities were designed to address broad sectors of the economy, such as large corporations, small and midsize businesses, and state and local governments. Overall, the CARES Act facilities could support up to $1.95 trillion in transaction volume, and Treasury disbursed $102.5 billion in CARES Act funds to the support the facilities. Of this total, as of September 30, 2024, the Federal Reserve had returned about $97.5 billion to Treasury, leaving about $5 billion available to cover any potential losses the facilities incur. In accordance with the Consolidated Appropriations Act, 2021, all nine facilities stopped purchasing assets or extending credit by January 2021. They conducted a total of about $41 billion in transactions (see table 1).[12]
|
CARES Act–supported facilities |
Number of facilities |
Facility activity |
Termination date |
Transaction amount (in billions) |
|
Primary Market Corporate Credit Facility and Secondary Market Corporate Credit Facility |
2 |
Support large businesses by purchasing qualifying corporate bonds and other eligible assets |
Dec. 31, 2020 |
$14.3a |
|
Main Street Lending Program |
5b |
Support small and midsize for-profit businesses and nonprofit organizations by purchasing participations in eligible loans |
Jan. 8, 2021 |
$16.5c |
|
Municipal Liquidity Facility |
1 |
Support states, certain counties, municipalities, multistate entities, and revenue bond issuers by purchasing eligible notes that these entities issued |
Dec. 31, 2020 |
$6.4 |
|
Term Asset-Backed Securities Loan Facility |
1 |
Support consumers and businesses by providing nonrecourse loans to U.S. companies secured by qualifying asset-backed securities generally backed by recently originated consumer and business loans |
Dec. 31, 2020 |
$3.7 |
Source: GAO analysis of documents and data from the Board of Governors of the Federal Reserve System. | GAO‑25‑107246
aThe Primary Market Corporate Credit Facility
did not conduct any transactions.
bThe Main Street Lending Program comprised five facilities: the Main
Street New Loan Facility, Main Street Priority Loan Facility, Main Street
Expanded Loan Facility, Nonprofit Organization New Loan Facility, and Nonprofit
Organization Expanded Loan Facility.
cThe transaction amount refers to the Federal Reserve’s
participation in Main Street Lending Program loans, which is the purchase of 95
percent of lenders’ authorized loan amount to eligible borrowers. The Nonprofit
Organization Expanded Loan Facility did not conduct any transactions.
For the facilities that received CARES Act funds, outstanding assets peaked between November 2020 and January 2021 (see fig. 1). As of September 2024, only four of the Main Street Lending Program facilities continued to hold assets.[13]
Figure 1: Outstanding Assets of Federal Reserve Lending Facilities Supported by CARES Act Funding, June 2020–September 2024
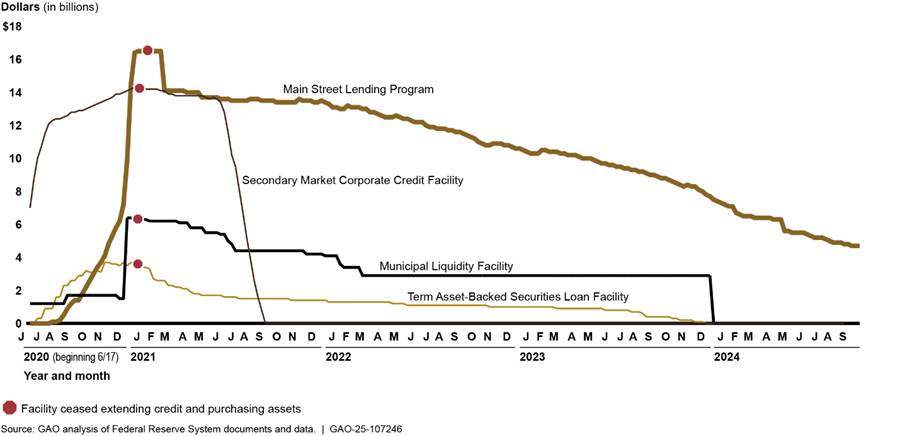
Note: Since Feb. 24, 2021, the Main Street Lending Program’s outstanding assets have been reported net of an allowance for credit losses, which is updated quarterly. The Main Street lending facilities purchased a participation interest in newly issued eligible loans that eligible lenders made to eligible small and midsize for-profit borrowers and nonprofit organizations.
Federal Reserve Oversight of the Facilities
The Federal Reserve’s Division of Reserve Bank Operations and Payment Systems (RBOPS), which oversees the policies and operations of the Reserve Banks, is primarily responsible for the oversight of the facilities. RBOPS’s general framework for oversight consists of three phases:
· Phase one. During its initial phase of oversight, RBOPS, through communication with Reserve Bank staff, focused on providing assistance in setting up the various facilities quickly.
· Phase two. As the facilities became operational, RBOPS reviewed the facilities’ established governance structures, process workflows, and internal control design. RBOPS conducted these reviews to assist Reserve Banks in identifying any enhancements at an early point in the life of the facilities and to obtain reasonable assurance that the design of controls and processes was adequate to ensure the facilities’ effective operation. RBOPS completed phase two reviews for all facilities by December 2020.
· Phase three. The third phase consists of ongoing monitoring activities. These include continued communication with Reserve Bank management and periodic reviews of facility operations and controls to obtain reasonable assurance that controls are present and are functioning in a manner that addresses identified risks. According to RBOPS documentation, phase three oversight activities will continue throughout the life of the facilities, until they no longer hold outstanding assets or loans.
As part of phase three, RBOPS prepares interim reports at 6-month intervals, unless a change in timing is approved by the credit facilities’ oversight steering group and advisers.[14] These reports summarize the scope of oversight activities and any enhancement opportunities related to facility processes and controls. As of October 2024, RBOPS had issued seven interim reports to Reserve Bank management communicating the results of phase three reviews, cumulatively covering December 2020 to June 2024.
As we previously reported, RBOPS has a process for determining whether enhancement opportunities have been addressed.[15] RBOPS officials said Reserve Bank staff notify RBOPS when they have completed steps to address an enhancement opportunity. RBOPS then analyzes the actions taken and determines whether the enhancement opportunity has been addressed. According to RBOPS officials, this analysis may include discussions with a Reserve Bank’s internal audit team and management, walk-throughs with Reserve Bank staff to understand new or updated processes, and reviews of documentation, such as process flows and procedures.
As of February 2024, all of the CARES Act facilities, except those under the Main Street Lending Program, had wound down all processes and terminated operations.
Federal Reserve Oversight Continues, and Reserve Banks Have Generally Implemented Previously Identified Enhancements
Federal Reserve Identified No Additional Opportunities to Enhance Processes and Controls
RBOPS’s two most recent interim reports identified no additional opportunities to enhance facilities’ processes and controls. These reports, which were issued to the applicable Reserve Banks, covered 6-month periods from July 2023 to June 2024.
Consistent with our previous reporting, we found that RBOPS’s ongoing monitoring of the facilities generally aligns with federal internal control standards for monitoring of an entity’s internal control system.[16] According to the standards, management should establish and operate monitoring activities to monitor the internal control system and evaluate the results. This includes ongoing monitoring of the design and operating effectiveness of the internal control system as part of the normal course of operations. Further, management should remediate identified internal control deficiencies on a timely basis.
From July 2023 to June 2024, RBOPS continued to monitor facilities with outstanding loans and to review progress toward implementing a previously identified enhancement opportunity, discussed further below. RBOPS communicated the results of its ongoing monitoring to facility management teams at relevant Reserve Banks and the Federal Reserve Board. As part of its phase three reviews, RBOPS conducts ongoing follow-up and periodic reporting on facilities’ progress in incorporating the remaining enhancement.
RBOPS last updated its overall monitoring approach in fiscal year 2023 and made no changes for fiscal year 2024. In early 2023, RBOPS reassessed operation and risk factors to calibrate its oversight activities for the year. RBOPS identified three overall focus areas for 2023: (1) collateral and asset management; (2) operations and controls; and (3) cybersecurity, resiliency, and data management. The operations and controls area was further divided into four subfocus areas: risk management; vendor management; internal controls; and resources, roles, and responsibilities.
RBOPS noted the following for each focus area:
· Collateral and asset management. RBOPS will continue to monitor underlying collateral, such as by reviewing activities to understand and evaluate whether the Reserve Banks’ approach ensures that the emergency loans remain adequately collateralized and whether asset management procedures are consistent with sound risk management practices.
· Operations and controls. RBOPS will use the components of the operations and controls function to obtain reasonable assurance that controls are present and are functioning in a manner that addresses evolving risks.
· Cybersecurity, resiliency, and data management. To strengthen risk management practices, reduce cyber risks, and maintain resiliency for the facilities, RBOPS will continue to oversee ongoing operations and improvements to the cybersecurity programs through various oversight activities. These oversight activities include regular reviews, continuous monitoring, and other efforts to reduce risk and improve the efficiency and effectiveness of information technology operations.
According to RBOPS’s 2023 planning documentation, phase three oversight will continue to take an adaptive approach, given the maturity of the underlying assets and ongoing investments. Board staff are to consult and coordinate ongoing oversight activities with Reserve Bank control functions, such as risk management and internal audit, and with external auditors. Additionally, RBOPS is to perform a risk assessment each year to inform its planned oversight activities. Based on its ongoing assessments, RBOPS determined that no changes were needed to its monitoring approach for 2024.
RBOPS Completed Its Review of Almost All Reserve Bank Actions to Enhance Processes and Controls
As we previously reported, Reserve Banks have implemented processes to address all 20 opportunities for enhancing processes and controls identified by RBOPS.[17] Of the 20 enhancement opportunities, RBOPS has completed its review of 19. The remaining opportunity, which relates to the validation of one facility’s credit evaluation model, is currently under review.[18]
During 2023, RBOPS balanced its ongoing oversight of the CARES Act facilities with other activities, including the Federal Reserve’s response to 2023 banking stress and the announcement and implementation of the Bank Term Funding Program. According to RBOPS, review of the remaining opportunity resumed in December 2023.
Actual and Expected Losses Are Limited to the Main Street Lending Program
As of September 30, 2024, the Main Street Lending Program facilities were the only ones that had experienced losses. As of that date, the Main Street facilities had recognized approximately $1.2 billion in actual credit losses, net of subsequent recoveries, which we discuss in more detail later in the report. This accounts for about 7 percent of the total transaction amount the program conducted.
The Federal Reserve analyzes all of the outstanding CARES Act facilities on a quarterly basis to determine if it is necessary to set aside an allowance for potential losses. The evaluation of loan participations purchased by the Main Street Lending Program, including those in nonaccrual status, resulted in recording a credit loss allowance for the Main Street Lending Program of $923 million as of June 30, 2024 (down from $1.1 billion reported for the prior quarter). According to RBOPS, the open opportunity for enhancement related to the credit valuation model is unlikely to have any effect on the Main Street Lending Program’s portfolio valuation, credit loss reserve calculation, or other processes.
Nearly Half of Main Street Loans Have Been Fully Repaid, but Losses Have Increased
As of the end of August 2024, about 46 percent of Main Street loans were outstanding, and about 46 percent had been fully repaid. However, about 8 percent of loans had been charged off (either partially or fully) by that date, which may reflect borrowers’ first and second principal payments coming due starting in July 2023 and July 2024, respectively.[19] Delinquencies have fluctuated over time, rising throughout most of the program’s life cycle but falling in recent quarters as many delinquent loans were charged off.
Outstanding Main Street Loans Declined as More Borrowers Made Full Repayments
Outstanding Loans
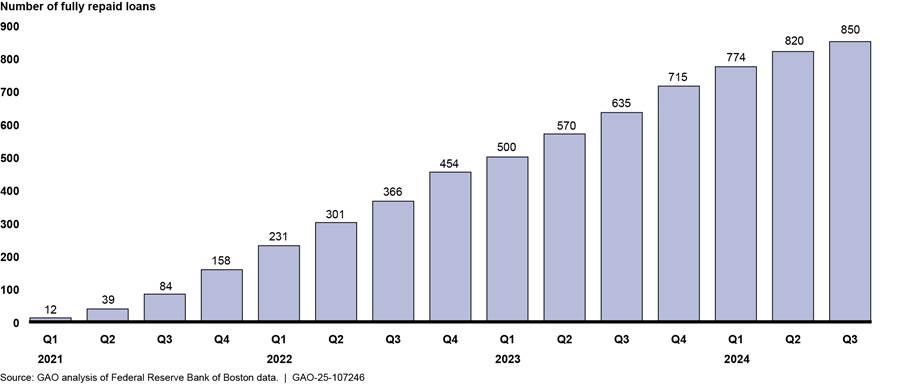
Since the Main Street Lending Program terminated in January 2021, Main Street borrowers generally have made regular and early (unscheduled) payments, resulting in fewer outstanding loans than expected at this point compared with the program’s repayment schedule.[20] As of August 31, 2024, 847 loans (or about 46 percent) of the 1,830 Main Street Lending Program loans remained outstanding. This accounted for about $7.5 billion (or about 43 percent) of the total authorized loan amount.[21] The number of outstanding loans has decreased steadily over time, as the number of loans that have been fully repaid or charged off has increased (see fig. 2). Across all loans, including those currently outstanding, the program has collected $1.89 billion in interest payments.[22]
Figure 2: Number of Outstanding Main Street Lending Program Loans, First Quarter 2021–Third Quarter 2024
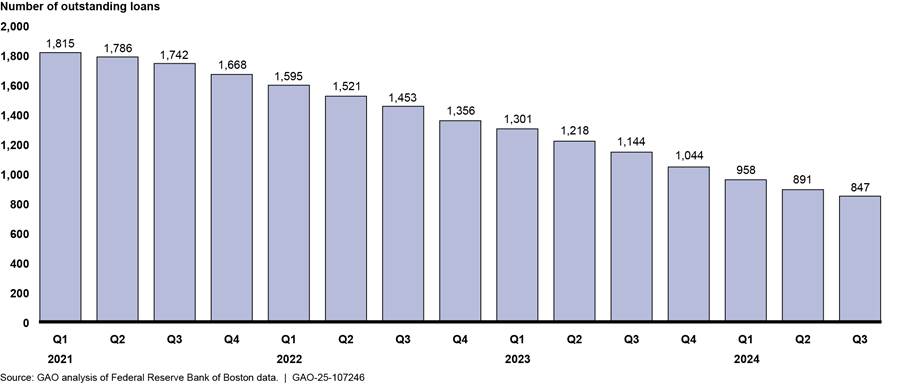
Note: This figure reflects data through the end of August 2024, which only partially represents the third quarter of 2024. In addition, these counts reflect the final count of outstanding Main Street loans at the end of a given quarter.
Distribution of outstanding loans by loan size. Since the Main Street Lending Program terminated in January 2021, the distribution of outstanding loans by loan size has generally aligned with the overall distribution of Main Street loans made under the program. However, since the fourth quarter of 2022, the smallest loans (valued at $1.2 million or less) have constituted a slightly larger share of outstanding loans. As of the end of August 2024, these smaller loans accounted for about 22 percent of outstanding loans, although they account for 20 percent of all originated Main Street loans.
Distribution of outstanding loans by business size. As of the end of August 2024, the distribution of outstanding loans had shifted slightly toward smaller businesses, compared with the distribution of all Main Street loans. Businesses with annual revenues of $7.7 million or less at loan origination accounted for about 46 percent of outstanding loans, whereas these businesses represented about 40 percent of all Main Street borrowers.
In contrast, businesses with annual revenues exceeding $7.7 million accounted for about 54 percent of outstanding loans but 60 percent of all Main Street borrowers (see fig. 3). This distribution generally aligns with our findings in 2023.[23] It may reflect the varying abilities of businesses of different sizes to fully repay their loans in advance, which we discuss further below.
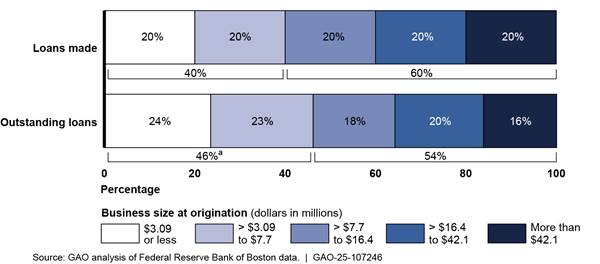
Note: Percentages may not sum to 100 percent due to
rounding. In this figure, percentages are rounded individually for graphical
presentation.
aThis subtotal percentage does not equal the sum of the two
percentages it represents due to rounding of the individual categories.
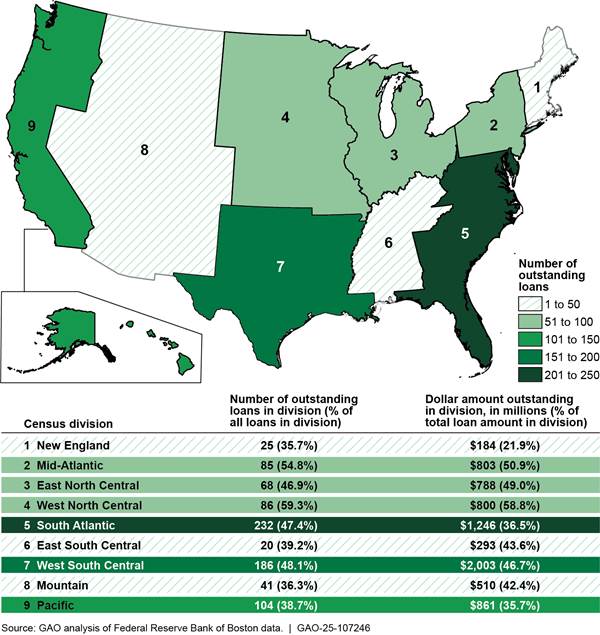
Regional distribution of outstanding loans. The regional distribution of outstanding loans generally aligned with the overall distribution of all Main Street loans. As of the end of August 2024, most of the program’s outstanding loans were in the southern United States, particularly in census divisions 5 and 7 (South Atlantic and West South Central) (see fig. 4).[24] This concentration is consistent with our findings in 2023.[25]
When comparing the proportion of outstanding loans across census divisions, both the number and dollar amount of outstanding loans varied considerably across different regions of the United States. Across all census divisions, census division 4 (West North Central) had the highest percentage of loans outstanding by number and dollar amount in a division. In this division, 59 percent of loans remain outstanding by both number and dollar amount. Conversely, division 1 (New England) had the lowest percentage of loans outstanding by both number and dollar amount.
Sectoral distribution of outstanding loans. The sectoral distribution of outstanding loans also generally aligned with the sectoral distribution of all Main Street loans. About 73 percent of outstanding loans were in service-providing sectors, while about 27 percent were in goods-producing sectors. This distribution is consistent with our findings in 2023.[26]
Businesses in service-providing sectors accounted for the largest share of outstanding loans, both by number and dollar value. The top sectors were (1) leisure and hospitality and (2) trade, transportation, and utilities. However, the percentage of loans outstanding within each sector varied. Businesses in construction—a goods-producing sector—had the greatest percentage of loans outstanding by both number and dollar amount, with 58 percent outstanding by number and 62 percent outstanding by dollar amount (see table 2). In contrast, loans to businesses in leisure and hospitality had the smallest share outstanding based on the number of loans. The “other services” sector had the smallest share based on dollar amount. This sector includes industries not classified within the defined service-providing sectors, such as personal and laundry services and repair and maintenance.
|
Sector |
Number of outstanding loans |
Dollar amount outstanding, dollars in millions |
|
|
Service-providing sectors |
621 (44.5%) |
$5,225 (40.0%) |
|
|
Leisure and Hospitality |
153 (39.7%) |
$1,262 (36.8%) |
|
|
Trade, Transportation, and |
146 (45.8%) |
$1,290 (40.8%) |
|
|
Professional and Business |
121 (48.6%) |
$815 (37.3%) |
|
|
Financial Activities |
93 (48.9%) |
$876 (46.2%) |
|
|
Education and Health Services |
43 (44.3%) |
$506 (44.2%) |
|
|
Information |
37 (40.2%) |
$360 (39.7%) |
|
|
Other Services |
28 (43.8%) |
$117 (33.2%) |
|
|
Goods-producing sectors |
225 (52.0%) |
$2,263 (51.6%) |
|
|
Construction |
97 (58.4%) |
$696 (61.5%) |
|
|
Manufacturing |
76 (45.0%) |
$684 (40.0%) |
|
|
Natural Resources and Mining |
52 (53.1%) |
$883 (57.2%) |
|
Source: GAO analysis of Federal Reserve Bank of Boston data. | GAO‑25‑107246
Fully Repaid Loans
As of the end of August 2024, 850 loans (about 46 percent of all Main Street loans) had been fully repaid. These loans accounted for about $8.8 billion (or about 51 percent) of the total authorized loan amount. These totals reflect a year-over-year increase of 238 loans and about $2.8 billion repaid since August 2023 (see fig. 5).
Note: This figure reflects data through the end of August 2024, which only partially represents the third quarter of 2024.
Distribution of fully repaid loans by loan size. The distribution of fully repaid loans by loan size generally aligned with the overall distribution of loans made, as of the end of August 2024. The smallest loans (valued at $1.2 million or less) accounted for about 18 percent of fully repaid loans, while representing 20 percent of all Main Street loans. In contrast, the largest loans (valued at more than $14.3 million) accounted for 22 percent of fully repaid loans, while representing 20 percent of all Main Street loans.
Distribution of fully repaid loans by business size. As of the end of August 2024, loans to larger businesses constituted a slightly larger share of fully repaid loans than those made to smaller businesses (see fig. 6). Specifically, loans to larger businesses (those with annual revenues exceeding $42.1 million) represented 20 percent of all loans but accounted for nearly 25 percent of fully repaid loans. In contrast, loans to smaller businesses (those with annual revenue of about $3.1 million or less) accounted for 20 percent of all borrowers but about 16 percent of fully repaid loans.
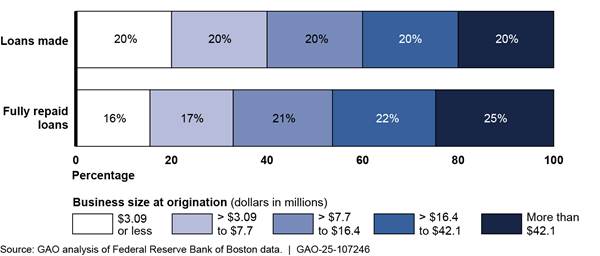
Note: Percentages may not sum to 100 percent due to rounding.
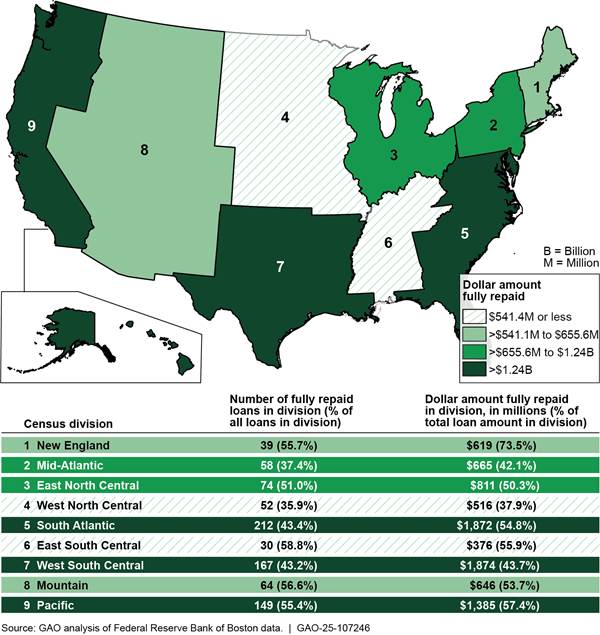
Regional distribution of fully repaid loans. As of the end of August 2024, fully repaid loans were concentrated in the southern United States, consistent with our findings from 2023.[27] Borrowers in census divisions 5 (South Atlantic) and 7 (West South Central) fully repaid more loans, both by number and dollar amount, than borrowers in other areas of the United States. Fully repaid loans in Florida and Texas together accounted for almost one-third of all fully repaid loans.
The percentage of loans that had been fully repaid varied across different regions. Compared with other census divisions, division 6 (East South Central) had the highest percentage of fully repaid loans by number (59 percent repaid), while division 1 (New England) had the highest percentage by dollar amount (74 percent repaid). In contrast, division 4 (West North Central) had the lowest percentage of fully repaid loans, measured by both number and dollar amount (see fig. 7).
Sectoral distribution of fully repaid loans. As of the end of August 2024, about 80 percent of fully repaid loans were in service-providing sectors, while about 20 percent were in goods-producing sectors. This distribution generally aligns with our findings in 2023.[28] Across all sectors, the percentage of fully repaid loans varied by both number and dollar amount. The information sector and the leisure and hospitality sector had the highest percentages of fully repaid loans, at about 59 and 56 percent, respectively, by number of loans repaid. In contrast, the construction sector had the lowest percentage of fully repaid loans, at about 32 percent (see table 3).
|
Sector |
Number of fully repaid loans |
Dollar amount fully repaid, dollars in millions |
|
|
Service-providing sectors |
682 (48.9%) |
$7,031 (53.8%) |
|
|
Leisure and Hospitality |
217 (56.4%) |
$2,008 (58.6%) |
|
|
Trade, Transportation, and |
144 (45.1%) |
$1,648 (52.1%) |
|
|
Professional and Business |
110 (44.2%) |
$1,253 (57.3%) |
|
|
Financial Activities |
80 (42.1%) |
$810 (42.7%) |
|
|
Information |
54 (58.7%) |
$544 (60.0%) |
|
|
Education and Health Services |
47 (48.5%) |
$597 (52.2%) |
|
|
Other Services |
30 (46.9%) |
$171 (48.7%) |
|
|
Goods-producing sectors |
168 (38.8%) |
$1,802 (41.1%) |
|
|
Manufacturing |
76 (45.0%) |
$952 (55.6%) |
|
|
Construction |
53 (31.9%) |
$330 (29.2%) |
|
|
Natural Resources and Mining |
39 (39.8%) |
$521 (33.7%) |
|
Source: GAO analysis of Federal Reserve Bank of Boston data. | GAO‑25‑107246
Losses Have Increased, Particularly among Smaller Businesses
As of the end of August 2024, 138 loans (or about 8 percent of all Main Street loans) had been partially or fully charged off, totaling about $969 million in recorded losses, a significant increase year-over-year (about $781 million).[29] Losses increased sharply during the fourth quarter of 2023, with that trend continuing through the second quarter of 2024 (see fig. 8).
Figure 8: Number and Dollar Amount of Main Street Loan Losses, Second Quarter 2021–Third Quarter 2024
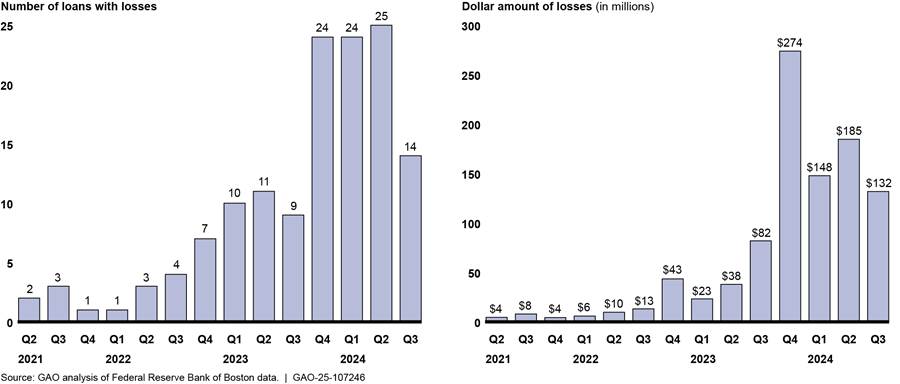
Note: This figure reflects data through the end of August 2024, which only partially represents the third quarter of 2024. The dollar amount of losses reflects losses on the principal amount of Main Street loans.
This significant increase in the number and dollar amount of losses may reflect the effects of increased interest payments and the first of three required principal payments coming due for Main Street loans. As we reported in 2023, higher interest rates have led to increased interest payments on outstanding loans for borrowers, potentially imposing financial burdens on businesses.[30] The first principal payments, which began in July 2023 and continued through early 2024, required borrowers to pay 15 percent of their loan’s principal. The second principal payment of an additional 15 percent came due for most borrowers during the second half of 2024, which could lead to further losses. A balloon payment of 70 percent of the loan’s principal will come due for the earliest program participants in the second half of 2025.
Distribution of losses by loan size. Of the approximately 8 percent of Main Street loans that have experienced losses to date, losses by loan size generally aligned with the distribution of Main Street loans at origination. For example, loans valued at $1.2 million or less represent 20 percent of all loans and accounted for about 21 percent of charge-offs. In addition, the largest loans (valued at more than $14.3 million), which also represent 20 percent of all loans, accounted for about 18 percent of charge-offs (see fig. 9). The largest loans represented 2 percent of all losses when we last reported on losses in the Main Street program in 2023, which reflects the changing spread of losses year-over-year.[31]
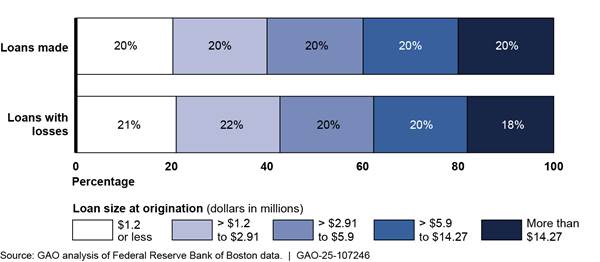
Note: Percentages may not sum to 100 percent due to rounding.
Distribution of losses by business size. Loans to smaller businesses accounted for a greater share of losses than loans to larger businesses, as of the end of August 2024. Specifically, loans to Main Street borrowers with annual revenue of about $3.1 million or less at the time of program entry—the program’s smallest businesses—represent 20 percent of all Main Street loans but about 28 percent of loans with losses to date. In comparison, the program’s largest businesses, those with annual revenues exceeding $42.1 million, also account for 20 percent of all loans but about 14 percent of loans with losses (see fig. 10). These largest businesses accounted for a smaller share of losses when we last reported on Main Street loans, at about 2 percent.[32]
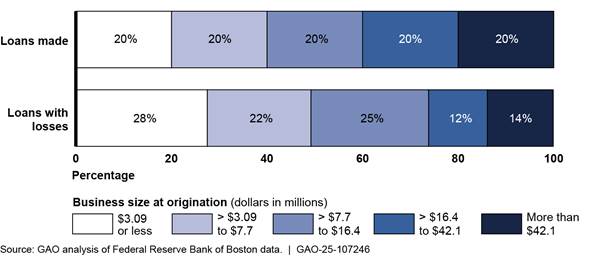
Note: Percentages may not sum to 100 percent due to rounding.
Regional distribution of losses. As of the end of August 2024, census region 3 (the South) accounted for the highest number and dollar amount of losses in the Main Street program.[33] In this region, 81 loans experienced about $581 million in losses, resulting in a charge-off rate (that is, the number or dollar amount of loans charged off as a percentage of total loans in a region) of about 9 percent by number of loans and about 7 percent by dollar amount of loans. (See table 4.)
|
Region |
Number of loans with losses |
Percent (%) of all loans in region that have been charged off |
Dollar amount of losses, in millions |
Percent of total loan amount in region that has been charged off |
|
1 (Northeast) |
17 (225) |
7.6% |
$115 ($2,419) |
4.8% |
|
2 (Midwest) |
10 (290) |
3.4% |
$32 ($2,972) |
1.1% |
|
3 (South) |
81 (927) |
8.7% |
$581 ($8,378) |
6.9% |
|
4 (West) |
29 (382) |
7.6% |
$235 ($3,615) |
6.5% |
Source: GAO analysis of Federal Reserve Bank of Boston data. | GAO‑25‑107246
Sectoral distribution of losses. Loans with losses were concentrated in service-providing sectors, which generally reflects the overall distribution of Main Street loans. In particular, loans to the trade, transportation, and utilities sector accounted for the most losses by number (28), while loans to financial activities companies accounted for the highest losses by dollar amount (about $213 million).
Certain sectors have experienced higher charge-off rates than others. For example, based on dollar value, about 12 percent of loans made to construction businesses have been charged off. The financial activities sector had the second highest charge-off rate, about 11 percent by dollar value. In comparison, most sectors have experienced lower charge-off rates, ranging from about 3 to 6 percent.
Delinquencies Have Fluctuated as Principal Payments Have Come Due and More Loans Have Been Charged Off
Delinquencies have generally increased over the course of the Main Street Lending Program’s life cycle, but they began to decline after the fourth quarter of 2023 (see fig. 11).[34]
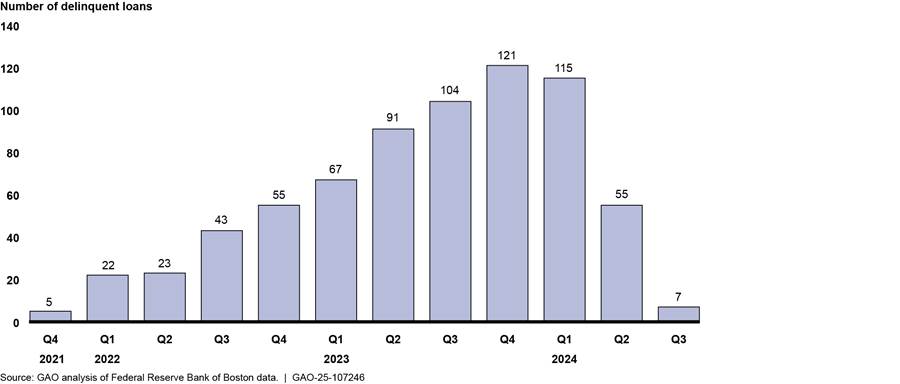
Note: This figure reflects data through the end of August 2024, which only partially represents the third quarter of 2024. Delinquency counts include all instances as of each quarter, meaning individual loans may be represented multiple times.
Federal Reserve Bank of Boston staff told us they attribute this decline to the
fact that many delinquent loans were fully charged off, removing them from the
count of active delinquencies. Our analysis of charge-offs and delinquencies
shows that the charge-off rate in the second and third quarters of 2024
exceeded the delinquency rate among active loans (see fig. 12). This suggests
that many delinquent loans were charged off and recorded as losses. The losses
in the first two quarters of 2024 occurred after initial principal payments (15
percent of loan principal) came due for most borrowers in the second half of
2023. Some loans may have been charged off because borrowers were unable to
make this initial principal payment.
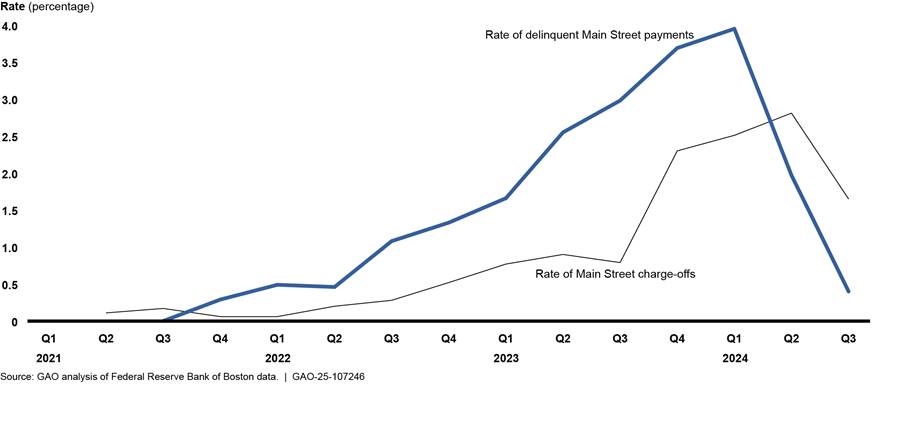
Note: This figure reflects data through the end of August 2024, which only partially represents the third quarter of 2024.
Distribution of delinquencies by loan size. Smaller loans accounted for more delinquencies than larger loans as of the end of August 2024. The smallest loans (valued at $1.2 million or less), which represent 20 percent of all loans, accounted for about 22.4 percent of delinquent active loans. In contrast, the largest loans (valued at more than $14.3 million), which also represent 20 percent of all loans, accounted for about 14 percent of delinquent loans.
Distribution of delinquencies by business size. Loans made to smaller businesses accounted for more delinquencies than those made to larger businesses. Specifically, loans to borrowers with annual revenue of $3.1 million or less represent 20 percent of all loans but accounted for about 30 percent delinquent active loans. Conversely, loans to larger businesses, which also represent 20 percent of all loans, accounted for about 11 percent of delinquent loans.
Regional distribution of delinquencies. The number of delinquent active loans varied across U.S. regions. Census region 3 (the South) had the highest number of delinquent active loans, with 66 loans (about 7 percent of the region’s loans). Although census region 1 (the Northeast) had fewer delinquent loans, at 16, its delinquency rate was equal to that of region 3.
Sectoral distribution of delinquencies. More delinquencies occurred in service-providing sectors than in goods-producing sectors, reflecting the distribution of loans at origination. The trade, transportation, and utilities sector had the most delinquent loans, with 27 active loans delinquent.
In contrast, other sectors had higher delinquency rates despite having fewer delinquent loans. For example, while the construction sector had 15 active delinquent loans—tied for third highest of all sectors—it had a delinquency rate of about 9 percent, which is higher than any other sector.
Agency Comments
We provided a draft of this report to the Federal Reserve and Treasury for review and comment. The Federal Reserve provided technical comments, which we incorporated as appropriate. Treasury informed us it had no comments.
We are sending copies of this report to the appropriate congressional committees, the Chair of the Board of Governors of the Federal Reserve System, and the Secretary of the Treasury. This report will also be available at no charge on GAO’s website at https://www.gao.gov.
If you or your staff have any questions about this report, please contact me at (202) 512-8678 or clementsm@gao.gov. Contact points for our Offices of Congressional Relations and Public Affairs may be found on the last page of this report. GAO staff who made key contributions to this report are listed in appendix II.

Michael E. Clements
Director, Financial Markets and Community Investment
List of Committees
The Honorable Patty Murray
Chair
The Honorable Susan Collins
Vice Chair
Committee on Appropriations
United States Senate
The Honorable Sherrod Brown
Chairman
The Honorable Tim Scott
Ranking Member
Committee on Banking, Housing, and Urban Affairs
United States Senate
The Honorable Sheldon Whitehouse
Chairman
The Honorable Chuck Grassley
Ranking Member
Committee on the Budget
United States Senate
The Honorable Maria Cantwell
Chair
The Honorable Ted Cruz
Ranking Member
Committee on Commerce, Science, and Transportation
United States Senate
The Honorable Kyrsten Sinema
Chair
The Honorable James Lankford
Ranking Member
Subcommittee on Government Operations and Border Management
Committee on Homeland Security and Governmental Affairs
United States Senate
The Honorable Tom Cole
Chairman
The Honorable Rosa DeLauro
Ranking Member
Committee on Appropriations
House of Representatives
The Honorable Jodey Arrington
Chairman
The Honorable Brendan Boyle
Ranking Member
Committee on the Budget
House of Representatives
The Honorable Patrick McHenry
Chairman
The Honorable Maxine Waters
Ranking Member
Committee on Financial Services
House of Representatives
The Honorable Sam Graves
Chairman
The Honorable Rick Larsen
Ranking Member
Committee on Transportation and Infrastructure
House of Representatives
The objectives of this report were to examine (1) the Board of Governors of the Federal Reserve System’s oversight and monitoring of the CARES Act facilities and (2) the status of Main Street loans and their characteristics and trends in loan performance.
To address the first objective, we analyzed documentation from the Federal Reserve’s Division of Reserve Bank Operations and Payment Systems (RBOPS). This included its policies and procedures pertaining to the monitoring and controls of the CARES Act facilities. We reviewed planning documents and summaries of completed reviews of the facilities. We also obtained written responses from Federal Reserve officials on RBOPS’s framework and approach for ongoing monitoring of the facilities and results of RBOPS’s oversight reviews.
We compared RBOPS’s monitoring plans against selected federal internal control standards, including the principles that management should establish and operate monitoring activities to monitor the internal control system and evaluate the results, and that management should remediate identified internal control deficiencies on a timely basis.[35] Additionally, we reviewed the Federal Reserve’s periodic reports covering 6-month periods from July 2023 to June 2024 and quarterly and annual financial statements for updates on potential and actual losses incurred by the Federal Reserve facilities. We also received written responses to discussion questions from RBOPS officials on their lending facility oversight and monitoring activities.
To address the second objective, we conducted on-site reviews of Main Street Lending Program data at the Federal Reserve Bank of Boston. To assess the status and characteristics of and trends in Main Street Lending Program loans, we retrieved information from two data sources: (1) a compendium from the Reserve Bank of borrower information collected in the lender registration and participation review processes and (2) Main Street accounting records that are generated by a third-party contractor. The compendium included borrower information at loan origination, as well as borrower-reported payment information. The accounting records included information on loan positions, loan transactions from inception, and loan delinquencies. We reviewed and analyzed participation data and loan-level payment data as of the end of August 2024, the most recent data available.
We analyzed data from the program’s July 2020 inception through August 2024 to determine:
· the number and dollar amount of Main Street loan payments, including interest and principal payments due and made;
· the number and dollar amount of outstanding, fully repaid, and charged-off loans;
· the number of delinquent loans; and
· the distribution of outstanding, fully repaid, charged-off, and delinquent loans by their loan and business sizes.
In addition, we analyzed geographic and sectoral information for outstanding, fully repaid, charged-off, and delinquent loans. For our geographic analysis, we used Main Street program data to match loan payment information as of August 2024 to geographic identifiers collected from borrowers at intake. To avoid revealing borrower-specific information, we aggregated geographic data at the census division level for outstanding and fully repaid loans and at the census region level for charged-off and delinquent loans. We reported the number of loans for each status category and analyzed dollar amounts for outstanding, fully repaid, and charged-off loans.
For our sectoral analysis, we used program data to match loan payment information to North American Industry Classification System (NAICS) codes collected from borrowers at intake. To avoid revealing borrower-specific information, we aggregated Main Street borrowers’ designated NAICS codes into sectors defined by the Bureau of Labor Statistics. We further aggregated sectors into super-sectors.[36] We reported the number of loans for each loan status (outstanding, fully repaid, charged off, and delinquent) by sector and super-sector. We also analyzed and reported dollar amounts for outstanding, fully repaid, and charged-off loans.
To understand the relationship between delinquent and charged-off loans, we used Main Street loan performance data to calculate delinquency and charge-off rates on a quarterly basis. We first identified the number of outstanding, delinquent, and charged-off loans for each quarter from April 2021 to August 2024. We then generated the delinquency and loss rates by dividing the number of delinquent or charged-off loans by the number of outstanding loans for each quarter.
We assessed the reliability of the Main Street data we used by reviewing agency documentation, including a data dictionary, and conducting electronic testing for outliers, missing data, and erroneous values. We also interviewed staff of the Federal Reserve Bank of Boston to discuss the interpretation and reliability of various data fields and how data are collected, stored, and maintained. We determined that the data were sufficiently reliable for describing selected characteristics of Main Street loans and payment performance.
We conducted this performance audit from December 2023 to December 2024 in accordance with generally accepted government auditing standards. Those standards require that we plan and perform the audit to obtain sufficient, appropriate evidence to provide a reasonable basis for our findings and conclusions based on our audit objectives. We believe that the evidence obtained provides a reasonable basis for our findings and conclusions based on our audit objectives.
GAO Contact
Michael E. Clements, clementsm@gao.gov, (202) 512-8678
Staff Acknowledgments
In addition to the contact named above, Tarek Mahmassani (Assistant Director), Zamir Ruli (Analyst in Charge), Blake Faucher, Daniel Flavin, John Karikari, Christopher Klemmer, Marc Molino, Jessica Sandler, Jennifer Schwartz, and Farrah Stone made key contributions to this report.
GAO’s Mission
The Government Accountability Office, the audit, evaluation, and investigative arm of Congress, exists to support Congress in meeting its constitutional responsibilities and to help improve the performance and accountability of the federal government for the American people. GAO examines the use of public funds; evaluates federal programs and policies; and provides analyses, recommendations, and other assistance to help Congress make informed oversight, policy, and funding decisions. GAO’s commitment to good government is reflected in its core values of accountability, integrity, and reliability.
Obtaining Copies of GAO Reports and Testimony
The fastest and easiest way to obtain copies of GAO documents at no cost is through our website. Each weekday afternoon, GAO posts on its website newly released reports, testimony, and correspondence. You can also subscribe to GAO’s email updates to receive notification of newly posted products.
Order by Phone
The price of each GAO publication reflects GAO’s actual cost of production and distribution and depends on the number of pages in the publication and whether the publication is printed in color or black and white. Pricing and ordering information is posted on GAO’s website, https://www.gao.gov/ordering.htm.
Place orders by calling (202) 512-6000, toll free (866) 801-7077,
or
TDD (202) 512-2537.
Orders may be paid for using American Express, Discover Card, MasterCard, Visa, check, or money order. Call for additional information.
Connect with GAO
Connect with GAO on Facebook, Flickr, X, and YouTube.
Subscribe to our RSS Feeds or Email Updates. Listen to our Podcasts.
Visit GAO on the web at https://www.gao.gov.
To Report Fraud, Waste, and Abuse in Federal Programs
Contact FraudNet:
Website: https://www.gao.gov/about/what-gao-does/fraudnet
Automated answering system: (800) 424-5454 or (202) 512-7700
Congressional Relations
A. Nicole Clowers, Managing Director, ClowersA@gao.gov, (202) 512-4400, U.S. Government Accountability Office, 441 G Street NW, Room 7125, Washington, DC 20548
Public Affairs
Sarah Kaczmarek, Managing Director, KaczmarekS@gao.gov, (202) 512-4800, U.S.
Government Accountability Office, 441 G Street NW, Room 7149
Washington, DC 20548
Strategic Planning and External Liaison
Stephen J. Sanford, Managing
Director, spel@gao.gov, (202) 512-4707
U.S. Government Accountability Office, 441 G Street NW, Room 7814, Washington,
DC 20548
[1]The facilities are authorized under section 13(3) of the Federal Reserve Act and approved by the Secretary of the Treasury. Section 13(3) of the Federal Reserve Act permits the Federal Reserve to provide emergency lending.
[2]To provide economic relief, section 4003(b)(4) of the CARES Act made available at least $454 billion for the Department of the Treasury to support the Board of Governors of the Federal Reserve System in establishing facilities. Pub. L. No. 116-136, § 4003(b)(4), 134 Stat. 281, 470 (2020). We refer to these facilities as CARES Act facilities.
[3]The Federal Reserve also established four emergency lending facilities that did not receive CARES Act appropriations, which we refer to as non–CARES Act facilities, intended to serve various markets and credit needs. On July 30, 2021, the last of the non–CARES Act facilities stopped purchasing assets or extending credit.
[4]This amount includes Main Street loan participations at face value, net of an allowance for credit losses updated as of September 30, 2024. As of September 30, 2024, about $10.4 billion was held in collateral to secure the loans.
[5]Specifically, we are to report no later than 9 months after the date of enactment of the act, and annually thereafter through the year succeeding the last year for which loans, loan guarantees, or other investments made under section 4003 are outstanding. Our previous reports were GAO, Federal Reserve Lending Programs: Status of Monitoring and Main Street Lending Program, GAO‑24‑106482 (Washington, D.C.: Dec. 22, 2023); Federal Reserve Lending Programs: Risks Remain Low in Related Credit Markets, and Main Street Loans Have Generally Performed Well, GAO‑23‑105629 (Washington, D.C.: Dec. 19, 2022); Federal Reserve Lending Programs: Credit Markets Served by the Programs Have Stabilized, but Vulnerabilities Remain, GAO‑22‑104640 (Washington, D.C.: Oct. 19, 2021); and Federal Reserve Lending Programs: Use of CARES Act-Supported Programs Has Been Limited and Flow of Credit Has Generally Improved, GAO‑21‑180 (Washington, D.C.: Dec. 10, 2020). Additionally, we regularly issue government-wide reports on the federal response to COVID-19, available at https://www.gao.gov/coronavirus.
[6]GAO, Standards for Internal Control in the Federal Government, GAO‑14‑704G (Washington, D.C.: September 2014).
[7]Federal Reserve Act, Pub. L. No. 63-43, 38 Stat. 251 (1913).
[8]The Federal Open Market Committee consists of the seven members of the Board of Governors, the President of the Federal Reserve Bank of New York, and four other Reserve Bank presidents who serve on a rotating basis. The committee is responsible for directing open market operations to influence the total amount of money and credit available in the economy.
[9]Reserve Banks typically lend to banks through discount window programs based on established statutory criteria. 12 U.S.C. § 347b(a). The discount window is a Federal Reserve Board lending program that allows eligible institutions to borrow money, usually on a short-term basis, at an above-market rate to meet temporary liquidity shortages.
[10]12 U.S.C. § 343(3). During the 2007–2009 financial crisis, the Federal Reserve invoked its section 13(3) authority to create emergency programs to stabilize financial markets and avert the failures of a few individual institutions.
[11]The Federal Reserve established 13 emergency lending facilities in response to the COVID-19 pandemic. Four emergency lending facilities—the Commercial Paper Funding Facility, Money Market Mutual Fund Liquidity Facility, Paycheck Protection Program Liquidity Facility, and Primary Dealer Credit Facility—were non–CARES Act facilities, which all stopped purchasing assets or extending credit by July 30, 2021. In March 2023, the Federal Reserve established another emergency lending facility to boost operating banks’ liquidity and minimize contagion after Silicon Valley Bank and Signature Bank failed. The Bank Term Funding Program was established on March 12, 2023, and ceased extending loans on March 11, 2024.
[12]For the Main Street Lending Program, the transaction amount refers to the Federal Reserve’s participation in the Main Street loans, which is the purchase of 95 percent of lenders’ authorized loan amount to eligible borrowers.
[13]The Main Street Lending Program’s Nonprofit Organization Expanded Loan Facility did not conduct any transactions.
[14]RBOPS’s organizational structure for phase three credit facility oversight consists of a steering group and an adviser group that oversee the teams responsible for phase three focus areas.
[16]See GAO‑14‑704G and GAO‑24‑106482.
[17]GAO‑24‑106482. The 20 opportunities identified include those related to the Paycheck Protection Program Liquidity Facility, which is a non–CARES Act facility.
[18]The credit evaluation model is used to monitor the credit quality of loans purchased by the facility.
[19]Banks charge off debts when they do not believe that a borrower will pay the amount owed. That is, charge-offs are the value of loans that are removed from the books and charged against loss reserves. However, because Main Street loans are recourse loans, borrowers are still responsible for repaying that debt.
[20]Loans issued under the Main Street Lending Program are recourse loans and have a 5-year maturity, meaning they are expected to be fully repaid 5 years after the date of origination. As recourse loans, lenders can pursue the borrower’s assets in the event of default.
[21]The total authorized amount is defined as the total amount eligible lenders have extended to eligible borrowers.
[22]The amount of interest payments collected by the Main Street Lending Program relative to losses cannot be used as a measure of the program’s profitability, as it does not account for other program costs, such as those incurred for establishing and maintaining the program throughout its life cycle.
[23]GAO‑24‑106482, 31.
[24]The Census Bureau divides the United States into a variety of geographies for analytical purposes. Regions are the largest geographic unit, dividing the country into four major areas, with U.S. territories (other than the District of Columbia) not represented in a formal region. Divisions are the second largest geographic unit, dividing the country into nine major areas. As with regions, U.S. territories (other than the District of Columbia) are not represented in a formal division.
[25]GAO‑24‑106482, 27.
[26]GAO‑24‑106482, 27–28.
[27]GAO‑24‑106482, 36.
[28]GAO‑24‑106482, 36–37.
[29]Recorded losses reflect losses on the principal amount of Main Street loans.
[30]GAO‑24‑106482, 33. Main Street loans are subject to adjustable interest rates based on a benchmark rate (generally, the Secured Overnight Financing Rate). Interest rates have generally stabilized since our 2023 report, but they may still be higher than borrowers initially anticipated.
[31]GAO‑24‑106482, 57.
[32]GAO‑24‑106482, 58.
[33]As noted earlier, the Census Bureau divides the United States into various geographies for analytical purposes. We report losses by Census region rather than Census division due to the smaller percentage of loans that have incurred losses, compared with outstanding and fully repaid loans.
[34]The Federal Reserve Bank of Boston defines delinquent payments as any interest or principal payment that is 30 or more days late. We calculate the delinquency rate as the ratio of delinquent loans to outstanding loans at a given time. Generally, our delinquency rate refers to active Main Street loans only. It excludes charged-off loans, which are no longer considered active despite remaining in the Main Street portfolio for potential recovery during the 5-year term of the loan.
[35]GAO, Standards for Internal Control in the Federal Government, GAO‑14‑704G (Washington, D.C.: September 2014).
[36]According to the Bureau of Labor Statistics, NAICS codes can be grouped into 10 sectors: construction; education and health services; financial activities; information; leisure and hospitality; manufacturing; natural resources and mining; professional and business services; trade, transportation, and utilities; and other services. These sectors can be further aggregated into super-sectors, which include a goods-producing super-sector and a service-providing super-sector.