FEDERAL HIGHWAYS
DOT Should Improve Communications on Its Cost-Effectiveness Tool for Emissions Reductions
Report to Congressional Committees
United States Government Accountability Office
For more information, contact Elizabeth Repko at RepkoE@gao.gov.
Highlights of GAO-25-107366, a report to congressional committees
DOT Should Improve Communications on Its Cost-Effectiveness Tool for Emissions Reductions
Why GAO Did This Study
Cars, trucks, and other vehicles can emit air pollutants harmful to human health. CMAQ supports projects in areas that do not currently, or did not in the past, meet federal air quality standards for certain air pollutants—carbon monoxide, ozone, or particulate matter. The Infrastructure Investment and Jobs Act provided about $2.7 billion for CMAQ in fiscal year 2025 and authorized about $2.7 billion for fiscal year 2026. While DOT created tools—cost-effectiveness tables and emissions calculators—to help states evaluate CMAQ projects, DOT has not tracked data on the use of these tools by states.
The Infrastructure Investment and Jobs Act includes a provision for GAO to review CMAQ. This report discusses, among other issues, (1) how states have used CMAQ funds, (2) the cost effectiveness of CMAQ projects at reducing emissions, and (3) the extent to which DOT has communicated to states about tools for evaluating CMAQ projects. GAO analyzed DOT project data for fiscal years 2015 through 2023 and DOT financial data for fiscal years 2015 through 2024, the most recent years for which data were available. GAO also interviewed agency officials, reviewed DOT CMAQ documents, and surveyed the 50 states and Washington, D.C. on FHWA’s CMAQ tools. GAO assessed DOT’s communication of its tools against federal internal control standards.
What GAO Recommends
GAO is recommending that DOT provide ongoing and formal communications about its CMAQ cost-effectiveness tables.
DOT agreed with our recommendation.
What GAO Found
Since 1991, the Department of Transportation’s (DOT) Congestion Mitigation and Air Quality Improvement Program (CMAQ) has provided funding to states through a statutory formula; this funding is for transportation projects that aim to reduce congestion and improve air quality. GAO found that during fiscal years 2015 through 2023, states spent between $900 million and $1.9 billion annually to start about 700 to 1,200 new CMAQ projects. About 80 percent of projects were for transit improvement, traffic flow improvement, and bicycle and pedestrian projects (see figure).
DOT published tables in 2020 to assist states in evaluating the cost effectiveness (in terms of median cost per ton of emissions reduced) of 21 types of CMAQ projects. Using these tables for projects started in fiscal years 2015 through 2023, GAO found that 88 percent of projects, and 82 percent of their costs, were in project types rated by DOT as having mixed or weak cost effectiveness in reducing emissions. States have discretion in selecting projects, and factors, including regional priorities, may affect the cost effectiveness of those projects. For example, a state may use CMAQ funds on bicycle and pedestrian projects to reduce emissions as well as to support other transportation modes in a region, even if such projects may not be as cost effective as projects of other project types in reducing emissions.
While DOT has communicated to states about its tools for evaluating CMAQ projects, it has not done so on an ongoing basis. Federal internal control standards state that agencies should externally communicate information on a timely basis to help stakeholders achieve their objectives. However, most of DOT’s communications to states about one of its tools—the cost-effectiveness tables—occurred when DOT last published the tables in 2020. Moreover, about one-third of states that responded to a GAO survey said they or other relevant entities in their states were unaware of these tables. Ongoing communication from DOT about the tables could increase states’ awareness and, ultimately, contribute to states selecting CMAQ projects that are more cost effective in reducing emissions of pollutants.
Abbreviations
|
CMAQ |
Congestion Mitigation and Air
Quality Improvement |
|
EPA |
Environmental Protection Agency |
|
FHWA |
Federal Highway Administration |
|
MPO |
metropolitan planning organization |
|
PM |
particulate matter |
|
State DOT |
state department of transportation |
|
STBG |
Surface Transportation Block Grant Program |
This is a work of the U.S. government and is not subject to copyright protection in the United States. The published product may be reproduced and distributed in its entirety without further permission from GAO. However, because this work may contain copyrighted images or other material, permission from the copyright holder may be necessary if you wish to reproduce this material separately.
June 18, 2025
The Honorable Shelley Moore Capito
Chairman
The Honorable Sheldon Whitehouse
Ranking Member
Committee on Environment and Public Works
United States Senate
The Honorable Sam Graves
Chairman
The Honorable Rick Larsen
Ranking Member
Committee on Transportation and Infrastructure
House of Representatives
Cars, trucks, and other modes of transportation are a major source of emissions that can affect air quality and human health. Adverse health effects from exposure to emitted pollutants may include respiratory and cardiovascular diseases that can lead to premature death. One study estimated that emissions from cars, trucks, and other vehicles will contribute to between 6,700 and 18,000 premature deaths in the U.S. in 2025.[1]
Since 1991, the Department of Transportation’s Congestion Mitigation and Air Quality Improvement Program (CMAQ) has provided funding to states, under a formula established in statute, to support transportation projects that reduce emissions of certain criteria pollutants.[2] The Infrastructure Investment and Jobs Act provided CMAQ approximately $13.2 billion for fiscal years 2022 through 2026.[3] CMAQ funds support projects in areas that do not currently, or did not previously, meet federal air quality standards for certain criteria pollutants—carbon monoxide, ozone, or particulate matter.[4] The Environmental Protection Agency (EPA) sets these standards pursuant to the Clean Air Act.[5] EPA defines geographic areas that do not meet federal air quality standards for criteria pollutants as “nonattainment areas” and areas that previously did not but now meet the standards as “maintenance areas.”
Within the Department of Transportation, the Federal Highway Administration (FHWA) oversees and assists states with administering CMAQ. FHWA has developed tools to help entities—primarily state departments of transportation (DOT) and metropolitan planning organizations (MPO)—implement CMAQ and select projects that will reduce emissions of pollutants.[6] For instance, FHWA developed a calculator toolkit that, according to FHWA, state DOTs and MPOs can use to estimate emissions reductions for the majority of CMAQ-eligible projects. Also, as required by statute, FHWA developed cost-effectiveness tables for state DOTs and MPOs to consider when selecting CMAQ projects that show the cost effectiveness of reducing emissions for a range of project types.[7] However, FHWA has not tracked data on the extent to which state DOTs and MPOs use these tools.
The Infrastructure Investment and Jobs Act includes a provision for GAO to review the CMAQ program.[8] This report examines (1) how states have used CMAQ funds since fiscal year 2015, (2) the emissions outcomes of CMAQ projects since fiscal year 2015 and how FHWA tracks CMAQ outcomes, (3) the cost effectiveness of CMAQ projects at reducing emissions since fiscal year 2015 according to available FHWA data and reports, and (4) the extent to which FHWA has communicated to state DOTs and MPOs about FHWA tools for evaluating emissions reductions and cost effectiveness of CMAQ projects.
To inform all objectives, we reviewed relevant statutes; examined Department of Transportation and FHWA guidance and other documentation for CMAQ; and interviewed FHWA and EPA officials. We also conducted semi-structured interviews with a non-generalizable selection of relevant state and local agencies—such as state DOTs and MPOs—in six states.[9] We selected states to represent a range of population, location, extent of attainment of federal air quality standards, and other factors. Across objectives, our scope was the 50 states and Washington, D.C. (referred to collectively as 51 states), as they were the direct recipients of CMAQ funding for the time frame examined for this report.
In addition, to inform all objectives, we analyzed data from FHWA’s CMAQ project database on projects that started in fiscal years 2015 through 2023, the latest year for which data were available at the time of our review. Because CMAQ funding can support projects over multiple years, we conducted our analysis at the project level. We used a project identification field to combine individual project data, including project costs and estimated reductions of emissions of CMAQ pollutants, over multiple years. As a result, we report on projects only in the first year in which they were funded and include any additional costs and estimated emissions reductions in future years in that first year.
We analyzed data to determine trends in the categories, costs, and estimated emissions reductions of projects over time.[10] To focus our analysis on the use of federal funds, we analyzed CMAQ funds used for projects and not funds from other sources. To determine the reliability of these data, we reviewed FHWA documentation on the database, interviewed FHWA officials, and manually reviewed the data for any obvious missing data, errors, or outliers. We determined that the data were sufficiently reliable for reporting on trends in the project categories funded with CMAQ and the costs and emissions reductions of those projects.
To inform our objective on how states have used CMAQ funds, we also analyzed financial data from FHWA’s Financial Management Information System regarding transfers between CMAQ and other federal-aid highway formula programs from fiscal years 2015 through 2024, the latest year for which data were available at the time of our review.[11] To determine the reliability of the financial data we reviewed FHWA documentation on the database, interviewed FHWA officials, and manually reviewed the data for any obvious missing data, errors, or outliers. We determined that the data were sufficiently reliable for reporting on transfers of funds among CMAQ and other federal-aid highway formula programs.
To inform our objective on the emissions outcomes of CMAQ projects and how FHWA tracks outcomes, we analyzed FHWA data on CMAQ performance measures for FHWA’s first performance period (October 2017 through December 2021). From this analysis, we determined whether state DOTs and MPOs met their targets for relevant performance measures. To determine the reliability of these data, we reviewed FHWA documentation on the data, interviewed FHWA officials, and manually reviewed the data for any obvious missing data, errors, or outliers. We determined that the data were sufficiently reliable for reporting on the extent to which state DOTs and MPOs have set and met CMAQ performance measures.
To inform our objective on the cost effectiveness of CMAQ projects at reducing emissions, according to available FHWA data and reports, we analyzed data from FHWA’s CMAQ project database on projects started from fiscal years 2015 through 2023, as described above, along with information on cost-effectiveness ratings in FHWA’s 2020 tables.[12] Specifically, we applied FHWA’s cost-effectiveness ratings for 21 project types from the 2020 tables to the funded projects listed in the CMAQ project database for those fiscal years.[13] The 2020 tables rate 21 types of CMAQ projects based on the median cost per ton of emissions reduction calculated from a range of scenarios for each project type; the tables rate cost effectiveness (1) across all pollutants and (2) for each specific pollutant.
We applied both ratings to projects. We applied the most relevant project type from the 2020 tables to each funded CMAQ project by reviewing the project category, title, and description. (For about 20 percent of the projects, we were unable to apply a project type.[14]) We then analyzed the data to describe the cost effectiveness of funded CMAQ projects in reducing emissions. We reviewed FHWA’s cost-effectiveness tables, including their methodology, and interviewed FHWA and Department of Transportation staff about the table’s methodology and limitations and our methodology for using the tables.
Finally, to inform our objective on how FHWA communicated to state DOTs and MPOs about FHWA tools on emissions reductions and cost effectiveness of CMAQ projects, between August and October 2024 we surveyed all state DOTs regarding their experiences with those tools. We received responses from 51 state DOTs. In addition, we reviewed FHWA communications on those tools and interviewed FHWA officials; then we evaluated FHWA’s actions against internal control standards on external communication.[15] For more information on our scope and methodology, see appendix I. We also present additional information on the CMAQ project categories and our survey of state DOTs in appendixes II and III, respectively.
We conducted this performance audit from February 2024 to June 2025 in accordance with generally accepted government auditing standards. Those standards require that we plan and perform the audit to obtain sufficient, appropriate evidence to provide a reasonable basis for our findings and conclusions based on our audit objectives. We believe that the evidence obtained provides a reasonable basis for our findings and conclusions based on our audit objectives.
Background
Federal-Aid Highway Funding and CMAQ
CMAQ is one of nine federal-aid highway formula funding programs through which FHWA provides funding to states.[16] States have the discretion to prioritize and select which eligible projects will receive federal-aid highway formula program funding. For fiscal year 2025, the Infrastructure Investment and Jobs Act provided about $55.7 billion for these nine programs, with CMAQ receiving approximately $2.7 billion.[17]
CMAQ provides funding to states to help meet the requirements of the Clean Air Act. Specifically, CMAQ funding is for transportation projects and programs that aim to reduce congestion and contribute to air quality improvements in areas that are in nonattainment or maintenance of federal air quality standards for ozone, carbon monoxide, or particulate matter.[18] CMAQ projects must contribute to the attainment or maintenance of at least one of the CMAQ-specified pollutants or its precursors, which we refer to as CMAQs pollutants. Those pollutants can come from a variety of transportation sources (see fig. 1).
Figure 1: Examples of Sources of Emissions of Pollutants Addressed by the Congestion Mitigation and Air Quality Improvement Program
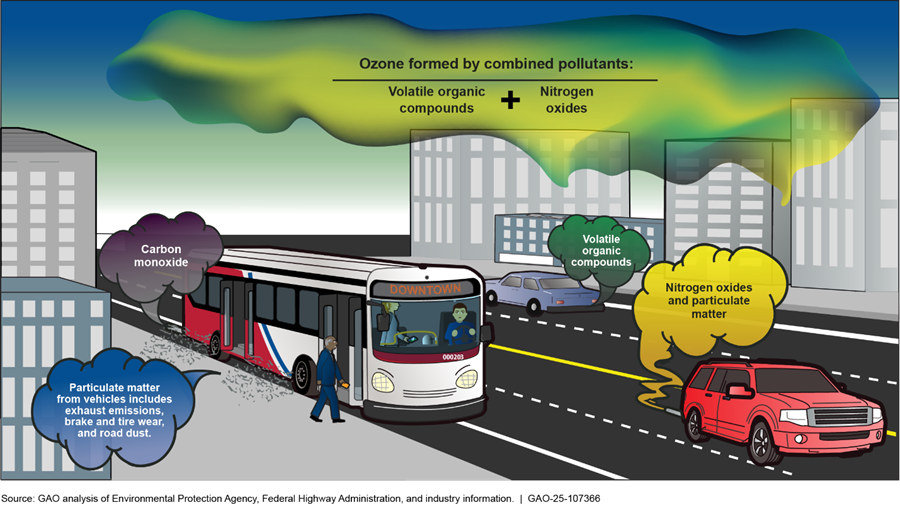
EPA sets federal air quality standards for criteria pollutants, such as those addressed by CMAQ, at levels intended to protect public health, including the health of susceptible and vulnerable populations—people with pre-existing respiratory disease, children, and older adults, among others.[19] According to EPA, in 2023, more than 126 million people lived in counties where ozone levels exceeded federal air quality standards—more than for any other CMAQ pollutants.[20]
Each state’s annual CMAQ funding, or apportionment, is based on a formula specified in statute.[21] All states receive a minimum apportionment, but states with nonattainment or maintenance areas for CMAQ pollutants generally received larger apportionments. In fiscal year 2025, states’ apportionments for CMAQ ranged from approximately $11 million to approximately $537 million.[22] States have 3 years after the last day of the fiscal year in which funds were made available to obligate CMAQ funds.
CMAQ Project Selection
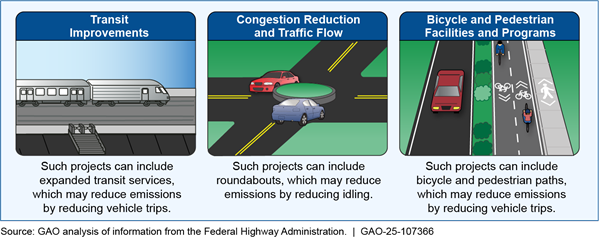
A project’s eligibility for CMAQ is set in statute.[23] According to 2024 FHWA guidance, project must meet three criteria to be eligible for CMAQ: (1) be a transportation project, (2) be located in or benefit a nonattainment or maintenance area, and (3) reduce emissions for CMAQ pollutants.[24] Many different projects are eligible for CMAQ (see fig. 2).
Figure 2: Examples of Projects that are Eligible for the Congestion Mitigation and Air Quality Improvement Program
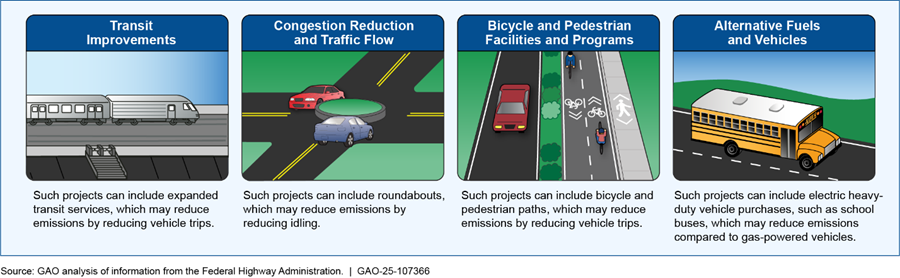
Note: Federal Highway Administration information is from publications including Federal Highway Administration, The Congestion Mitigation and Air Quality Improvement (CMAQ) Program Interim Program Guidance as Revised by the Infrastructure Investment and Jobs Act (Oct. 28, 2024) and Federal Highway Administration, Congestion Mitigation and Air Quality Improvement Program, 2020 Cost-Effectiveness Tables Update (Washington, D.C.: July 20, 2020).
A state DOT, on its own or in conjunction with MPOs, selects projects to fund with CMAQ dollars.[25] State DOTs and MPOs develop their own processes to evaluate and select CMAQ projects, but statute specifies some requirements related to CMAQ project selection, including the following:[26]
· Any state with a nonattainment or maintenance area for fine particulate matter (PM2.5), with some exceptions, is required to invest a portion of its CMAQ funds in projects to reduce PM2.5 emissions. Specifically, any such state must use 25 percent of its CMAQ apportionment, based on the weighted population of the PM2.5 nonattainment area in the state, for projects that reduce PM2.5 in these areas.[27]
· States must prioritize projects proven to reduce PM2.5, including diesel replacements or retrofits, when distributing CMAQ funds in PM2.5 nonattainment or maintenance areas.[28]
· States must consider cost effectiveness in mitigating congestion and improving air quality when selecting CMAQ projects.[29]
Although the goal of CMAQ is to fund transportation projects that reduce emissions of CMAQ pollutants, states have flexibilities to use some CMAQ funding for other purposes.
· Transfers. A state may transfer up to 50 percent of its CMAQ funds each fiscal year to other federal-aid highway formula programs. A state may also transfer funds from other federal-aid highway formula programs into CMAQ.[30] This ability to transfer funds helps states use funds to address their transportation priorities. Any CMAQ funds transferred to another program become subject to the requirements of that program.[31]
· Flexible CMAQ funds. Some states can use some or all of their CMAQ funds as CMAQ flexible funds for projects eligible for either CMAQ or the Surface Transportation Block Grant Program (STBG).[32] Examples of STBG projects include: (1) projects that preserve and improve the conditions and performance on federal-aid highways, (2) bridge and tunnel projects on any public road, (3) certain pedestrian and bicycle infrastructure, and (4) transit capital projects. States that do not have, and have never had, a nonattainment or maintenance area for ozone, carbon monoxide, or particulate matter can use all their CMAQ funds as flexible funds. Some other states can use some CMAQ funds as flexible funds, while others cannot use any CMAQ funds that way.[33]
When transferring funds to other programs or using funds on STBG-eligible projects, state DOTs can use CMAQ funds for projects that may not reduce emissions of CMAQ pollutants.
FHWA Oversight and Tools
FHWA headquarters and division offices share oversight responsibility for CMAQ.[34] FHWA headquarters issues guidance, develops resources, and offers training, among other responsibilities. For example, in 2024 FHWA issued interim CMAQ guidance that includes information on how states can use CMAQ funds, project eligibilities, and FHWA tools to help state DOTs and MPOs evaluate potential projects.[35] Division offices in each state and the District of Columbia provide CMAQ technical assistance to state DOTs and MPOs, including answering questions about project eligibility and reviewing funding proposals.[36]
State DOTs annually report data on their CMAQ projects to FHWA, and FHWA maintains these data in a publicly available CMAQ project database.[37] Data include project category, title and description, amount of CMAQ and non-CMAQ funding, and estimated emissions reductions.[38] FHWA headquarters and division office staff review reported data for completeness and accuracy.
States Used CMAQ Funds in Various Ways, Including for Projects to Improve Traffic Flow and Transfers to Other Programs
During fiscal years 2015 through 2023, we found states overall used a majority of their CMAQ apportionments to fund projects eligible for CMAQ that aim to improve air quality and reduce congestion—such as traffic flow improvements and bicycle and pedestrian projects. We also found that states are increasingly transferring CMAQ funds to other federal-aid highway formula programs and using their CMAQ funds as flexible funds for STBG-eligible projects that may not improve air quality.
CMAQ Mostly Funded Traffic Flow Improvement, Bicycle and Pedestrian, and Transit Projects
Most CMAQ projects that started in fiscal years 2015 through 2023, and most of the costs of those projects, were in three of 10 categories of CMAQ-eligible projects tracked by FHWA: congestion reduction and traffic flow improvements, transit improvements, and bicycle and pedestrian facilities and programs (see table 1).[39] Some of the project categories in FHWA’s CMAQ database, such as congestion reduction and traffic flow, are broad, encompassing a variety of different projects. Others, such as advanced diesel truck and engine technologies, are more limited.[40] See appendix II for more information on the CMAQ project database categories.
|
Project category |
Percentage of all CMAQ projects |
Percentage of all CMAQ project costs |
|
Advanced diesel truck/engine technologies |
1.7 |
1.0 |
|
Alternative fuels and vehicles |
3.3 |
2.7 |
|
Bicycle and pedestrian facilities and programs |
23.5 |
13.5 |
|
Congestion reduction and traffic flow improvements |
39.8 |
38.9 |
|
Freight/intermodal |
0.5 |
0.5 |
|
Inspection/maintenance programs |
1.0 |
1.0 |
|
Other |
5.0 |
1.9 |
|
Ride sharing |
4.3 |
1.6 |
|
Transit improvements |
14.8 |
33.9 |
|
Travel demand management |
6.1 |
5.5 |
Source: GAO analysis of Federal Highway Administration Congestion Mitigation and Air Quality Improvement Program (CMAQ) project data. | GAO‑25‑107366
Notes:
States have up to 3 years after the end of the fiscal year in which funds are apportioned to obligate the funds. For our analysis, we count projects only in the first fiscal year in which the projects were funded. Any costs in subsequent fiscal years for the same project are included in that first fiscal year. Our analysis does not include project costs from other sources.
States are allowed, under statute, to transfer up to 50 percent of their CMAQ funds to other federal-aid highway formula programs. Some states are also able to use some or all of their CMAQ funds on projects eligible for the Surface Transportation Block Grant Program. These numbers represent the share of CMAQ projects and CMAQ funds after accounting for those transfers and Surface Transportation Block Grant-eligible projects.
|
Congestion Mitigation and Air Quality Improvement Program (CMAQ) Project Eligibility We asked state departments of transportation (DOTs) and metropolitan planning organizations (MPOs) we interviewed about projects or project expenses currently ineligible for CMAQ that could help reduce emissions of CMAQ pollutants. Those we interviewed did not offer consistent suggestions on potential projects or project expenses. Officials from three state DOTs and eight MPOs we interviewed provided examples, such as funding operating costs of new transit services beyond the initial period that the statute allows. In addition, officials with one state DOT and one MPO explained that the demand for CMAQ funding is great, and they have several projects that fall under existing CMAQ eligibilities awaiting such funding. Therefore, that state DOT and MPO do not have a need to identify other projects that could reduce emissions. Source: GAO interviews with state DOTs and MPOs. | GAO‑25‑107366 |
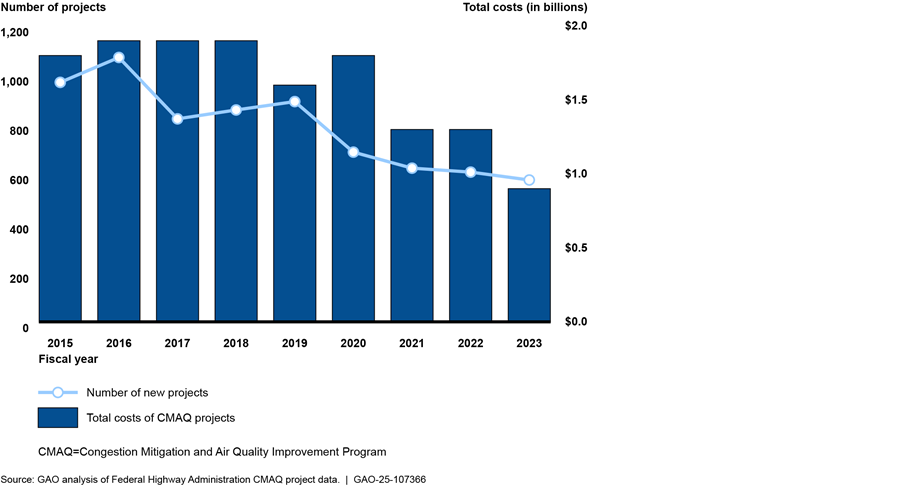
The total number of CMAQ projects started in fiscal years 2015 through 2023, and the total CMAQ costs of those projects, decreased over time (see fig. 3).[41]
Notes:
States have up to 3 years after the end of the fiscal year in which funds are apportioned to obligate the funds. For our analysis, we count projects only in the first fiscal year in which the projects were funded. Any costs in subsequent fiscal years for the same project are included in that first fiscal year. Therefore, the total costs of CMAQ projects started in fiscal years 2022 and 2023 could increase in the future if states obligate CMAQ funds apportioned in later years for projects started in fiscal year 2022 or 2023. In addition, our analysis includes project costs only supported by CMAQ and not project costs from other sources.
States are allowed, under statute, to transfer up to 50 percent of their CMAQ funds to other federal-aid highway formula programs. Some states are also able to use some or all of their CMAQ funds on projects eligible for the Surface Transportation Block Grant Program. These numbers represent the share of CMAQ projects and CMAQ funds after accounting for those transfers and Surface Transportation Block Grant-eligible projects.
The reduction in the number of projects funded every year could be due to a few factors. Officials with one MPO and one state DOT we interviewed said CMAQ projects have become more expensive in recent years. This could have reduced the number of projects that state DOTs and MPOs are able to fund in a single year. In addition, transfers to other programs and use of CMAQ flexible funds for STBG-eligible projects increased over time, as described below, affecting the total funding remaining for CMAQ-eligible projects.
States Increasingly Transferred Funds to Other Federal-Aid Highway Formula Programs
Transfers out of CMAQ to other federal-aid highway formula programs increased from 10 percent of apportionments in fiscal year 2015 to 19 percent in fiscal year 2024, based on our analysis of FHWA financial data.[42] Across years, transfers represented about 13 percent of total CMAQ apportionments. While states can transfer funds from other programs into CMAQ, states primarily transferred funds out of CMAQ. As a result, while apportionments to CMAQ increased over time, funds available for CMAQ projects after transfers remained relatively flat (see fig. 4). For example, while CMAQ apportionments in fiscal year 2024 were $2.6 billion, CMAQ funds after transfers were $2.1 billion.
Figure 4: Total Apportionments to CMAQ and Funds Remaining After Transfers to Other Federal-Aid Highway Formula Programs, Fiscal Years 2015–2024
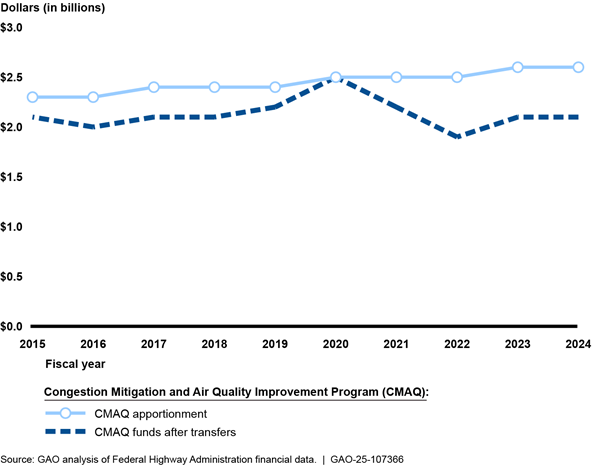
Note: Because states have up to 3 years after the end of the fiscal year in which funds are apportioned to obligate or transfer funds, transfers in one year may be of funds apportioned in other years. We based our analysis on the year of the apportionment of funds, regardless of when the funds were transferred.
Once transferred out of CMAQ, funds may be used to support a broader range of goals. For example, a state could transfer funds from CMAQ—a program that aims to improve air quality—to the Highway Safety Improvement Program—a program that aims to reduce fatalities and serious injuries on public roads. The Highway Safety Improvement Program has funded projects such as work zone safety messages and outreach programs on highway safety matters. According to FHWA, transferring funds between programs could help a state use its federal-aid highway formula funds on projects that better align with its specific needs.
During fiscal years 2015 through 2024, 40 states plus Washington, D.C. transferred funds between CMAQ and other federal-aid highway formula programs such as the Highway Safety Improvement Program and the National Highway Performance Program. Their net transfers out of CMAQ varied. For example, 29 states transferred up to 20 percent of their apportioned CMAQ funds and four states transferred over 40 percent (see fig. 5).[43]
Figure 5: Number of States by Share of Net Transfers from CMAQ to Other Federal-Aid Highway Formula Programs, Fiscal Years 2015–2024
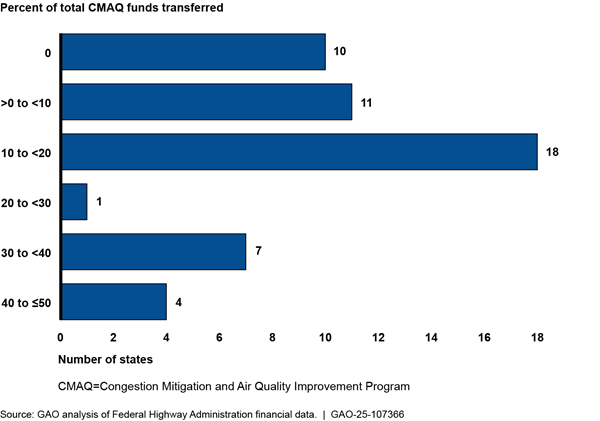
Note: Our scope includes 50 states plus Washington, D.C. Because states have up to 3 years after the end of the fiscal year in which funds are apportioned to obligate the funds, including transferring funds between programs, transfers in one year may be of funds apportioned in other years. As a result, for example, funds apportioned in fiscal year 2024 may be transferred in the future. Our analysis is based on the fiscal year for which the funds were apportioned, regardless of whether those funds were transferred.
States may transfer CMAQ funds to other federal-aid highway formula programs to use funds more easily. For example, a state may transfer funds to the National Highway Freight Program if it had greater funding needs for freight projects in a given year. According to a 2022 study, transfers among all federal-aid highway formula programs have generally increased over time, and states tend to transfer funds from programs with more restrictions on the use of funds to programs with fewer restrictions.[44] The report noted that states may be less likely to transfer funds into CMAQ, since CMAQ projects can be complex and challenging to implement. Officials with two state DOTs told us they transfer CMAQ funds to other programs where funds can be spent more quickly. One of those state DOTs added that they transfer CMAQ funds to programs that have fewer restrictions on the use of funds. On the other hand, officials with two other state DOTs said their states have enough projects to fund with CMAQ and, therefore, do not transfer any of their CMAQ funding.
States, to Varying Extents, Used CMAQ Flexible Funds for a Broad Range of Transportation Projects
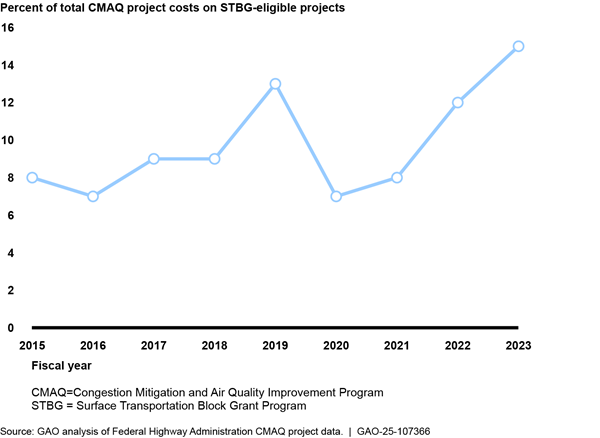
Within CMAQ, states also increased their use of flexible CMAQ funds. A state with flexible CMAQ funds can use those funds throughout the state for projects eligible for either CMAQ or STBG, without having to transfer the funds out of CMAQ. We found the percentage of total CMAQ project costs used on STBG-eligible projects increased from 8 percent of the total costs of projects started in fiscal year 2015 to 15 percent in fiscal year 2023 (see fig. 6).[45] Overall, across all states, 10 percent of the costs of CMAQ projects started from fiscal years 2015 through 2023 were for STBG-eligible projects. On average, this was approximately $171 million per year.
Figure 6: Percentage of CMAQ Funds Spent on Projects Eligible for the Surface Transportation Block Grant Program, Fiscal Years 2015–2023
Notes:
States have up to 3 years after the end of the fiscal year in which funds are apportioned to obligate the funds. Our analysis considers projects in the first year that they were funded and any project costs in subsequent years are included in that first year. Our analysis does not include project costs from other sources.
States are allowed, under statute, to transfer up to 50 percent of their CMAQ funds to other federal-aid highway formula programs. This analysis considers the percentage of CMAQ funds after accounting for transfers between CMAQ and other federal-aid highway formula programs.
The percentage of CMAQ funds that states can use for STBG-eligible projects varies. Based on our analysis of FHWA’s CMAQ apportionment data for fiscal year 2024, 17 states were able to use all their CMAQ funds as flexible funds. In addition, 13 states were able to use some but not the full amount of their CMAQ funds as flexible funds and 21 states could not use any of their CMAQ funds in this way.
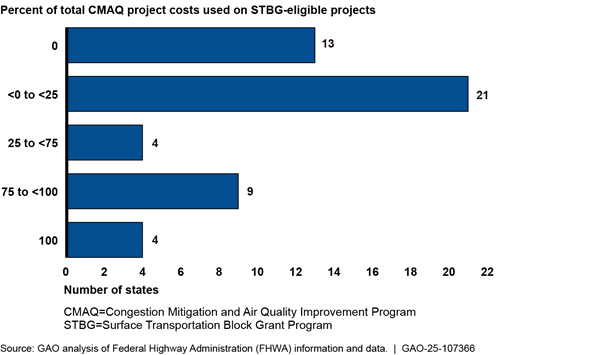
However, states varied in the extent to which they used their CMAQ funds as flexible funds for STBG-eligible projects. In total, 38 of 51 states used CMAQ funds on STBG-eligible projects started in at least 1 fiscal year from 2015 through 2023. In 21 of those 38 states, less than 25 percent of the total costs of CMAQ projects, after transfers, were on STBG-eligible projects. Four states exclusively funded STBG-eligible projects with CMAQ (see fig. 7). One state DOT we interviewed, for example, is allowed to use all its CMAQ funds for STBG-eligible projects and has done so to fund a range of projects to help maintain the state’s roadway system. On the other hand, another state DOT we interviewed has used less than 1 percent of its flexible CMAQ funds for STBG-eligible projects because there were enough demands in its state for CMAQ-eligible projects.
Figure 7: Number of States by Percentage of CMAQ Funds Used on Projects Eligible for the Surface Transportation Block Grant Program, Fiscal Years 2015–2023
Notes:
Our scope includes 50 states plus Washington, D.C. States have up to 3 years after the end of the fiscal year in which funds are apportioned to obligate the funds. Our analysis considers projects in the first year that they were funded and any project costs in subsequent years are included in that first year. Our analysis does not include project costs from other sources.
States are allowed, under statute, to transfer up to 50 percent of their CMAQ funds to other federal-aid highway formula programs. This analysis considers the percentage of CMAQ funds after accounting for transfers between CMAQ and other federal-aid highway formula programs.
CMAQ Projects Most Often Reduced Pollutants Related to Ozone, and FHWA Has Started to Track CMAQ Performance Measures
CMAQ Data Show Most Projects Since Fiscal Year 2015 Reduced Ozone-Related Pollutants
Pollutants Addressed by CMAQ Projects
The share of projects reporting emissions reductions increased for each pollutant from fiscal years 2015 through 2023, based on our analysis of CMAQ data of projects that begin in these fiscal years.[46] Overall, the greatest share of projects reported estimated emissions reductions for two ozone precursors—nitrogen oxides and volatile organic compounds (see fig. 8).[47] This is consistent with EPA data showing that more people lived in areas where ozone levels exceeded federal air quality standards compared to such areas for other CMAQ pollutants in 2023.[48] The smallest share of CMAQ projects reported estimated emissions reductions of PM10.[49]
Figure 8: Percentage of CMAQ Projects Reporting Estimated Emissions Reductions, by Pollutant, Fiscal Years 2015–2023
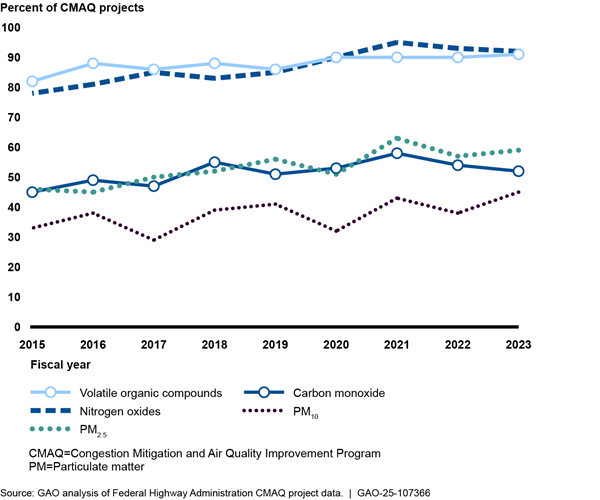
Note: States have up to 3 years after the end of the fiscal year in which funds are apportioned to obligate the funds. Our analysis considers projects in the first year that they were funded. Some states are also able to use some or all of their CMAQ funds on projects eligible for the Surface Transportation Block Grant Program. This analysis considers the percentage of CMAQ projects after excluding projects eligible for the Surface Transportation Block Grant Program.
Estimated Emissions Reductions of Pollutants
Based on our analysis, the yearly estimated emissions reductions for most pollutants generally decreased between fiscal years 2015 and 2023, although the estimated reductions varied substantially year-to-year for most pollutants (see fig. 9).[50]
Figure 9: Estimated Total Reduced Emissions from CMAQ Projects, by Pollutant, Fiscal Years 2015–2023
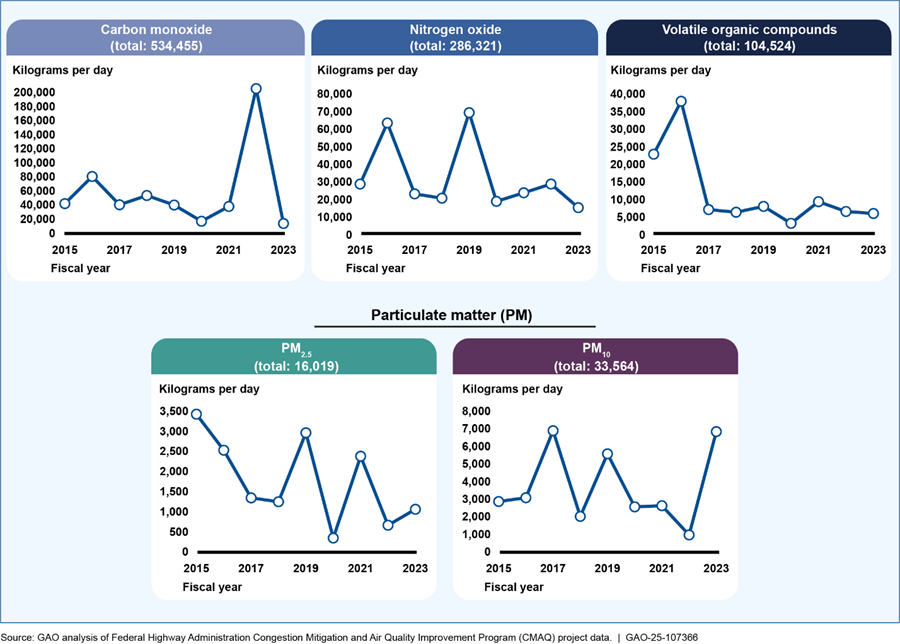
Note: States have up to 3 years after the end of the fiscal year in which funds are apportioned to obligate the funds. Our analysis considers projects in the first year that they were funded. Some states are also able to use some or all of their CMAQ funds on projects eligible for the Surface Transportation Block Grant Program. This analysis considers the percentage of CMAQ projects after excluding projects eligible for the Surface Transportation Block Grant Program.
Downward trends in emissions reductions may be explained by a number of factors. Over time, as state DOTs and MPOs fund more projects with CMAQ, they may have fewer available projects that provide high emissions reductions. One MPO we interviewed said that some of the projects that are the most cost effective at reducing emissions have already been done, so the “low hanging fruit” to reduce emissions is no longer available. As a result, they may have funded projects in more recent years that have lower emissions reductions. In addition, as passenger vehicles have become more fuel efficient and cleaner over the last 2 decades, projects that reduce vehicle miles traveled may result in lower emissions reductions over time. In addition, as shown in figure 3 above, the total number of CMAQ projects has decreased over time. According to FHWA officials, the number of projects in each category has also changed over time. As a result, if some state DOTs and MPOs have shifted to funding project categories whose projects generally have lower emissions reductions, then emissions reductions may decrease.
Emissions Reductions in Disadvantaged Communities
The Department of Transportation found that 34 percent of CMAQ funds benefited disadvantaged communities in fiscal year 2023, and 36 percent did so in fiscal year 2022.[51] Some states must prioritize CMAQ projects that reduce emissions of PM2.5 in disadvantaged areas.[52] However, one state DOT and five MPOs we interviewed consider location in disadvantaged communities as part of their project selection process.[53] For example, officials with one MPO told us they score projects on a points system that provides additional points to projects in disadvantaged communities as part of the process for evaluating CMAQ projects. In addition, this MPO identifies disadvantaged communities as areas where at least 20 percent of the population is low-income or at least half of the population are individuals who identify as part of racial or ethnic minority groups.
FHWA Established CMAQ Performance Measures for Emissions Reductions and Traffic Congestion
Since fiscal year 2018, FHWA has tracked three performance measures for the CMAQ program—one for emissions of CMAQ pollutants and two for traffic congestion.[54] Certain state DOTs and MPOs are required to establish targets and report performance to FHWA on these performance measures based in part on their state’s or area’s attainment of federal air quality standards.[55]
|
Congestion Mitigation and Air Quality Improvement Program (CMAQ) Performance Measures · On-Road Mobile Source Emissions: A measure of reductions in estimated emissions of each criteria pollutant and precursors under the CMAQ program for projects in areas that are not currently, or previously were not, in compliance with federal air quality standards. This includes emissions for carbon monoxide, nitrogen oxides, particulate matter (PM2.5 and PM10), and volatile organic compounds. · Percent of Non-Single Occupancy Vehicle Travel: A measure of the share of travelers using modes of transportation other than driving by themselves in their cars. · Annual Hours of Peak Hour Excessive Delay Per Capita: A measure of traffic congestion during peak hours that accounts for the longest travel time compared to the average travel time, the number of vehicles on the road, and number of vehicle occupants. Source: Federal Highway Administration, Transportation Performance Management: CMAQ Performance Measures (Washington, D.C., 2019). | GAO‑25‑107366 |
The state DOTs and MPOs that are subject to the performance measures set targets for 2 years and 4 years, and then report performance at these points, for a 4-year reporting period. The first reporting period ended in 2021; the second reporting period is underway and will end in 2025.[56]
For the first reporting period, the majority of states that were required to set targets met their targets for the on-road mobile source emissions measure for all pollutants (see table 2). For the traffic congestion measures in the first performance period, most areas met their targets for the percent of non-single occupancy vehicle travel, while nearly all met their targets for annual hours of peak hour excessive delay per capita.[57]
Table 2: Performance Outcomes for On-Road Mobile Source Emissions Measure, October 1, 2017–September 30, 2021
|
|
Carbon monoxide |
Nitrogen oxides |
Particulate matter (PM)2.5 |
PM10 |
Volatile organic compounds |
|
State departments of transportation (DOT) required to set targets and report performance |
18 |
36 |
19 |
19 |
27 |
|
State DOTs that met 2-year target |
11 (61%) |
22 (61%) |
12 (63%) |
11 (58%) |
18 (67%) |
|
State DOTs that met 4-year target |
14 (78%) |
25 (69%) |
15 (79%) |
13 (68%) |
19 (70%) |
Source: GAO analysis of Federal Highway Administration data. | GAO‑25‑107366
Note: Statute required the Department of Transportation to establish performance measures for on-road mobile source emissions (23 U.S.C. § 150(c)(5)). The Department of Transportation established performance measures for some state DOTs and MPOs in regulation (23 C.F.R. Part 490). Specifically, state DOTs and MPOs with CMAQ-funded projects in nonattainment or maintenance areas for ozone, carbon monoxide, or particulate matter must establish performance requirements for emissions for each applicable CMAQ pollutant within the boundaries of that area.
In responding to our survey, the largest number of state DOTs that answered questions on the performance measures said that each of the measures were somewhat useful (see table 3).
|
|
Annual hours of peak hour excessive delay per capita |
Percent of non-single occupancy vehicle travel |
On-road mobile |
|
Very useful |
6 |
6 |
7 |
|
Moderately useful |
6 |
4 |
8 |
|
Somewhat useful |
13 |
15 |
14 |
|
Not at all useful |
6 |
6 |
6 |
|
Total |
31 |
31 |
35 |
CMAQ = Congestion Mitigation and Air Quality Improvement Program
State DOT = state department of transportation
Source: GAO survey of state DOTs. | GAO‑25‑107366
Note: We asked state DOTs about usefulness of the three performance measures only if they responded that they must set a target and report on the measures.
MPOs we interviewed provided some insights into why they believed the performance measures were, or were not, useful. Officials with one MPO stated that the measures can help MPOs better identify projects, assess results, and justify investments to the public. However, officials with two MPOs said that the congestion measures focus on regional or highway traffic, while their CMAQ projects address congestion in a more local area. In addition, officials with two other MPOs stated that their performance on the three measures is not necessarily correlated with the outcomes of projects funded by CMAQ.
As of January 2025, FHWA was taking steps to improve technical assistance for state DOTs and MPOs on the performance measures. For example, FHWA was identifying potential inconsistencies in reporting performance data during the first performance period to better target training materials. In addition, FHWA was reviewing MPO reporting to facilitate the exchange of notable practices in setting targets.
Most CMAQ Projects Since 2015 Were in Project Types FHWA Rated as Having Weak Cost Effectiveness for Reducing Emissions
FHWA Created Cost-Effectiveness Ratings for Reducing Emissions for Several Types of CMAQ Projects
FHWA developed a set of cost-effectiveness tables that rate the cost effectiveness (i.e., dollars per ton of emissions reduced) for several types of eligible CMAQ projects. FHWA published these tables as a resource for state DOTs and MPOs to assess the cost effectiveness of projects at reducing emissions of CMAQ pollutants. FHWA first published these tables in 2015, then updated them in 2020.[58]
According to FHWA’s CMAQ guidance, prioritizing CMAQ projects that are cost effective in reducing emissions may better position state DOTs and MPOs to reach attainment or maintenance of federal air quality standards. In addition, statute requires state DOTs and MPOs to consider the cost-effectiveness information in these tables when selecting projects for CMAQ funding.[59] The statute is not specific as to how state DOTs and MPOs should consider that information.
Overall FHWA Cost-Effectiveness Ratings
|
Federal Highway Administration’s (FHWA) Cost-Effectiveness Analysis FHWA determined a median cost-effectiveness estimate for 21 project types based on projects in FHWA’s CMAQ project database. To develop the 21 project types, FHWA examined projects in the CMAQ project database and worked with experts in FHWA and the Environmental Protection Agency (EPA). The 21 project types do not cover all projects eligible for CMAQ. For project costs, FHWA used data from the CMAQ project database, supplemented with data from outside sources such as publications from state and local governments and professional organizations. Project costs in FHWA’s analysis include all project costs, not just those supported by CMAQ. FHWA modeled emissions reductions using EPA’s MOtor Vehicle Emissions Simulator (MOVES). FHWA also factored in other assumptions, such as project lifetimes. FHWA calculated the cost effectiveness for a range of scenarios for each project type and then reported on the median cost effectiveness. Source: Federal Highway Administration, Congestion Mitigation and Air Quality Improvement (CMAQ) Program: 2020 Cost-Effectiveness Tables Update (Washington, D.C., July 20, 2020). | GAO‑25‑107366 |
FHWA’s 2020 CMAQ tables calculated a median cost effectiveness (in terms of the cost per ton of estimated emissions reduced across all CMAQ pollutants) for 21 types of eligible CMAQ projects. To evaluate cost effectiveness, FHWA estimated the cost per ton of emissions reduction for each pollutant in a range of scenarios for each project type, determined the median value of that range, and then determined the median across all pollutants. However, FHWA acknowledges that projects are typically selected based on their effectiveness at reducing specific pollutants, rather than across all pollutants.[60] While those 21 project types include a wide range of eligible projects, they do not include all projects that are CMAQ-eligible.[61]
The tables rate the cost effectiveness in reducing emissions of the 21 project types with the seven most cost effective rated as “strong,” the next seven as “mixed,” and the seven least cost effective as “weak” (see table 4).[62] Some of these 21 project types may have more potential projects for state DOTs and MPOs to fund than others. For example, while traffic signal synchronization projects have wide potential use, extreme temperature cold start technologies have application only in cold climate locations.
Table 4: Rating of Cost Effectiveness in Reducing Emissions by CMAQ Project Type, Federal Highway Administration 2020 Cost-Effectiveness Tables
|
Strong |
Mixed |
Weak |
|
Dust mitigation |
Traffic signal synchronization |
Extreme temperature cold-start technologies |
|
Idle reduction strategies |
Park and ride |
Bikesharing |
|
Diesel engine retrofit technologies |
Natural gas re-fueling infrastructure |
Bicycle and pedestrian improvements |
|
Intermodal freight facilities and programs |
Electric vehicle charging stations |
Intersection improvements |
|
Carsharing |
Transit amenity improvements |
Subsidized transit fares |
|
Incident management |
Rideshare programs |
Employee transit benefits |
|
Transit service expansion |
Roundabouts |
Heavy-duty vehicle replacements |
CMAQ = Congestion Mitigation and Air Quality Improvement Program
Source: Federal Highway Administration information. | GAO‑25‑107366
Notes:
Information from Federal Highway Administration, Congestion Mitigation and Air Quality Improvement (CMAQ) Program: 2020 Cost-Effectiveness Tables Update (Washington, D.C., July 20, 2020).
The 2020 tables classify project types with strong cost effectiveness as those that cost less than $2.8 million per ton of emissions reduced across all CMAQ pollutants, mixed cost effectiveness as those that cost between $2.8 and $8.8 million per ton of emissions reduced across all CMAQ pollutants, and weak as those costing $8.8 million or more per ton across all CMAQ pollutants.
According to the 2020 tables, cost effectiveness, in terms of dollars per ton of emissions reduced, tends to be stronger for projects that reduce the number of vehicles on the road to reduce emissions. Carsharing projects, for example, encourage shifts from individual to shared vehicle travel, thus reducing single occupancy vehicle trips and their emissions. Intersection improvement projects, on the other hand, may reduce congestion and idling at intersections but do not remove vehicles from the road, and the tables rate those projects as having weak cost effectiveness. In addition, according to the tables, when projects have high costs, those high costs can result in weaker overall cost effectiveness. For example, while bicycle and pedestrian infrastructure projects may remove vehicles from the road, their large overall costs relative to their estimated emission reductions may result in weak cost effectiveness.
FHWA Cost-Effectiveness Ratings by Pollutant
The 2020 tables also rate each project type for how cost effective it is at reducing emissions of each CMAQ pollutant on a letter scale based on the median cost per ton of emissions reduction (see fig. 10).
Figure 10: Ratings for Cost Effectiveness in Reducing Emissions for CMAQ Project Types, by Pollutant
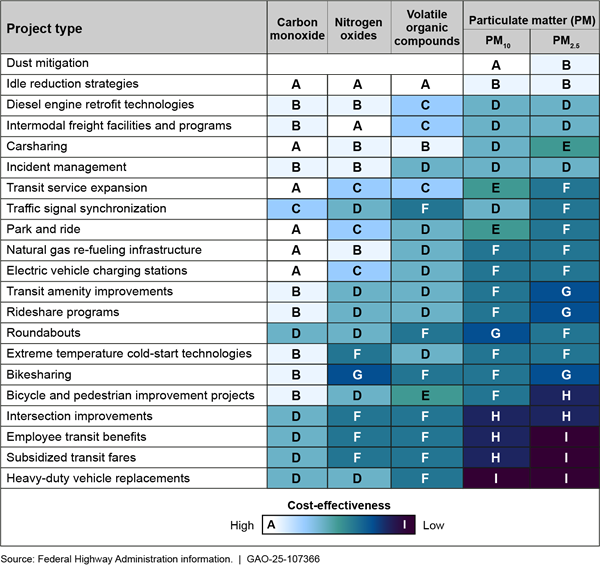
CMAQ = Congestion Mitigation and Air Quality Improvement Program
Notes:
Information from Federal Highway Administration, Congestion Mitigation and Air Quality Improvement (CMAQ) Program: 2020 Cost-Effectiveness Tables Update (Washington, D.C., July 20, 2020).
The tables applied a rating of A (highest) through I (lowest) for cost effectiveness based on the median estimated cost per ton of emissions reduction for each project type for each pollutant. Project types with a lower median cost per ton of emissions reduction have a higher cost-effectiveness rating. Blank cells for dust mitigation indicate that those pollutants do not apply to that specific project type.
About 80 Percent of CMAQ Projects Funded Since 2015 Were of a Project Type with Mixed or Weak Cost Effectiveness in Reducing Emissions
Overall Cost Effectiveness in Reducing Emissions
Our analysis found that most CMAQ projects started in fiscal years 2015 through 2023, and most of the costs of those projects, were in project types that FHWA rated as having mixed or weak cost effectiveness at reducing emissions.[63] Specifically, 88 percent of CMAQ projects and 82 percent of the total costs of those projects were in project types with mixed or weak cost effectiveness (see fig. 11). For this analysis, we were able to apply the 2020 tables’ cost-effectiveness ratings by project type to about 80 percent of projects in the CMAQ project database, after excluding STBG-eligible projects, for fiscal years 2015 through 2023.[64] This analysis applies a rating across all pollutants, but as noted above, CMAQ projects are often selected based on their effectiveness in reducing only certain pollutants.
Figure 11: Percentage of CMAQ Projects and Funding by Rating of Cost Effectiveness in Reducing Emissions, Fiscal Years 2015–2023
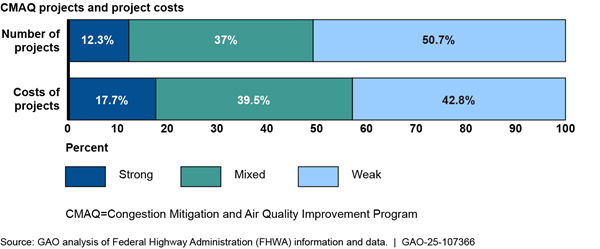
Notes:
Information from Federal Highway Administration, Congestion Mitigation and Air Quality Improvement (CMAQ) Program: 2020 Cost-Effectiveness Tables Update (Washington, D.C., July 2020) and data from FHWA CMAQ project data.
States have up to 3 years after the end of the fiscal year in which funds are apportioned to obligate the funds. Our analysis considers projects in the first year that they were funded, and any project costs in subsequent years are included in that first year. In addition, our analysis does not include project costs from other sources. This analysis considers the percentage of CMAQ funds after accounting for transfers between CMAQ and other federal-aid highway formula programs and CMAQ funds spent on projects eligible for the Surface Transportation Block Grant Program.
The 2020 tables classify project types with strong cost effectiveness as those that cost less than $2.8 million per ton of emissions reduced across all CMAQ pollutants, mixed cost effectiveness as those that cost $2.8 million to $8.8 million per ton of emissions reduced across all CMAQ pollutants, and weak as those costing $8.8 million or more per ton across all CMAQ pollutants.
Cost Effectiveness in Reducing Emissions by Pollutant
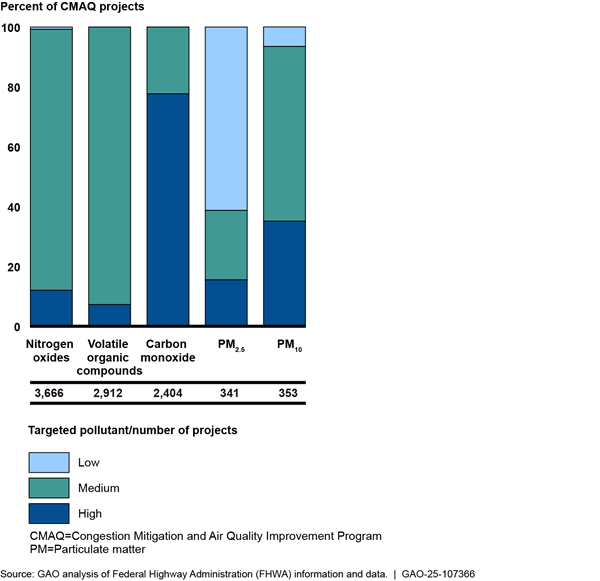
In applying the FHWA cost-effectiveness ratings to CMAQ projects by pollutant targeted, we found the greatest number of projects targeted nitrogen oxides and were mostly project types with medium cost-effectiveness ratings (see fig. 12).[65] Several projects targeted carbon monoxide and these projects generally were of a project type that had high cost-effective ratings. Few projects targeted PM2.5 emissions, and those projects generally had low and medium cost-effective ratings. We found similar trends when analyzing the costs of CMAQ projects by pollutant. However, some pollutants have more options for project types that are high for cost effectiveness in reducing emissions than others, as shown in figure 10 above. For example, for carbon monoxide, 15 of 21 project types are rated high, whereas for volatile organic compounds, only five of 21 are rated high.
Figure 12: Percentage of CMAQ Projects, by Targeted Pollutant and Rating of Cost Effectiveness in Reducing Emissions, Fiscal Years 2015–2023
Notes:
Information from Federal Highway Administration, Congestion Mitigation and Air Quality Improvement (CMAQ) Program: 2020 Cost-Effectiveness Tables Update (Washington, D.C., July 2020) and data from FHWA CMAQ project data.
States have up to 3 years after the end of the fiscal year in which funds are apportioned to obligate the funds. Our analysis considers projects in the first year that they were funded. This analysis considers CMAQ projects after accounting for transfers between CMAQ and other federal-aid highway formula programs and CMAQ funds spent on projects eligible for the Surface Transportation Block Grant Program.
FHWA’s 2020 cost-effectiveness tables assigned a letter grade from A to I for each project type and each pollutant based on the median cost per ton of emissions reduction. For our analysis, we consider letters A through C to indicate high cost effectiveness, letters D through E to indicate medium cost effectiveness, and letters G through I to indicate low cost effectiveness.
The numbers represent the number of projects that targeted each pollutant.
Several Factors Affect Which Projects Are Funded and the Projects’ Cost Effectiveness in Reducing Emissions
A variety of factors can influence what CMAQ project types state DOTs and MPOs fund and the cost effectiveness of those projects at reducing emissions.
Targeted CMAQ Pollutants
The cost effectiveness of CMAQ projects at reducing emissions, overall, may be influenced by which CMAQ pollutants state DOTs and MPOs address based on their attainment of federal air quality standards. As discussed earlier, for some CMAQ pollutants there are few project types that are high in cost effectiveness for reducing emissions. For example, if a state or MPO had areas in nonattainment for PM2.5 and, therefore, selected projects to reduce those emissions, it had limited options for project types that the 2020 tables rate as more cost effective. Conversely, a state or MPO with areas in nonattainment for ozone or carbon monoxide would have more options for project types that the 2020 tables rated as having higher cost-effectiveness. For carbon monoxide areas, where, according to EPA, the fewest number of people live in nonattainment areas amongst CMAQ pollutants, most of the project types have high cost-effective ratings.[66]
Additional Factors in Project Selection
State DOTs and MPOs have broad discretion in selecting projects and may consider and use factors in addition to cost effectiveness in reducing emissions. For example, FHWA’s 2024 CMAQ interim guidance suggests they may also consider safety and identify opportunities for investments to advance job creation.[67] All state DOTs and MPOs we interviewed that select CMAQ projects consider additional factors when evaluating and selecting CMAQ projects. For example, one MPO considers how each potential project would connect with the region’s transportation network. As discussed above, several state DOTs and MPOs consider location in disadvantaged communities when selecting projects. Project location may factor in selection in other ways as well. EPA officials told us that there may be other considerations besides cost effectiveness when selecting projects. For example, there may be specific projects that are relevant for reducing emissions to improve air quality in an area affected by a port.
Two state DOTs and eight MPOs told us they consider regional priorities when selecting CMAQ projects. Those priorities may affect the types of projects they focus on and, thus, the FHWA rating for cost effectiveness in reducing emissions of the CMAQ project types they fund.[68] For example, one MPO told us it uses CMAQ primarily to support bicycle and pedestrian and transit projects to align with regional goals to reduce vehicle miles traveled and support other transportation modes. Another MPO mostly funds intersection improvement projects to help address congestion, which is a key concern in its fast-growing area. Even though intersection improvement projects have weak cost effectiveness according to the 2020 tables, that MPO finds that such projects are the most cost effective at reducing emissions among the potential projects it considers. Another MPO told us that, to help support its regional mobility goals, it funds many bikeshare projects with CMAQ—a project type that rates weak in cost effectiveness in the 2020 tables.
How Cost Effectiveness is Considered in Project Selection
State DOTs and MPOs we interviewed use different methods to consider cost effectiveness in reducing emissions in their CMAQ project evaluation and selection processes. For example, one state DOT we interviewed conducts its own calculation of the estimated cost effectiveness for potential projects in reducing emissions; it uses that calculation as the primary of three key criteria used to evaluate potential projects. One MPO we interviewed said that cost effectiveness is calculated and considered when ranking potential CMAQ projects amongst themselves. In contrast, two MPOs said they calculate cost effectiveness but that that calculation is not a major factor in selecting projects.[69]
Project-Specific Conditions
Individual projects within any CMAQ project type can vary widely in their cost effectiveness in reducing emissions based on project specifics, such as location and scope. By contrast, the 2020 cost-effectiveness tables used median cost effectiveness estimates across a range of project conditions to determine the ratings. According to EPA officials, for example, the cost effectiveness of a new transit project could vary based on the transit network already in place and existing ridership levels. Similarly, one MPO told us a bicycle project in an urban area is likely to have more use and therefore be more cost effective than one located in a suburban area—even though the tables rate that project type as having low cost effectiveness, regardless of its location. In addition, one MPO we interviewed said it now focuses CMAQ funding for traffic signal projects in areas with high levels of heavy-duty vehicle traffic. This is because projects in such locations have a greater effect on emissions (and therefore, higher cost effectiveness in reducing emissions) than in other areas where such projects may be less cost effective given improvements in passenger vehicle emissions over time.
FHWA Consistently Communicated About its Emissions Calculator Toolkit But Not its Cost-Effectiveness Tables
FHWA Has Provided Ongoing Communication on the Emissions Calculator Toolkit
FHWA has communicated on an ongoing basis on the emissions calculator toolkit that it first released in 2016 to assist state DOTs and MPOs with estimating emissions reductions for projects. The calculator toolkit contains 18 calculators to estimate emissions reductions for certain eligible CMAQ projects. State DOTs and MPOs are not required to use FHWA’s calculator toolkit, and state DOTs and MPOs may use other methods to estimate emissions reductions. FHWA has communicated with state DOTs and MPOs on an ongoing and proactive basis about the toolkit through several formal methods.
· Bimonthly newsletter. FHWA produces bimonthly air quality newsletters that have often provided information on updates to the calculator toolkit.[70] About 80 percent (23 out of 29) of newsletters from January 2020 through October 2024 discussed the calculator toolkit.
· Division offices. These offices disseminate information from headquarters to state DOTs and MPOs. For example, division offices share information on new training webinars on the calculator toolkit.
· Conferences and meetings. FHWA communicates information on the calculator toolkit at conferences—most recently in 2023—and attends bimonthly meetings with an industry association to discuss CMAQ topics such as the calculator toolkit.
FHWA also included information about the calculator toolkit as part of program resources available to state DOTs and MPOs. This type of communication on the toolkit may require state DOTs and MPOs to seek out the information.
· FHWA’s website. In addition to hosting the toolkit, the FHWA website includes a video with instructions on using the calculator toolkit.
· CMAQ guidance. FHWA’s 2024 CMAQ interim guidance discusses the calculator toolkit, among many CMAQ topics. Specifically, the guidance discusses the purpose of the toolkit and provides a link to the toolkit on FHWA’s website.[71]
In our survey, nearly all state DOTs (47 of 51) stated that they or another transportation entity in their state (MPO or local transportation agency) were aware of the calculator toolkit.
FHWA Has Not Provided Ongoing Communication on the Cost-Effectiveness Tables
In contrast to its communication on the calculator toolkit, FHWA did not provide ongoing and proactive communication on the 2020 cost-effectiveness tables. FHWA generally communicated about the tables from January 2020 through December 2020. FHWA focused its communication on how the 2020 tables were different from the 2015 tables. According to FHWA officials, FHWA communicated with state DOTs and MPOs about the tables through similar formal methods it used for the calculator toolkit, with limited efforts after December 2020.
· Bimonthly newsletter. FHWA’s air quality newsletters provided information on the 2020 tables in three of out 28 newsletters from July through December 2020 but not after this time.
· Conference and meetings. FHWA shared information about the 2020 tables at conferences and at meetings with industry associations in 2020.
· Division offices. Offices disseminated information from headquarters to state DOTs and MPOs when FHWA updated the tables in 2020.
As with the calculator toolkit, FHWA included information about the tables as part of program resources available to state DOTs and MPOs. However, because this type of communication is static, it may require state DOTs and MPOs to seek out the information.
· FHWA’s website. The website includes the 2020 tables and a July 2020 FHWA webinar that discussed the purpose, methodology, limitations, and findings of the tables.
· CMAQ guidance. FHWA’s 2024 interim CMAQ guidance mentions the cost-effectiveness tables, among many CMAQ topics. It also notes the statutory requirement that state DOTs and MPOs consider the cost-effectiveness information in the tables when selecting CMAQ projects.[72]
Federal internal control standards state that agencies should externally
communicate information on a timely basis to help stakeholders achieve their
objectives.[73]
According to FHWA officials, FHWA did not provide ongoing communication on the
cost-effectiveness tables after 2020 because it believed that state DOTs and
MPOs were sufficiently aware of the tables through FHWA’s various methods of
communicating at the time it released them.
FHWA also noted that it included information about the tables on its website and in program guidance. However, FHWA did not continue to proactively communicate about the cost-effectiveness tables. For instance, as noted above, FHWA did not mention them in most of its communication after 2020. As such, state DOTs and MPOs may not know to seek out the cost-effectiveness tables on the website. This contrasts with FHWA’s efforts to communicate on the calculator toolkit. For that tool, FHWA communicated through bimonthly newsletters and other ongoing methods to provide potential users with regular reminders, in addition to providing information on its website and in program guidance. Because FHWA’s approach results in state DOTs and MPOs needing to seek out the cost-effectiveness tables, we do not consider it to be ongoing and proactive.[74]
FHWA’s approach to communication for the cost-effectiveness tables may have contributed to state DOTs and MPOs being less aware of the tables, compared to the calculator toolkit. In our survey, 16 state DOTs—roughly one-third—said they or other transportation entities in their states were unaware of the tables. By comparison, as reported above, nearly all (47) state DOTs reported they or other transportation entities in their state were aware of FHWA’s calculator toolkit.
Providing ongoing, proactive communication to state DOTs and MPOs on the tables could enhance awareness. According to FHWA officials, in recent years there has been a high level of turnover among state DOT officials that manage the CMAQ program. As such, the lack of ongoing communication on the tables may have led to newer staff within state DOTs being unaware of the cost-effectiveness tables as a resource for evaluating and selecting projects. New staff may not know, for example, to look for the tables on FHWA’s website. In addition, state DOTs and MPOs have different cycles for evaluating and selecting CMAQ projects. For example, one MPO we interviewed evaluated and selected CMAQ projects from February through June of a recent year, whereas an MPO in a different state completed this process from January through April of the same year. While one state DOT requests that MPOs submit potential CMAQ projects twice each year, another state DOT does so every 2 years. Ongoing communication from FHWA could provide information to state DOTs and MPOs when they need it.
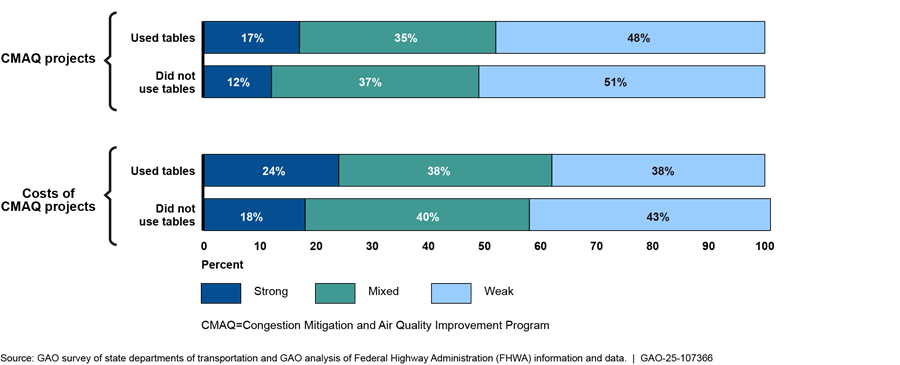
Moreover, greater awareness of the tables could contribute to state DOTs and MPOs selecting CMAQ projects that are more cost effective in reducing emissions of pollutants. While state DOTs and MPOs are not required to use the cost-effectiveness tables when selecting and evaluating CMAQ projects, six state DOTs reported in our survey that they used the tables in fiscal year 2023 or earlier.[75] Our analysis found those six state DOTs selected a greater share of projects with strong cost-effective project types compared to states overall. Specifically, 17 percent of all projects started in fiscal years 2015 to 2023 in these six states had a project type with a strong cost-effectiveness rating from FHWA’s cost-effectiveness tables compared to 12 percent of projects for all other states (see fig. 13). Further, five of those six state DOTs responded to a question in our survey on the helpfulness of the tables and stated that the tables were moderately or very helpful during the project selection process.
Figure 13: Percentage of CMAQ Projects and Funding by Rating of Cost Effectiveness in Reducing Emissions, Fiscal Years 2015–2023, by State Use of Cost-Effectiveness Tables
Notes:
Information from Federal Highway Administration, Congestion Mitigation and Air Quality Improvement (CMAQ) Program: 2020 Cost-Effectiveness Tables Update (Washington, D.C., July 2020) and data from FHWA CMAQ project data.
Percentages may not total to 100 percent due to rounding.
States have up to 3 years after the end of the fiscal year in which funds are apportioned to obligate the funds. Our analysis considers projects in the first year that they were funded and any project costs in subsequent years are included in that first year. In addition, our analysis does not include project costs from other sources. This analysis considers the percentage of CMAQ funds after accounting for transfers between CMAQ and other federal-aid highway formula programs and CMAQ funds spent on projects eligible for the Surface Transportation Block Grant Program.
The 2020 tables classify project types with strong cost effectiveness as those that cost less than $2.8 million per ton of emissions reduced across all CMAQ pollutants, mixed cost effectiveness as those that cost between $2.8 and $8.8 million per ton of emissions reduced across all CMAQ pollutants, and weak as those costing $8.8 million or more per ton across all CMAQ pollutants.
FHWA officials told us FHWA plans to publish an update to the cost-effectiveness tables in 2025 and that the agency plans to use similar approaches to communicating about those updated tables as it did with the 2020 tables. However, that approach limited communication to the 6-month period after FHWA published the tables in 2020 and, therefore, may have limited state DOTs’ and MPOs’ awareness of the tables. Ongoing communications about the tables, in addition to information on FHWA’s website, could increase state DOT and MPOs awareness and use of the forthcoming tables.
Conclusions
CMAQ supports transportation projects that address vehicle emissions of pollutants to help states meet federal air quality standards set pursuant to the Clean Air Act. Per statute, FHWA developed and updated cost-effectiveness tables to help state DOTs and MPOs consider the cost effectiveness of reducing emissions when selecting CMAQ projects.
However, most CMAQ projects we analyzed were not of project types that FHWA found to be the most cost effective at reducing emissions. Moreover, nearly one-third of state DOTs responded in our survey that they were unaware of the cost-effectiveness tables, and FHWA’s formal communications on the tables stopped 6 months after FHWA published the most recent iteration in 2020. Providing ongoing communication on the cost-effectiveness tables will help ensure that state DOTs and MPOs are aware of the tables and the statutory responsibility to consider them. Such communication is especially important as staff changes at state DOTs and given the varied timing and processes states have for selecting CMAQ projects.
Recommendation for Executive Action
The Administrator of FHWA should provide ongoing formal communications to state DOTs and MPOs on the CMAQ cost effectiveness tables beyond their initial release, including information on the statutory requirement that state DOTs and MPOs consider the tables when selecting CMAQ projects. (Recommendation 1)
Agency Comments
We provided a draft of this report to the Department of Transportation and EPA for review and comment. The Department of Transportation provided a letter, reproduced in appendix IV, in which it agreed with our recommendation. The Department of Transportation also provided technical comments that we incorporated as appropriate. EPA did not have any comments.
We are sending copies of this report to the appropriate congressional committees, the Secretary of Transportation, the Administrator of the EPA, and other interested parties. In addition, the report is available at no charge on the GAO website at https://www.gao.gov.
If you or your staff have any questions about this report, please contact me at repkoe@gao.gov. Contact points for our Offices of Congressional Relations and Public Affairs may be found on the last page of this report. GAO staff who made key contributions to this report are listed in appendix V.

Elizabeth Repko
Director, Physical Infrastructure Issues
This report examines (1) how states have used Congestion Mitigation and Air Quality Improvement Program (CMAQ) funds since fiscal year 2015, (2) the emissions outcomes of CMAQ projects since fiscal year 2015 and how the Federal Highway Administration (FHWA) tracks outcomes, (3) the cost effectiveness of CMAQ projects at reducing emissions since fiscal year 2015 according to available FHWA data and reports, and (4) the extent to which FHWA has communicated to state departments of transportation (DOT) and metropolitan planning organizations (MPO) about FHWA tools for evaluating emissions reductions and cost effectiveness of CMAQ projects.
To inform all objectives, we reviewed relevant statutes and FHWA documents such as CMAQ guidance. We also interviewed officials with FHWA, the Environmental Protection Agency, and relevant industry associations including organizations representing state DOTs, MPOs, and state air quality agencies. Across objectives, our scope was the 50 states and Washington, D.C. (collectively referred to as 51 states), as they were the recipients of CMAQ funding for fiscal years 2015 to 2023, the latest fiscal year for which CMAQ project data were available at the time of our review.
We conducted semi-structured interviews with officials with a non-generalizable sample of relevant agencies in six selected states regarding use of CMAQ funds, FHWA’s calculator toolkit and cost-effectiveness tables, outcomes of CMAQ projects, and other topics. We selected states (California, Connecticut, Massachusetts, South Carolina, South Dakota, and Texas) to obtain a range of the following characteristics: population, geographic location, extent of attainment of federal air quality standards, and extent of transfers to other federal-aid highway formula programs.
In each state, we aimed to interview the state DOT, two MPOs, the FHWA division office, and the state air quality agency. However, we did not interview all entities in all states as in some cases it was not relevant to do so. For example, in recent years one state used its entire CMAQ apportionment on Surface Transportation Block Grant (STBG)-eligible projects, so we did not interview any MPOs or the state air quality agency. In another state, because only one MPO receives CMAQ funding from the state DOT, we did not interview a second MPO in the state. In some other cases, entities we reached out to for interviews declined to meet with us. Specifically, two state air quality agencies declined to meet with us, with one citing a lack of involvement with CMAQ. In total we met with six state DOTs, six FHWA division offices, three state air quality agencies, and nine MPOs. Following these interviews, we conducted a content analysis to determine trends in responses.
Analysis of FHWA Financial Data
To describe how states have used CMAQ funds since fiscal year 2015, we analyzed financial data from FHWA’s Financial Management Information System that FHWA provided to us in April and October 2024. We reviewed data on transfers between CMAQ and other eligible federal-aid highway formula programs with CMAQ-apportioned funds for fiscal years 2015 through 2024, the latest fiscal year for which funds were available. As the data included both transfers to and from CMAQ, we calculated the net transfers between CMAQ and other programs. We also analyzed separate data on CMAQ apportionments by fiscal year, provided to us by FHWA, to determine the net percentage of CMAQ apportionments transferred between CMAQ and other programs. To determine the reliability of these data, we reviewed FHWA documentation on the database, interviewed FHWA officials, and manually reviewed the data for any obvious missing data, errors, or outliers. We determined that the data were sufficiently reliable for reporting on transfers of funds between CMAQ and other federal-aid highway formula programs.
Analysis of FHWA’s CMAQ Project Data
To describe how states used CMAQ funds and the emission reduction outcomes of CMAQ projects, we analyzed data from FHWA’s CMAQ project database on CMAQ projects for fiscal years 2015 through 2023, the latest year for which data were available. According to FHWA guidance, state DOTs and MPOs report annually on CMAQ obligations and deobligations taking place in each fiscal year. We downloaded the data from FHWA’s website. We selected 2015 as the first year for our analysis because the database used different project categories prior to that year. There were 13,922 project records in the database for fiscal years 2015 through 2023. Because state DOTs and MPOs can fund CMAQ projects over multiple years, we used the project identification field to combine individual project data on costs and estimated emissions data over multiple years. This resulted in 9,318 projects with a unique project identification number. We analyzed CMAQ project data to determine trends in the categories of projects funded over time, project costs, and estimated emissions reductions.[76]
· Project costs. The database includes data on capital costs supported by CMAQ, operating costs supported by CMAQ, and non-CMAQ project costs. For analyses involving project costs, we included CMAQ costs only because we wanted to focus our analysis on use of federal funds. We summed CMAQ project costs (both capital and operating costs).[77] States are able to deobligate funds from individual projects in subsequent years, and some projects had negative costs in some fiscal years. We excluded any projects that had negative or zero costs across all fiscal years. Of the 9,318 projects with a unique project identification number, 776 had a negative value for project costs, resulting in 8,542 projects in our analysis.
· Project category. FHWA’s CMAQ project database tracks projects by 11 different project categories.[78] We used that project category to describe the kinds of projects funded by CMAQ. One of the project categories is STBG-eligible projects. In total, 1,431 projects were in that category. We analyzed data on those projects to inform the extent to which states have used CMAQ funds for such projects. Otherwise, we excluded these projects from our analyses of CMAQ projects, as they may not reduce emissions of CMAQ pollutants. This resulted in 7,111 CMAQ projects in our analyses.
· Emissions reductions. To evaluate emission reductions of CMAQ projects, we summed estimated emission reductions for individual projects. State DOTs generally report on a quantitative benefit in kilograms per day of emissions reduced. However, they can report a qualitative benefit if it is not possible to estimate emissions reductions. In some cases, a project may have an estimated emissions reduction in one year and a qualitative benefit in other years. In these cases, we only considered the reported quantitative benefit. We did not include in our analysis of estimated emission reductions any projects that reported only qualitative benefits.[79]
To determine the reliability of these data, we reviewed FHWA documentation on the database; interviewed FHWA officials; and manually reviewed the data for any obvious missing data, errors, or outliers. We determined that the data were sufficiently reliable for reporting on trends in the categories of projects funded with CMAQ and the costs and emissions reductions of those projects.
Review of FHWA’s CMAQ Performance Measures
To describe how FHWA tracks outcomes for CMAQ, we reviewed FHWA regulations, guidance, and other documents for three CMAQ performance measures. We also downloaded and analyzed data from FHWA’s website on state and MPO targets and progress in meeting those targets for FHWA’s first performance period, the only performance period for which complete data are available.[80] We analyzed these data to determine the number of states and MPOs required to set targets for the performance measures and the extent to which those states and MPOs met their targets. To determine the reliability of these data we reviewed FHWA documentation on the data; interviewed FHWA officials; and manually reviewed the data for any obvious missing data, errors, or outliers. We determined that the data were sufficiently reliable for reporting on the extent to which state DOTs and MPOs have set and met CMAQ performance measures. In addition, we reviewed Department of Transportation documents on its “Justice40” initiative to help determine the extent to which CMAQ funds were obligated for projects in disadvantaged communities.[81]
Analysis of CMAQ Project Cost Effectiveness in Reducing Emissions
To describe the cost effectiveness of CMAQ projects, according to available FHWA data and reports, we analyzed data from FHWA’s CMAQ project database on projects funded between fiscal years 2015 and 2023, as described above, along with cost-effectiveness ratings in FHWA’s 2020 cost-effectiveness tables.[82] The 2020 cost-effectiveness tables rate the cost effectiveness of 21 types of eligible CMAQ projects, based on a median cost per ton of emissions reduced. To evaluate cost effectiveness, FHWA estimated the cost per ton of emissions reduction for each pollutant in a range of scenarios for each project type, determined the median value of that range, and then determined the median across all pollutants.[83] Because those 21 types differ from the project categories used to track projects in the CMAQ project database, we applied one of the 21 project types in the tables to each project based on the project title, project category, and project description in the CMAQ project database.[84]
In many cases, it was clear which of the 2020 cost-effectiveness project types was most relevant based on the information in the CMAQ project database. In other cases, when it was not clear, we set rules to consistently follow for such cases to apply a project type or to determine we could not apply a project type. We obtained FHWA’s input on those rules. Of 8,542 project records from the CMAQ project database, 1,431 were STBG-eligible projects that we excluded from our analysis, as they may not reduce emissions of CMAQ pollutants and may not be CMAQ-eligible projects.
Of the remaining 7,111 projects, we applied a cost-effectiveness rating to 5,709, or 80 percent. We did not apply a 2020 cost-effectiveness project type if: (1) there was insufficient information in the project’s database record to do so (169, or 2 percent); (2) multiple 2020 cost-effectiveness tables project types could equally apply to a project (63, or 1 percent); or (3) none of the 2020 cost-effectiveness tables project types applied (1,170, or 17 percent). We excluded those projects from our cost-effectiveness analysis. One analyst first applied the 2020 cost-effectiveness tables project type to each record; a second analyst then reviewed those determinations to agree that the determination was appropriate.
The 2020 cost-effectiveness tables assign an overall rating of “strong,” “mixed,” or “weak” in reducing emissions to each of the 21 project types. We applied that cost-effectiveness rating to each CMAQ project. We then determined the share of projects and the total costs of projects for each cost-effectiveness rating.
The 2020 cost-effectiveness tables also assign a cost-effectiveness rating, on a letter A through I scale, to project types by each CMAQ criteria pollutant. We further analyzed the cost effectiveness of CMAQ projects in reducing emissions by applying those letter ratings to CMAQ projects. To do so, we first determined which CMAQ pollutants each project targeted. For each project that reported reduced emissions for one or two pollutants, we determined that the project targeted that pollutant or pollutants. For each project that reported reduced emissions for more than two pollutants, we determined that the project targeted the two pollutants with the largest estimated emissions reductions for each project.[85] We then applied the relevant letter ratings, A through I, to each project based on its targeted pollutants. We used the letter ratings to describe the cost effectiveness of CMAQ projects in reducing emissions by pollutant.
Survey of State DOTs
We conducted a web-based survey of state DOTs for the 50 states and Washington, D.C. to obtain their perspectives on FHWA tools for evaluating emissions reductions and cost effectiveness of projects. We asked state DOTs about their experiences with the emissions calculator toolkit, 2020 cost-effectiveness tables, and CMAQ performance measures. To identify state DOT officials for the survey, an industry association provided us with a list of officials knowledgeable about CMAQ. We contacted these officials to confirm they were knowledgeable about CMAQ and could respond to our survey questions. In some cases, officials referred us to individuals who could respond.
Prior to conducting the survey, we conducted survey pre-tests by video call with officials from four state DOTs to ensure our questions were clear and comprehensive, answer choices were appropriate, and the survey was unbiased and not burdensome to respondents. We selected the four state DOTs to ensure variety in the state DOTs role in administering CMAQ, geographic location, population, and extent of attainment of federal air quality standards. Based on the feedback we received from officials in the pre-tests, we modified the survey questions as appropriate.
We sent respondents a notification email ahead of the survey launch and then emailed them a web link to complete the survey. To reduce nonresponses, we sent multiple email reminders and conducted phone calls to encourage state DOTs to complete the survey. We contacted officials at four state DOTs who did not answer certain survey questions we identified as key to our report to obtain their responses. We also administered the survey by phone for one state DOT. We received responses from all 51 state DOTs for a 100 percent response rate. See appendix III for survey questions and selected results. We conducted this survey between August 2024 and October 2024.
Review of FHWA Communication
We reviewed FHWA documentation and interviewed FHWA officials to assess FHWA’s communications with state DOTs and MPOs about FHWA tools for evaluating emissions reductions and the cost effectiveness of CMAQ projects. Specifically, we reviewed guidance and instructions for the calculator toolkit and 2020 cost-effectiveness tables. We also reviewed FHWA communication about the calculator toolkit and tables through FHWA’s online trainings, presentations, and bimonthly air quality newsletters.
We then assessed FHWA’s documentation and communications against relevant internal control standards. We determined that the external communication principle was significant to this objective.[86] Specifically, we applied the underlying principle that agencies should communicate externally the necessary quality information to achieve the entity’s objective.
We conducted this performance audit from February 2024 to June 2025 in accordance with generally accepted government auditing standards. Those standards require that we plan and perform the audit to obtain sufficient, appropriate evidence to provide a reasonable basis for our findings and conclusions based on our audit objectives. We believe that the evidence obtained provides a reasonable basis for our findings and conclusions based on our audit objectives.
The following two tables present two classifications of Congestion Mitigation and Air Quality Improvement Program (CMAQ)-eligible projects by the Federal Highway Administration (FHWA). The first table shows project categories tracked by FHWA in its CMAQ project database, and the second shows project types included in FHWA’s 2020 cost-effectiveness tables.
|
Category |
Description |
|
Advanced diesel truck/engine technologies |
Projects involving replacements or improvements to diesel trucks such as vehicle replacements, engine replacements, or engine retrofits. |
|
Alternative fuels and vehicles |
Projects involving alternative fueled vehicles and alternative fuels, such as purchases of non-transit alternative fueled vehicles, alternative fuels, and alternative fueling systems. |
|
Bicycle and pedestrian facilities and programs |
Projects involving bicycle and pedestrian infrastructure or programs, such as shared use paths, bike lanes, sidewalk improvements, and support for bike share programs. |
|
Congestion reduction and traffic flow |
Projects to reduce congestion and improve traffic flow through corridors, such as turn lanes at intersections, roundabouts, improved traffic signals, intelligent transportation systems, and high-occupancy vehicle lanes. |
|
Freight/intermodal |
Projects involving improvements at freight facilities or other modes of transportation. |
|
Inspection/maintenance programs |
Projects at vehicle inspection and maintenance facilities. |
|
Other |
Projects that do not fit into other categories. |
|
Surface Transportation Programa |
Projects that are eligible for the Surface Transportation Block Grant program. |
|
Ride sharing |
Projects involving shared vehicles such as carpool, vanpool, and park and ride lots. |
|
Transit improvements |
Projects involving transit facilities and services including transit vehicle purchases, facility upgrades, fare subsidies, and operating assistance for new transit services. |
|
Travel demand management |
Projects to improve transportation system performance, such as parking management, road usage fees, and traveler information services. |
CMAQ = Congestion Mitigation and Air Quality Improvement Program
Source: Federal Highway Administration CMAQ documentation. | GAO‑25‑107366
aThe Surface Transportation Block Grant Program was formerly called Surface Transportation Program. Based on the statutory formula for CMAQ, some states can use some or all of their CMAQ apportionments on projects eligible for the Surface Transportation Block Grant Program.
|
Project Type |
Description |
|
Bicycle and pedestrian improvements |
Projects that facilitate walking and bicycling in place of vehicle travel such as constructing sidewalks, bikeways, and paths. |
|
Bikesharing |
Projects for services that offer access to bicycles owned and operated by third parties (such as cities). |
|
Carsharing |
Projects that support access to vehicles owned and maintained by third parties (such as cities) to reduce household vehicle use. |
|
Diesel engine retrofit technologies |
Projects to improve engines on older diesel vehicles including retrofitting engines with emission reduction technologies such as diesel particulate filters. |
|
Dust mitigation |
Projects to suppress dust emissions such as paving previously unpaved surfaces. |
|
Electric vehicle charging stations |
Projects to support the use of electric vehicles by providing electric vehicle charging infrastructure. |
|
Employee transit benefits |
Projects that support subsidies for transit benefits to incentivize the use of transit. |
|
Extreme-temperature cold-start technologies |
Projects that use technologies to mitigate the inefficiencies of starting vehicles at low temperatures. |
|
Heavy-duty vehicle replacements |
Projects that replace older higher-emission diesel vehicles with new lower-emission vehicles. |
|
Idle reduction strategies |
Projects to reduce vehicle idling, such as improving vehicle power management systems or implementing policies in high-idling locations such as airports. |
|
Incident management |
Projects involving equipment or personnel to advise or re-route drivers during times of non-recurring congestion. |
|
Intermodal freight facilities and programs |
Projects at port facilities for reducing heavy-duty truck trips and encouraging transfer to rail or other modes. |
|
Intersection improvements |
Projects that improve intersections, such as adding left-turn lanes, to improve traffic flow. |
|
Natural gas refueling infrastructure |
Projects to support fueling infrastructure for natural gas vehicles. |
|
Park and ride |
Projects involving new park and ride lots at transit stations. |
|
Rideshare programs |
Projects to support rideshare programs involving shared vehicles, such as subsidies for shared vehicle drivers and purchasing vanpools. |
|
Roundabouts |
Projects to create roundabouts for improving traffic flow through intersections. |
|
Subsidized transit fares |
Projects to subsidize transit fares to incentivize transit use. |
|
Traffic signal synchronization |
Projects involving traffic signals or synchronizing traffic signals along corridors to improve traffic flow. |
|
Transit amenity improvements |
Projects to improve the transit experience such as updates to bus stops and fare collection services. |
|
Transit service expansion |
Projects that expand transit services to increase transit use. |
CMAQ = Congestion Mitigation and Air Quality Improvement Program
Source: Federal Highway Administration (FHWA) information. | GAO‑25‑107366
Notes:
Information from Federal Highway Administration, Congestion Mitigation and Air Quality Improvement (CMAQ) Program, 2020 Cost-Effectiveness Tables Update (Washington, D.C., July 20, 2020).
These 21 project types do not cover all projects eligible for CMAQ. For example, air quality awareness efforts and purchases of street sweepers have been funded by CMAQ but are not covered by these project types.
We conducted a survey of state departments of transportation (state DOT) for the 50 states and Washington, D.C. (collectively referred to as state DOTs) to inform (1) how the Federal Highway Administration (FHWA) tracks the outcomes of CMAQ projects and (2) the extent to which state DOTs and metropolitan planning organizations (MPO) are aware of and use FHWA tools for evaluating emissions reductions and cost effectiveness of CMAQ projects. The tables below show responses to questions from the survey related to state DOTs’ experiences with the emissions calculator toolkit, 2020 cost-effectiveness tables, and CMAQ performance measures.[87]
We received responses from all 51 recipients, for a 100 percent response rate. Some state DOTs did not respond to every question because it did not apply or because they chose to not answer the question.
Tables 7 through 28 show selected survey questions and a summary of responses received.
Emissions Calculator Toolkit
Survey question: In your state, are the following transportation entity(ies) involved in the CMAQ project evaluation and selection process?
|
|
Yes |
No |
Don’t know |
Total |
|
State DOTs |
51 |
0 |
0 |
51 |
|
MPOs, councils of government, or other regional transportation entities |
39 |
9 |
1 |
49 |
|
Local transportation entities |
19 |
18 |
8 |
45 |
|
Other |
9 |
8 |
1 |
18 |
CMAQ = Congestion Mitigation and Air Quality Improvement Program
MPO = metropolitan planning organization
State DOT = state department of transportation
Source: GAO survey of state DOTs. | GAO‑25‑107366
Survey question: Before receiving this questionnaire, was your state DOT or any transportation entity in your state (e.g., metropolitan planning organization (MPO), local transportation agency) aware that FHWA provides an emissions calculator toolkit as an optional resource to assist DOTs, MPOs, and project sponsors in estimating emission reductions benefits for potential CMAQ projects?
|
|
Frequency |
|
Yes |
47 |
|
No |
4 |
|
Total |
51 |
CMAQ = Congestion Mitigation and Air Quality Improvement Program
FHWA = Federal Highway Administration
State DOT = state department of transportation
Source: GAO survey of state DOTs. | GAO‑25‑107366
Survey question: In federal fiscal year 2023, did your state DOT use any of FHWA’s emissions calculators to estimate emission reductions benefits during the CMAQ project evaluation and selection process?
|
|
Frequency |
|
Yes |
15 |
|
No |
26 |
|
Don’t know |
5 |
|
Total |
46 |
CMAQ = Congestion Mitigation and Air Quality Improvement Program
FHWA = Federal Highway Administration
State DOT = state department of transportation
Source: GAO survey of state DOTs. | GAO‑25‑107366
Note: This includes responses from state DOTs that responded in an earlier question that they or another transportation entity in their states were aware of the emissions calculators.
Survey question: In federal fiscal year 2023, did your state DOT use the following FHWA emissions calculators to estimate emission reductions benefits during the CMAQ project evaluation and selection process?
|
|
Yes |
No |
Don’t |
Total |
|
Adaptive traffic control systems |
3 |
9 |
1 |
13 |
|
Alternative fuel vehicles and infrastructure |
8 |
5 |
0 |
13 |
|
Bicycle, pedestrian, and shared micromobility |
11 |
4 |
0 |
15 |
|
Carpooling and vanpooling |
3 |
8 |
2 |
13 |
|
Congestion reduction and traffic flow improvements |
10 |
4 |
0 |
14 |
|
Construction and intermodal equipment |
1 |
10 |
2 |
13 |
|
Diesel idle reduction strategies |
0 |
9 |
4 |
13 |
|
Diesel truck and engine retrofit and replacement |
0 |
9 |
4 |
13 |
|
Dust mitigation |
2 |
10 |
1 |
13 |
|
Electronic open-road tolling |
1 |
11 |
1 |
13 |
|
Electric vehicles and electric vehicles’ charging infrastructure |
5 |
6 |
2 |
13 |
|
Freight modal shift |
1 |
10 |
2 |
13 |
|
Locomotive and marine engine retrofit and replacement tool |
1 |
8 |
4 |
13 |
|
Managed lanes |
0 |
9 |
4 |
13 |
|
Telework tool |
2 |
9 |
2 |
13 |
|
Transit bus upgrades and system improvements |
5 |
8 |
0 |
13 |
|
Transit bus service and fleet expansion |
8 |
6 |
1 |
15 |
|
Travel advisories |
1 |
9 |
3 |
13 |
CMAQ = Congestion Mitigation and Air Quality Improvement Program
FHWA = Federal Highway Administration
State DOT = state department of transportation
Source: GAO survey of state DOTs. | GAO‑25‑107366
Note: This includes responses from state DOTs that responded in an earlier question that they used the emissions calculators in fiscal year 2023.
Survey question: In federal fiscal year 2023, for how many projects using CMAQ funds did your state DOT use FHWA’s emissions calculators to estimate emission reductions benefits during the project evaluation and selection process?
|
|
Frequency |
|
All or almost all projects |
5 |
|
Most projects |
3 |
|
About half of the projects |
2 |
|
Some of the projects |
3 |
|
Few or no projects |
2 |
|
Total |
15 |
CMAQ = Congestion Mitigation and Air Quality Improvement Program
FHWA = Federal Highway Administration
State DOT = state department of transportation
Source: GAO survey of state DOTs. | GAO‑25‑107366
Note: This includes responses from state DOTs that responded in an earlier question that they used the emissions calculators in fiscal year 2023.
Survey question: Prior to federal fiscal year 2023, did your state DOT use any of FHWA’s emissions calculators to estimate emission reductions benefits during the CMAQ project evaluation and selection process?
|
|
Frequency |
|
Yes |
16 |
|
No |
23 |
|
Don’t know |
6 |
|
Total |
45 |
CMAQ = Congestion Mitigation and Air Quality Improvement Program
FHWA = Federal Highway Administration
State DOT = state department of transportation
Source: GAO survey of state DOTs. | GAO‑25‑107366
Note: This includes responses from state DOTs that responded in an earlier question that they or another transportation entity in their states were aware of the emissions calculators.
Survey question: How helpful did your state DOT find FHWA’s emissions calculators in estimating emission reductions benefits during the CMAQ project evaluation and selection process?
|
|
Frequency |
|
Very helpful |
9 |
|
Moderately helpful |
9 |
|
Somewhat helpful |
2 |
|
Not at all helpful |
0 |
|
Total |
20 |
CMAQ = Congestion Mitigation and Air Quality Improvement Program
FHWA = Federal Highway Administration
State DOT = state department of transportation
Source: GAO survey of state DOTs. | GAO‑25‑107366
Note: This includes responses from state DOTs that responded in an earlier question that they used the emissions calculators in fiscal year 2023 or a prior year.
Survey question: Which of the following factors are the primary reason(s) your state DOT did not use FHWA’s emissions calculators to estimate emission reductions benefits in federal fiscal year 2023? Please select up to three factors. Type in the numbers 1, 2, or 3 to indicate your selection. Please note that number order doesn’t matter, i.e., 1 isn’t stronger than 2.
|
|
Frequency |
|
Use other stand-alone tool(s) to estimate emission reductions benefits |
7 |
|
Only other transportation entities in our state estimate emission reductions benefits |
9 |
|
Do not estimate emission reductions benefits because our state does not have nonattainment or maintenance areas |
6 |
|
Not confident in the estimates calculated by FHWA emissions calculators |
2 |
|
FHWA emissions calculators are too difficult to use/do not understand how to use |
1 |
|
Technology issues associated with accessing or using emissions calculators |
2 |
|
Do not know where to find them on the FHWA website |
0 |
|
Other reason |
10 |
CMAQ = Congestion Mitigation and Air Quality Improvement Program
FHWA = Federal Highway Administration
State DOT = state department of transportation
Source: GAO survey of state DOTs. | GAO‑25‑107366
Note: This includes responses from state DOTs that responded in an earlier question that they are involved in the CMAQ project evaluation and selection process and did not use the emissions calculators in fiscal year 2023. State DOTs could select up to three factors.
Survey question: Does your state DOT plan to use any FHWA emissions calculators in the future?
|
|
Frequency |
|
Yes |
25 |
|
No, but may consider using |
12 |
|
No, will probably not use |
9 |
|
Total |
46 |
FHWA = Federal Highway Administration
State DOT = state department of transportation
Source: GAO survey of state DOTs. | GAO‑25‑107366
Note: This includes responses from state DOTs that responded in an earlier question that they are involved in the CMAQ project evaluation and selection process.
Survey question: In federal fiscal year 2023, did any other transportation entity—such as an MPO or other project sponsor—in your state use any of FHWA’s emissions calculators to estimate emission reductions benefits during the CMAQ project evaluation and selection process?
|
|
Frequency |
|
Yes |
18 |
|
No |
12 |
|
Not applicable—state DOT estimates the emission reductions for CMAQ projects |
4 |
|
Don’t know |
11 |
|
Total |
45 |
CMAQ = Congestion Mitigation and Air Quality Improvement Program
FHWA = Federal Highway Administration
MPO = metropolitan planning organization
Source: GAO survey of state DOTs. | GAO‑25‑107366
Note: This includes responses from state DOTs that responded in an earlier question that they or another transportation entity in their states were aware of the emissions calculators.
Table 17: Other Transportation Entities Use of Emissions Calculator Toolkit, Prior to Fiscal Year 2023
Survey question: Prior to federal fiscal year 2023, did any other transportation entity—such as an MPO or other project sponsor—in your state use any of FHWA’s emissions calculators to estimate emission reductions benefits during the CMAQ project evaluation and selection process?
|
|
Frequency |
|
Yes |
18 |
|
No |
11 |
|
Not applicable—state DOT estimates the emission reductions for CMAQ projects |
3 |
|
Don’t know |
13 |
|
Total |
45 |
CMAQ = Congestion Mitigation and Air Quality Improvement Program
FHWA = Federal Highway Administration
MPO = metropolitan planning organization
State DOT = state department of transportation
Source: GAO survey of state DOTs. | GAO‑25‑107366
Note: This includes responses from state DOTs that responded in an earlier question that they or another transportation entity in their states were aware of the emissions calculators.
Survey question: Beyond FHWA’s emissions calculators, what approaches does the state DOT or any other transportation entity in your state use to estimate emission reductions benefits during the CMAQ project evaluation and selection process? Please select all that apply.
|
|
Frequency |
|
None—transportation entities only use FHWA’s emissions calculators to estimate emission reductions |
7 |
|
Do not estimate emission reductions benefits because our state does not have any nonattainment areas |
6 |
|
Excel-based worksheets developed by state DOT, MPO, or other local transportation agency |
23 |
|
Analytical model developed by state DOT, MPO, or other local transportation agency |
18 |
|
Tool, table, or other analyses developed by other entity, such as a university or air quality agency |
18 |
|
Other |
8 |
CMAQ = Congestion Mitigation and Air Quality Improvement Program
FHWA = Federal Highway Administration
MPO = metropolitan planning organization
State DOT = state department of transportation
Source: GAO survey of state DOTs. | GAO‑25‑107366
2020 Cost-Effectiveness Tables
Survey question: Before receiving this questionnaire, was your state DOT or any transportation entity in your state (e.g., MPO, local transportation agency) aware that FHWA provides cost-effectiveness tables (most recently updated in July 2020) to provide information to assist states, MPOs and other project sponsors to consider project cost effectiveness during the CMAQ project evaluation and selection process?
|
|
Frequency |
|
Yes |
35 |
|
No |
16 |
|
Total |
51 |
CMAQ = Congestion Mitigation and Air Quality Improvement Program
FHWA = Federal Highway Administration
MPO = metropolitan planning organization
State DOT = state department of transportation
Source: GAO survey of state DOTs. | GAO‑25‑107366
Survey question: In federal fiscal year 2023, did your state DOT use FHWA’s cost-effectiveness tables during the CMAQ project evaluation and selection process?
|
|
Frequency |
|
Yes |
3 |
|
No |
26 |
|
Don’t know |
6 |
|
Total |
35 |
CMAQ = Congestion Mitigation and Air Quality Improvement Program
FHWA = Federal Highway Administration
State DOT = state department of transportation
Source: GAO survey of state DOTs. | GAO‑25‑107366
Note: This includes responses from state DOTs that responded in an earlier question that they or another transportation entity in their states were aware of the cost-effectiveness tables.
Survey question: Prior to federal fiscal year 2023, did your state DOT use FHWA’s cost-effectiveness tables during the CMAQ project evaluation and selection process?
|
|
Frequency |
|
Yes |
4 |
|
No |
22 |
|
Don’t know |
8 |
|
Total |
34 |
CMAQ = Congestion Mitigation and Air Quality Improvement Program
FHWA = Federal Highway Administration
State DOT = state department of transportation
Source: GAO survey of state DOTs. | GAO‑25‑107366
Note: This includes responses from state DOTs that responded in an earlier question that they or another transportation entity in their states were aware of the cost-effectiveness tables.
Survey question: How helpful did your state DOT find using FHWA’s cost-effectiveness tables during the CMAQ project evaluation and selection process?
|
|
Frequency |
|
Very helpful |
3 |
|
Moderately helpful |
2 |
|
Somewhat helpful |
0 |
|
Not at all helpful |
0 |
|
Total |
5 |
CMAQ = Congestion Mitigation and Air Quality Improvement Program
FHWA = Federal Highway Administration
State DOT = state department of transportation
Source: GAO survey of state DOTs. | GAO‑25‑107366
Note: This includes responses from state DOTs that responded in an earlier question that they used the cost-effectiveness tables in fiscal year 2023 or a prior year.
Table 23: State DOT Use of Cost-Effectiveness Tables Outside of the CMAQ Project Evaluation and Selection Process
Survey question: Has your state DOT used or consulted FHWA’s cost-effectiveness tables outside of the CMAQ project evaluation and selection process?
|
|
Frequency |
|
Yes |
7 |
|
No |
27 |
|
Total |
34 |
CMAQ = Congestion Mitigation and Air Quality Improvement Program
FHWA = Federal Highway Administration
State DOT = state department of transportation
Source: GAO survey of state DOTs. | GAO‑25‑107366
Note: This includes responses from state DOTs that responded in an earlier question that they or another transportation entity in their states were aware of the cost-effectiveness tables.
Survey question: Which of the following factors are the primary reason(s) your state DOT did not use FHWA’s cost-effectiveness tables in federal fiscal year 2023? Please select up to three factors. Type in the numbers 1, 2, or 3 to indicate your selection. Please note that number order doesn’t matter, i.e., 1 isn’t stronger than 2.
|
|
Frequency |
|
Don’t explicitly consider cost effectiveness when evaluating and selecting potential CMAQ projects |
10 |
|
Use another method to consider cost effectiveness when selecting potential CMAQ projects |
9 |
|
Don’t understand how to use FHWA’s cost-effectiveness tables to inform project evaluation and selection decisions |
2 |
|
Do not know where to find FHWA’s cost-effectiveness tables on FHWA website |
0 |
|
Only other transportation entities in our state use the cost-effectiveness tables |
5 |
|
Other reason |
4 |
CMAQ = Congestion Mitigation and Air Quality Improvement Program
FHWA = Federal Highway Administration
State DOT = state department of transportation
Source: GAO survey of state DOTs. | GAO‑25‑107366
Note: This includes responses from state DOTs that responded in an earlier question that they are involved in the CMAQ project evaluation and selection process and did not use the cost-effectiveness tables in fiscal year 2023. State DOTs could select up to three factors.
Survey question: In federal fiscal year 2023, did any other transportation entity in your state—such as an MPO or other project sponsor—use FHWA’s cost-effectiveness tables during the CMAQ project evaluation and selection process?
|
|
Frequency |
|
Yes |
4 |
|
No |
11 |
|
Not applicable—state DOT makes all CMAQ project selection decisions |
4 |
|
Don’t know |
14 |
|
Total |
33 |
CMAQ = Congestion Mitigation and Air Quality Improvement Program
FHWA = Federal Highway Administration
MPO = metropolitan planning organization
Source: GAO survey of state DOTs. | GAO‑25‑107366
Note: This includes responses from state DOTs that responded in an earlier question that they or another transportation entity in their states were aware of the cost-effectiveness tables.
Table 26: Other Transportation Entities’ Use of Cost-Effectiveness Tables, Prior to Fiscal Year 2023
Survey question: Prior to federal fiscal year 2023, did any other transportation entity—such as an MPO or other project sponsor—use FHWA’s cost-effectiveness tables during the CMAQ project evaluation and selection process?
|
|
Frequency |
|
Yes |
8 |
|
No |
7 |
|
Not applicable—state DOT makes all CMAQ project selection decisions |
4 |
|
Don’t know |
14 |
|
Total |
33 |
CMAQ = Congestion Mitigation and Air Quality Improvement Program
FHWA = Federal Highway Administration
MPO = metropolitan planning organization
Source: GAO survey of state DOTs. | GAO‑25‑107366
Note: This includes responses from state DOTs that responded in an earlier question that they or another transportation entity in their states were aware of the cost-effectiveness tables.
Performance Measures
Survey question: Is your state DOT required to establish targets and report progress for any of the three performance measures related to the CMAQ program?
|
|
Yes |
No |
Don’t Know |
Total |
|
Annual hours of peak hour excessive delay per capita |
31 |
11 |
8 |
50 |
|
Percent of non-single occupancy vehicle travel |
31 |
12 |
7 |
50 |
|
Emission reductions measure: total emissions reductions for each applicable criteria pollutant and precursor |
35 |
9 |
6 |
50 |
CMAQ = Congestion Mitigation and Air Quality Improvement Program
State DOT = state department of transportation
Source: GAO survey of state DOTs. | GAO‑25‑107366
Survey question: How useful to your state DOT are the performance measures related to the CMAQ program for assessing effectiveness of projects in contributing to attainment or maintenance of relevant national ambient air quality standards for ozone, carbon monoxide, or particulate matter?
|
|
Annual hours of peak hour excessive delay per capita |
Percent of non-single occupancy vehicle travel |
Emission reductions measure |
|
Very useful |
6 |
6 |
7 |
|
Moderately useful |
6 |
4 |
8 |
|
Somewhat useful |
13 |
15 |
14 |
|
Not at all useful |
6 |
6 |
6 |
|
Total |
31 |
31 |
35 |
CMAQ = Congestion Mitigation and Air Quality Improvement Program
State DOT = state department of transportation
Source: GAO survey of state DOTs. | GAO‑25‑107366
Note: This includes responses from state DOTs that responded in an earlier question that they were required to establish targets and report progress for any of the three performance measures.
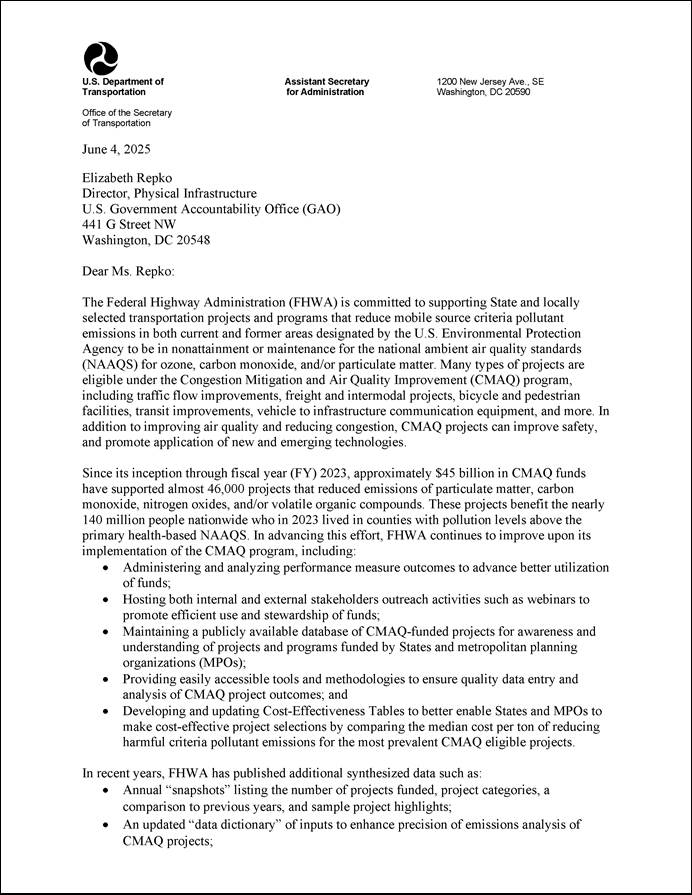
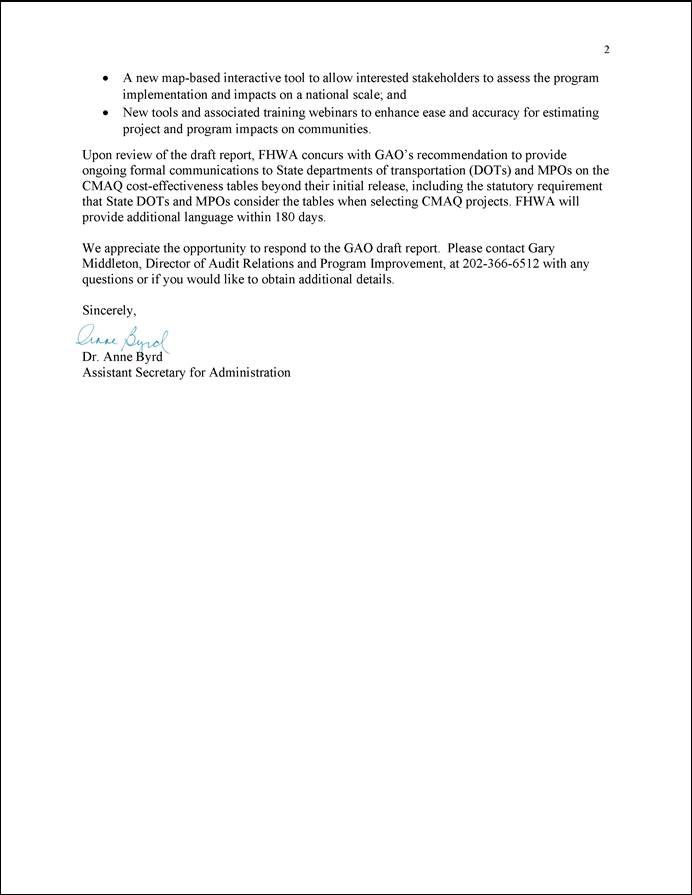
GAO Contact
Elizabeth Repko at repkoe@gao.gov.
Staff Acknowledgments
In addition to the contact above, Joanie Lofgren (Assistant Director), Matthew Rosenberg (Analyst-In-Charge), Laura Bonomini, Katherine Chambers, Lorraine Ettaro, Adrienne Fernandes-Alcantara, Anne Hobson, Gina Hoover, Catrin Jones, Rayna Ketchum, Terence Lam, Grant Mallie, Kate Shouse, Gretchen Snoey, Michelle Weathers, and Malika Williams made key contributions to this report.
The Government Accountability Office, the audit, evaluation, and investigative arm of Congress, exists to support Congress in meeting its constitutional responsibilities and to help improve the performance and accountability of the federal government for the American people. GAO examines the use of public funds; evaluates federal programs and policies; and provides analyses, recommendations, and other assistance to help Congress make informed oversight, policy, and funding decisions. GAO’s commitment to good government is reflected in its core values of accountability, integrity, and reliability.
Obtaining Copies of GAO Reports and Testimony
The fastest and easiest way to obtain copies of GAO documents at no cost is through our website. Each weekday afternoon, GAO posts on its website newly released reports, testimony, and correspondence. You can also subscribe to GAO’s email updates to receive notification of newly posted products.
Order by Phone
The price of each GAO publication reflects GAO’s actual cost of production and distribution and depends on the number of pages in the publication and whether the publication is printed in color or black and white. Pricing and ordering information is posted on GAO’s website, https://www.gao.gov/ordering.htm.
Place orders by calling (202) 512-6000, toll free (866) 801-7077,
or
TDD (202) 512-2537.
Orders may be paid for using American Express, Discover Card, MasterCard, Visa, check, or money order. Call for additional information.
Connect with GAO
Connect with GAO on X,
LinkedIn, Instagram, and YouTube.
Subscribe to our Email Updates. Listen to our Podcasts.
Visit GAO on the web at https://www.gao.gov.
To Report Fraud, Waste, and Abuse in Federal Programs
Contact FraudNet:
Website: https://www.gao.gov/about/what-gao-does/fraudnet
Automated answering system: (800) 424-5454
Media Relations
Sarah Kaczmarek, Managing Director, Media@gao.gov
Congressional Relations
A. Nicole Clowers, Managing Director, CongRel@gao.gov
General Inquiries
[1]Kenneth Davidson, Neal Fann, Margaret Zawacki, Charles Fulcher, and Kirk R. Baker, “The Recent and Future Health Burden of the U.S. Mobile Sector Apportioned by Source,” Environmental Research Letters, vol. 15, no. 7 (2020).
[2]Intermodal Surface Transportation Efficiency Act of 1991, Pub. L. No. 102-240, § 1008, 105 Stat. 1932 (codified as amended at 23 U.S.C. §§ 104; 149).
[3]All funding figures in this report are in nominal terms.
[4]These standards are known as National Ambient Air Quality Standards. Ozone itself is not directly emitted but created by reactions of precursor emissions, such as nitrogen oxides and volatile organic compounds. Particulate matter includes direct emissions of inhalable particles (PM10) and fine particulate matter (PM2.5), as well as particulate matter formed by reactions of precursor emissions from transportation such as nitrogen oxides. CMAQ projects must address emissions of at least one of the CMAQ-specified pollutants or its precursors, which we refer to as CMAQ pollutants. Beyond the pollutants specifically addressed by CMAQ, EPA also sets standards for lead, nitrogen dioxide, and sulfur dioxide.
[5]Clean Air Act, Pub. L. No. 90-148, 81 Stat. 485 (codified as amended 42 U.S.C. §§7401-7428).
[6]A metropolitan planning organization (MPO) is an organization that carries out transportation planning in an urbanized area with a population over 50,000. State DOTs can suballocate CMAQ funds to MPOs in their state to fund CMAQ projects. As set in statute, states and MPOs can fund a range of eligible projects with CMAQ.
[7]23 U.S.C. § 149 (i)(2)(A); 49 C.F.R. § 1.85 (2025). Federal Highway Administration, Congestion Mitigation and Air Quality Improvement Program, Cost-Effectiveness Tables Development and Methodology (Washington, D.C., Dec. 3, 2015), and Congestion Mitigation and Air Quality Improvement Program, 2020 Cost-Effectiveness Tables Update (Washington, D.C.: July 20, 2020).
[8]Infrastructure Investment and Jobs Act, Pub. L. No. 117-58 § 11516, 135 Stat. 429, 600-01 (2021).
[9]The states were California, Connecticut, Massachusetts, South Carolina, South Dakota, and Texas.
[10]We use the term “project category” only to refer to the 11 project categories FHWA uses in the CMAQ project database. After combining records based on unique project identification, our analysis included 9,318 projects. We removed 776 of those records as they had zero or negative CMAQ costs, resulting in 8,542 projects that we included in our analysis.
[11]These data on transfers are from a different source than data on funds used for CMAQ projects, including Surface Transportation Block Grant Program-eligible projects. The financial data on transfers are based on the year in which FHWA apportions funds, while the data on CMAQ projects are based on the year a state obligates the funds. Therefore, we cannot directly compare the amount of funds transferred to and from CMAQ to the amount of funds used on CMAQ-eligible projects, including funds used flexibly on STBG-eligible projects, in any given fiscal year.
[12]Federal Highway Administration, Congestion Mitigation and Air Quality Improvement (CMAQ) Program: 2020 Cost-Effectiveness Tables Update.
[13]We use the term “project type” only to refer to the 21 project types included in the 2020 cost-effectiveness tables. We excluded projects labeled as being a Surface Transportation Block Grant project (1,431, or 17 percent of all CMAQ projects), as these projects do not have to have an emissions benefit. As a result, we analyzed 7,111 funded CMAQ projects.
[14]We were unable to apply a project type for the following reasons: (1) the project (e.g., air quality awareness campaigns, purchases of street sweepers) was explicitly not included in a project type in the 2020 tables (17 percent), (2) the project lacked sufficient information to apply a project type (2 percent), and (3) the project information indicated that multiple project types could apply (1 percent).
[15]GAO, Standards for Internal Controls in the Federal Government, GAO‑14‑704G (Washington, D.C.: September 2014).
[16]For the purpose of this report, federal-aid highway formula programs is an umbrella term for a collection of formula programs authorized under 23 U.S.C. Chapter 1. In addition to CMAQ, the eight other federal-aid highway formula programs are the National Highway Performance Program, Surface Transportation Block Grant Program, Highway Safety Improvement Program, Railway-Highway Crossing Program, Metropolitan Planning Program, National Highway Freight Program, Carbon Reduction Program, and Promoting Resilient Operations for Transformative, Efficient, and Cost-Saving Transportation (PROTECT) Formula Program. These programs provide funding to states, based on formulas established in statute. Each of these formula programs have a different purpose and different permissible uses of funding. For example, the Highway Safety Improvement Program provides funding to achieve a significant reduction in traffic fatalities and serious injuries on all public roads.
[17]Infrastructure Investment and Jobs Act, §§ 11101(a)(1)(D), 11104(b), 11108(a)(2), Pub. L. No. 117-58, 135 Stat. 429, 443, 455, 461 (2021). In addition, the Infrastructure Investment and Jobs Act authorized approximately $2.7 billion for CMAQ in fiscal year 2026.
[18]Some pollutants, such as carbon monoxide, are directly emitted from sources including cars, trucks, and other motor vehicles. Other pollutants, such as ozone, form in the atmosphere when precursors—volatile organic compounds and nitrogen oxides—emitted from sources such as motor vehicles and refineries combine in the presence of sunlight.
[19]Pursuant to the Clean Air Act, EPA has established primary and secondary federal air quality standards for two different sizes of particulate matter: particulate matter less than or equal to 10 micrometers in diameter, known as PM10, and particulate matter less than or equal to 2.5 micrometers in diameter, known as PM2.5. Beyond the pollutants specifically addressed by CMAQ, EPA also sets federal air quality standards for lead, nitrogen dioxide, and sulfur dioxide.
[20]Also in 2023, 33 million people lived in counties with air quality levels that exceeded the federal air quality standards for PM2.5; 27 million lived in counties exceeding standards for PM10; and 200,000 lived in counties exceeding standards for carbon monoxide. (Because counties could have pollutant levels that exceed the federal standards for two or more pollutants, these numbers should not be totaled.) Environmental Protection Agency, Air Quality – National Summary, (Aug. 16, 2024).
[21]23 U.S.C. § 104(b).
[22]Since 2013, the CMAQ apportionment formula has been calculated based on ratios that carried forward a state’s relative share of annual CMAQ funding from past years. For example, a state’s current apportionment is based on that state’s share of fiscal year 2020’s CMAQ funding. The formula apportioning CMAQ prior to 2013 calculated funding for each state based on population of nonattainment and maintenance areas in the state and the extent to which the state met federal air quality standards for ozone, carbon monoxide, and particulate matter, among other factors.
[23]23 U.S.C. § 149(b).
[24]Federal Highway Administration, The Congestion Mitigation and Air Quality Improvement (CMAQ) Program Interim Program Guidance as Revised by the Infrastructure Investment and Jobs Act (Oct. 28, 2024).
[25]A state may suballocate some or all of its CMAQ funding to MPOs. Therefore, states vary in whether the state DOT, MPOs, or both are involved in selecting projects to support with CMAQ funds.
[26]The programming and use of funds for CMAQ projects must also meet the planning requirements in 23 U.S.C. §§ 134 and 135. In addition, according to FHWA, the Clean Air Act requires that FHWA and the Federal Transit Administration ensure timely implementation of transportation control measures in applicable state implementation plans that implement, maintain, and enforce federal air quality standards. Several transportation control measures (e.g., transit improvements, bike lanes, programs to control extended idling of vehicles) are eligible for CMAQ funds.
[27]23 § U.S.C. 149(k).
[28]23 U.S.C. § 149(g)(3).
[29]23 U.S.C. § 149(i)(2)(c).
[30]23 U.S.C. § 126. States that have a nonattainment or maintenance area for particulate matter must use 25 percent of funds for related projects. CMAQ apportionments are subject to a statutory set-aside for PM2.5 areas within that state. According to the 2024 CMAQ guidance, the funds eligible for transfer cannot come from the statutory PM2.5 set-aside. The guidance states this limitation gives meaning to both the statutory transfer language in Section 126 and to the PM2.5 priority established by Congress in 23 U.S.C. 149(k). States may transfer CMAQ funds to the following federal-aid highway formula programs: National Highway Performance Program, Surface Transportation Block Grant Program, Highway Safety Improvement Program, National Highway Freight Program, Carbon Reduction Program, and Promoting Resilient Operations for Transformative, Efficient, and Cost-saving Transportation (PROTECT) Formula Program.
[31]Similarly, any funds transferred from another program into CMAQ become subject to the requirements of CMAQ. National Academies of Sciences, Engineering, and Medicine, Federal Funding Flexibility: Use of Federal-Aid Highway Fund Transfers by State DOTs (Washington, D.C.: 2022).
[32]States with such funds can use those funds for projects that would otherwise be eligible in nonattainment or maintenance areas but in any location within the state.
[33]All states receive a minimum amount of funding (e.g., “minimum apportionment”) regardless of whether the state has a nonattainment or maintenance area. The portion of flexible funds is initially determined by multiplying the ratio described in 23 U.S.C. § 149(d)(2)(B) by the CMAQ amount apportioned to the state under 23 U.S.C. § 104(b)(4) after deducting the set-asides for PM2.5 and state planning and research. According to FHWA guidance, this ratio is, essentially, the amount of fiscal year 2009 CMAQ funding each state was permitted to spend on STBG-eligible projects relative to the state’s total amount of fiscal year 2009 CMAQ funding, as in effect on September 30, 2012. Then, the portion of flexible funds is adjusted to account for changes in nonattainment and maintenance designations. 23 U.S.C. § 149(d)(3).
[34]CMAQ funds that are used for transit projects can be transferred to and administered by the Federal Transit Administration. FHWA guidance notes that the Federal Transit Administration administers most CMAQ transit projects and should be consulted on questions about transit project eligibility for CMAQ.
[35]Federal Highway Administration, The Congestion Mitigation and Air Quality Improvement (CMAQ) Program Interim Program Guidance as Revised by the Infrastructure Investment and Jobs Act.
[36]Division offices are to consult with Federal Transit Administration and EPA regional offices as well as FHWA and Federal Transit Administration headquarters offices as needed on eligibility determinations and other aspects of CMAQ program oversight when necessary. According to FHWA, division offices also oversee state DOT and MPO planning processes as part of their broader oversight of states use of formula funds. While Puerto Rico does not receive CMAQ funding, FHWA also has a division office in Puerto Rico.
[37]Statute requires FHWA to develop and maintain a cumulative database of all CMAQ projects. 23 U.S.C. § 149(i)(1). According to FHWA officials, FHWA’s CMAQ project database includes all CMAQ projects that states approve through their CMAQ project selection process, including transit projects funded by CMAQ and administered by the Federal Transit Administration.
[38]FHWA’s CMAQ project database tracks STBG-eligible projects funded by CMAQ, but those records do not always include all data fields, including estimated emissions reductions, because those projects are not required to reduce emissions of CMAQ pollutants. The database does not include any data on projects funded by federal-aid highway formula programs using funds transferred from CMAQ.
[39]The database also includes a category for STBG-eligible projects. Because those projects are not necessarily CMAQ-eligible and may not reduce the emissions of CMAQ pollutants, we do not consider that category as part of this analysis. If STBG-eligible projects are included, STBG-eligible projects would represent the third largest share of CMAQ projects (17 percent) and fourth largest share of costs (10 percent). This analysis also does not include funds, and projects supported with those funds, transferred out of CMAQ to other federal-aid highway formula programs. Our analysis of CMAQ project costs only includes project costs supported by CMAQ, and not from other sources, although FHWA’s CMAQ project database also includes data on non-CMAQ project costs.
[40]Prior to 2015, a 2014 study found that between fiscal years 2006 and 2012, the majority of CMAQ projects were also in these three categories. Federal Highway Administration, Air Quality and Congestion Mitigation Measure Outcomes Assessment Study: Summary Report of Findings, FHWA-HEP-15-008 (Washington, D.C., Sept. 2014).
[41]Our analyses reported in this section generally do not include CMAQ funds transferred to other programs and do not include STBG-eligible projects. Because projects can span multiple years, our analysis considers projects only in the year in which they were first funded. We summed costs and estimated emissions reductions across all years for each individual project. When we report on projects by fiscal year, we are reporting on projects that were first funded in that fiscal year. Including STBG-eligible projects, the number of projects and the costs for those projects followed a similar trend over time. In fiscal year 2015 there were a total of 1,182 projects with total costs of $2 billion and in fiscal year 2023 there were a total of 698 projects with total costs of $1.1 billion.
[42]Our analysis is based on the fiscal year of apportionment of funds. States have up to 3 years after the end of the fiscal year in which CMAQ funds are apportioned to obligate or transfer those funds. Therefore, funds apportioned to states in the later years of our analysis may be transferred in the future. Data on transfers are from a different source than data on use of funds for CMAQ-eligible and STBG-eligible projects. Therefore, we cannot directly compare the amount of funds transferred to the amount of funds used for CMAQ- or STBG-eligible funds in any given fiscal year.
[43]Excluding states that did not transfer any funds, the total amounts transferred by states during these years ranged from $0.3 million to $317 million. The amounts can vary widely within percentage ranges. For example, among states that transferred more than 10 and less than 20 percent of their apportionments, one state had total apportionments of $119 million while another had total apportionments of $1.8 billion during fiscal years 2015 through 2024.
[44]National Academies of Sciences, Engineering, and Medicine, Federal Funding Flexibility: Use of Federal-Aid Highway Fund Transfers by State DOTs.
[45]These percentages are for CMAQ project costs after accounting for transfers to other federal-aid highway formula programs. Because we conducted this analysis at the project level and summed project costs across all years of their funding, the total costs in any given year may not match the total apportionment of CMAQ funds for that year. In addition, these data on CMAQ project costs are from a different source than data on transfers. Therefore, we cannot directly compare the amount of funds used on STBG-eligible projects to the amount of funds transferred from CMAQ in any given fiscal year.
[46]State DOTs and MPOs report CMAQ data annually to FHWA’s database of CMAQ projects. According to FHWA’s reporting guidance, state DOTs and MPOs must report an estimated reduction in emissions for at least one CMAQ pollutant for each CMAQ project and can report reductions for up to all five CMAQ pollutants. The estimated pollutant emissions reduction is for the first year of a project and not over the lifetime of the project. However, if a state DOT or MPO determines that the project expects additional emissions reductions in future years due to a change in project scope, the state DOT or MPO could report those additional emissions reductions. In addition, the estimated emissions for projects include emissions for the entire project, not just the CMAQ-funded part of the project. If emissions reductions are difficult to estimate, states can report qualitative emissions reduction. The percent of projects that only reported qualitative benefits varied by pollutant between 6 percent for PM10 and 7.5 percent for PM2.5 and volatile organic compounds. This analysis includes projects that estimate an emissions reduction and those that report qualitative benefits.
[47]Our analysis of the emissions addressed by CMAQ pollutants does not include CMAQ funds transferred to other FHWA programs or used for STBG-eligible projects. A 2014 study also found that between fiscal years 2006 and 2012, CMAQ projects most frequently reduced emissions of volatile organic compounds and nitrogen oxides. Federal Highway Administration, Air Quality and Congestion Mitigation Measure Outcomes Assessment Study.
[48]In 2023, more than 126 million individuals lived in counties where ozone levels exceeded federal air quality standards. Environmental Protection Agency, Air Quality – National Summary. In addition, nitrogen oxides are also a precursor for PM2.5. Therefore, reducing nitrogen oxides can also help reduce PM2.5 emissions.
[49]By law, CMAQ addresses emissions for three criteria air pollutants—carbon monoxide, ozone, and particulate matter. As a result, neither FHWA (in the CMAQ project database) nor any state DOTs we interviewed track the extent to which CMAQ projects reduce emissions of sulfur dioxide, nitrogen dioxide, or lead, which are the other criteria air pollutants established by EPA under the Clean Air Act not specifically addressed by CMAQ. While states may estimate the reductions of nitrogen oxides of CMAQ projects, they do not specifically report estimated reductions in emissions of nitrogen dioxide—a type of nitrogen oxide. In addition, according to EPA officials, lead and sulfur are generally not present in transportation fuel, and therefore transportation sources generally do not emit lead and sulfur dioxide.
[50]The estimated reductions in emissions are not comparable across the individual pollutants. For example, according to EPA, human-made carbon monoxide is emitted at quantities roughly 30 times greater than human-made PM2.5. As a result, the same amount of reductions of carbon monoxide and PM2.5 represent different percentages of reductions in terms of total emissions of each pollutant. In addition, according to EPA, the health benefits of similar reductions of different pollutants can differ.
[51]The Infrastructure Investment and Jobs Act included a provision for GAO to review, among other things, the results of investments under CMAQ in minority and low-income communities that are disproportionally affected by ozone, carbon monoxide, and particulate matter. Infrastructure Investment and Jobs Act, Pub. L. No. 117-58 § 11516, 135 Stat. 429, 600-01 (2021). The Department of Transportation carried out its analysis of CMAQ funds as part of Justice40, an initiative established under Executive Order 14008 in January 2021. Justice40 sought to deliver 40 percent of the benefits from certain covered federal programs to disadvantaged communities affected by environment, health, and economic challenges. Exec. Order No. 14008, 86 Fed. Reg. 7,619 (Jan. 27, 2021). The Department of Transportation and the Office of Management and Budget defined disadvantaged communities as those that were historically marginalized, underserved, and overburdened by pollution. The Department of Transportation calculated this percentage by determining if projects were located in counties where (1) 50 percent or more of Census tracts in the county are disadvantaged or (2) 50 percent or more of the county’s population lives in disadvantaged Census tracts. FHWA’s CMAQ project database does not include location data specific enough to analyze location in disadvantaged communities. Executive Order 14008 was rescinded in January 2025. Exec. Order No. 14154, 90 Fed. Reg. 8,353 (Jan. 29, 2025).
[52]The Infrastructure Investment and Jobs Act requires some states to prioritize projects reducing emissions of PM2.5 in disadvantaged communities or low-income populations living in, or immediately adjacent to, such area to the extent practicable. Infrastructure Investment and Jobs Act, Pub. L. No. 117-58 § 11115, 135 Stat. 481 (2021)(as codified 23 U.S.C. § 149(k)).
[53]State DOTs and MPOs may have different definitions and criteria for defining and identifying disadvantaged communities. Three other state DOTs and two other MPOs we interviewed stated they do not consider disadvantaged communities when selecting CMAQ projects. We also interviewed five other state DOTs and one other MPO that do not have a direct role in selecting CMAQ projects.
[54]FHWA established national performance measures for CMAQ and other FHWA programs to support national performance goals for seven areas, including congestion reduction and environmental sustainability. FWHA established these performance measures as part of its Transportation Performance Management efforts, which use performance goals, measures, and data for states to make informed decisions about investing transportation funding.
[55]Statute required the Department of Transportation to establish performance measures for on-road mobile source emissions and traffic congestion (23 U.S.C. § 150(c)(5)). The Department of Transportation established the three performance measures for some state DOTs and MPOs in regulation (23 C.F.R. Part 490). Specifically, state DOTs and MPOs with CMAQ-funded projects in nonattainment or maintenance areas for ozone, carbon monoxide, or particulate matter must establish performance requirements for emissions for each applicable CMAQ pollutant within the boundaries of that area. State DOTs and the MPOs that include an urbanized area that is not in attainment or is in maintenance of federal air quality standards for CMAQ pollutants must establish a single target for each traffic congestion measure that applies to the area. Here, urbanized areas are areas that (1) meet population thresholds as designated by the Census Bureau—specifically a population of over 1 million in the first reporting period and a population of over 200,000 for subsequent reporting periods and (2) have a highway that is part of the National Highway System, which consists of the interstate system, non-interstate highways, and other public roads. For a list of states and MPOs that must establish targets and report performance, see Federal Highway Administration, Applicability Determination: CMAQ Traffic Congestion and CMAQ On-Road Mobile Source Emissions Measures. (Oct. 1, 2023).
[56]The first reporting period was October 1, 2017, through September 30, 2021, for the emissions measure and January 1, 2018, through December 31, 2021, for the traffic congestion measures. The second reporting period is October 1, 2021, through September 30, 2025, for the emissions measure and January 1, 2022, through December 31, 2025, for the traffic congestion measures. We did not present data for the second reporting period because state DOTs and MPOs had not yet reported complete data for this period at the time of our review.
[57]Fifty-nine percent and 94 percent of urbanized areas met the 2-year and 4-year targets, respectively, for percent of non-single occupancy vehicle travel. State DOTs and MPOs were not required to report 2-year targets for annual hours of peak hour excessive delay per capita for their urbanized areas. Ninety-one percent met the 4-year targets for annual hours of peak hour excessive delay per capita.
[58]Federal Highway Administration, Cost-Effectiveness Tables Development and Methodology, and Federal Highway Administration, 2020 Cost-Effectiveness Tables Update.
[59]23 U.S.C. § 149 (i)(2)(C).
[60]In addition, according to EPA, because the benefits of the same emission reduction vary across pollutants, it is preferable to calculate cost effectiveness on individual pollutants only.
[61]Specifically, about 17 percent of projects in FHWA’s CMAQ project database did not fall under any of the 21 project types. The 21 project types are different from the 11 project categories in FHWA’s CMAQ project database. See appendix II for lists of the project types and project categories.
[62]The 2020 tables classify projects with strong cost effectiveness as those that cost less than $2.8 million per ton of emissions reduced across all CMAQ pollutants, mixed cost-effectiveness as those that cost between $2.8 and $8.8 million per ton of emissions reduced across all CMAQ pollutants, and weak as those costing $8.8 million or more per ton across all CMAQ pollutants.
[63]We excluded projects labeled as being a STBG-eligible projects (about 1,431, or 17 percent of all CMAQ projects) as these projects do not have to have an emissions benefit. As a result, we analyzed about 7,111 funded CMAQ projects. We excluded CMAQ funds transferred to other FHWA programs because FHWA’s CMAQ database does not include data on the use of such funds.
[64]The project categories FHWA uses in its CMAQ project database differ from the 21 project types in the 2020 tables. See appendix II. We applied the most relevant project type from the 2020 tables to each project in FHWA’s CMAQ project database by reviewing the project category, title, and description in that database. In some instances, we were unable to apply a project type from the 2020 tables. We excluded those projects (about 20 percent of all projects after removing STBG-eligible projects) from this analysis. Specifically, we were unable to apply a project type to 2 percent of projects because their records did not have sufficient information to determine a relevant project type. We did not apply a project type to 1 percent of projects because, based on the information in the database, multiple project types could equally apply. Finally, we did not apply a project type to 17 percent of projects because the funded projects—such as air quality awareness campaigns or purchases of street sweepers—were not of a project type included in the 2020 tables.
[65]For this analysis, we applied FHWA’s cost-effectiveness ratings by pollutant to CMAQ projects from fiscal years 2015 through 2023 based on the targeted pollutants for each project. We determined the targeted pollutants for each project and then applied the relevant rating from the 2020 tables based on the project type and those targeted pollutants. When a project reported emissions reductions for only one or two pollutants, we considered that the project targeted those pollutants. For projects that reported reductions for more than two pollutants, we used the pollutants with the two largest emissions reductions. For our analysis, we considered letters A – C to represent high, D – F to represent medium, and G – I to represent low cost effectiveness.
[66]While the tables report on the cost effectiveness for each project type based on a median value, within each project type there will be a range of cost effectiveness for individual projects.
[67]Federal Highway Administration, The Congestion Mitigation and Air Quality Improvement (CMAQ) Program Interim Program Guidance (2024).
[68]The other state DOTs and one MPO we interviewed generally did not have a role selecting CMAQ projects.
[69]One other state DOT we interviewed does not explicitly consider cost effectiveness during its CMAQ evaluation and selection process. None of the four other state DOTs we interviewed select CMAQ projects because either MPOs make all such decisions, or they use all their CMAQ apportionment on STBG-eligible projects. However, one of those state DOTs requires MPOs in the state to consider cost effectiveness when selecting projects.
[70]FHWA had posted the newsletters on its website and most recently published the newsletter for September/October 2024. The website for the bimonthly newsletter was no longer available as of February 2025.
[71]The prior interim guidance—that FHWA developed in 2013—does not mention the toolkit, since FHWA first released it in 2016. Federal Highway Administration, The Congestion Mitigation and Air Quality Improvement Program Interim Program Guidance Under the Moving Ahead for Progress in the 21st Century Act (November 12, 2013).
[72]The 2013 interim guidance discussed the statutory requirement for FHWA to develop the tables, which it did in 2015.
[73]GAO‑14‑704G. Principle 15.
[74]In addition, FHWA officials stated that since 2020 FHWA has responded on an ad hoc basis to inquiries from state DOTs and MPOs on using the tables. However, because this communication requires state DOTs and MPOs to request information from FHWA, we do not consider it to be ongoing communication.
[75]As previously noted, statute requires state DOTs and MPOs to consider the information in the cost-effectiveness tables but does not specify that they must use them. State DOTs may use other tools to evaluate cost effectiveness. In our survey, six state DOTs reported using a method beyond the FHWA tables when evaluating the cost effectiveness of projects.
[76]When analyzing use of CMAQ funds, data on funds used for CMAQ projects, including STBG-eligible projects, are from a different source than data on transfers described above. The financial data on transfers are based on the year in which FHWA apportions funds and the CMAQ project data are based on the year a state obligates the funds. Therefore, we cannot directly compare the amount of funds used on CMAQ-eligible projects, including flexible funds on STBG-eligible projects, to the amount of funds transferred from CMAQ in any given fiscal year.
[77]We did not include in our analysis any projects that first received funding prior to fiscal year 2015, even if they had data for subsequent fiscal years.
[78]In the report, we use the term “project category” only to refer to the 11 project categories FHWA uses in the CMAQ project database.
[79]The percent of projects that only reported qualitative benefits varies by pollutant between 6 percent for PM10 and 7.5 percent for both PM2.5 and volatile organic compounds.
[80]The first reporting period was October 1, 2017, through September 30, 2021, for the performance measure related to emissions and January 1, 2018, through December 31, 2021, for the two measures related to traffic congestion measures.
[81]Justice40, an initiative established by Executive Order 14008 in January 2021, sought to deliver 40 percent of the overall benefits from certain covered federal programs to disadvantaged communities affected by environment, health, and economic challenges. Exec. Order No. 14008, 86 Fed. Reg. 7,619 (Jan. 27, 2021). Executive Order 14008 was rescinded in January 2025. Exec. Order No. 14154, 90 Fed. Reg. 8,353 (Jan. 29, 2025).
[82]Federal Highway Administration, Congestion Mitigation and Air Quality Improvement (CMAQ) Program: 2020 Cost-Effectiveness Tables Update (Washington, D.C., July 20, 2020).
[83]For the cost-effectiveness tables, FHWA acknowledges that projects are typically selected based on their effectiveness at reducing specific pollutants, rather than across all pollutants. In addition, according to EPA, because the benefits of the same emission reduction vary across pollutants, it is preferable to calculate cost effectiveness on individual pollutants only.
[84]In the report, we use the term “project type” only to refer to the 21 project types included in the 2020 cost-effectiveness tables.
[85]If any given project had the same emissions reduction value for three or more pollutants, we excluded that project from our analysis. There were 66 projects that we excluded from our analysis for this reason.
[86]GAO, Standards for Internal Control in the Federal Government, GAO‑14‑704G (Washington, D.C.: September 2014).
[87]In the survey questions, the terms “emissions calculator toolkit” and “emissions calculators” are interchangeable.