MEDICAID AND CHILDREN’S HEALTH INSURANCE
Disenrollments After COVID-19 Varied Across States and Populations
Report to Congressional Committees
United States Government Accountability Office
View GAO-25-107413. For more information, contact Michelle B. Rosenberg at RosenbergM@gao.gov
Highlights of GAO-25-107413, a report to congressional committees
mEDICAID AND Children’s health insurance
Disenrollments After COVID-19 Varied Across States and Populations
Why GAO Did This Study
Continuous enrollment during the COVID-19 public health emergency, which largely paused disenrollments, contributed to Medicaid and CHIP growing from 71 million enrollees in February 2020 to 94 million enrollees in March 2023—an increase of more than 30 percent.
During unwinding, some people were expected to be disenrolled either because they were no longer eligible or because of procedural reasons, such as not returning information necessary to determine their eligibility. States are required to report data on redetermination outcomes during unwinding to CMS. CMS has used the data to monitor, for example, how many people were disenrolled or had their coverage renewed.
The CARES Act includes a provision for GAO to report on the federal response to the COVID-19 pandemic. This report describes (1) the results of CMS’s analyses of unwinding outcomes, and (2) the extent to which selected states identified differences in unwinding outcomes across population characteristics.
GAO reviewed CMS analyses, such as analyses of state-reported data on eligibility redeterminations scheduled for completion from March 2023 through June 2024, some of which were completed through September 2024. GAO also interviewed CMS officials. GAO also reviewed information from five states—Arizona, Maryland, Montana, New York, and Wisconsin—selected to capture a mix of program size and geographic diversity.
What GAO Found
During the COVID-19 public health emergency, Congress provided temporary additional federal funding to states to keep Medicaid and most Children’s Health Insurance Program (CHIP) enrollees continuously enrolled. In April 2023, states began resuming full eligibility redeterminations for the millions of enrollees who had been continuously enrolled, including disenrolling those no longer eligible or who did not submit all required information—a process known as “unwinding.” States are to complete unwinding redeterminations by the end of 2025.
The Centers for Medicare & Medicaid Services (CMS) found that, of the 89 million completed redeterminations by states, about 27 million individuals were disenrolled during the first year and a half of unwinding. Enrollment nationwide was around 79 million as of October 2024, about 10 percent higher than prior to the pandemic. CMS also found significant variation across states in the percentage of individuals disenrolled during unwinding, with a number of factors potentially contributing to those differences.
Percentage of Completed Redeterminations That Resulted in Disenrollments, by State, March 2023-September 2024
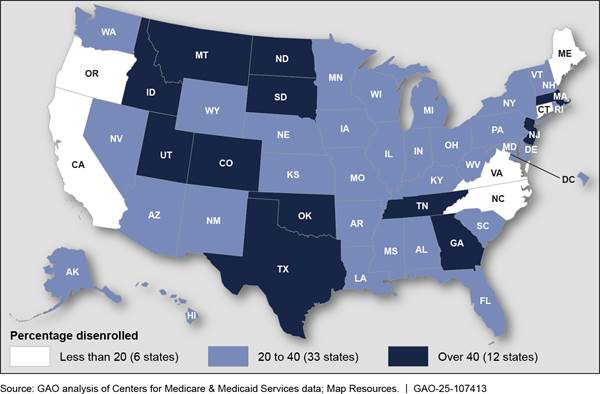
Note: For more details, see fig. 4 in GAO-25-107413.
CMS and selected states identified certain populations that may have been disenrolled more frequently than others. For example, CMS and two states found that certain young adults were the most likely to be disenrolled when compared to other groups. CMS officials said young adults could have become ineligible because they aged out of child-specific eligibility groups, which generally allow for higher income than eligibility groups for adults who are under the age of 65 and who do not have a disability.
Abbreviations
|
CHIP |
Children’s Health Insurance Program |
|
CMS |
Centers for Medicare & Medicaid Services |
|
MAGI |
Modified adjusted gross income |
This is a work of the U.S. government and is not subject to copyright protection in the United States. The published product may be reproduced and distributed in its entirety without further permission from GAO. However, because this work may contain copyrighted images or other material, permission from the copyright holder may be necessary if you wish to reproduce this material separately.
June 24, 2025
Congressional Committees
During the COVID-19 public health emergency, Medicaid and the Children’s Health Insurance Program (CHIP) played a key role in providing access to health care services.[1] Medicaid and CHIP are health care programs that are jointly financed by the federal government and states. In fiscal year 2023, total federal and state spending was about $890 billion for Medicaid and about $23 billion for CHIP. Congress temporarily provided additional federal funds to state Medicaid programs so that enrollees could maintain their health care coverage during the public health emergency.[2] This provision also helped maintain enrollment in CHIP in states that operate CHIP as an expansion of Medicaid.[3] To receive the temporarily increased federal funding, states were required to keep enrollees continuously enrolled in Medicaid, including children enrolled in states’ Medicaid-expansion CHIP programs.[4] In this report, we refer to this temporary continuous enrollment condition as “continuous enrollment.”
Typically, states redetermine enrollees’ eligibility annually and disenroll them if no longer eligible or if they do not complete the process. Under continuous enrollment, however, states were to pause disenrollments except in limited circumstances. This contributed to an increase in Medicaid and CHIP enrollment from a combined 71 million enrollees in February 2020 to 94 million enrollees in March 2023—an increase of more than 30 percent.
The Consolidated Appropriations Act, 2023, ended the continuous enrollment period effective March 31, 2023, and required states to resume full eligibility redeterminations, including disenrollments.[5] This transition from continuous enrollment is known as “unwinding.” As part of unwinding, states were redetermining eligibility for, and taking action to renew or disenroll, most of their enrollees. States were given flexibility in completing unwinding redeterminations, including how quickly they completed the process. Some states were continuing to complete unwinding redeterminations as of March 2025, according to officials from the Centers for Medicare & Medicaid Services (CMS), the federal agency that oversees Medicaid and CHIP.[6]
It was expected that some individuals who were continuously enrolled during the public health emergency were no longer eligible and would therefore be disenrolled during unwinding. For example, some individuals could have obtained new employment that increased their income above income thresholds or had another change in circumstance that affected their eligibility. It was also expected that some individuals would be disenrolled for procedural reasons, such as not submitting needed information, despite remaining eligible. Additionally, certain populations may be more likely to be disenrolled, despite remaining eligible, than others. For example, the federal government estimated that about 52 percent of Latino individuals disenrolled during unwinding would still be eligible for Medicaid compared to 40 percent of White non-Latino individuals.[7] Whether individuals who were disenrolled transition to other health care coverage, churn back to Medicaid or CHIP, or become uninsured could have implications for those individuals’ health outcomes and for federal and state spending.[8]
The Consolidated Appropriations Act, 2023, required states to report data on unwinding outcomes, including renewals and disenrollments, to CMS monthly.[9] States began reporting data on unwinding outcomes to CMS beginning with redeterminations completed in March 2023.[10] The agency has used these data to monitor states’ redetermination processes and has made the monthly data and related analyses public.[11] States were not required to report outcomes by enrollee population characteristics, but some states opted to analyze and publish such data.
The CARES Act includes a provision for us to report on the federal response to the COVID-19 pandemic.[12] This report describes
1. the results of CMS’s analyses of the outcomes of unwinding, and
2. the extent to which selected states have identified differences in unwinding outcomes across population characteristics.
To describe the results of CMS’s analyses of the outcomes of unwinding, we reviewed analyses published from July 2023 through January 2025. This included state-reported outcomes data CMS analyzed and published as well as agency calculations based on that data, such as calculations of total disenrollments and percentages of redeterminations that resulted in renewals and disenrollments. We focused our review on CMS data updated by states and published by CMS in January 2025, the most recent updated data available at the time of our review.[13] These data include unwinding redeterminations completed from March 2023 through September 2024.[14] We used those data to determine the percentage of completed redeterminations that resulted in (1) renewals or (2) disenrollments, removing the pending cases included in CMS’s calculations. (See appendix I for more information on these data.)
We also reviewed published analyses for which CMS used other data sources, including analyses of changes in net enrollment, redetermination outcomes by eligibility and age groups, and transitions to other health care coverage after disenrollment. In addition to reviewing published analyses, we reviewed some non-public CMS analyses. These analyses were limited by available data, and as a result, reflect different time periods during unwinding. We also interviewed agency officials about factors driving variation in outcomes across states and different populations and the agency’s plans for any additional analysis.
To describe the extent to which selected states have identified differences in unwinding outcomes across population characteristics, we reviewed documents and data and interviewed Medicaid officials from five states: Arizona, Maryland, Montana, New York, and Wisconsin. We selected these states to capture a mix of program size, geographic diversity, progress in completing unwinding eligibility redeterminations, and public reporting of unwinding outcomes by population characteristics. We reviewed publicly available state data and analyses of unwinding outcomes by age, geography, race and ethnicity, and other population characteristics, when available, as well as additional data states provided to us on redeterminations, renewals, and disenrollments, when available. We used the data to determine the percentage of completed redeterminations, by population characteristics, that resulted in (1) renewals or (2) disenrollments. When reporting on state-identified differences in unwinding outcomes by population characteristics, we used the categories the states used in their data and analyses.[15]
We assessed the reliability of CMS data on unwinding outcomes by reviewing agency documentation, interviewing CMS officials, and reviewing the data for internal consistency. We assessed the reliability of outcomes data from selected states by reviewing state documentation, interviewing state officials, and reviewing the data for internal consistency. We determined that the federal and state data included in this report were sufficiently reliable for the purposes of our reporting objectives.
We conducted this performance audit from February 2024 to June 2025 in accordance with generally accepted government auditing standards. Those standards require that we plan and perform the audit to obtain sufficient, appropriate evidence to provide a reasonable basis for our findings and conclusions based on our audit objectives. We believe that the evidence obtained provides a reasonable basis for our findings and conclusions based on our audit objectives.
Background
Medicaid and CHIP are health care programs jointly financed by the federal government and states. States receive matching funds from the federal government for their Medicaid and CHIP programs.
Medicaid and CHIP Eligibility and COVID-19
The federal government sets minimum eligibility criteria for Medicaid and CHIP, and states have flexibility to expand eligibility to cover additional individuals. As a result, eligibility criteria vary across states.
To qualify for Medicaid coverage, individuals generally must fall within certain categories or groups of individuals such as children, pregnant women, or individuals with disabilities, and meet the eligibility criteria applicable within their state. Those criteria include, for example, having income below specified levels or having significant health care needs.[16] For certain groups, such as those needing long-term services and supports, states consider both income and an individual’s assets in assessing eligibility.[17] Some individuals are eligible for full Medicaid benefits and others for limited benefits. For example, benefits for certain individuals may be limited to certain services, such as family planning, or care provided for a specific condition like tuberculosis.
To qualify for CHIP, individuals must also fall into certain groups such as children under 19 or pregnant women and meet eligibility criteria applicable to the state. This includes having income below a specified level and, for certain CHIP programs, not having other health insurance coverage. In contrast to Medicaid, which has both full and limited benefit coverage, there is no limited benefit coverage in CHIP.
Typically, states must redetermine eligibility for Medicaid enrollees on an annual basis and disenroll those who are no longer eligible. During the COVID-19 public health emergency, however, states were generally required to keep individuals continuously enrolled in Medicaid to receive a temporary increase in federal matching funds. States that operated CHIP as an expansion of Medicaid were also required to keep individuals continuously enrolled.[18] During the continuous enrollment condition, states could continue redetermining eligibility, but they could not disenroll Medicaid enrollees, including those enrolled in states’ Medicaid-expansion CHIP programs, except in limited circumstances. These limited circumstances included if the individual asked to be disenrolled, moved out of state, or died. While most states continued redetermining eligibility during the public health emergency, other states paused those activities.
Medicaid and CHIP Eligibility Redeterminations During Unwinding
During unwinding, states were generally required to redetermine the eligibility of all individuals who had been continuously enrolled during the COVID-19 public health emergency, including both those with full and limited benefit coverage. According to CMS data published in January 2025, states had completed 89 million eligibility redeterminations as part of unwinding.[19]
The redetermination process results in one of two outcomes: renewal or disenrollment, the latter of which terminates coverage (see fig. 1). States must first attempt to use available reliable information to redetermine eligibility, a process called “ex parte.” For example, this could include using income information from the state’s Supplemental Nutrition Assistance Program. If there is sufficient information for the state to renew eligibility, the state must do so. If not, the state must seek additional information from the enrollee.[20] If the person does not respond within required time frames or is otherwise determined ineligible, the state must disenroll them, which terminates coverage.[21] Disenrollment due to lack of response is referred to as a procedural disenrollment. These disenrollments could include both individuals who may still be eligible for Medicaid and CHIP as well as those who were not.
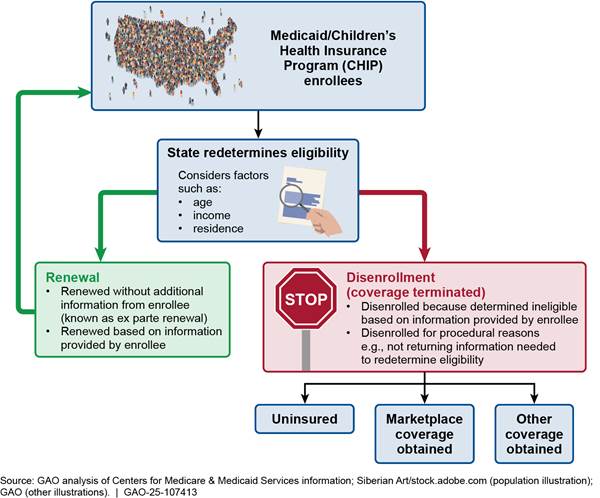
Note: Marketplaces are state and federal health insurance exchanges established through the Patient Protection and Affordable Care Act. Some individuals who purchase health insurance coverage through a marketplace may be eligible for federal premium tax credits. “Other coverage” can include, for example, employer-sponsored insurance or, if eligible, Medicare.
After disenrollment, an individual could transition to another form of health care coverage or become uninsured. For example, they could enroll in employer-sponsored coverage; get coverage through a state or federal health insurance exchange (referred to as a marketplace); or churn back to Medicaid or CHIP (if eligible) after a temporary gap in coverage.[22] Prior to disenrollment, states are required to take certain steps to assess eligibility for and transfer information on certain individuals no longer eligible for Medicaid and CHIP to certain other health programs. For example, states may transfer information to marketplaces—which allow individuals to shop for and enroll in private health coverage—to determine individuals’ eligibility for federal premium tax credits.
Redetermining Medicaid and CHIP eligibility is complex for states to administer due to the different criteria that apply for different eligibility groups and the federal requirements that the eligibility determination process must meet. To protect enrollees from erroneous termination and reduce state administrative burden when redetermining Medicaid and CHIP eligibility, CMS provided states with temporary flexibilities during unwinding. For example, upon state request, CMS provided temporary waivers authorized under section 1902(e)(14) of the Social Security Act—also referred to as e(14) waivers—of certain eligibility verification and redetermination requirements.[23] CMS approved one or more flexibilities in nearly all states. Some of the most common flexibilities related to how states verify income and asset information and update enrollees’ contact information. However, the flexibilities sought varied across states.
We previously reported that the first year of unwinding revealed a number of issues with state redetermination processes, including areas where states were not complying with federal redetermination requirements, which sometimes resulted in erroneous disenrollments.[24] At times during unwinding, states have opted to delay procedural disenrollments or been required by CMS to pause procedural disenrollments while working to come into compliance with requirements.[25]
CMS Monitoring of Outcomes
|
Examples of Unwinding Monthly Data Reporting Requirements for States · Total number of renewals · Number of renewals made without additional information from the enrollee (i.e., ex parte renewals) · Total number of enrollees disenrolled · Number of enrollees disenrolled for procedural reasons, such as not providing information requested by the state Source: GAO summary of Centers for Medicare & Medicaid Services information. | GAO‑25‑107413 |
The Consolidated Appropriations Act, 2023, required states to report certain eligibility redetermination outcomes to CMS starting on April 1, 2023.[26] These outcomes included, for example, the number and type of renewals and disenrollments as well as transitions to marketplace coverage. While states had previously reported data on Medicaid and CHIP applications and enrollment, they began reporting new data on redetermination outcomes. During unwinding, CMS used the newly reported outcomes data to monitor states’ redetermination efforts. In addition to using the data to inform technical assistance to states, CMS used them to perform national analyses.
CMS began posting the unwinding outcomes data publicly in July 2023. During unwinding, the agency also posted a number of national snapshots and other analyses leveraging the data reported by states. Although the act’s reporting requirements ended on June 30, 2024, CMS issued guidance in May 2024, extending certain reporting requirements indefinitely and notifying states that the agency intended to continue monitoring and publicly sharing eligibility redetermination outcome data.[27] CMS has also published several analyses using those data and other data states report to CMS, such as eligibility and enrollment data reported through its Transformed Medicaid Statistical Information System.
State Monitoring of Outcomes
States generally have discretion in how they monitor unwinding outcomes. While states must report summary data on outcomes to CMS, such as the total number of renewals, CMS did not require states to analyze or report data on outcomes by age, race and ethnicity, geographic location or other population characteristics. However, some states have opted to do so and have made such outcomes data public.
CMS Analyses Showed Enrollment Nationwide Declined During Unwinding but Remained Higher than Pre-Pandemic Levels
Although about 27 million individuals were disenrolled during the first year and a half of unwinding, enrollment nationwide remained higher than before the COVID-19 pandemic, according to analyses conducted by CMS. In addition, the percentage of individuals disenrolled varied significantly across states from 8 percent to 53 percent of those for whom redeterminations were completed. CMS’s analyses also provided some insight into how unwinding outcomes varied by age and eligibility group.
CMS Data Indicate About 27 Million Individuals Were Disenrolled During Unwinding
CMS data indicate that of the 89.0 million redeterminations completed during unwinding, 26.8 million individuals (30 percent) were disenrolled from Medicaid or CHIP from March 2023 through September 2024.[28] About 62 million individuals (70 percent of those with completed redeterminations) had their coverage renewed. The 26.8 million disenrollments represent a significant increase from the preliminary data on disenrollments reported by CMS in September 2024. At that time, the total number of disenrollments reported was 20.8 million. The difference was due, at least in part, to a larger number of pending redeterminations in the preliminary data.
Although 26.8 million individuals were disenrolled during unwinding from March 2023 through September 2024, enrollment nationwide across Medicaid and CHIP declined by only 14.7 million, from 94.0 million to 79.3 million. In addition, enrollment nationwide remained higher than pre-pandemic levels as of October 2024.[29] (See fig. 2.)
Figure 2: Comparison of Medicaid and Children’s Health Insurance Program Enrollment Nationwide—Pre-Pandemic, Pre-Unwinding, and as of October 2024
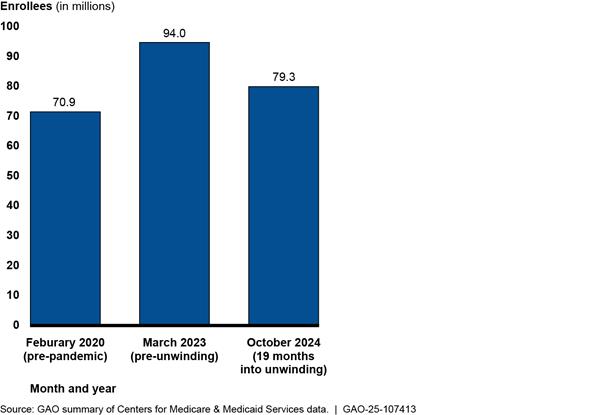
Note: Medicaid enrollment only includes enrollees with full benefit coverage. It does not include those with limited benefit coverage. Pre-unwinding refers to the month prior to when disenrollments after the continuous enrollment period could begin taking effect. Disenrollments take effect in the month after they are determined (e.g., September disenrollments take effect in October). As a result, October 2024 enrollment reflects disenrollments through September 2024.
CMS attributed the difference between total disenrollments and the decline in enrollment nationwide to several different factors. For example, officials noted that enrollment nationwide reflects new enrollees, churn back into Medicaid or CHIP, and reinstatements for individuals erroneously disenrolled during unwinding.[30] In addition, certain policy changes may have also increased enrollment during this time period. For example, North Carolina expanded Medicaid eligibility to certain low-income adults in 2023, and its enrollment increased during unwinding. The difference between total disenrollments and the decline in enrollment nationwide is also due, in part, to data differences. Specifically, unwinding disenrollment data include enrollees with limited benefit coverage, while the enrollment data do not.[31]
CMS analysis indicates that the majority of disenrollments were for procedural reasons and the majority of renewals were done via ex parte where enrollees do not need to provide any new information.[32] CMS data indicate that about 70 percent of the disenrollments during unwinding were for procedural reasons while over 60 percent of the renewals resulted from the ex parte process (see fig. 3). Because CMS was not monitoring data on redeterminations prior to unwinding, CMS officials could not speak to how these percentages compared to outcomes prior to the COVID-19 public health emergency.
Figure 3: Prevalence of Procedural Disenrollments and Ex Parte Renewals During Unwinding, March 2023-September 2024
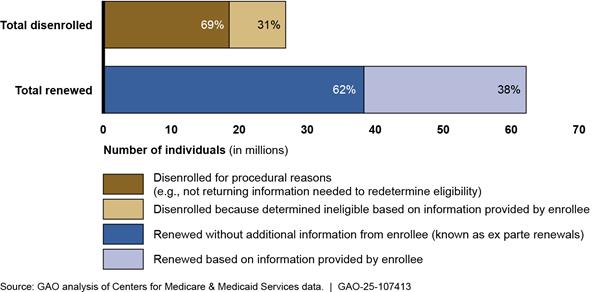
Notes: Data are for Medicaid and the Children’s Health Insurance Program. These data reflect the initial outcomes (renewal or disenrollment) of unwinding redeterminations for the monthly cohorts of redeterminations that were due to be completed from March 2023 through June 2024. For each monthly cohort, the data reflect redeterminations completed in the month due or any of the 3 subsequent months. Redeterminations completed more than 3 months after the month they were due are generally not included in the data. Thus, for example, data for the March 2023 cohort includes outcomes for redeterminations completed as of June 2023 and data for the June 2024 cohort includes outcomes for redeterminations that were completed as of September 2024. This analysis is focused on completed redeterminations and excluded those reflected as pending in the data.
The data generally do not reflect changes to an outcome after a redetermination was completed, such as state decisions to reinstate coverage for those initially disenrolled. The data may reflect outcomes from two redeterminations for some enrollees—the unwinding redetermination and the routine redetermination completed later in the period, which is generally 12 months later.
Most unwinding redeterminations had been completed as of March 2025, but the exact number remaining and in which states is unknown, according to CMS officials. CMS officials said they did not know what the outcomes were for 5.7 million redeterminations that were pending in the data at the time of our review and said it was likely that at least some unwinding-related redeterminations had not yet been initiated by states as of March 2025. States have until the end of December 2025 to complete all unwinding redeterminations.
Percentage of Individuals Disenrolled Varied Significantly Across States, Ranging from 8 Percent to 53 Percent of Completed Redeterminations
CMS data indicate that the percentage of completed unwinding redeterminations that resulted in a disenrollment from March 2023 through September 2024 ranged from 8 percent in Maine to 53 percent in Montana (see fig. 4). Five states disenrolled more than 50 percent of individuals from Medicaid or CHIP during this period. Six states disenrolled less than 20 percent of individuals from Medicaid or CHIP. (See appendix I for disenrollments, renewals, and pending redeterminations by state.)
Figure 4: Percentage of Completed Redeterminations That Resulted in Disenrollments During Unwinding, by State, March 2023-September 2024
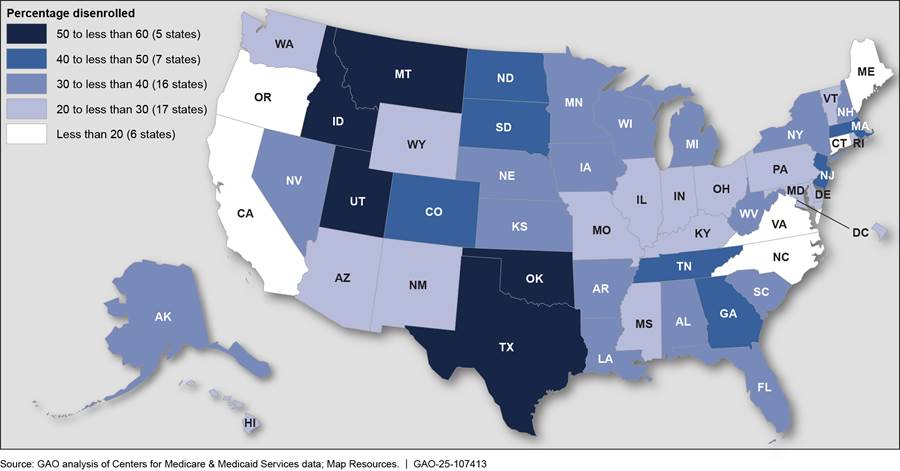
Notes: Data are for Medicaid and the Children’s Health Insurance Program. They reflect the initial outcomes (renewal or disenrollment) of unwinding redeterminations for the monthly cohorts of redeterminations that were due to be completed from March 2023 through June 2024. For each monthly cohort, the data reflect redeterminations completed in the month due or any of the 3 subsequent months. Redeterminations completed more than 3 months after the month they were due are generally not included in the data. Thus, for example, data for the March 2023 cohort includes outcomes for redeterminations completed as of June 2023 and data for the June 2024 cohort includes outcomes for redeterminations that were completed as of September 2024. This analysis is focused on completed redeterminations and excluded those reflected as pending in the data.
The data generally do not reflect changes to an outcome after a redetermination was completed, such as state decisions to reinstate coverage for those initially disenrolled. However, Arkansas, California, Oklahoma, Pennsylvania, Rhode Island, Wyoming, and South Carolina included data for some months on eligibility decisions that occurred after the initial redetermination, such as reinstatements of coverage for individuals that were initially disenrolled. The data may reflect outcomes from two redeterminations for some enrollees—the unwinding redetermination and the routine redetermination completed later in the period, which is generally 12 months later.
CMS officials and early CMS analyses indicated several factors may have contributed to the wide variation in the percentage disenrolled across states during unwinding. For example,
Flexibilities and mitigation measures. CMS officials said that state implementation of temporary flexibilities and mitigation measures that aimed to prevent erroneous disenrollments may have contributed to the variation in the percentage of individuals disenrolled across states. States adopted flexibilities during unwinding that made it easier to renew individuals and may have led to fewer disenrollments, according to CMS.[33] For example, 38 states requested and received approval to use older income information that demonstrated low or no income to renew a Medicaid or CHIP enrollee’s eligibility, when no other income information was listed on relevant data sources.[34] This streamlined the redetermination process for these states and enrollees and may have led to fewer disenrollments. In addition, some states implemented mitigation measures to help them address areas of non-compliance with federal redetermination requirements, which may have led to fewer disenrollments, according to CMS officials. For example, Maine paused procedural disenrollments from August 2023 through August 2024. As a result, Maine’s results for this time period mostly reflect individuals who were determined eligible or were determined ineligible. The results do not reflect most individuals whose eligibility could not be determined because, for example, they did not return required information. This may partially explain why Maine had the lowest overall percentage of disenrolled (8 percent), according to CMS officials.
Ex parte renewals. CMS officials indicated that the extent to which states used ex parte renewals may have contributed to some of the state variation in overall disenrollments. Because ex parte renewals require no action from the enrollee to retain coverage, states with relatively higher ex parte renewals may have fewer disenrollments, according to CMS officials. States varied in their percentage of unwinding renewals that were completed through the ex parte process, from 7 percent to almost 100 percent from March 2023 through September 2024. CMS data show that states with the lowest percentage of enrollees disenrolled often had relatively higher percentages of renewals completed through the ex parte process. For example, out of the six states with the lowest percentage of disenrollments, five had ex parte renewals exceeding 65 percent of their total renewals.[35]
Differences in eligibility criteria. Early CMS analysis indicated that states that did not expand Medicaid eligibility to certain low-income individuals—referred to as non-expansion states—generally had a higher percentage of disenrollments than states that did. Our analysis of disenrollments found similar results. For example, during unwinding, the percentage of individuals disenrolled from Medicaid or CHIP averaged 36 percent in non-expansion states (10 states) compared to 30 percent in expansion states (41 states), from March 2023 through September 2024.[36] States that did not expand Medicaid also had a disproportionate share of total disenrollments. These states accounted for 22 percent of completed unwinding redeterminations but almost 30 percent of all disenrollments during this time period.
Although states frequently used procedural disenrollments, CMS officials said they did not know how they were associated with variation among states in the overall percentage of individuals disenrolled from Medicaid or CHIP during unwinding. The percentage of unwinding disenrollments that were procedural exceeded 50 percent in 46 states from March 2023 through September 2024. In addition, more than 75 percent of disenrollments were procedural in 19 states, including in several states with relatively lower percentages of disenrollments overall. For example, North Carolina disenrolled 13 percent of individuals with a completed redetermination, but the percentage of disenrollments that were procedural was 85 percent.
CMS officials told us they used the data on renewals and disenrollments to monitor state compliance with redetermination requirements and to provide technical assistance to states on their redetermination processes. For example, CMS officials told us they reviewed data on renewals and disenrollments weekly to identify state outliers and determine if CMS needed additional information from the state before escalating an issue internally. In some cases, this data monitoring enabled CMS to find and address problems with states’ redetermination processes. CMS officials plan to continue collecting renewals and disenrollment data from states after unwinding is complete, due to the data’s importance in helping the agency monitor and oversee states’ redetermination processes, which they outlined in May 2024 guidance. This is consistent with our July 2024 recommendation to CMS on documenting and implementing oversight practices the agency learned during unwinding were needed to help ensure states’ compliance issues with redetermination requirements.[37]
CMS Analyses Provide Some Insight into Unwinding Outcomes by Age and Eligibility Group and Transitions to Other Health Care Coverage
CMS analyses of unwinding outcomes by age and eligibility group suggest that certain populations were more likely to be disenrolled. CMS indicated that these analyses were limited by what data were available and the time period reviewed.
· Adult and child. CMS analyzed differences in the percentage decline in Medicaid and CHIP enrollment from March 2023 through May 2024 for adults compared to children. CMS found that the decline in enrollment was about 4 percentage points more for adults during this time period.[38] CMS officials said this may partly be a result of the higher eligibility income limits for children compared to adults.[39]
· Eligibility group. CMS analyzed the percentage of individuals who were disenrolled from Medicaid or CHIP or transitioned to limited benefit coverage for different eligibility groups from April 2023 through December 2023.[40] This analysis suggests that young adults aged 19 to 23 in a child-eligibility group were the most likely to be disenrolled or transition to limited benefit coverage.[41] Specifically, over 50 percent of these young adults were disenrolled from full benefit Medicaid or CHIP or moved to a program with limited benefits.[42] Enrollees in a pregnancy-related eligibility group were the second most likely to be disenrolled or transition to limited benefit coverage (39 percent). In contrast, enrollees in a disability-specific eligibility group were the least likely (7 percent) to be disenrolled or transition to limited benefit coverage.
According to CMS, populations with relatively higher disenrollments may have moved into eligibility categories with lower income limits and as a result, likely were no longer eligible for Medicaid or CHIP coverage. For example, CMS officials said that young adults aged 19 to 23 may have aged out of child-specific eligibility groups, and the income limits for certain adult eligibility groups generally are lower than for children.[43] In addition, in states that did not expand eligibility to certain low-income adults, these individuals may no longer fall into a category that is eligible for Medicaid, according to CMS officials.
· Home- and community-based services enrollees. CMS also analyzed the percentage of individuals who had been receiving home- and community-based services who were disenrolled from Medicaid or CHIP or transitioned to limited benefit coverage.[44] Specifically, CMS compared disenrollments and transitions to limited benefit coverage for those who had been receiving home- and community-based services to the general Medicaid and CHIP population for 36 states from April 2023 through December 2023.[45] This analysis suggests that individuals who had been receiving home- and community-based services may have had relatively fewer disenrollments when compared to other individuals. Specifically, 3 percent of individuals who had been receiving home- and community-based services were disenrolled from full benefit Medicaid or CHIP coverage or moved to limited benefit coverage.[46] This is significantly lower than the 18 percent who experienced those outcomes for the general Medicaid and CHIP population.
CMS officials said several factors may affect the relatively fewer disenrollments for home- and community-based services enrollees. For example, the eligibility factors for these individuals, such as their disability status, are less likely to change than the eligibility factors for other groups of enrollees. Individuals receiving home- and community-based services are also more likely to need and have help with renewal forms, which may reduce their likelihood of being disenrolled, according to officials.
CMS analyses of the extent to which those disenrolled during unwinding obtained other health care coverage found that certain populations may be more likely to transition to other coverage or return to Medicaid or CHIP. CMS officials said these analyses only give a partial picture on what happened to individuals after they were disenrolled from Medicaid or CHIP due to gaps in the data on transitions to other coverage.[47]
· Transitions to marketplace coverage. From April 2023 through June 2024, CMS found that at least 2.7 million individuals disenrolled from Medicaid or CHIP during unwinding obtained health care coverage in states using the federal marketplace platform.[48] In addition, at least 830,000 individuals obtained health care coverage through state-based marketplaces using their own platforms.[49] CMS also analyzed enrollees who were disenrolled from April 2023 through December 2023 who transitioned to marketplace coverage by certain eligibility groups in states using the federal marketplace platform.[50] CMS found that certain groups were more likely to transition to marketplace coverage than others after disenrollment in these states. Specifically, among enrollees who were disenrolled from full benefit Medicaid or CHIP coverage, adults aged 19 to 64 and not in a disability-specific eligibility group were the most likely to obtain marketplace coverage (at least 14 percent). In contrast, enrollees over 65 and not in a disability-specific eligibility group were the least likely to obtain such coverage (1 percent).
CMS officials told us these differences may be related to who may be eligible for premium tax credits for marketplace coverage. For example. according to CMS analysis, enrollees over 65 and those in a disability-specific eligibility group often qualify for Medicare. As a result, CMS officials said they would often not be eligible for premium tax credits and may be less likely to transition to marketplace coverage compared to other groups.
· Churn back into Medicaid or CHIP. CMS found that about 14 percent of individuals who were disenrolled from full benefit coverage from April 2023 through December 2023, churned back into Medicaid or CHIP by March 2024.[51] CMS also analyzed the level of churn by different eligibility groups and found children and those in a pregnancy-related eligibility group were the most likely to experience churn.[52] Specifically, over 15 percent of children under 19 and those enrolled in a pregnancy-related eligibility group who were disenrolled from March 2023 through December 2023 churned back into full benefit Medicaid or CHIP by March 2024. In contrast, enrollees over 65 and not in a disability-specific eligibility group were the least likely to churn back into full benefit Medicaid or CHIP (1 percent).
CMS officials noted that children may have been more likely to churn back into Medicaid or CHIP due to generally higher income limits for eligibility, which is also consistent with a past CMS analysis. Enrollees in a pregnancy-related eligibility group may have been more likely to churn back into Medicaid or CHIP due to states reinstating or reenrolling these individuals as a result of implementation of the 12-month postpartum coverage option, according to CMS.[53]
As of March 2025, CMS officials noted they are interested in doing more analysis on how unwinding outcomes are distributed across different age and Medicaid eligibility groups.
Selected States Found Relatively Higher Disenrollments for Certain Age, Race, and Other Population Groups, Though Findings Varied by State
Our five selected states found relatively higher Medicaid and CHIP disenrollments for certain population groups, though findings varied by state. States were not required to analyze unwinding outcomes, including disenrollments, by population characteristics—and the five states varied in the extent to which they did so (see table 1). (See appendix II for additional information on disenrollments by population characteristics for the five selected states.)
Table 1: Whether Selected States Analyzed Medicaid and CHIP Disenrollments by Certain Population Characteristics
|
State |
Age |
Geographic location |
Race and ethnicity |
Language |
Tribal affiliation |
|
Arizona |
✔ |
✔ |
✔ |
— |
— |
|
Maryland |
✔ |
✔ |
✔ |
— |
— |
|
Montana |
✔ |
✔ |
— |
— |
✔ |
|
New York |
✔ |
✔ |
✔ |
✔ |
— |
|
Wisconsin |
✔ |
✔ |
✔ |
✔ |
— |
Legend:
CHIP: Children’s Health Insurance Program
✔: State analyzed disenrollments by characteristic
Source: GAO analysis of state information. | GAO‑25‑107413
Differences in Disenrollments by Age
Information from all five selected states indicated relatively higher disenrollments among enrollees of certain ages. For example, in the two states that analyzed disenrollments for young adults aged 19 to 20 (Maryland and Montana), state data indicated that a higher percentage of enrollees were disenrolled in this age group than in all other age groups. Figure 5 shows disenrollments by age group in one of the states. Officials from this state said they expected young adults to experience higher disenrollments than children because of the different eligibility requirements for these groups in the state.[54]
Figure 5: Percentage of Completed Redeterminations That Resulted in Disenrollments During Unwinding in Montana, by Age, May 2023-June 2024
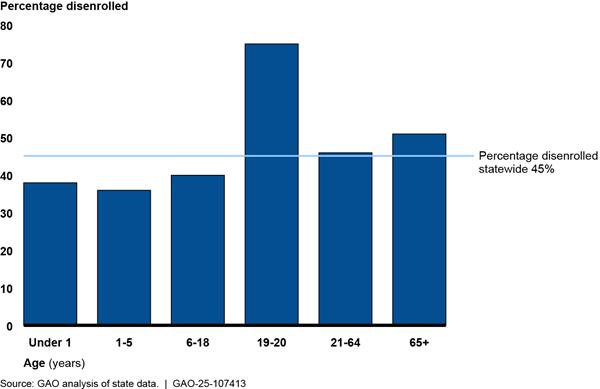
Notes: “Percentage disenrolled” is the percentage of Medicaid and Children’s Health Insurance Program enrollees with completed redeterminations that resulted in disenrollment as of June 2024. At that time, the state had not completed about 8 percent of redeterminations due, including redeterminations for 13 percent of enrollees under age 1, 19 percent of those aged 65 or older, and 5 to 8 percent of enrollees in other age groups. The state data used to calculate percentages reflect the initial redetermination decisions made during unwinding and do not reflect changes in outcomes that may have occurred during the state’s 90-day reconsideration period after a procedural disenrollment. The data include enrollees who went through the state’s standard eligibility redetermination process; other enrollees, such as those Medicaid-eligible due to foster care status, are not included.
Similarly, data from three states (Arizona, Maryland, and Montana) indicated that older age groups (adults) had relatively higher disenrollments than children aged 18 and under. For example, in Maryland, 26 percent of enrollees aged 21 to 44 with completed redeterminations were disenrolled as compared to 19 percent of children aged 5 and under.[55] Similarly, in Arizona, adults aged 19 and older were a larger share of disenrollments when compared to their overall share of the enrollee population. Specifically, adults accounted for 66 percent of disenrollments during unwinding but were 58 percent of the state’s total Medicaid and CHIP population in May 2024.[56] Arizona and Montana officials said they expected relatively higher disenrollments among adults than among children aged 18 and under because of generally lower income eligibility limits for adults in these states.
In one selected state, officials told us that age differences in disenrollments had informed their outreach efforts. Specifically, after Wisconsin found that a relatively high percentage of adults aged 19 to 35 were disenrolled, they prioritized new outreach efforts to help young adults retain coverage, according to state officials.
Differences in Disenrollments by Geographic Location
Information from all five selected states indicated relatively higher disenrollments in certain zip codes, counties, or regions. For example,
· Maryland. State data indicated that the suburban Washington, D.C. and western Maryland regions had the highest percentage of completed redeterminations that resulted in disenrollments (25 percent and 24 percent, respectively), while Baltimore City had the lowest percentage of disenrollments (19 percent).[57]
Geographic differences in disenrollments during unwinding led the state to increase outreach in certain areas, officials said. To better understand local disenrollment differences, officials analyzed demographic data for the 60 zip codes with the highest percentage of redeterminations that resulted in procedural disenrollment. In doing so, officials said they analyzed procedural disenrollments by race and ethnicity in those zip codes, which allowed the state to identify communities with relatively higher procedural disenrollments and provide targeted outreach. For example, after identifying relatively higher procedural disenrollments in parts of suburban Washington, D.C., particularly among Hispanic or Latino individuals, state officials increased outreach in those areas via Spanish language radio.
· New York. Available data indicated that New York City and two other regions had the highest percentage of completed redeterminations that resulted in disenrollment (30 percent).[58] Officials said they had seen higher-than-expected percentages of procedural disenrollments in New York City, and the state targeted outreach in that area to help individuals renew their coverage.
Differences in Disenrollments by Race and Ethnicity
Of the four selected states that analyzed outcomes by race and ethnicity, data from Maryland and Wisconsin indicated relatively higher disenrollments for certain racial and ethnic groups. Data limitations in the two other states—Arizona and New York—made comparisons challenging.
· Maryland. State data across 10 categories related to race and ethnicity indicated that individuals who were Pacific Islander, White, or of “other” or unknown race and ethnicity had the highest percentage of completed redeterminations that resulted in disenrollment (about 25 percent or more). In comparison, individuals who were American Indian or Alaska Native, both Black and White, or two or more other races had the lowest percentages of completed redeterminations that resulted in disenrollment (less than 20 percent).[59]
State data also indicated that individuals who were Black or African American; both Black and White; or of unknown race and ethnicity had the largest percentage of disenrollments that were procedural. Specifically, for each of these groups, more than 64 percent of disenrollments were procedural. In comparison, individuals who were Asian, Pacific Islander, White, or of “other” race and ethnicity had the lowest percentage of procedural disenrollments (less than 58 percent of disenrollments).
· Wisconsin. State data across eight categories related to race and ethnicity indicated that Native Hawaiian or Pacific Islander, White, and Hispanic or Latino individuals had the highest percentages of completed redeterminations that resulted in disenrollment.[60] (See fig. 6.) State data also indicated that American Indian or Alaskan Native, Hispanic or Latino, and Native Hawaiian or Pacific Islander individuals had the largest percentage of disenrollments that were procedural (about 67 percent).
Figure 6: Percentage of Completed Redeterminations That Resulted in Disenrollments During Unwinding in Wisconsin, by Race and Ethnicity, June 2023-June 2024
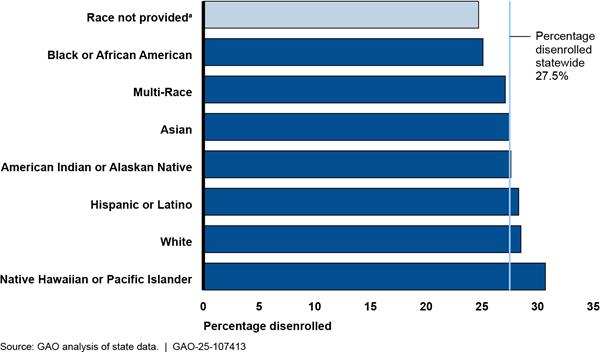
Notes: “Percentage disenrolled” is the percentage of Medicaid and Children’s Health Insurance Program enrollees with completed redeterminations that resulted in disenrollment. Data are based on enrollees’ self-reported race and ethnicity and reflect the categories the state used in its analysis. Data reflect redeterminations completed from June 2023 through June 2024, which account for all redeterminations due during unwinding. Data also reflect changes in outcomes that occurred during the state’s 90-day reconsideration period after a procedural disenrollment. The state data used to calculate percentages include enrollees who went through the state’s standard eligibility redetermination process; other enrollees, such as those Medicaid eligible due to foster care status, are not included.
aEnrollees could choose not to report their race. Enrollees who did not report their race accounted for 12 percent of unwinding redeterminations.
Wisconsin officials told us they created an unwinding outreach dashboard to share outcomes data by race, primary language, and other population characteristics with partner organizations, such as provider groups. Feedback on the data from those organizations helped the state adapt outreach to certain populations.
Differences in Disenrollments by Other Population Characteristics
State data also indicated relatively higher disenrollments by other population characteristics. For example,
· Language. Two selected states (New York and Wisconsin) analyzed disenrollments by enrollees’ language. For example, in New York, available data across 28 written language categories, including English, indicated that enrollees who selected French Creole, Nepali, or Japanese as their preferred written language had the highest percentage of completed redeterminations that resulted in disenrollment (more than 33 percent). In comparison, enrollees who selected Arabic, Swahili, or Somali as their preferred written language were among those with the lowest percentage of redeterminations that resulted in disenrollment (16 to 18 percent).[61] Individuals must select their preferred written language when applying for coverage through the eligibility system that manages most of the states’ Medicaid and CHIP enrollees.[62]
· Tribal affiliation. One of our selected states—Montana—analyzed disenrollments by tribal affiliation. State data indicated relatively more disenrollments among enrollees who did not report being tribally affiliated than those who did. Forty-six percent of non-tribally affiliated enrollees with a completed redetermination had been disenrolled as of June 2024, as compared to 36 percent of tribally affiliated enrollees with a completed redetermination.[63] State officials said the relatively lower disenrollments among tribally affiliated enrollees could reflect many of these enrollees tending to live in areas with fewer economic opportunities. In addition, state officials worked with the federal Indian Health Service and tribal groups to help tribally affiliated enrollees retain coverage, if eligible. They did so by identifying which enrollees were at risk of disenrollment due to not returning renewal forms and then sharing that information with those external groups to facilitate outreach, state officials said.
Agency Comments
We provided a draft of this report to the Department of Health and Human Services for review and comment. The agency provided technical comments, which we incorporated as appropriate.
We are sending copies of this report to the appropriate congressional committees, the Secretary of Health and Human Services, and other interested parties. In addition, the report is available at no charge on the GAO website at http://www.gao.gov.
If you or your staff have any questions about this report, please contact me at RosenbergM@gao.gov. Contact points for our Offices of Congressional Relations and Public Affairs may be found on the last page of this report. GAO staff who made key contributions to this report are listed in appendix III.

Michelle B. Rosenberg
Director, Health Care
List of Committees
The Honorable Susan Collins
Chair
The Honorable Patty Murray
Vice Chair
Committee on Appropriations
United States Senate
The Honorable Mike Crapo
Chairman
The Honorable Ron Wyden
Ranking Member
Committee on Finance
United States Senate
The Honorable Bill Cassidy, M.D.
Chair
The Honorable Bernard Sanders
Ranking Member
Committee on Health, Education, Labor, and Pensions
United States Senate
The Honorable Rand Paul, M.D.
Chairman
The Honorable Gary C. Peters
Ranking Member
Committee on Homeland Security and Governmental Affairs
United States Senate
The Honorable Tom Cole
Chairman
The Honorable Rosa L. DeLauro
Ranking Member
Committee on Appropriations
House of Representatives
The Honorable Brett Guthrie
Chair
The Honorable Frank Pallone, Jr.
Ranking Member
Committee on Energy and Commerce
House of Representatives
The Honorable Mark E. Green, M.D.
Chairman
The Honorable Bennie G. Thompson
Ranking Member
Committee on Homeland Security
House of Representatives
The Honorable James Comer
Chairman
The Honorable Stephen F. Lynch
Acting Ranking Member
Committee on Oversight and Government Reform
House of Representatives
The Honorable Jason Smith
Chairman
The Honorable Richard Neal
Ranking Member
Committee on Ways and Means
House of Representatives
Appendix I: Nationwide Data on Disenrollments, Renewals, and Pending Redeterminations, by State, March 2023 Through September 2024
States reported certain unwinding outcomes—such as the number and type of renewals and disenrollments—for Medicaid and Children’s Health Insurance Program (CHIP) enrollees to the Centers for Medicare & Medicaid Services (CMS) beginning with redeterminations completed in March 2023. CMS has publicly shared preliminary data reported by states as well as updated data, which has generally lagged the preliminary data by five or more months. The preliminary data include millions more pending redeterminations—redeterminations that were incomplete and still being processed—compared to the updated data. We are reporting on numbers and percentages using the updated data that were published in January 2025.
These data reflect the outcomes for monthly cohorts of redeterminations due for completion from March 2023 through June 2024. For each monthly cohort, the updated data generally include redeterminations completed in the month due or any of the 3 subsequent months. Thus, data for the March 2023 cohort includes outcomes for redeterminations completed as of June 2023 and data for the June 2024 cohort includes outcomes for redeterminations that were completed as of September 2024. Redeterminations completed more than 3 months after the month they were due are generally reflected as pending in the data and not included in our calculations of the percentage of disenrollments or renewals. In addition, the data generally do not reflect changes to an outcome after a redetermination was completed, such as state decisions to reinstate coverage for those initially disenrolled. Finally, the data may reflect outcomes from two redeterminations for some enrollees—the unwinding redetermination and the routine redetermination completed later in the period, which is generally 12 months later.
CMS data published in January 2025 included the number of completed redeterminations as well as how many enrollees were renewed and disenrolled from March 2023 through September 2024 (see table 2).
Table 2: Medicaid and Children’s Health Insurance Program (CHIP) Renewals and Disenrollments, by State, March 2023-September 2024
|
|
Number of Medicaid and CHIP enrollees |
|
Percentage of all completed redeterminations |
||||
|
State |
Completed redeterminations |
Renewed |
Disenrolled |
|
Renewed |
Disenrolled |
|
|
Alabama |
1,324,475 |
886,970 |
437,505 |
|
67.0% |
33.0% |
|
|
Alaska |
145,461 |
95,930 |
49,531 |
|
65.9% |
34.1% |
|
|
Arizona |
2,912,469 |
2,318,188 |
594,281 |
|
79.6% |
20.4% |
|
|
Arkansas |
1,036,666 |
661,734 |
374,932 |
|
63.8% |
36.2% |
|
|
California |
11,660,941 |
9,539,870 |
2,121,071 |
|
81.8% |
18.2% |
|
|
Colorado |
1,773,941 |
964,368 |
809,573 |
|
54.4% |
45.6% |
|
|
Connecticut |
1,389,391 |
1,141,133 |
248,258 |
|
82.1% |
17.9% |
|
|
Delaware |
284,628 |
200,884 |
83,744 |
|
70.6% |
29.4% |
|
|
District of Columbia |
310,421 |
237,222 |
73,199 |
|
76.4% |
23.6% |
|
|
Florida |
5,474,605 |
3,433,559 |
2,041,046 |
|
62.7% |
37.3% |
|
|
Georgia |
2,258,892 |
1,310,900 |
947,992 |
|
58.0% |
42.0% |
|
|
Hawaii |
454,399 |
357,597 |
96,802 |
|
78.7% |
21.3% |
|
|
Idaho |
445,744 |
221,774 |
223,970 |
|
49.8% |
50.2% |
|
|
Illinois |
3,481,913 |
2,609,772 |
872,141 |
|
75.0% |
25.0% |
|
|
Indiana |
1,970,524 |
1,438,297 |
532,227 |
|
73.0% |
27.0% |
|
|
Iowa |
992,736 |
690,750 |
301,986 |
|
69.6% |
30.4% |
|
|
Kansas |
481,856 |
312,537 |
169,319 |
|
64.9% |
35.1% |
|
|
Kentucky |
966,082 |
725,384 |
240,698 |
|
75.1% |
24.9% |
|
|
Louisiana |
1,973,454 |
1,298,656 |
674,798 |
|
65.8% |
34.2% |
|
|
Maine |
408,443 |
375,230 |
33,213 |
|
91.9% |
8.1% |
|
|
Maryland |
1,702,861 |
1,277,379 |
425,482 |
|
75.0% |
25.0% |
|
|
Massachusetts |
1,699,566 |
1,010,933 |
688,633 |
|
59.5% |
40.5% |
|
|
Michigan |
3,091,089 |
1,970,952 |
1,120,137 |
|
63.8% |
36.2% |
|
|
Minnesota |
1,438,010 |
983,378 |
454,632 |
|
68.4% |
31.6% |
|
|
Mississippi |
684,397 |
524,124 |
160,273 |
|
76.6% |
23.4% |
|
|
Missouri |
1,221,511 |
860,231 |
361,280 |
|
70.4% |
29.6% |
|
|
Montana |
274,759 |
128,222 |
146,537 |
|
46.7% |
53.3% |
|
|
Nebraska |
393,078 |
274,577 |
118,501 |
|
69.9% |
30.1% |
|
|
Nevada |
1,107,978 |
718,230 |
389,748 |
|
64.8% |
35.2% |
|
|
New Hampshire |
227,042 |
156,195 |
70,847 |
|
68.8% |
31.2% |
|
|
New Jersey |
1,735,638 |
960,401 |
775,237 |
|
55.3% |
44.7% |
|
|
New Mexico |
865,705 |
631,925 |
233,780 |
|
73.0% |
27.0% |
|
|
New York |
6,744,956 |
4,716,821 |
2,028,135 |
|
69.9% |
30.1% |
|
|
North Carolina |
2,560,336 |
2,229,624 |
330,712 |
|
87.1% |
12.9% |
|
|
North Dakota |
157,682 |
90,795 |
66,887 |
|
57.6% |
42.4% |
|
|
Ohio |
4,126,025 |
3,154,553 |
971,472 |
|
76.5% |
23.5% |
|
|
Oklahoma |
1,490,558 |
724,683 |
765,875 |
|
48.6% |
51.4% |
|
|
Oregon |
1,345,402 |
1,149,623 |
195,779 |
|
85.4% |
14.6% |
|
|
Pennsylvania |
3,771,362 |
2,733,324 |
1,038,038 |
|
72.5% |
27.5% |
|
|
Rhode Island |
317,371 |
225,032 |
92,339 |
|
70.9% |
29.1% |
|
|
South Carolina |
1,195,123 |
760,613 |
434,510 |
|
63.6% |
36.4% |
|
|
South Dakota |
125,106 |
62,828 |
62,278 |
|
50.2% |
49.8% |
|
|
Tennessee |
1,510,063 |
899,112 |
610,951 |
|
59.5% |
40.5% |
|
|
Texas |
4,891,717 |
2,322,485 |
2,569,232 |
|
47.5% |
52.5% |
|
|
Utah |
471,555 |
221,327 |
250,228 |
|
46.9% |
53.1% |
|
|
Vermont |
168,969 |
124,137 |
44,832 |
|
73.5% |
26.5% |
|
|
Virginia |
2,083,864 |
1,808,974 |
274,890 |
|
86.8% |
13.2% |
|
|
Washington |
1,946,119 |
1,445,212 |
500,907 |
|
74.3% |
25.7% |
|
|
West Virginia |
575,604 |
346,508 |
229,096 |
|
60.2% |
39.8% |
|
|
Wisconsin |
1,291,994 |
815,987 |
476,007 |
|
63.2% |
36.8% |
|
|
Wyoming |
71,739 |
55,044 |
16,695 |
|
76.7% |
23.3% |
|
|
Total |
89,034,220 |
62,203,984 |
26,830,236 |
|
69.9% |
30.1% |
|
Source: GAO analysis of Centers for Medicare & Medicaid Services (CMS) data. | GAO‑25‑107413
Notes: Data are for Medicaid and the Children’s Health Insurance Program. They reflect the initial outcomes (renewal or disenrollment) of unwinding redeterminations for the monthly cohorts of redeterminations that were due to be completed from March 2023 through June 2024. For each monthly cohort, the data reflect redeterminations completed in the month due or any of the 3 subsequent months. Redeterminations completed more than 3 months after the month they were due are generally not included in the data. Thus, for example, data for the March 2023 cohort includes outcomes for redeterminations completed as of June 2023 and data for the June 2024 cohort includes outcomes for redeterminations that were completed as of September 2024. This analysis is focused on completed redeterminations and excluded those reflected as pending in the data.
The data generally do not reflect changes to an outcome after a redetermination was completed, such as state decisions to reinstate coverage for those initially disenrolled. However, Arkansas, California, Oklahoma, Pennsylvania, Rhode Island, Wyoming, and South Carolina included data for some months on eligibility decisions that occurred after the initial redetermination, such as reinstatements of coverage for individuals that were initially disenrolled. The data may reflect outcomes from two redeterminations for some enrollees—the unwinding redetermination and the routine redetermination completed later in the period, which is generally 12 months later.
CMS also published state data on the number of renewals completed without the state requesting additional information from the enrollee, i.e., through the “ex parte” process, and the number of disenrollments that were based on procedural reasons, such as enrollees not providing requested information to state Medicaid agencies (see table 3).
Table 3: Medicaid and Children’s Health Insurance Program (CHIP) Prevalence of Ex Parte Renewals and Procedural Disenrollments, by State, March 2023-September 2024
|
|
Percentage of all renewals |
|
Percentage of all disenrollments |
||
|
State |
Renewed based on new information |
Renewed via ex partea |
|
Determined ineligible |
Disenrolled for |
|
Alabama |
44.6% |
55.4% |
|
14.9% |
85.1% |
|
Alaska |
38.3% |
61.7% |
|
50.5% |
49.5% |
|
Arizona |
10.8% |
89.2% |
|
32.2% |
67.8% |
|
Arkansas |
27.5% |
72.5% |
|
24.1% |
75.9% |
|
California |
26.2% |
73.8% |
|
25.9% |
74.1% |
|
Colorado |
51.6% |
48.4% |
|
35.0% |
65.0% |
|
Connecticut |
18.8% |
81.2% |
|
30.8% |
69.2% |
|
Delaware |
53.7% |
46.3% |
|
38.1% |
61.9% |
|
District of Columbia |
20.3% |
79.7% |
|
10.3% |
89.7% |
|
Florida |
66.1% |
33.9% |
|
36.2% |
63.8% |
|
Georgia |
31.0% |
69.0% |
|
30.7% |
69.3% |
|
Hawaii |
28.7% |
71.3% |
|
21.1% |
78.9% |
|
Idaho |
48.9% |
51.1% |
|
24.7% |
75.3% |
|
Illinois |
24.8% |
75.2% |
|
28.3% |
71.7% |
|
Indiana |
28.1% |
71.9% |
|
23.8% |
76.2% |
|
Iowa |
48.7% |
51.3% |
|
27.7% |
72.3% |
|
Kansas |
56.6% |
43.4% |
|
40.0% |
60.0% |
|
Kentucky |
14.9% |
85.1% |
|
44.5% |
55.5% |
|
Louisiana |
20.3% |
79.7% |
|
29.0% |
71.0% |
|
Maine |
72.6% |
27.4% |
|
81.3% |
18.7% |
|
Maryland |
25.9% |
74.1% |
|
25.0% |
75.0% |
|
Massachusetts |
34.4% |
65.6% |
|
33.3% |
66.7% |
|
Michigan |
41.8% |
58.2% |
|
19.6% |
80.4% |
|
Minnesota |
43.4% |
56.6% |
|
21.7% |
78.3% |
|
Mississippi |
70.1% |
29.9% |
|
26.2% |
73.8% |
|
Missouri |
20.9% |
79.1% |
|
19.7% |
80.3% |
|
Montana |
50.4% |
49.6% |
|
31.9% |
68.1% |
|
Nebraska |
46.8% |
53.2% |
|
45.7% |
54.3% |
|
Nevada |
26.1% |
73.9% |
|
7.7% |
92.3% |
|
New Hampshire |
24.1% |
75.9% |
|
19.8% |
80.2% |
|
New Jersey |
56.9% |
43.1% |
|
26.4% |
73.6% |
|
New Mexico |
39.2% |
60.8% |
|
17.0% |
83.0% |
|
New York |
48.1% |
51.9% |
|
53.6% |
46.4% |
|
North Carolina |
0.5% |
99.5% |
|
15.3% |
84.7% |
|
North Dakota |
52.8% |
47.2% |
|
30.9% |
69.1% |
|
Ohio |
31.8% |
68.2% |
|
30.1% |
69.9% |
|
Oklahoma |
66.4% |
33.6% |
|
18.3% |
81.7% |
|
Oregon |
19.6% |
80.4% |
|
54.5% |
45.5% |
|
Pennsylvania |
92.5% |
7.5% |
|
47.0% |
53.0% |
|
Rhode Island |
9.0% |
91.0% |
|
24.7% |
75.3% |
|
South Carolina |
33.8% |
66.2% |
|
34.6% |
65.4% |
|
South Dakota |
73.9% |
26.1% |
|
51.5% |
48.5% |
|
Tennessee |
29.5% |
70.5% |
|
24.4% |
75.6% |
|
Texas |
88.6% |
11.4% |
|
32.1% |
67.9% |
|
Utah |
50.9% |
49.1% |
|
10.0% |
90.0% |
|
Vermont |
25.2% |
74.8% |
|
28.7% |
71.3% |
|
Virginia |
33.3% |
66.7% |
|
45.9% |
54.1% |
|
Washington |
11.2% |
88.8% |
|
15.4% |
84.6% |
|
West Virginia |
63.2% |
36.8% |
|
24.3% |
75.7% |
|
Wisconsin |
61.1% |
38.9% |
|
42.9% |
57.1% |
|
Wyoming |
46.8% |
53.2% |
|
25.7% |
74.3% |
|
Total |
38.4% |
61.6% |
|
31.0% |
69.0% |
Source: GAO analysis of Centers for Medicare & Medicaid Services (CMS) data. | GAO‑25‑107413
Notes: Data are for Medicaid and the Children’s Health Insurance Program. They reflect the initial outcomes (renewal or disenrollment) of unwinding redeterminations for the monthly cohorts of redeterminations that were due to be completed from March 2023 through June 2024. For each monthly cohort, the data reflect redeterminations completed in the month due or any of the 3 subsequent months. Redeterminations completed more than 3 months after the month they were due are generally not included in the data. Thus, for example, data for the March 2023 cohort includes outcomes for redeterminations completed as of June 2023 and data for the June 2024 cohort includes outcomes for redeterminations that were completed as of September 2024. This analysis is focused on completed redeterminations and excluded those reflected as pending in the data.
The data generally do not reflect changes to an outcome after a redetermination was completed, such as state decisions to reinstate coverage for those initially disenrolled. However, Arkansas, California, Oklahoma, Pennsylvania, Rhode Island, Wyoming, and South Carolina included data for some months on eligibility decisions that occurred after the initial redetermination, such as reinstatements of coverage for individuals that were initially disenrolled. The data may reflect outcomes from two redeterminations for some enrollees—the unwinding redetermination and the routine redetermination completed later in the period, which is generally 12 months later.
aEx parte renewals are renewals that are done without additional information from the enrollee.
bProcedural reasons for being disenrolled include, for example, not providing all information needed to redetermine eligibility.
Most states still had pending redeterminations for those due from March 2023 through June 2024 (see table 4). These states had initiated these redeterminations but had not completed them in the month they were due or generally in any of the subsequent 3 months, according to updated data that CMS published in January 2025.
Table 4: Medicaid and Children’s Health Insurance Program (CHIP) Pending Redeterminations, by State, for Redeterminations Scheduled for Completion March 2023-June 2024
|
|
Number of Medicaid and CHIP enrollees |
|
|
|
|
State |
Redeterminations due through June 2024a |
Pending redeterminationsb |
|
Percentage of pending redeterminations out of all due |
|
Alabama |
1,325,451 |
976 |
|
0.1% |
|
Alaska |
199,929 |
54,468 |
|
27.2% |
|
Arizona |
2,913,465 |
996 |
|
0.0% |
|
Arkansas |
1,049,432 |
12,766 |
|
1.2% |
|
California |
13,796,970 |
2,136,029 |
|
15.5% |
|
Colorado |
1,786,893 |
12,952 |
|
0.7% |
|
Connecticut |
1,426,741 |
37,350 |
|
2.6% |
|
Delaware |
298,799 |
14,171 |
|
4.7% |
|
District of Columbia |
330,549 |
20,128 |
|
6.1% |
|
Florida |
5,476,033 |
1,428 |
|
0.0% |
|
Georgia |
2,337,840 |
78,948 |
|
3.4% |
|
Hawaii |
474,041 |
19,642 |
|
4.1% |
|
Idaho |
445,744 |
0 |
|
0.0% |
|
Illinois |
3,660,815 |
178,902 |
|
4.9% |
|
Indiana |
2,141,471 |
170,947 |
|
8.0% |
|
Iowa |
1,036,955 |
44,219 |
|
4.3% |
|
Kansas |
609,614 |
127,758 |
|
21.0% |
|
Kentucky |
1,168,102 |
202,020 |
|
17.3% |
|
Louisiana |
1,976,376 |
2,922 |
|
0.1% |
|
Maine |
466,494 |
58,051 |
|
12.4% |
|
Maryland |
1,743,727 |
40,866 |
|
2.3% |
|
Massachusetts |
1,701,833 |
2,267 |
|
0.1% |
|
Michigan |
3,099,634 |
8,545 |
|
0.3% |
|
Minnesota |
1,441,999 |
3,989 |
|
0.3% |
|
Mississippi |
748,715 |
64,318 |
|
8.6% |
|
Missouri |
1,455,929 |
234,418 |
|
16.1% |
|
Montana |
336,470 |
61,711 |
|
18.3% |
|
Nebraska |
445,700 |
52,622 |
|
11.8% |
|
Nevada |
1,107,978 |
0 |
|
0.0% |
|
New Hampshire |
227,072 |
30 |
|
0.0% |
|
New Jersey |
2,153,190 |
417,552 |
|
19.4% |
|
New Mexico |
919,411 |
53,706 |
|
5.8% |
|
New York |
6,856,535 |
111,579 |
|
1.6% |
|
North Carolina |
2,973,021 |
412,685 |
|
13.9% |
|
North Dakota |
158,065 |
383 |
|
0.2% |
|
Ohio |
4,229,596 |
103,571 |
|
2.4% |
|
Oklahoma |
1,504,474 |
13,916 |
|
0.9% |
|
Oregon |
1,352,565 |
7,163 |
|
0.5% |
|
Pennsylvania |
3,787,211 |
15,849 |
|
0.4% |
|
Rhode Island |
325,826 |
8,455 |
|
2.6% |
|
South Carolina |
1,318,036 |
122,913 |
|
9.3% |
|
South Dakota |
125,106 |
0 |
|
0.0% |
|
Tennessee |
1,585,807 |
75,744 |
|
4.8% |
|
Texas |
5,280,084 |
388,367 |
|
7.4% |
|
Utah |
471,555 |
0 |
|
0.0% |
|
Vermont |
176,335 |
7,366 |
|
4.2% |
|
Virginia |
2,396,673 |
312,809 |
|
13.1% |
|
Washington |
1,946,558 |
439 |
|
0.0% |
|
West Virginia |
599,989 |
24,385 |
|
4.1% |
|
Wisconsin |
1,291,994 |
0 |
|
0.0% |
|
Wyoming |
79,423 |
7,684 |
|
9.7% |
|
Total |
94,762,225 |
5,728,005 |
|
6.0% |
Source: GAO analysis of Centers for Medicare & Medicaid Services (CMS) data. | GAO‑25‑107413
Note: Data were published in January 2025.
aThe number of redeterminations due includes those that were scheduled for completion from March 2023 through June 2024.
bThe number of pending redeterminations are those that were due from March 2023 through June 2024 but were not completed in the month they were due or generally in any of the subsequent 3 months. These pending redeterminations may include cases where a state is pausing procedural disenrollments temporarily. Alaska, Colorado, District of Columbia, Delaware, Kansas, Kentucky, Maine, Michigan, New Hampshire, New Mexico, and New York had paused at least some disenrollments that were due to procedural reasons, such as enrollees not returning required information, as of June 2024.
The five selected states included in our review (Arizona, Maryland, Montana, New York, and Wisconsin) varied in the extent to which they analyzed unwinding outcomes for Medicaid and Children’s Health Insurance Program (CHIP) enrollees, including disenrollments and renewals, by population characteristics.[64] In addition, the time frames of outcomes analyzed varied by state. The following tables provide information on unwinding outcomes by characteristics states analyzed.
Arizona
Table 5 provides information on disenrollments during unwinding in Arizona by age and county; the state did not similarly track renewals by age and county.[65]
Table 5: Medicaid and Children’s Health Insurance Program Unwinding Disenrollments in Arizona, by Age and County, April 2023-March 2024
|
|
|
|
Percentage of all disenrollments |
|
|
Characteristic |
Number of enrollees disenrolled |
|
Determined ineligible |
Disenrolled for |
|
Age group (years) |
|
|
|
|
|
Under 19 |
209,507 |
|
— |
— |
|
19-64 |
381,346 |
|
— |
— |
|
65 or older |
29,218 |
|
— |
— |
|
County |
|
|
|
|
|
Apache |
8,283 |
|
38.8% |
61.2% |
|
Coconino |
11,694 |
|
38.1 |
61.9 |
|
Cochise |
9,959 |
|
44.2 |
55.8 |
|
Maricopa |
350,507 |
|
39.2 |
60.8 |
|
Mohave |
20,082 |
|
46.6 |
53.4 |
|
Navajo |
13,019 |
|
41.7 |
58.3 |
|
Pima |
86,448 |
|
41.9 |
58.1 |
|
Pinal |
43,571 |
|
42.6 |
57.4 |
|
Santa Cruz |
6,258 |
|
42.9 |
57.1 |
|
Yavapai |
16,332 |
|
41.7 |
58.3 |
|
Yuma |
24,388 |
|
47.9 |
52.1 |
|
Other county in state |
10,871 |
|
38.2 |
61.8 |
|
Other county out of state |
18,659 |
|
91.0 |
9.0 |
|
Total |
620,071 |
|
42.1% |
57.9% |
Legend: — = Not available.
Source: GAO analysis of state information. | GAO‑25‑107413
Notes: Data reflect eligibility redeterminations completed from April 2023 through March 2024. Data include changes in outcomes during the state’s 90-day reconsideration period after a procedural disenrollment when those changes took place by May 6, 2024, according to Arizona officials. The state did not track the number of renewals by age and county, and as a result, we could not calculate the percentage of individuals disenrolled by age or county.
aProcedural reasons for being disenrolled include, for example, not providing all information needed to redetermine eligibility.
Table 6 provides information on disenrollments and renewals during unwinding in Arizona for the subset of enrollees for whom the state analyzed outcomes by race and ethnicity. Specifically, of the roughly 2.6 million enrollees whose eligibility was redetermined during unwinding, there were about 630,000 enrollees (about one-fourth) for whom the state had received information during the COVID-19 public health emergency that indicated they no longer met eligibility criteria or would likely be procedurally ineligible, and for whom the state completed a redetermination during unwinding. The state analyzed outcomes by race and ethnicity for the share of those individuals who provided information on race or ethnicity.[66]
Table 6: Medicaid and Children’s Health Insurance Program Unwinding Outcomes in Arizona (subset of enrollees), by Race and Ethnicity, April 2023-December 2023
|
|
Number of enrollees |
||
|
Characteristic |
Completed redeterminations |
Renewed |
Disenrolled |
|
Racea |
|||
|
Asian Indian |
3,344 |
1,845 |
1,499 |
|
Asian Unknown |
648 |
355 |
293 |
|
Black |
60,621 |
33,340 |
27,281 |
|
Caucasian or White |
387,757 |
206,580 |
181,177 |
|
Chinese |
1,459 |
710 |
749 |
|
Filipino |
2,763 |
1,314 |
1,449 |
|
Guam or Chamorro |
367 |
132 |
235 |
|
Japanese |
628 |
299 |
329 |
|
Korean |
956 |
482 |
474 |
|
Native American |
51,109 |
29,267 |
21,842 |
|
Native Hawaiian |
758 |
379 |
379 |
|
Native Hawaiian or Other Pacific Islander Unknown |
120 |
48 |
72 |
|
Other Asian |
2,805 |
1,463 |
1,342 |
|
Other Pacific Islander |
1,277 |
659 |
618 |
|
Samoan |
395 |
164 |
231 |
|
Unknown |
4,934 |
2,722 |
2,212 |
|
Unspecified |
6,067 |
3,318 |
2,749 |
|
Vietnamese |
3,316 |
1,796 |
1,520 |
|
Ethnicitya |
|||
|
Another Hispanic, Latino/a or Spanish Origin |
11,042 |
5,975 |
5,067 |
|
Cuban |
1,758 |
786 |
972 |
|
Ethnicity Unknown |
7,506 |
4,092 |
3,414 |
|
Ethnicity Unspecified |
29 |
7 |
22 |
|
Hispanic or Latino/a Unknown |
81,879 |
46,835 |
35,044 |
|
Mexican, Mexican American, or Chicano/a |
203,797 |
113,110 |
90,687 |
|
Not of Hispanic or Latino or Spanish Origin |
189,090 |
99,591 |
89,499 |
|
Puerto Rican |
3,443 |
1,700 |
1,743 |
Source: GAO analysis of state information. | GAO‑25‑107413
Notes: Data reflect eligibility redeterminations completed from April 2023 through December 2023 for a subset of enrollees. Specifically, of the roughly 2.6 million enrollees whose eligibility was redetermined during unwinding, there were about 630,000 enrollees (about one-fourth) for whom the state had received information during the COVID-19 public health emergency that indicated they no longer met eligibility criteria or would likely be procedurally ineligible, and for whom the state completed a redetermination during unwinding. Data include the subset of those individuals who provided information on race or ethnicity.
Data include changes in outcomes during the state’s 90-day reconsideration period after a procedural disenrollment.
aCategories listed under race and ethnicity are those Arizona used in its analysis based on enrollees’ self-reported information. Individuals do not have to report their race or ethnicity. Individuals can select one or more race and ethnicity categories; as a result, individuals may be counted in more than one category related to race or ethnicity. We did not calculate percentages because the outcome for the same individual could be counted in more than one category.
Maryland
Table 7 provides information on disenrollments and renewals during unwinding in Maryland by age, race and ethnicity, region, and eligibility group.
Table 7: Medicaid and Children’s Health Insurance Program (CHIP) Unwinding Outcomes in Maryland, May 2023-April 2024
|
|
Number of enrollees |
|
Percentage of all completed redeterminations |
|
Percentage of all disenrollments |
||||
|
Characteristic |
Completed redeterminations |
Renewed |
Disenrolled |
|
Renewed |
Disenrolled |
|
Determined ineligible |
Disenrolled for procedural reasonsa |
|
Age group (years) |
|
|
|
||||||
|
0-5 |
197,844 |
159,305 |
38,539 |
|
80.5% |
19.5% |
|
38.5% |
61.5% |
|
6-14 |
322,776 |
270,915 |
51,861 |
|
83.9 |
16.1 |
|
26.6 |
73.4 |
|
15-18 |
133,162 |
107,162 |
26,000 |
|
80.5 |
19.5 |
|
35.7 |
64.3 |
|
19-20 |
55,037 |
36,638 |
18,399 |
|
66.6 |
33.4 |
|
48.9 |
51.1 |
|
21-44 |
521,419 |
383,907 |
137,512 |
|
73.6 |
26.4 |
|
38.5 |
61.5 |
|
45-64 |
249,910 |
183,079 |
66,831 |
|
73.3 |
26.7 |
|
45.0 |
55.0 |
|
65+ |
87,204 |
62,365 |
24,839 |
|
71.5 |
28.5 |
|
51.1 |
48.9 |
|
Race and ethnicityb |
|
|
|
|
|
|
|
|
|
|
American Indian or Alaska Native |
15,023 |
12,086 |
2,937 |
|
80.4 |
19.6 |
|
37.9 |
62.1 |
|
Asian |
90,668 |
69,942 |
20,726 |
|
77.1 |
22.9 |
|
44.5 |
55.5 |
|
Black or African American |
673,952 |
523,601 |
150,351 |
|
77.7 |
22.3 |
|
35.5 |
64.5 |
|
Black and White |
22,611 |
19,804 |
2,807 |
|
87.6 |
12.4 |
|
33.7 |
66.3 |
|
Hispanic or Latino |
276,652 |
213,072 |
63,580 |
|
77.0 |
23.0 |
|
36.2 |
63.8 |
|
Other |
43,594 |
31,459 |
12,135 |
|
72.2 |
27.8 |
|
43.6 |
56.4 |
|
Pacific Islander |
2,326 |
1,652 |
674 |
|
71.0 |
29.0 |
|
42.4 |
57.6 |
|
Two or more races |
17,518 |
14,096 |
3,422 |
|
80.5 |
19.5 |
|
38.7 |
61.3 |
|
Unknown |
12,071 |
7,231 |
4,840 |
|
59.9 |
40.1 |
|
32.8 |
67.2 |
|
White |
412,937 |
310,428 |
102,509 |
|
75.2 |
24.8 |
|
45.3 |
54.7 |
|
Region |
|
|
|
|
|
|
|
|
|
|
Baltimore City |
245,718 |
198,586 |
47,132 |
|
80.8 |
19.2 |
|
32.9 |
67.1 |
|
Baltimore Suburban |
475,007 |
364,336 |
110,671 |
|
76.7 |
23.3 |
|
40.6 |
59.4 |
|
Eastern Shore |
141,406 |
108,965 |
32,441 |
|
77.1 |
22.9 |
|
41.6 |
58.4 |
|
Out of state |
1,312 |
924 |
388 |
|
70.4 |
29.6 |
|
40.2 |
59.8 |
|
Southern Maryland |
79,330 |
60,617 |
18,713 |
|
76.4 |
23.6 |
|
38.2 |
61.8 |
|
Washington Suburban |
494,501 |
371,359 |
123,142 |
|
75.1 |
24.9 |
|
38.5 |
61.5 |
|
Western Maryland |
130,078 |
98,584 |
31,494 |
|
75.8 |
24.2 |
|
44.5 |
55.5 |
|
Eligibility groupc |
|
|
|
|
|
|
|
|
|
|
MAGI |
1,467,515 |
1,119,418 |
348,097 |
|
76.3 |
23.7 |
|
62.0 |
38.0 |
|
MAGI-exempt |
99,837 |
83,953 |
15,884 |
|
84.1 |
15.9 |
|
34.2 |
65.8 |
|
Total |
1,567,352 |
1,203,371 |
363,981 |
|
76.8% |
23.2% |
|
39.2% |
60.8% |
Source: GAO analysis of state information. | GAO‑25‑107413
Notes: Data reflect eligibility redeterminations completed from May 2023 through April 2024. Data include enrollees who went through the state’s standard annual eligibility redetermination process; enrollees who did not go through that process (e.g., individuals who are Medicaid eligible due to eligibility for the federal Supplemental Security Income program or foster care) but instead went through a separate process were not included in the state data, according to Maryland officials. Individuals known to the state to be ineligible due to confirmed out-of-state residence or death also were not included in the data, according to Maryland officials.
Data reflect the initial redetermination decision made during unwinding and do not include subsequent changes in outcomes during the state’s 120-day reconsideration period after a procedural disenrollment, according to Maryland officials.
aProcedural reasons for being disenrolled include, for example, not providing all information needed to redetermine eligibility.
bThe categories listed under race and ethnicity are those the state used in its analysis. “Black and White” includes individuals who identified as both Black and White; “Two or more races” includes all other individuals who identified as two or more races; and “Other” includes individuals whose only reported race or ethnicity was “Other,” according to Maryland officials. Race and ethnicity reflect the state’s analysis of enrollees’ self-reported race and ethnicity as recorded in Medicaid and other state data.
cTo be eligible for Medicaid or CHIP, individuals generally must have an income below a certain limit. The Patient Protection and Affordable Care Act requires states to calculate the income for most nondisabled, nonelderly individuals using modified adjusted gross income (MAGI). Other individuals’ income is not calculated using MAGI. These MAGI-exempt groups include, for example, individuals whose eligibility is determined on the basis of having a disability or being over age 65.
Montana
Table 8 provides information on disenrollments and renewals during unwinding in Montana by age, tribal affiliation, and eligibility group.
Table 8: Medicaid and Children’s Health Insurance Program (CHIP) Unwinding Outcomes in Montana, May 2023-June 2024
|
|
Number of enrollees |
|
Percentage of all completed redeterminations |
|||
|
Characteristic |
Completed redeterminations |
Renewed |
Disenrolled |
|
Renewed |
Disenrolled |
|
Age group (years) |
|
|
|
|
|
|
|
Less than 1 |
488 |
303 |
185 |
|
62.1% |
37.9% |
|
1-5 |
17,512 |
11,139 |
6,373 |
|
63.6 |
36.4 |
|
6-18 |
74,735 |
45,118 |
29,617 |
|
60.4 |
39.6 |
|
19-20 |
8,358 |
2,118 |
6,240 |
|
25.3 |
74.7 |
|
21-64 |
140,200 |
75,076 |
65,124 |
|
53.5 |
46.5 |
|
65 or older |
15,225 |
7,462 |
7,763 |
|
49.0 |
51.0 |
|
Tribal affiliationa |
|
|
|
|
|
|
|
Yes |
34,349 |
21,884 |
12,465 |
|
63.7 |
36.3 |
|
No |
222,169 |
119,332 |
102,837 |
|
53.7 |
46.3 |
|
Eligibility groupb |
|
|
|
|
|
|
|
MAGI |
236,442 |
129,158 |
107,284 |
|
54.6 |
45.4 |
|
MAGI-exempt |
20,076 |
12,058 |
8,018 |
|
60.1 |
39.9 |
|
Total |
256,518 |
141,216 |
115,302 |
|
55.1% |
44.9% |
Source: GAO analysis of state information. | GAO‑25‑107413
Notes: Data reflect eligibility redeterminations completed from May 2023 through June 2024. As of June 2024, the state had not completed about 24,000 additional redeterminations (about 8 percent of redeterminations due).
Data include enrollees who went through the state’s standard eligibility redetermination process; enrollees who did not go through the standard process (e.g., individuals who are Medicaid eligible due to eligibility for the federal Supplemental Security Income program or foster care) but instead went through a separate process were not included in the state data.
Data reflect the initial redetermination decision made during unwinding and do not include subsequent changes in outcomes during the state’s 90-day reconsideration period after a procedural disenrollment.
aTribal affiliation is based on enrollees’ voluntary self-reported affiliation; it is not based on enrollees’ self-reported race or ethnicity.
bTo be eligible for Medicaid or CHIP, individuals generally must have an income below a certain limit. The Patient Protection and Affordable Care Act requires states to calculate the income for most nondisabled, nonelderly individuals using modified adjusted gross income (MAGI). Other individuals’ income is not calculated using MAGI. These MAGI-exempt groups include, for example, individuals whose eligibility is determined on the basis of having a disability or being over age 65.
Additional Montana outcomes data indicated the following:
· Of the enrollees who were part of the state’s Medicaid expansion population and due for a redetermination during unwinding, 44 percent had been disenrolled, 50 percent had been renewed, and 6 percent did not have a completed redetermination as of June 2024.[67] By comparison, of the enrollees who were not part of the Medicaid expansion population, 37 percent had been disenrolled, 48 percent had been renewed, and 15 percent did not have a completed redetermination.
· In five of 56 counties, less than 30 percent of all enrollees due for a redetermination during unwinding were disenrolled as of June 2024; in two counties, more than 50 percent of enrollees had been disenrolled.[68]
New York
Table 9 provides information on disenrollments and renewals during unwinding in New York. The state tracked these outcomes separately for individuals whose eligibility was redetermined centrally through the New York State of Health eligibility system and for those whose eligibility was redetermined by local departments of social services using legacy eligibility systems.[69] Most Medicaid and all CHIP enrollees had their eligibility redetermined centrally through the New York State of Health eligibility system, while certain Medicaid enrollees (e.g., individuals over age 65 or with a disability) had their eligibility redetermined by local departments of social services.
Table 9: Medicaid and Children’s Health Insurance Program (CHIP) Unwinding Outcomes in New York, June 2023-December 2024
|
|
Number of enrollees |
|
Percentage of all completed redeterminations |
|||
|
Subset of enrolleesa |
Completed redeterminations |
Renewed |
Disenrolled |
|
Renewed |
Disenrolled |
|
Medicaid (New York State of Health system) |
4,818,729 |
3,352,427 |
1,466,302 |
|
69.6% |
30.4% |
|
Medicaid (local departments of social services) |
1,267,320 |
1,131,318 |
136,002 |
|
89.3 |
10.7 |
|
CHIP (New York State of Health system) |
267,739 |
248,223 |
19,516 |
|
92.7 |
7.3 |
|
Total |
6,353,788 |
4,731,968 |
1,621,820 |
|
74.5% |
25.5% |
Source: GAO analysis of state information. | GAO‑25‑107413
Notes: Data reflect eligibility redeterminations completed from June 2023 through December 2024. At that time, the state had not yet completed about 70,000 additional redeterminations for enrollees whose eligibility would be redetermined by local departments of social services; those redeterminations accounted for 1 percent of all unwinding redeterminations due. For enrollees who had their eligibility redetermined centrally through the New York State of Health system, data include changes in outcomes that occurred during the state’s 90-day reconsideration period after a procedural disenrollment, according to New York officials. Certain individuals, such as those who moved out of state, withdrew from coverage, or died before the state sent a renewal form, and individuals eligible for Medicaid due to receiving Supplemental Security Income, were not included in the data, according to New York officials.
aMost Medicaid and all CHIP enrollees had their eligibility redetermined centrally through the New York State of Health eligibility system. Certain Medicaid enrollees (e.g., individuals over age 65 or with a disability) had their eligibility redetermined by local departments of social services using legacy eligibility systems
Table 10 through Table 13 provide information on renewals and disenrollments by age, region, written language, and race and ethnicity for the 5.1 million Medicaid and CHIP enrollees whose eligibility was redetermined through the New York State of Health eligibility system. Those enrollees account for about 80 percent of all completed unwinding redeterminations.[70]
Table 10: Medicaid and Children’s Health Insurance Program Unwinding Outcomes in New York (New York State of Health system enrollees only) by Age, June 2023-May 2024
|
|
Number of enrollees |
|
Percentage of all completed redeterminations |
|||
|
Age group (years) |
Completed redeterminations |
Renewed |
Disenrolled |
|
Renewed |
Disenrolled |
|
0-17 |
1,602,302 |
1,463,895 |
138,407 |
|
91.4% |
8.6% |
|
18-25 |
736,795 |
444,921 |
291,874 |
|
60.4 |
39.6 |
|
26-34 |
814,254 |
463,921 |
350,333 |
|
57.0 |
43.0 |
|
35-44 |
723,825 |
457,399 |
266,426 |
|
63.2 |
36.8 |
|
45-54 |
559,007 |
358,517 |
200,490 |
|
64.1 |
35.9 |
|
55-64 |
518,502 |
341,728 |
176,774 |
|
65.9 |
34.1 |
|
65+ |
131,783 |
70,269 |
61,514 |
|
53.3 |
46.7 |
|
Total |
5,086,468 |
3,600,650 |
1,485,818 |
|
70.8% |
29.2% |
Source: GAO analysis of state information. | GAO‑25‑107413
Notes: Data reflect eligibility redeterminations completed from June 2023 through May 2024 for the 5.1 million enrollees whose eligibility was redetermined centrally through the New York State of Health eligibility system. Data include changes in outcomes that occurred during the state’s 90-day reconsideration period after a procedural disenrollment, according to New York officials. Data do not include 1.3 million enrollees whose eligibility was redetermined by local departments of social services, which use legacy eligibility systems (e.g., individuals over age 65 or with a disability). Certain individuals, such as those who moved out of state, withdrew from coverage, or died before the state sent a renewal form, were not included in the data, according to New York officials.
Table 11: Medicaid and Children’s Health Insurance Program Unwinding Outcomes in New York (New York State of Health system enrollees only) by Region, June 2023-May 2024
|
|
Number of enrollees |
|
Percentage of all completed redeterminations |
|||
|
Region |
Completed redeterminations |
Renewed |
Disenrolled |
|
Renewed |
Disenrolled |
|
Capital / Mid-Hudson / North Country |
833,274 |
607,508 |
225,766 |
|
72.9% |
27.1% |
|
Central |
639,385 |
444,833 |
194,552 |
|
69.6 |
30.4 |
|
Long Island |
587,201 |
419,787 |
167,414 |
|
71.5 |
28.5 |
|
New York City |
2,699,161 |
1,897,889 |
801,272 |
|
70.3 |
29.7 |
|
Western |
327,447 |
230,633 |
96,814 |
|
70.4 |
29.6 |
|
Total |
5,086,468 |
3,600,650 |
1,485,818 |
|
70.8% |
29.2% |
Source: GAO analysis of state information. | GAO‑25‑107413
Notes: Data reflect eligibility redeterminations completed from June 2023 through May 2024 for the 5.1 million enrollees whose eligibility was redetermined centrally through the New York State of Health eligibility system. Data include changes in outcomes that occurred during the state’s 90-day reconsideration period after a procedural disenrollment, according to New York officials. Data do not include 1.3 million enrollees whose eligibility was redetermined by local departments of social services, which use legacy eligibility systems (e.g., individuals over age 65 or with a disability). Certain individuals, such as those who moved out of state, withdrew from coverage, or died before the state sent a renewal form, were not included in the data, according to New York officials.
Table 12: Medicaid and Children’s Health Insurance Program Unwinding Outcomes in New York (New York State of Health system enrollees only) by Written Language, June 2023-May 2024
|
|
Number of enrollees |
|
Percentage of all completed redeterminations |
|||
|
Written language |
Completed redeterminations |
Renewed |
Disenrolled |
|
Renewed |
Disenrolled |
|
Albanian |
750 |
565 |
185 |
|
75.3% |
24.7% |
|
Arabic |
4,645 |
3,811 |
834 |
|
82.0 |
18.0 |
|
Bengali |
2,779 |
2,160 |
619 |
|
77.7 |
22.3 |
|
Burmese |
1,272 |
892 |
380 |
|
70.1 |
29.9 |
|
Chinese |
144,751 |
115,380 |
29,371 |
|
79.7 |
20.3 |
|
English |
3,901,415 |
2,695,561 |
1,205,854 |
|
69.1 |
30.9 |
|
French |
5,002 |
3,642 |
1,360 |
|
72.8 |
27.2 |
|
French Creole |
958 |
591 |
367 |
|
61.7 |
38.3 |
|
Greek |
220 |
149 |
71 |
|
67.7 |
32.3 |
|
Haitian Creole |
4,050 |
2,727 |
1,323 |
|
67.3 |
32.7 |
|
Hindi |
466 |
339 |
127 |
|
72.7 |
27.3 |
|
Italian |
564 |
388 |
176 |
|
68.8 |
31.2 |
|
Japanese |
451 |
297 |
154 |
|
65.9 |
34.1 |
|
Karen |
1,064 |
825 |
239 |
|
77.5 |
22.5 |
|
Korean |
9,111 |
6,294 |
2,817 |
|
69.1 |
30.9 |
|
Nepali |
636 |
419 |
217 |
|
65.9 |
34.1 |
|
Polish |
1,696 |
1,142 |
554 |
|
67.3 |
32.7 |
|
Russian |
34,423 |
24,751 |
9,672 |
|
71.9 |
28.1 |
|
Somali |
313 |
259 |
54 |
|
82.7 |
17.3 |
|
Spanish |
968,484 |
737,874 |
230,610 |
|
76.2 |
23.8 |
|
Swahili |
415 |
347 |
68 |
|
83.6 |
16.4 |
|
Tagalog |
95 |
65 |
30 |
|
68.4 |
31.6 |
|
Tigrinya |
62 |
44 |
18 |
|
71.0 |
29.0 |
|
Traditional Chinese |
894 |
689 |
205 |
|
77.1 |
22.9 |
|
TWI |
30 |
25 |
5 |
|
83.3 |
16.7 |
|
Urdu |
785 |
611 |
174 |
|
77.8 |
22.2 |
|
Vietnamese |
772 |
538 |
234 |
|
69.7 |
30.3 |
|
Yiddish |
365 |
265 |
100 |
|
72.6 |
27.4 |
|
Total |
5,086,468 |
3,600,650 |
1,485,818 |
|
70.8% |
29.2% |
Source: GAO analysis of state information. | GAO‑25‑107413
Notes: Data reflect eligibility redeterminations completed from June 2023 through May 2024 for the 5.1 million enrollees whose eligibility was redetermined centrally through the New York State of Health eligibility system. Data include changes in outcomes that occurred during the state’s 90-day reconsideration period after a procedural disenrollment, according to New York officials. Data do not include 1.3 million enrollees whose eligibility was redetermined by local departments of social services, which use legacy eligibility systems (e.g., individuals over age 65 or with a disability). Individuals enrolling through the New York State of Health eligibility system must select their preferred written language on their application. Certain individuals, such as those who moved out of state, withdrew from coverage, or died before the state sent a renewal form, were not included in the data, according to New York officials.
Table 13: Medicaid and Children’s Health Insurance Program Unwinding Outcomes in New York (New York State of Health system enrollees only) by Race and Ethnicity, June 2023-May 2024
|
|
Number of enrollees |
||
|
Characteristic |
Completed redeterminations |
Renewed |
Disenrolled |
|
Racea |
|||
|
African |
12,592 |
9,254 |
3,338 |
|
American Indian or Alaskan Native |
25,244 |
17,361 |
7,883 |
|
Asian Indian |
102,467 |
71,323 |
31,144 |
|
Bangladeshi |
13,816 |
10,553 |
3,263 |
|
Black or African American |
686,571 |
468,734 |
217,837 |
|
Burmese |
529 |
376 |
153 |
|
Chinese |
220,642 |
171,265 |
49,377 |
|
Filipino |
17,632 |
11,484 |
6,148 |
|
Guamanian or Chamorro |
2,635 |
2,043 |
592 |
|
Haitian |
6,115 |
4,158 |
1,957 |
|
Jamaican |
7,468 |
5,450 |
2,018 |
|
Japanese |
5,202 |
3,408 |
1,794 |
|
Korean |
26,114 |
17,370 |
8,744 |
|
Middle Eastern or North African |
13,726 |
11,112 |
2,614 |
|
Native Hawaiian |
1,107 |
777 |
330 |
|
Other |
425,915 |
316,955 |
108,960 |
|
Other Asian |
143,040 |
104,658 |
38,382 |
|
Other Pacific Islander |
9,351 |
6,476 |
2,875 |
|
Pakistani |
3,354 |
2,684 |
670 |
|
Samoan |
800 |
582 |
218 |
|
Taiwanese |
366 |
270 |
96 |
|
Unknownb |
1,975,702 |
1,390,834 |
584,868 |
|
Vietnamese |
8,890 |
6,157 |
2,733 |
|
White |
1,513,546 |
1,067,388 |
446,158 |
|
Ethnicitya |
|||
|
Hispanic – Yes |
1,347,149 |
986,407 |
360,742 |
|
Hispanic – No |
2,723,012 |
1,913,113 |
809,899 |
|
Hispanic – Unknownb |
1,016,307 |
701,130 |
315,177 |
Source: GAO analysis of state information. | GAO‑25‑107413
Notes: Data reflect eligibility redeterminations completed from June 2023 through May 2024 for the 5.1 million enrollees whose eligibility was redetermined centrally through the New York State of Health eligibility system. Data include changes in outcomes that occurred during the state’s 90-day reconsideration period after a procedural disenrollment, according to New York officials. Data do not include 1.3 million enrollees whose eligibility was redetermined by local departments of social services using legacy eligibility systems (e.g., individuals over age 65 or with a disability). Certain individuals, such as those who moved out of state, withdrew from coverage, or died before the state sent a renewal form, were not included in the data, according to New York officials.
aCategories listed under race and ethnicity are those New York used in its analysis based on enrollees’ self-reported information. Individuals do not have to report their race or ethnicity. Individuals can select one or more race categories; as a result, individuals may be counted in more than one race category. We did not calculate percentages because the outcome for the same individual could be counted in more than one category.
bThe “Unknown” category includes individuals who indicated “Don’t know” or “Choose not to answer,” according to New York officials.
Wisconsin
Table 14 provides information on disenrollments and renewals during unwinding in Wisconsin by race and ethnicity.
Table 14: Medicaid and Children’s Health Insurance Program Unwinding Outcomes in Wisconsin, June 2023-June 2024
|
|
Number of enrollees |
|
Percentage of all completed redeterminations |
|
Percentage of all disenrollments |
||||
|
Characteristic |
Completed redeterminations |
Renewed |
Disenrolled |
|
Renewed |
Disenrolled |
|
Determined ineligible |
Disenrolled for procedural reasonsa |
|
Raceb |
|
|
|
|
|
|
|
|
|
|
American Indian or Alaskan Native |
22,992 |
16,654 |
6,338 |
|
72.4% |
27.6% |
|
33.2% |
66.8% |
|
Asian |
46,751 |
33,876 |
12,875 |
|
72.5 |
27.5 |
|
37.9 |
62.1 |
|
Black or African American |
197,636 |
147,940 |
49,696 |
|
74.9 |
25.1 |
|
34.1 |
65.9 |
|
Hispanic or Latino |
105,305 |
75,453 |
29,852 |
|
71.7 |
28.3 |
|
33.4 |
66.6 |
|
Multi-Race |
101,725 |
74,139 |
27,586 |
|
72.9 |
27.1 |
|
34.8 |
65.2 |
|
Native Hawaiian or Pacific Islander |
1,135 |
787 |
348 |
|
69.3 |
30.7 |
|
32.8 |
67.2 |
|
Race not provided |
163,694 |
123,198 |
40,496 |
|
75.3 |
24.7 |
|
46.8 |
53.2 |
|
White |
780,527 |
557,738 |
222,789 |
|
71.5 |
28.5 |
|
37.2 |
62.8 |
|
Ethnicityb |
|
|
|
|
|
|
|
|
|
|
Hispanic or Latino |
165,339 |
118,460 |
46,879 |
|
71.6 |
28.4 |
|
33.9 |
66.1 |
|
Not Hispanic or Latino |
1,245,551 |
910,335 |
335,216 |
|
73.1 |
26.9 |
|
36.8 |
63.2 |
|
Ethnicity not provided |
8,875 |
990 |
7,885 |
|
11.2 |
88.8 |
|
79.3 |
20.7 |
|
Total |
1,419,765 |
1,029,785 |
389,980 |
|
72.5% |
27.5% |
|
37.3% |
62.7% |
Source: GAO analysis of state information. | GAO‑25‑107413
Notes: Data reflect eligibility redeterminations completed from June 2023 through June 2024. Data include changes in outcomes that occurred during the state’s 90-day reconsideration period after a procedural disenrollment.
Data include enrollees who went through the state’s standard eligibility redetermination process; enrollees who did not go through the standard process (e.g., individuals who are Medicaid eligible due to eligibility for the federal Supplemental Security Income program or foster care) but instead went through a separate process were not included in the state data. About 77,000 enrollees who were asked to reapply for coverage instead of renew their existing coverage, due to an eligibility systems limitation, also were not included in the data.
aProcedural reasons for being disenrolled include, for example, not providing all information needed to redetermine eligibility.
bCategories listed under race and ethnicity are those Wisconsin used in its analysis based on enrollees’ self-reported information. Individuals do not have to report their race or ethnicity.
Wisconsin officials told us they also analyzed disenrollments and renewals during unwinding by age, geographic location, preferred language, and eligibility group. Officials said they identified some differences in outcomes by some of those population characteristics, but the available state data were not sufficient for our reporting purposes.
GAO Contact
Michelle B. Rosenberg, RosenbergM@gao.gov
Staff Acknowledgments
In addition to the contact named above, Susan Barnidge (Assistant Director), Dhara Patel (Analyst-in-Charge), Robin Burke, and Jasleen Modi made key contributions to this report. Also contributing were Laura Elsberg, David Jones, Eric Peterson, Jennifer Rudisill, and Jeffrey Tamburello.
The Government Accountability Office, the audit, evaluation, and investigative arm of Congress, exists to support Congress in meeting its constitutional responsibilities and to help improve the performance and accountability of the federal government for the American people. GAO examines the use of public funds; evaluates federal programs and policies; and provides analyses, recommendations, and other assistance to help Congress make informed oversight, policy, and funding decisions. GAO’s commitment to good government is reflected in its core values of accountability, integrity, and reliability.
Obtaining Copies of GAO Reports and Testimony
The fastest and easiest way to obtain copies of GAO documents at no cost is through our website. Each weekday afternoon, GAO posts on its website newly released reports, testimony, and correspondence. You can also subscribe to GAO’s email updates to receive notification of newly posted products.
Order by Phone
The price of each GAO publication reflects GAO’s actual cost of production and distribution and depends on the number of pages in the publication and whether the publication is printed in color or black and white. Pricing and ordering information is posted on GAO’s website, https://www.gao.gov/ordering.htm.
Place orders by calling (202) 512-6000, toll free (866) 801-7077,
or
TDD (202) 512-2537.
Orders may be paid for using American Express, Discover Card, MasterCard, Visa, check, or money order. Call for additional information.
Connect with GAO
Connect with GAO on X,
LinkedIn, Instagram, and YouTube.
Subscribe to our Email Updates. Listen to our Podcasts.
Visit GAO on the web at https://www.gao.gov.
To Report Fraud, Waste, and Abuse in Federal Programs
Contact FraudNet:
Website: https://www.gao.gov/about/what-gao-does/fraudnet
Automated answering system: (800) 424-5454
Media Relations
Sarah Kaczmarek, Managing Director, Media@gao.gov
Congressional Relations
A. Nicole Clowers, Managing Director, CongRel@gao.gov
General Inquiries
[1]Medicaid finances health care for certain low-income and medically needy individuals, and CHIP does so for certain uninsured children whose household incomes are too high for Medicaid eligibility but may be too low to afford private insurance. Both are federal-state programs.
[2]For purposes of our report, “states” includes the District of Columbia.
[3]States can operate CHIP as a separate program, include CHIP-eligible children in an expansion of their Medicaid program, or use a combination of the two approaches. For example, 39 states operate a combination of the two approaches, covering some CHIP-eligible children through their Medicaid program and others through a separate CHIP program, according to the Centers for Medicare & Medicaid Services (CMS).
[4]Pub. L. No. 116-127, div. F, § 6008, 134 Stat. 178, 208 (2020). The Families First Coronavirus Response Act provided a temporary 6.2 percentage-point increase to the Federal Medical Assistance Percentage rates for states that met certain requirements, such as keeping beneficiaries continuously enrolled in the program. The Federal Medical Assistance Percentage is the statutory formula used to determine the federal funding states receive for Medicaid and is one component in the statutory calculation of the CHIP match rate. As a result, when a state’s Federal Medical Assistance Percentage rate increased, its federal match rate for CHIP would generally also increase, though not necessarily by the same amount.
[5]Pub. L. No. 117-328, § 5131, 136 Stat. 4459, 5949 (2022) (codified as amended at 42 U.S.C. § 1396a note). The Consolidated Appropriations Act, 2023, separated the end of the continuous enrollment condition from the end of the COVID-19 public health emergency, which ended on May 11, 2023.
[6]CMS initially required states to complete redeterminations for all Medicaid and CHIP enrollees within 14 months of the state beginning unwinding. Later, in August 2024, CMS gave states a deadline of December 31, 2025, to complete all unwinding redeterminations.
[7]We are reporting the race and ethnicity terms used by the Department of Health and Human Services’s analysis. For more information on the analysis, see Department of Health and Human Services, Office of the Assistant Secretary for Planning and Evaluation, Unwinding the Medicaid Continuous Enrollment Provision: Projected Enrollment Effects and Policy Approaches, Issue Brief HP-2022-20 (Washington, D.C.: Aug. 2022).
[8]When eligible people lose coverage, it can result in "churn" when people move out of and back into Medicaid coverage.
[9]See Pub. L. No. 117-328, div. FF, tit. V, subtit. D, § 5131(b), 136 Stat. 4459, 5950 (codified as amended at 42 U.S.C. § 1396a(tt)).
[10]While states reported on redeterminations that were completed as early as March 2023, disenrollments did not take effect until the following month. For example, disenrollments reported for March 2023 did not take effect until April 2023.
[11]The act required CMS to make state unwinding reports for April 2023 through June 2024 publicly available. See Centers for Medicare & Medicaid Services, Monthly Data Reports, accessed March 11, 2025, https://www.medicaid.gov/resources-for-states/coronavirus-disease-2019-covid-19/unwinding-and-returning-regular-operations-after-covid-19/data-reporting/monthly-data-reports/index.html.
[12]Pub. L. No. 116-136, § 19010(b), 134 Stat. 281, 580 (2020). All of our reports related to the COVID-19 pandemic are available on our website at https://www.gao.gov/coronavirus.
[13]CMS has publicly shared preliminary data reported by states as well as updated data, which has generally lagged the preliminary data by five or more months. The updated data includes the outcomes of millions of cases that were pending in the preliminary data. Pending redeterminations are those that were initiated but were not completed in the month due. The agency has analyzed both the preliminary and updated data but has indicated that the latter are the more complete.
[14]CMS reports data based on cohorts of enrollees that have their redeterminations scheduled to be completed in a given month, referred to as “due” in the state reporting. We reviewed CMS data published in January 2025 for the monthly cohorts of redeterminations scheduled to be completed from March 2023 through June 2024, which is the time period when most states originally expected to complete all unwinding redeterminations. For each monthly cohort, these data generally include the redetermination outcomes as of 3 months after the redetermination was scheduled to be completed. Thus, data for the March 2023 cohort includes outcomes for redeterminations completed as of June 2023, and the data for the June 2024 cohort includes outcomes for redeterminations completed as of September 2024.
[15]States were not required to analyze unwinding outcomes by population characteristics. For example, CMS did not require states to analyze outcomes by categories related to race and ethnicity that are in line with the Office of Management and Budget’s Statistical Policy Directive No. 15: Standards for Maintaining, Collecting, and Presenting Federal Data on Race and Ethnicity.
[16]Individuals must also meet nonfinancial criteria such as citizenship and residency requirements. Individuals may meet the criteria for more than one group but are generally only enrolled under one basis of eligibility. For example, a child who has a disability could meet the eligibility criteria for children as well as an individual with a disability. States must assess eligibility on all bases before terminating enrollment.
[17]For the purposes of this report, we use the term assets to refer to resources, which include anything owned, such as bank accounts or property, that can be converted to cash. See Centers for Medicare & Medicaid Services, State Medicaid Manual § 3250 (definition of resource).
[18]In fiscal year 2023, Medicaid-expansion CHIP programs accounted for about two-thirds of all children enrolled in CHIP. See Medicaid and CHIP Payment and Access Commission, MACStats: Medicaid and CHIP Data Book, (Washington, D.C.: Dec. 2024). The continuous enrollment condition did not apply to separate CHIP programs. However, most states sought, and CMS granted, authority to delay renewal processing, extend renewal deadlines, or maintain continuous enrollment for separate CHIP program enrollees through a state plan option or waiver, according to CMS officials.
[19]The data may reflect the outcomes from two redeterminations for some enrollees—the unwinding redetermination and the routine redetermination completed later in the period, generally 12 months later. Data reflect redeterminations that were due for completion from March 2023 through June 2024.
[20]When the state is not able to complete a redetermination on an ex parte basis, it must provide the enrollee with a renewal form and request any additional information needed to complete the redetermination.
[21]States must take several steps before disenrolling individuals, including considering all potential bases of eligibility. See 42 C.F.R. § 435.916(d) (2024).
[22]Marketplaces were established through the Patient Protection and Affordable Care Act. See Pub. L. No. 111-148, 124 Stat. 119 (2010). That act also established premium tax credits and cost-sharing reductions that are available to certain individuals to help them afford coverage.
[23]See 42 U.S.C. § 1396a(e)(14)(A). According to CMS guidance issued in November 2024, some of the flexibilities CMS granted to states during unwinding may continue long term at state option under Medicaid or CHIP state plan authority, some will become required under a final rule CMS issued in April 2024, and others will sunset after June 30, 2025.
[24]We recommended CMS document and implement the oversight practices the agency learned during unwinding were needed to prevent and detect state compliance issues with redetermination requirements. As of April 2025, the recommendation had been partially implemented with additional steps planned by CMS to evaluate unwinding efforts and incorporate lessons learned. See GAO, Medicaid: Federal Oversight of State Eligibility Redeterminations Should Reflect Lessons Learned After COVID-19, GAO‑24‑106883 (Washington, D.C.: July 18, 2024).
[25]At least 23 states paused some or all procedural disenrollments during unwinding. See GAO‑24‑106883.
[26]See 42 U.S.C. § 1396a(tt). Some of the required reporting outcomes—such as certain enrollment data and call center wait times—were captured by existing CMS data collection efforts. For example, CMS collects detailed Medicaid and CHIP enrollment data in the agency’s Transformed Medicaid Statistical Information System.
[27]CMS extended reporting requirements due to their usefulness in monitoring compliance with federal redetermination requirements and to enhance transparency on Medicaid and CHIP redetermination outcomes. See Centers for Medicare & Medicaid Services, State Health Official Letter #24-002: Continuation of Certain Medicaid and CHIP Eligibility Processing Data Reporting, (Baltimore, Md.: May 30, 2024).
[28]Completed redeterminations are those that ended in a renewal or disenrollment. We calculated the percentage of individuals with a completed redetermination that were disenrolled for redeterminations due for completion from March 2023 through June 2024. As noted earlier, for each monthly cohort of redeterminations, the data generally include the redetermination outcomes as of 3 months after the redetermination was scheduled to be completed. Redeterminations completed more than 3 months after the month they were due are generally not included in the data. Thus, for example, data for the March 2023 cohort includes outcomes for redeterminations completed as of June 2023 and data for the June 2024 cohort includes outcomes for redeterminations that were completed as of September 2024.
[29]Medicaid and CHIP disenrollments take effect in the month after they are determined (e.g., September disenrollments take effect in October). As a result, the net decline in enrollment from March 2023 through October 2024 reflects disenrollments through September 2024.
[30]At least 35 states have reinstated coverage for enrollees who were disenrolled erroneously during unwinding, according to CMS. For example, CMS data indicate that in 28 of the 29 states that did not always conduct ex parte reviews for each individual in a household as required, roughly 420,000 children and adults lost Medicaid coverage, as of January 2024. All of these individuals had been reinstated, according to CMS officials.
[31]CMS publishes data on enrollees by benefit package for Medicaid and CHIP enrollees by year. According to these data, about 8.1 million enrollees had limited benefits in 2022.
[32]In certain circumstances, states may disenroll enrollees for procedural reasons, such as when enrollees do not timely submit all the information required to have their eligibility redetermined and coverage renewed. In addition, states can renew enrollees through an ex parte process, which allows states to renew enrollees based on available reliable data, without contacting enrollees for additional information.
[33]See 42 U.S.C. § 1396a(e)(14)(A). According to CMS guidance issued in November 2024, some of the flexibilities CMS granted to states during unwinding will continue long-term.
[34]This e(14) waiver permits a state to complete ex parte renewals when no income data is returned from data sources for individuals who were previously enrolled or whose coverage was renewed based on a verified attestation of zero dollar income or income at or below 100 percent of the federal poverty level.
[35]The remaining state, Maine, completed 27 percent of renewals through the ex parte process. According to CMS officials, Maine may have had the lowest percentage of disenrolled due to its pause on procedural disenrollments.
[36]North Carolina and South Dakota are considered expansion states in this analysis.
[37]For more information on how CMS used data during unwinding as part of its oversight, including to identify and address states’ lack of compliance with federal redetermination requirements, see GAO‑24‑106883.
[38]For this analysis, CMS defined child as it was defined by the state for Medicaid or CHIP. The age limit for a "child" varied from state to state, and child enrollment likely included "children" up to age 24 whose coverage was maintained as a requirement of the Medicaid continuous enrollment condition.
[39]Under Medicaid and CHIP, income eligibility limits vary by state, but childless adults in states that have expanded Medicaid are generally eligible if their income is below 133 percent of the federal poverty level, whereas the income limit for CHIP can generally range from 170 percent to 400 percent of the federal poverty level.
[40]This CMS analysis focuses on individuals who were disenrolled from full benefit Medicaid or CHIP or transitioned to limited benefit coverage from March 31, 2023, through December 31, 2023. Some individuals in Medicaid are eligible for full Medicaid benefits and others for limited benefits. For example, benefits may be limited to certain services, such as family planning, or care provided for a specific condition like tuberculosis.
[41]For additional information, see Centers for Medicare & Medicaid Services, Medicaid & CHIP Leavers and Coverage Transitions: By Eligibility Category and Home & Community-Based Services (HCBS) 1915(c) Waiver Enrollment, March 31-December 31, 2023, (November 2024).
[42]The percentages of individuals disenrolled or transitioned to limited benefit coverage exclude enrollees who died or moved to another state’s Medicaid program.
[43]Children generally have higher income limits than adults under the age of 65 and who do not have a disability.
[44]All state Medicaid programs finance coverage of long-term services and supports, which help beneficiaries with physical, cognitive, or other limitations performing routine daily activities, such as eating, dressing, and making meals. When these services are provided in beneficiaries’ homes or other community settings, the services are known as home and community-based services.
[45]This analysis focused on individuals receiving home- and community-based services under waiver programs authorized under section 1915(c) of the Social Security Act. 42 U.S.C. § 1396n(c). In addition, it focused on individuals who were disenrolled from full benefit Medicaid or CHIP or transitioned to limited benefit coverage from March 31, 2023, through December 31, 2023. See Centers for Medicare & Medicaid Services, Medicaid & CHIP Leavers and Coverage Transitions.
[46]The percentage of individuals disenrolled or transitioned to limited benefit coverage excludes individuals who died or moved to another state’s Medicaid program.
[47]CMS has some national and state-specific data on individuals who transitioned to employer-sponsored coverage by age and eligibility group. Officials told us they do not plan to make the data or analyses publicly available due to the amount of missing data.
[48]States can either use the federal marketplace platform (Healthcare.gov) or run their own state-based marketplace using their own platform.
[49]CMS officials said that at least 460,000 individuals also obtained health care coverage in states with a state-based marketplace that operate a Basic Health Program or related program, which provides coverage to certain low-income individuals who are not eligible for Medicaid or CHIP and otherwise would be eligible for marketplace coverage.
[50]This CMS analysis focuses on individuals who were disenrolled from full benefit Medicaid or CHIP coverage from March 31, 2023, through December 31, 2023. Thirty-two states used the federal marketplace platform for the 2024 coverage period. CMS did not include data on enrollees moving to other states and those with state-based marketplaces using their own platform due to data limitations. See Centers for Medicare & Medicaid Services, Medicaid & CHIP Leavers and Coverage Transitions.
[51]This CMS analysis focuses on individuals who were disenrolled from full benefit Medicaid or CHIP coverage from March 31, 2023, through December 31, 2023, and returned to Medicaid or CHIP in the same state from which they were disenrolled. See Centers for Medicare & Medicaid Services, Medicaid & CHIP Leavers and Coverage Transitions.
[52]For this analysis, CMS defined children as individuals aged 0 to 18 who were not in a disability- or pregnancy-related eligibility group.
[53]Federal law generally requires states to provide continuous coverage to pregnant women enrolled in Medicaid or CHIP through approximately 60 days postpartum. See 42 C.F.R. § 435.170 (2024). The American Rescue Plan Act of 2021 gave states the option to extend Medicaid and CHIP postpartum coverage to 12 months, but the authority was set to expire on April 1, 2022. See Pub. L. No. 117-2, §§ 9812, 9822, 135 Stat. 4, 212, 220. Under the Consolidated Appropriations Act, 2023, this option was made permanent. See Pub. L. No. 117-328, div. FF, tit. V, subtit. B, § 5113, 136 Stat. 4459, 5940 (2022). In March 2023, 31 states had extended Medicaid postpartum coverage beyond the 60 days. That number increased to 47 states as of May 2024.
[54]To be eligible for coverage in Montana, individuals aged 19 and older generally must have a lower income than children aged 18 and under.
[55]Maryland data reflect redeterminations completed from May 2023 through April 2024. State date also showed, for procedural disenrollments by age, that among individuals who were disenrolled, children aged 18 and under had a larger percentage of procedural disenrollments than most other age groups.
[56]Arizona data reflect redeterminations completed from April 2023 through March 2024.
[57]Maryland data reflect redeterminations completed from May 2023 through April 2024.
[58]New York data reflect redeterminations completed from June 2023 through May 2024 for the 5.1 million Medicaid and CHIP enrollees whose eligibility was redetermined centrally though a state eligibility system. Data do not include redeterminations for the 1.3 million enrollees whose eligibility was redetermined by local departments of social services because disenrollments by region were not available for those enrollees, state officials said.
[59]Maryland data reflect redeterminations completed from May 2023 through April 2024. Data are based on enrollees’ self-reported race and ethnicity and reflect the categories the state used in its analysis. “Black and White” includes individuals who identified as both Black and White; “two or more other races” includes all other individuals who identified as two or more races; and “other” includes individuals whose only reported race or ethnicity was “other,” Maryland officials said. Enrollees can choose not to report their race and ethnicity. Individuals of unknown race and ethnicity accounted for less than 1 percent of unwinding redeterminations in Maryland.
[60]Wisconsin data reflect redeterminations completed from June 2023 through June 2024. Data are based on enrollees’ self-reported race and ethnicity and reflect the categories the state used in its analysis. Enrollees could choose not to report their race. Enrollees who did not report their race accounted for 12 percent of unwinding redeterminations in Wisconsin.
[61]New York data reflect redeterminations completed from June 2023 through May 2024 for the 5.1 million Medicaid and CHIP enrollees whose eligibility was redetermined centrally though a state eligibility system. Data do not include redeterminations for the 1.3 million enrollees whose eligibility was redetermined by local departments of social services because disenrollments by language were not available for those enrollees, state officials said.
[62]State officials noted that the state has programs in which partner organizations with staff who speak more than 60 languages can help enrollees renew coverage. During unwinding, the state sent monthly reports to these partners about which enrollees had been procedurally disenrolled, to facilitate outreach and reenrollment for eligible individuals.
[63]Montana data reflect redeterminations completed from May 2023 through June 2024. As of June 2024, the state had not completed about 8 percent of redeterminations due.
[64]States were not required to analyze unwinding outcomes by population characteristics. For example, CMS did not require states to analyze outcomes by categories related to race and ethnicity that are in line with the Office of Management and Budget’s Statistical Policy Directive No. 15: Standards for Maintaining, Collecting, and Presenting Federal Data on Race and Ethnicity.
[65]State officials noted that adults aged 19 and older were a larger share of disenrollments when compared to their overall share of the enrollee population. Adults accounted for 66 percent of disenrollments during unwinding and were 58 percent of the state’s total Medicaid and CHIP population in May 2024. Officials told us they were not able to separately report enrollment for children and adults before May 2024. However, they estimated that as of January 1, 2023, prior to unwinding, adults aged 19 and older were about 61 percent of total enrollees. (January 2023 data exclude enrollees with Medicare Savings Programs-only Medicaid coverage.) The state also published a zip code-level map that identified areas where people were at high risk of losing coverage due to not completing renewal paperwork.
[66]Arizona officials told us that this analysis was completed at the request of stakeholders.
[67]Montana’s Medicaid expansion program is for adults with incomes up to 138 percent of the federal poverty level.
[68]These percentages are based on the total number of redeterminations due in a county, rather than the total number of redeterminations completed as of June 2024.
[69]The New York State of Health system is the state’s health plan marketplace for individuals and families who may qualify for Medicaid, CHIP, and certain other health care coverage.
[70]The tables do not include information for the 1.3 million enrollees whose eligibility was redetermined by local departments of social services. Those local departments rely on older legacy eligibility systems that do not provide data that are consistent and comparable with eligibility data available through the New York State of Health system, state officials said. As a result, information on renewals and disenrollments by age, region, written language, race, and ethnicity were not available, according to these officials. State officials said the state is in the process of implementing a new Medicaid eligibility system for individuals whose eligibility is processed through local departments, which would facilitate more consistent and reliable reporting in the future.