HEALTH SAVINGS ACCOUNTS
Information on Features and Use, and Characteristics of Account Holders
Report to the Ranking Member Committee on Ways and Means
House of Representatives
United States Government Accountability Office
Highlights of GAO-25-107480, a report to the Ranking Member, Committee on Ways and Means, House of Representatives.
For more information, contact: John E. Dicken at dickenj@gao.gov.
Why This Matters
Health savings accounts (HSA) allow eligible people to save funds tax-free to pay for qualified medical expenses and can earn interest, be invested, and be carried into retirement. In 2023, HSAs held about $123 billion in assets. Some policymakers have raised concerns that wealthier people may use HSAs to accumulate tax-free savings and people with lower incomes may lack the funds to contribute.
GAO Key Takeaways
To open or contribute to an HSA, an individual must be enrolled in an HSA-eligible high-deductible health plan. These plans have relatively high deductibles, but often lower premiums and may be available to individuals through their employers, health insurance marketplaces, or issuers.
Of the nine HSA providers we interviewed, eight focused their marketing efforts on employers, and all had at least one fee associated with their HSA that account holders may have to pay.
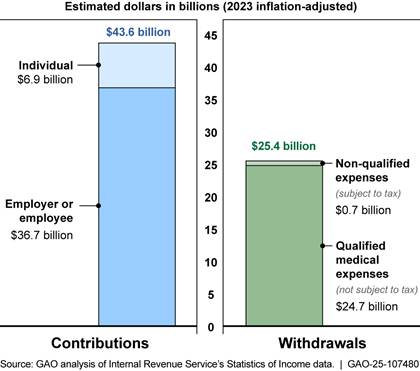
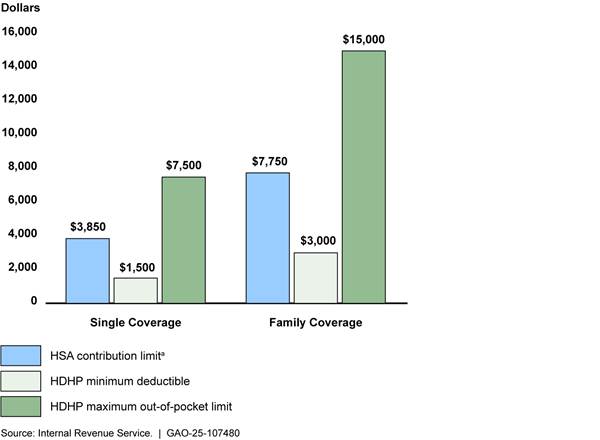
In 2022, an estimated $43.6 billion in contributions and $25.4 billion in withdrawals were reported among the 16.5 million tax returns reporting HSA activity, according to Internal Revenue Service (IRS) data. Of the reported contributions, about 84 percent were from an employer or employee through payroll deductions, and 16 percent were from individuals directly to their HSAs. Of the reported withdrawals, over 97 percent were for qualified medical expenses; the remaining were for non-qualified expenses—such as groceries—that are subject to taxes.
We found that, among individuals in plans with high deductibles, HSAs and similar medical expense accounts were more common among those with higher incomes, Asian or White individuals, those in excellent or very good health, and those with employer-sponsored plans.
Note: Internal Revenue Service data from 2022 was the most recent year available at the time of our review.
How GAO Did This Study
We obtained responses from nine HSA providers that varied by size and geography. We also reviewed information from federal agencies, including the IRS and Centers for Disease Control and Prevention, and from stakeholder groups, including those representing consumers and industry.
This is a work of the U.S. government and is not subject to copyright protection in the United States. The published product may be reproduced and distributed in its entirety without further permission from GAO. However, because this work may contain copyrighted images or other material, permission from the copyright holder may be necessary if you wish to reproduce this material separately.
Abbreviations
CDC Centers for Disease Control and Prevention
HDHP high-deductible health plan
HRA health reimbursement arrangement
HSA health savings account
IRS Internal Revenue Service
NHIS National Health Interview Survey
September 8, 2025
The Honorable Richard E. Neal
Ranking Member
Committee on Ways and Means
House of Representatives
Dear Ranking Member:
Effective in 2004, Congress established health savings accounts (HSA), which are tax-advantaged accounts available to certain individuals enrolled in HSA-eligible high-deductible health plans (HDHP) and can be used to pay for certain medical expenses free of tax.[1] Unlike other tax-advantaged accounts that can also be used to pay for health care, HSAs are eligible to hold investments, like mutual funds, and can be carried into retirement; they can also be used to pay for things other than health care, subject to additional taxes. While HDHPs have relatively high deductibles, they also often have relatively low premiums, especially when compared to health plans with lower deductibles. An industry research group estimated that HSAs held over $123 billion in assets at the end of 2023.[2]
Policymakers and researchers have noted tradeoffs with HSAs. The tax-free savings potential of the accounts and the relatively low premiums associated with HDHPs appeal to many consumers; however, there are concerns that HDHPs may attract people who seek lower premiums, but may lack the resources to contribute to an HSA or to cover the cost of needed medical care incurred prior to meeting the high deductible. Some of these policymakers and researchers have also raised questions about whether wealthy HDHP enrollees may seek to use HSAs primarily to accumulate potentially tax-advantaged savings rather than pay for medical expenses. In prior work examining early experiences with HSAs, we found that tax filers who reported HSA activity in 2005 had higher incomes on average than other tax filers.[3] The Department of the Treasury estimated that in 2023, tax-advantaged contributions to and withdrawals from HSAs—both of which must be reported to the Internal Revenue Service (IRS)—cost nearly $13 billion in forgone federal income tax revenue.[4] Further, in a 2024 report, the Consumer Financial Protection Bureau found that although HSAs offer some consumer benefits, such as tax advantages, the providers of HSAs—including banks and other financial institutions—may also charge costly fees, set low interest rates on account balances, and impose rules that affect fund portability.[5]
You asked us to review issues related to HSA marketing and features, how account holders use their HSAs, and account holder characteristics. In this report, we describe
1. how selected providers market their HSAs, and the account features these providers offer;
2. how HSA holders use their accounts; and
3. the characteristics of individuals with tax-advantaged savings accounts, including HSAs, linked to health plans with high deductibles.
To describe how selected HSA providers market their accounts, and the account features those providers offered, we interviewed or obtained written responses from a nongeneralizable sample of nine HSA providers to obtain information related to their marketing strategies and account features. We selected these organizations to generate a diverse sample based on provider size, available HSA investment options, geographic location, and provider type.[6] Five of the nine providers were among those reported by an industry researcher to hold the largest amounts of assets in HSAs; we refer to these providers as “large providers” and the remaining four providers as “small to midsize providers.” We also reviewed the selected providers’ marketing materials and account documentation.
To describe how HSA holders use their accounts, we reviewed summary data and publications from the IRS.[7] Specifically, we reviewed the IRS’s nationally representative Statistics of Income data and related IRS publications that examined tax filings for 2019 through 2022 (the most recent year of data available at the time of our review) to examine estimated total and average contributions and withdrawals reported by HSA holders in those years.[8] To assess the reliability of these data, we reviewed relevant documentation and spoke with IRS officials about potential data limitations. Based on this work, we determined that these data were reliable for the purpose of our reporting.
To supplement IRS’s data, we reviewed reports from three organizations that collect data and other information about HSAs. First, we reviewed HSA market summary reports for 2019 through 2023 published by Devenir Research to examine HSA balances and investments.[9] We also reviewed annual survey data from the 2019 through 2023 KFF Employer Health Benefits Survey to examine HSA contributions made by employers on behalf of their employees.[10] Finally, we reviewed HSA-related issue briefs published by the Employee Benefit Research Institute to provide context on issues related to HSA contributions, including the relationship between employer and employee contributions, and account holder investments.[11] To assess the reliability of the data and information that were used from each of these sources, we reviewed relevant documentation and interviewed officials from each organization about their work’s methodology and potential limitations. Based on this work, we determined that they were sufficiently reliable for the purpose of our reporting.
To describe the characteristics of individuals who had tax-advantaged savings accounts, including HSAs, linked to health plans with high deductibles, we used the Centers for Disease Control and Prevention’s (CDC) National Center for Health Statistics’ National Health Interview Survey (NHIS) data for 2019 through 2023.[12] CDC officials told us that these data include information about both HSAs and health reimbursement arrangements (HRA), which are employer-owned and funded accounts from which individuals can draw tax-free funds to pay for covered medical services. We assume most of the tax-advantaged savings accounts linked to health plans with high deductibles in the NHIS data are HSAs.[13] To assess the reliability of these data, we reviewed relevant documentation, interviewed agency officials about the survey methodology and potential limitations, and examined the data for missing information and obvious errors. Based on this work, we determined that these data were reliable for the purpose of describing the characteristics of individuals with tax-advantaged savings accounts linked to health plans with high deductibles.[14] These characteristics included family income, race and ethnicity, self-reported health status, age, and sex.[15] We also examined whether these individuals received their plans through their employers or through a direct purchase method such as from an issuer or through a federal or state marketplace.[16] All findings resulting from these analyses are descriptive in nature, and all differences discussed in our report are statistically significant at the 95 percent confidence level.
To inform the three reporting objectives, we also interviewed and collected written responses from officials from the Department of Health and Human Services’ Centers for Medicare & Medicaid Services and the CDC; the IRS; the Consumer Protection Financial Bureau; and the Federal Trade Commission. In addition, we interviewed and obtained written responses from officials from a nongeneralizable sample of seven external stakeholder groups for their perspectives on HSA marketing and features, account activity, and enrollment in HSA-eligible plans and HSAs. These groups represent consumers, HSA and health insurance industries, and regulators, and were selected for their work on HDHPs or HSAs, their representation of consumers who use HDHPs or HSAs, or their knowledge of oversight issues related to HDHPs or HSAs. The views of these stakeholders are not generalizable to other stakeholders.
We conducted this performance audit from March 2024 to September 2025 in accordance with generally accepted government auditing standards. Those standards require that we plan and perform the audit to obtain sufficient, appropriate evidence to provide a reasonable basis for our findings and conclusions based on our audit objectives. We believe that the evidence obtained provides a reasonable basis for our findings and conclusions based on our audit objectives.
Background
Health Savings Accounts
HSAs are accounts that allow individuals to accumulate tax-free savings to pay for or reimburse certain medical expenses. To be eligible to open or have contributions made to their HSA, an individual must meet certain requirements, including that the individual is enrolled in an HSA-eligible HDHP and generally has no other health coverage.[17] Contributions to an HSA may be made by the eligible account holder or any other person, including an employer or a family member, on behalf of the account holder. The IRS publishes annual limits on the inflation-adjusted amount that can be contributed to an HSA. (See fig. 1.)
Figure 1: Annual Health Savings Account (HSA) Contribution Limits and High-Deductible Health Plan (HDHP) Minimum Deductibles and Maximum Out-of-Pocket Limits, 2023
Note: Single coverage covers only one person—the policyholder—whereas family coverage covers the policyholder plus one or more family members.
aAnnual contribution limits for individuals aged 55 and older were $1,000 higher—up to $4,850 if they had single coverage and up to $8,750 if they had family coverage.
HSAs have three main tax benefits for account holders: (1) contributions are not subject to federal income taxes, and contributions made through employees’ payroll deductions are also excluded from payroll taxes (such as Social Security and Medicare); (2) withdrawals for qualified medical expenses are tax-free; and (3) unused balances may accumulate from year to year without limit and earn interest, and interest and investment earnings on HSA assets accumulate tax-free.[18] HSA withdrawals used for non-qualified expenses—which could include anything other than qualified medical expenses, such as groceries and home repairs—are subject to income taxes and an additional 20 percent tax for account holders who are under age 65 at the time of the withdrawal.[19] The tax effects associated with HSAs vary depending on an individual’s income. See appendix I for information on tax-savings from HSAs contributions and tax costs of non-qualified withdrawals by income.
|
Qualified Medical Expenses Qualified medical expenses are the amounts paid for the diagnosis, cure, mitigation, treatment, or prevention of disease, and for the purpose of affecting any part or function of the body, as well as for certain transportation, long-term care, and other specified services. See 26 U.S.C. § 213(d). These expenses include, but are not limited to, the following: · Payments for medical services rendered by physicians, surgeons, dentists, and other medical practitioners. · Costs of equipment, supplies, and diagnostic devices. · Amounts paid for qualified long-term care services and limited amounts paid for any qualified long-term care insurance contract. Medical expenses that are merely beneficial to general health without alleviating or preventing a physical or mental disability or illness, such as vitamins and some cosmetic surgeries, are considered non-qualified expenses. Source: Internal Revenue Service. | GAO‑25‑107480 |
HSAs are different from other common tax-advantaged health payment accounts, such as HRAs and flexible spending arrangements.[20] For example, they are different from HRAs in that they are owned by the individual instead of an employer; and they are different from flexible spending arrangements in that balances can be carried over from year to year. Employers can incorporate HSAs as part of a benefits package, but HSA holders retain access to their HSAs even if they change jobs, change insurance, or their employer no longer offers HSA benefits.[21] In addition, HSAs are not tied to employment, meaning eligible individuals may establish and contribute to HSAs outside the employment setting or irrespective of being employed, and can keep their HSA if they change insurance to a non-eligible health plan.[22] Finally, unlike flexible spending arrangements and most types of HRAs, HSA balances can be carried into retirement. (See table 1.)
|
|
Health savings account |
Health reimbursement arrangement |
Flexible spending arrangement |
|
Must be paired with a high-deductible health plan |
✓a |
X |
X |
|
Eligible for employer contributions |
✓ |
✓ |
✓ |
|
Eligible for employee contributions exempt from payroll taxes |
✓ |
X |
✓ |
|
Can be established and contributed to by individuals outside of employment settings |
✓ |
X |
X |
|
Eligible for tax-free qualified medical expense withdrawals |
✓ |
✓ |
✓ |
|
Eligible for non-qualified expense withdrawals |
✓b |
X |
X |
|
Eligible to carry over unused balances year to year |
✓ |
✓ |
X |
|
Eligible to invest funds and accumulate earnings tax-free |
✓ |
X |
X |
|
Eligible to use funds in retirement |
✓ |
Xc |
X |
✓ = Yes; X = No
Source: Internal Revenue Service. | GAO‑25‑107480
aAccount holders can only open or make contributions to a health savings account (HSA) when they are enrolled in an HSA-eligible health plan. However, they do not lose their HSA if they change insurance to a non-eligible health plan.
bHSAs can be used for non-qualified expenses subject to income taxes; those under age 65 are also subject to an additional 20 percent tax.
cMost types of health reimbursement arrangements (HRA) cannot be carried into retirement, but employers may structure their HRA so that former employees may access such funds, such as by providing a retiree-only HRA.
HSA-Eligible High-Deductible Health Plans
HDHPs are required to meet certain statutory criteria to be HSA eligible, including minimum deductible amounts, which are higher than health plan deductibles on average, and limits on enrollee out-of-pocket spending.[23] Certain services may be exempted from the deductible requirement—meaning that the plan may cover services, such as periodic health exams and immunizations, before the deductible is met—but coverage of other services are subject to the deductible.[24] After the enrollee meets the deductible, which can be paid using HSA funds, the HSA-eligible HDHP pays for an agreed upon share of the cost of covered services until the enrollee meets the out-of-pocket spending limit, at which point the plan pays 100 percent of the cost of covered services. Other health plans may have deductibles that are equal to or greater than the minimum required for HSA-eligible plans, but do not meet the other statutory criteria and are, therefore, not HSA eligible.[25]
HDHPs may be available to individuals through private health plans, including employer-sponsored plans or plans directly purchased from issuers or health insurance marketplaces (e.g., direct purchase).[26]
· Employer-sponsored. Many employers sponsor group health plans for their employees, including HDHPs. Eligibility for group plans is limited to individuals who are part of the group by virtue of either their own employment or their relationship to an employee (e.g., the spouse or children of an employee, to the extent a sponsor makes the group plan available to family members). Payers for group plans generally include both the employers and employees, with each paying a share of the premium and receiving various tax benefits.[27] According to KFF, from 2019 through 2023, the estimated percentage of employees in employer-sponsored health plans who were enrolled in an HSA-eligible HDHP ranged from a low of 21 percent in 2021 to a high of 24 percent in 2023.[28]
· Direct purchase. Direct purchase plans include those sold on the federal and state marketplaces established in 2014 under the Patient Protection and Affordable Care Act and plans purchased directly from an issuer (e.g., off-marketplace).[29] The law also established premium tax credits that are available to some marketplace consumers to help them afford their coverage. These tax credits cannot be used for plans purchased outside of a marketplace; although, under limited circumstances, consumers may be able to claim a portion of the premiums paid as a deduction on their taxes. According to Centers for Medicare & Medicaid Services data, the percentage of marketplace enrollees enrolled in HSA-eligible HDHPs declined from 8 percent in 2019 to 4 percent in 2023.[30] There were not similar data available for HSA-eligible HDHPs purchased off-marketplace.
Most Selected HSA Providers Focused Marketing on Employers; Fees, Interest Rates, and Investment Options Varied
Eight of Nine Selected HSA Providers Focused Marketing on Employers and All Providers’ Marketing Materials Described Financial Benefits
Eight of the nine selected providers offered HSAs that were sponsored by employers as part of their employees’ health benefits packages. All eight of those providers told us that their primary marketing focus was employers, which included trying to persuade employers to offer their HSA and encouraging employees enrolled in an HSA-eligible plan to sign up for their HSA. HSA providers may focus on the employer market because most consumers—about 84 percent of those with private health coverage in 2023—receive their coverage through employer-sponsored plans.
One large provider told us that at least 90 percent of their HSA business comes through employers. Five of the eight selected providers that offered employer-sponsored HSAs told us they also do some marketing to individuals. The other three providers that offered HSAs to employers—one of which did not offer HSAs to individuals—were small to midsize and told us they did not focus their marketing on individuals. One noted that most individuals who open an HSA with them outside of an employer relationship are existing customers of the institution. Only one of the nine selected providers, a small to midsize provider, did not offer employer-sponsored HSAs and only marketed to individuals.
Other reasons HSA providers focus their marketing on employers may be related to how employers structure and make decisions about their health benefit offerings. For example, two external stakeholder groups stated that it was common practice for employers who offer HDHPs to partner with HSA providers; the groups noted that HSAs through employers provide greater benefits to the account holder than those through the individual market, in part, due to employers’ HSA contributions. Additionally, two external stakeholder groups reported that some employers are offering HDHPs with an HSA because employees are requesting them. One external stakeholder group noted that HSAs are mostly advertised to employers, because some employers encourage their employees to enroll in HDHPs, assuming the plan and HSA will help control their costs. In addition, HDHPs are sometimes the only plan option offered by employers, according to a report from KFF and three external stakeholder groups we interviewed. KFF’s annual Employer Health Benefits Survey found that in 2023, for 10 percent of employees in employer-sponsored plans, the only health plan option offered to them were HSA-eligible HDHPs or plans with high deductibles paired with an HRA.[31]
Selected HSA providers’ marketing materials focused on the financial benefits of HSAs and their provider-specific features.
· Financial benefits of HSAs. All selected providers highlighted information about the tax advantages. In addition, most of the selected providers’ marketing materials highlighted the other financial benefits of HSAs, which may include HSAs’ portability, the ability to roll over funds from year to year, and how the funds could be used to plan for health care expenses now and in retirement.
· Provider-specific features. All selected providers included their organization-specific features in their marketing materials, which may include the fees associated with their accounts, interest rates, investment options, and account tools or platforms, such as investment tools or receipt tracking.
Health Savings Account Features Varied Across Selected Providers; Some Providers did not Disclose Fees Prior to Enrollment
Features of HSAs offered by selected providers—including fees, interest rates, and investment options—varied.
Fees. All selected providers had at least one fee associated with their HSA, and the fees and rules around them varied. Five of the nine providers charged a monthly or quarterly maintenance fee for employer-sponsored HSAs, but all of these providers waived the fee if the accounts exceeded a certain balance. For example, an HSA provider may charge a monthly maintenance fee, such as $3.50, that is waived for balances exceeding a certain amount, such as $3,000. Three of the nine providers charged maintenance fees for individual accounts, including two that charged monthly fees that were waived if accounts exceeded a certain balance, and one that charged an annual fee that could not be waived. Others charged a paper statement fee, such as $3, that would not apply if account holders opted for electronic statement delivery, or an account closure fee, such as $25. See table 2 for more information on the fees charged by the selected providers.
|
|
Maintenance fees (employer- sponsored HSAs)a |
Maintenance fees (individual HSAs) |
Paper statement fees |
Account closure fees |
|
Provider 1 |
◐ |
○ |
◐ |
● |
|
Provider 2 |
◐ |
◐ |
◐ |
● |
|
Provider 3 |
◐ |
○ |
○ |
○ |
|
Provider 4 |
◐ |
○ |
◐ |
● |
|
Provider 5 |
○ |
○ |
◐ |
○ |
|
Provider 6 |
◐ |
n/ab |
◐ |
● |
|
Provider 7 |
○ |
◐ |
◐ |
● |
|
Provider 8 |
n/ac |
● |
○ |
○ |
● = Provider charges fee; ◐ = Provider charges fee, but not applicable in certain circumstances; ○ = Provider does not charge fee
Source: GAO analysis of documentation from and interviews with selected HSA providers. | GAO‑25‑107480
Notes: This table includes information on common fees charged by eight of the nine selected providers included in our review. The ninth provider did not provide sufficient specificity about their fees to be included in the table, but reported that it did not charge any maintenance fees and that other fees and payment responsibilities vary.
aMaintenance fees for employer-sponsored HSAs are often paid by the employer rather than the individual.
bThis provider reported that it did not offer HSAs to individuals.
cThis provider reported that it did not offer employer-sponsored HSAs.
Seven providers—either through the provider’s investment platform or a third-party broker-dealer—told us they charged fees for HSAs invested in certain funds and features (i.e., brokerage fees). Less common fees included an automatic teller machine fee (one provider) and an outbound transfer fee (one provider), among others.
Officials from two providers suggested that many HSA fees are unnecessary. One stated that account closure fees and transfer fees are unnecessary because it costs nothing for the provider to process transfers and account closures. The other stated that the organization had gotten rid of most fees from its checking and savings accounts, including HSAs, in response to the Consumer Financial Protection Bureau’s 2022 “junk fees” initiative.[32] This provider also noted that removing such fees had not impacted the organization’s HSA business.
Three of the selected providers—all banks that offered both individual and employer-sponsored HSAs—told us they did not have publicly available HSA fee schedules and only provided fee schedules to individuals at enrollment. Banks are generally required to disclose—prior to or at enrollment—any fees they may charge in connection with a deposit account.[33] The absence of a fee schedule prior to enrollment may make it challenging for consumers to compare across HSA providers. This challenge may be mitigated or less relevant for individuals who have employer-sponsored coverage and opt to use the HSA provider selected by their employer because the employer may pay the fees. One stakeholder group we interviewed said it encouraged individuals in employer-sponsored coverage to enroll in the HSAs offered by their employers to help facilitate employer contributions and allow the additional tax benefits that apply to employee payroll deductions.
Interest rates. Most of the selected providers’ interest rates for non-invested HSAs—HSAs with no portion of their funds invested—were similar to that of traditional checking accounts.[34] In addition, most selected providers had tiered interest rates for non-invested HSAs, meaning that the interest rates varied based on account balances (i.e., higher rates for higher balances). For example, one provider had an interest rate of 0.05 percent for balances under $5,000 and 0.10 percent for balances between $5,000 and $9,999 in December 2024.
Investment options. Seven of the nine selected providers offered account holders the opportunity to invest their HSA funds in various options, typically requiring a minimum balance, such as $1,000, before account holders could invest. The two providers who did not offer investment options were small to midsize, and one said they lost business to another HSA provider that offered investment options.
The seven selected providers with investment options all offered mutual funds, with some offering additional options, such as exchange traded funds and stocks. Invested funds are subject to gains and losses associated with market fluctuations.[35] For example, invested funds have the potential to earn more money than funds in a non-invested account.
Health Savings Account Contributions Exceeded Withdrawals; Nearly All Withdrawals Were for Qualified Medical Expenses
The estimated amount of total HSA contributions far exceeded total withdrawals in each year from 2019 through 2022, according to IRS’s Statistics of Income data. For example, in 2022, an estimated $43.6 billion were reported in contributions and $25.4 billion in withdrawals among the 16.5 million tax returns reporting HSA contributions or withdrawals, among other HSA activity.[36] (See fig. 2.)
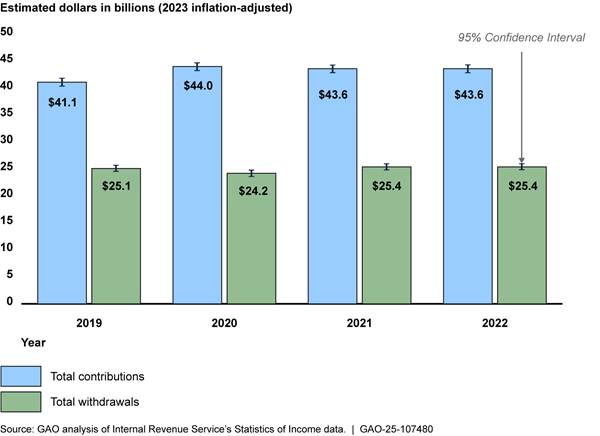
Note: The dollar amounts have been inflation-adjusted to 2023 dollars using the gross domestic product price index.
Contributions. Our analysis of IRS estimates found that in each year from 2019 through 2022, more than 80 percent of HSA contributions reported in tax filings came from employer/employee contributions (i.e., from an employer or from an employee payroll deduction) and less than 20 percent came from individuals.[37] This likely reflects the fact that more people receive health insurance through their employers. In 2022, the estimated average annual employer/employee contribution was $2,846 among the 12.9 million tax returns that reported such contributions. The majority of these contributions may have been made by the employees (rather than their employers) as Devenir Research estimated that almost two-thirds of all HSA dollars in 2022 came from employee contributions through payroll deductions.[38] The estimated average annual individual contribution was $3,243 among the 2.1 million tax returns that reported such contributions in 2022. (See table 3.)
Table 3: Estimated Health Savings Account (HSA) Contributions Among Tax Returns that Reported HSA Activity, 2022
|
|
Employer/employee |
Individual |
|
|
Among tax returns that reported HSA activitya |
|
|
|
|
Percent reporting each contribution |
78% |
13% |
|
|
Number reporting each contribution |
12.9 million |
2.1 million |
|
|
Among HSA contributions reported |
|
|
|
|
Percent of all HSA contribution dollars |
84% |
16% |
|
|
Estimated average annual contributionb |
$2,846 |
$3,243 |
|
Source: GAO analysis of Internal Revenue Service’s Statistics of Income data. | GAO‑25‑107480
aThis is among the estimated 16.5 million tax returns that reported HSA activity in 2022—including those that only reported withdrawals. In a given year, an account holder who reports HSA activity may report employer contributions, individual contributions, both employer and individual contributions, or no contributions.
bThe dollar amounts have been inflation-adjusted to 2023 dollars using the gross domestic product price index.
One report we reviewed from KFF found that in 2022, an estimated 80 percent of employees in HSA-eligible HDHPs received an HSA contribution from their employer.[39] Among employers who provided HSA contributions to employees in an HSA-eligible HDHP, the estimated average contribution was $850 for single coverage and $1,464 for family coverage. Small firms had higher estimated average HSA contributions for their employees than large firms, according to KFF’s 2022 report.[40] (See table 4.)
Table 4: Estimated Average Annual Employer Health Savings Account (HSA) Contributions for Employees in an HSA-Eligible Plan Who Received Employer Contributions, 2022
|
|
Single coverage |
Family coverage |
|
Average employer contribution |
$850 |
$1,464 |
|
Average small firm (3 to 199 employees) contribution |
$1,503 |
$2,278 |
|
Average large firm (200 or more employees) contribution |
$689 |
$1,265 |
Source: KFF’s 2022 Employer Health Benefits Annual Survey. | GAO‑25‑107480
Note: The dollar amounts have been inflation-adjusted to 2023 dollars using the gross domestic product price index.
One report we reviewed from the Employee Benefit Research Institute, which was based on an analysis of the HSAs included in its database in 2022, found that the accounts that received employer contributions had higher total contributions, and more of these accounts were invested compared to accounts that did not receive employer contributions.[41] The analysis also found that about 14 percent of HSA holders in the database contributed the annual statutory maximum.
Withdrawals. Our analysis of IRS estimates found that in each year from 2019 through 2022, over 97 percent of all HSA withdrawals reported in tax filings were used for qualified medical expenses and less than 3 percent were used for non-qualified expenses. In 2022, the estimated average annual qualified medical expense withdrawal was $2,764 among the 8.9 million tax returns that reported such withdrawals. The estimated average annual non-qualified expense withdrawal was $1,485 among the 465,000 tax returns that reported such withdrawals, and most withdrawal dollars were for those age 65 and older. (See fig. 3.) Non-qualified expenses are subject to income tax and may be subject to an additional 20 percent tax if the account holder is under age 65.[42]
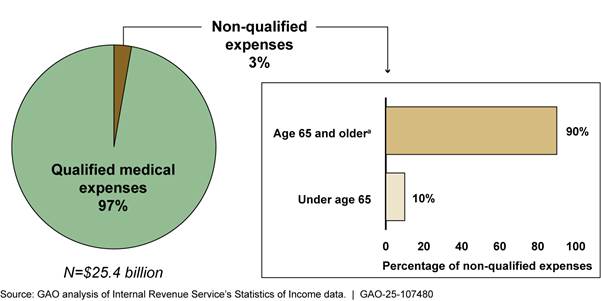
aThis population also includes individuals under age 65 who are disabled or deceased.
Our analysis of IRS estimates found that in each year from 2019 through 2022, the estimated average annual withdrawal amounts for non-qualified expenses taken by those age 65 and older were consistently larger than that of those under age 65.[43] For example, in 2022, the estimated average annual withdrawal for non-qualified expenses for those age 65 and older was $2,650 and the average for those under age 65 was $310. (See table 5.)
Table 5: Estimated Health Savings Account (HSA) Withdrawals Among Tax Returns that Reported HSA Activity, 2022
|
|
Qualified medical expenses |
Non-qualified expenses for account holders age 65 or oldera |
Non-qualified expenses for account holders under age 65b |
|
Among tax returns that reported HSA activityc |
|
|
|
|
Percent reporting each withdrawal |
54% |
1% |
1% |
|
Number reporting each withdrawal |
8.9 million |
232,000 |
234,000 |
|
Among HSA withdrawals reported |
|
|
|
|
Percent of all HSA withdrawal dollars |
97% |
2% |
<1% |
|
Estimated average annual withdrawald |
$2,764 |
$2,650 |
$310 |
|
Subject to income tax or additional tax? |
No |
Income tax |
Income tax Additional 20% tax |
Source: GAO analysis of Internal Revenue Service’s Statistics of Income data. | GAO‑25‑107480
aThis population also includes individuals under age 65 who are disabled or deceased.
bThis population does not include deceased or disabled individuals under age 65.
cThis is among the estimated 16.5 million tax returns that reported HSA activity in 2022—including those that only reported contributions. In a given year, an account holder may report qualified withdrawals, non-qualified withdrawals, both qualified and non-qualified withdrawals, or no withdrawals.
dThe dollar amounts have been inflation-adjusted to 2023 dollars using the gross domestic product price index.
Account balances. While estimated net contributions exceeded net withdrawals among tax returns that reported HSA activity each year from 2019 through 2022, industry estimates of account level data demonstrate a wide distribution of balances. A report from Devenir Research found that as of December 31, 2022, an estimated 7 percent of HSAs had balances over $10,000, and 63 percent had balances less than $1,000—including 21 percent of accounts that were unfunded.[44] (See fig. 4.)
Figure 4: Estimated Percentages of Health Savings Accounts (HSA) by Account Balance, as of December 31, 2022
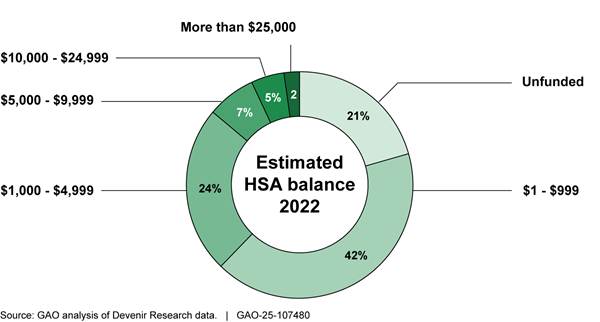
Note: The estimated balances were not inflation-adjusted. The sample data are derived from Devenir Research’s proprietary database, which they estimate accounts for about 82 percent of the HSA market.
Based on an analysis of the HSAs included in its database in 2022, a report from the Employee Benefit Research Institute found that withdrawals exceeded contributions for approximately one-third of the 14 million HSA holders in their database, while over 60 percent contributed more than they withdrew.[45] Their analysis also found that, among the 14 million accounts in their database, account holder age and account tenure were closely related to average balances (i.e., older individuals with more established accounts had higher balances).
Investments. As previously noted, HSA providers may offer investment options, and account holders may opt to invest a portion of their HSA funds if they meet the providers’ criteria to do so (i.e., meet a minimum account balance). Since HSA interest and any investment earnings accumulate tax-free, such earnings are not specifically reported to the IRS and, therefore, are not available in the IRS data we reviewed. However, reports from Devenir Research estimated that in each year from 2019 through 2023, the small share of HSAs that invested at least a portion of their funds—invested HSAs—held a disproportionate share of total HSA assets. For example, in 2023, only 8 percent of HSAs were invested, but these accounted for an estimated 38 percent of all HSA assets, according to a Devenir Research report.[46] (See fig. 5.)
Figure 5: Estimated Share of Health Savings Account (HSA) Assets Invested and Estimated Share of HSAs Invested, 2019-2023
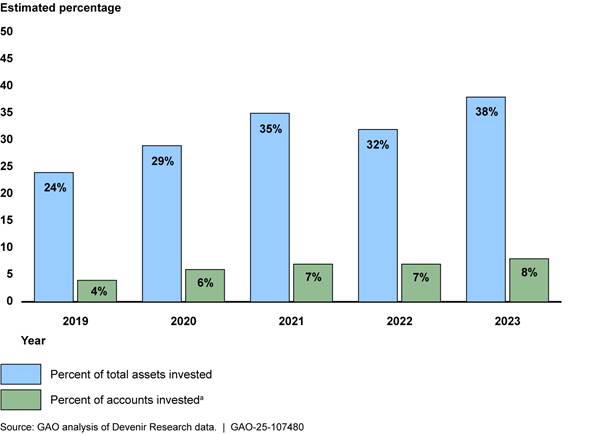
Notes: The sample data is derived from Devenir Research’s proprietary database, which they estimate accounts for about 82 percent of the HSA market.
aThe percent of accounts invested is the percentage of all HSAs, including accounts that are unfunded, according to Devenir Research officials.
A report by the Employee Benefit Research Institute offered a few potential reasons for low investment rates among HSAs: (1) many accounts are new with low balances and may not be eligible for investments; (2) many account holders may not be aware of the option to invest HSA funds; and (3) account holders may be using the HSA only to pay for out-of-pocket health expenses and therefore may not want to take short-run risks with investment fluctuations.[47]
While relatively few HSAs were invested, Devenir Research reports found that invested HSAs had significantly higher estimated average balances than that of non-invested HSAs in each year from 2019 through 2023. Specifically, in 2023, they estimated the average HSA invested account balance was $19,212, which was approximately 7.6 times larger than the estimated average non-invested account balance of $2,538.[48] (See fig. 6.)
Figure 6: Estimated Average Non-Invested Health Savings Account (HSA) Balance and Estimated Average Invested HSA Balance, 2019-2023
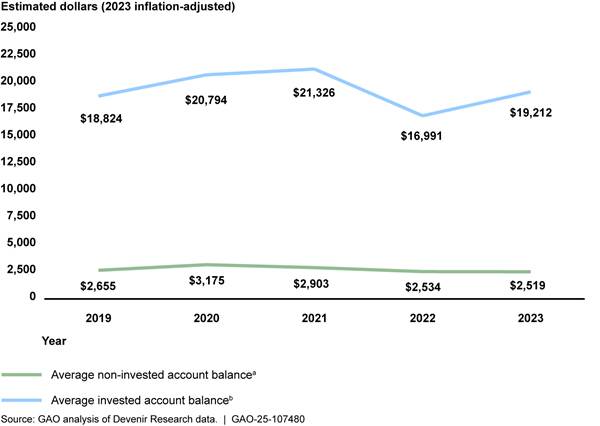
Notes: The sample data is derived from Devenir Research’s proprietary database, which they estimate accounts for about 82 percent of the HSA market. The dollar amounts have been inflation-adjusted to 2023 dollars using the gross domestic product price index.
aThe average non-invested account balance excludes non-funded accounts, according to Devenir Research officials.
bThe average invested account balance includes both deposit and invested assets for accounts that are investing, according to Devenir Research officials.
Similar to the Employee Benefit Research Institute’s findings on the relationship between account balances and account holder age, its analysis also found that older account holders had a higher likelihood of investing some portion of their HSA funds.[49]
Greater Shares of High Income, Asian, White, and Healthier Individuals had Linked Savings Accounts
Our analysis of NHIS data from 2019 through 2023 found that the share of individuals aged 18-64 who had tax-advantaged savings accounts—HSAs or HRAs—linked to plans with high deductibles increased with income.[50] (See textbox for information about how NHIS data captures information on HSAs and health plans with high deductibles). It also found that—compared to other groups in their respective demographic categories—more Asian and White individuals, individuals with better self-reported health status, and individuals with employer-sponsored plans reported having these accounts.[51]
|
Information on HSAs and health plans with high deductibles collected through NHIS The National Health Interview Survey (NHIS) captures information about tax-advantaged savings accounts that are linked to health plans with high deductibles. These accounts include both health savings accounts (HSA) and health reimbursement arrangements (HRA). The health plans include those that have deductible amounts equal to or greater than the Internal Revenue Service’s high-deductible health plan minimum amount for HSA eligibility. For example, in 2023, the minimum deductibles were $1,500 for a single coverage plan and $3,000 for a family coverage plan. However, the survey does not collect information on other features required for plans to be HSA eligible, so it is possible that some plans identified in NHIS data as high-deductible are not HSA eligible. For purposes of this report, we call these plans “health plans with high deductibles.” In contrast, we refer to plans meeting statutory criteria for HSA eligibility as “HSA-eligible HDHPs.” Based on our review of NHIS and KFF data covering the years of our analysis, we conservatively estimate that more than 60 percent of the tax-advantaged savings accounts linked to health plans with high deductibles in the NHIS data we analyzed were HSAs, and the remainder are HRAs. |
Source: GAO analysis of Centers for Disease Control and Prevention’s National Center for Health Statistics’ National Health Interview Survey, KFF’s Employer Health Benefits Survey, and Internal Revenue Service documentation. | GAO-25-107480
Higher Income Groups Were More Likely than Lower Income Groups to Have Linked Savings Accounts
From 2019 through 2023, an estimated annual average 43 million individuals aged 18-64 were enrolled in health plans with high deductibles. Among these, the share with tax-advantaged savings accounts, including HSAs, linked to their plans increased as family income increased.[52] For example, nearly twice the share of individuals in the highest income group (an estimated 62 percent) had these linked accounts compared with the lowest income group (an estimated 32 percent). (See fig. 7.)
Figure 7: Among Individuals Aged 18-64 Enrolled in Health Plans with High Deductibles, Estimated Annual Shares of Those with Linked Tax-Advantaged Savings Accounts by Income Group, 2019-2023
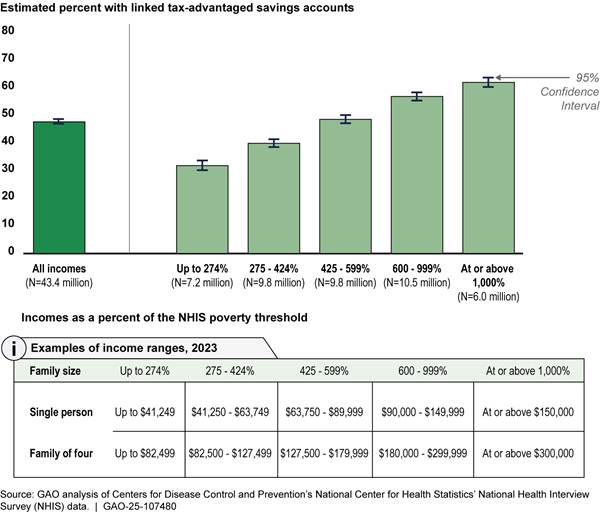
Notes: Individuals in this figure include the annual average estimated 43.4 million civilian, non-institutionalized individuals aged 18-64 who were enrolled in a private health plan with a high deductible. While these plans have a high deductible, meaning they meet or exceed Internal Revenue Service’s minimum deductible amount for health savings account (HSA) eligibility, they do not necessarily meet other requirements to be HSA eligible. To calculate annual average estimates, we pooled the sample across our analysis period and created a pooled sampling weight for each year by dividing the appropriate sampling weight by the number of years (five) in our analysis period. The results of our analysis are annual average estimates weighted to represent the adult population in the U.S. Tax-advantaged accounts in this figure include HSAs and health reimbursement arrangements. Family income was measured relative to estimated poverty thresholds calculated for use in NHIS, which account for household size and—for one- and two-person households—age. We defined the income groups for this analysis and calculated them based on the population of NHIS respondents ages 18-64 who had one private health plan and no other coverage. Family income values were imputed for an estimated 18 percent of these respondents.
Greater Shares of Asian and White Individuals and Those Reporting Excellent or Very Good Health Had Linked Savings Accounts
The estimated share of individuals aged 18-64 with tax-advantaged savings accounts, including HSAs, linked to their health plans with high deductibles was higher among Asian (54 percent) and White (50 percent) individuals compared to Black or African American (41 percent) and Hispanic or Latino (34 percent) individuals. (See fig. 8.) In addition, within each race and ethnicity group, the share of those reporting these linked accounts and health plans generally increased as income increased. For example, among Hispanic or Latino individuals enrolled in a health plan with a high deductible, an estimated 25 percent and 28 percent of those in the lowest two income groups reported having a linked account, while an estimated 50 percent and 51 percent of those in the highest two income groups reported having such an account.[53]
Figure 8: Among Individuals Aged 18-64 Enrolled in Health Plans with High Deductibles, Estimated Annual Shares of Those with Linked Tax-Advantaged Savings Accounts by Race and Ethnicity, 2019-2023
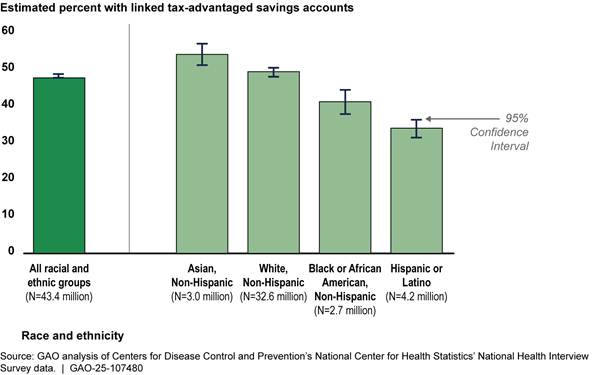
Notes: Individuals in this figure include the annual average estimated 43.4 million civilian, non-institutionalized individuals aged 18-64 who were enrolled in a private health plan with a high deductible. While these plans have a high deductible, meaning they meet or exceed Internal Revenue Service’s minimum deductible amount for health savings account (HSA) eligibility, they do not necessarily meet other requirements to be HSA eligible. To calculate annual average estimates, we pooled the sample across our analysis period and created a pooled sampling weight for each year by dividing the appropriate sampling weight by the number of years (five) in our analysis period. The results of our analysis are annual average estimates weighted to represent the adult population in the U.S. Tax-advantaged accounts in this figure include HSAs and health reimbursement arrangements. An estimated 827,000 individuals aged 18-64 from various racial and ethnic groups are not included in the race and ethnicity breakouts shown in the chart above. These groups include American Indians and Alaska Natives and other single or multiple races. We excluded these groups because either their data did not meet the data presentation standards we applied to this analysis, or because the level of detail available in the National Health Interview Survey data was not associated with one specific group (e.g., the category “other single and multiple races”).
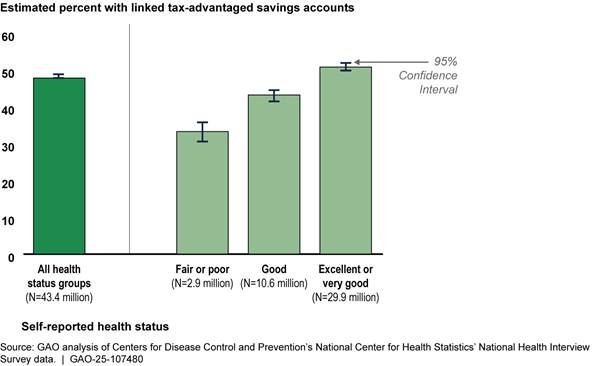
A greater share of individuals aged 18-64 with tax-advantaged savings accounts, including HSAs, linked to their health plans with high deductibles reported being in excellent or very good health (51 percent) compared to those being in fair or poor health (33 percent). (See fig. 9.) In addition, similar to our findings on race and ethnicity, within each of the self-reported health status categories, the share of individuals reporting these linked accounts and health plans generally increased as income increased. For example, among individuals enrolled in a health plan with a high deductible who reported being in excellent or very good health, an estimated 35 percent and 42 percent of those in the lowest two income groups reported having a linked account, compared to an estimated 58 percent and 63 percent of those in the highest two income groups.[54]
Figure 9: Among Individuals Aged 18-64 Enrolled in Health Plans with High Deductibles, Estimated Annual Shares of Those with Linked Tax-Advantaged Savings Accounts by Self-Reported Health Status, 2019-2023
Notes: Individuals in this figure include the annual average estimated 43.4 million civilian, non-institutionalized individuals aged 18-64 who were enrolled in a private health plan with a high deductible. While these plans have a high deductible, meaning they meet or exceed Internal Revenue Service’s minimum deductible amount for health savings account (HSA) eligibility, they do not necessarily meet other requirements to be HSA eligible. To calculate annual average estimates, we pooled the sample across our analysis period and created a pooled sampling weight for each year by dividing the appropriate sampling weight by the number of years (five) in our analysis period. The results of our analysis are annual average estimates weighted to represent the adult population in the U.S. Tax-advantaged accounts in this figure include HSAs and health reimbursement arrangements.
See appendix II for additional information about our study population and enrollment in health plans with high deductibles and linked tax-advantaged savings accounts by income, race and ethnicity, health status, age, and sex.
Individuals in Employer-Sponsored Plans with High Deductibles Were More Likely to have Linked Savings Accounts
An estimated 52 percent of individuals aged 18-64 enrolled in employer-sponsored health plans with high deductibles had tax-advantaged savings accounts, including HSAs, linked to their plans. Far fewer—an estimated 14 percent—who purchased plans with high deductibles directly from an issuer or on a federal or state marketplace had such accounts. (See fig. 10.)
Figure 10: Among Individuals Aged 18-64 with Employer-Sponsored and Direct-Purchase Health Plans with High Deductibles, Estimated Annual Shares with Linked Tax-Advantaged Savings Accounts, 2019-2023
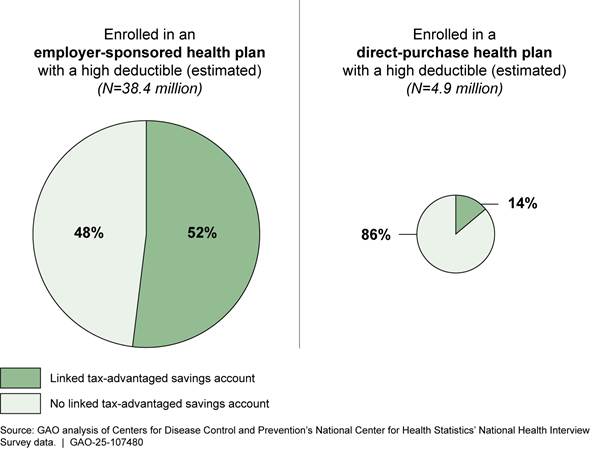
Notes: Individuals in this figure include the annual average estimated 43.4 million civilian, non-institutionalized individuals aged 18-64 who were enrolled in a private health plan with a high deductible. While these plans have a high deductible, meaning they meet or exceed Internal Revenue Service’s minimum deductible amount for health savings account (HSA) eligibility, they do not necessarily meet other requirements to be HSA eligible. To calculate annual average estimates, we pooled the sample across our analysis period and created a pooled sampling weight for each year by dividing the appropriate sampling weight by the number of years (five) in our analysis period. The results of our analysis are annual average estimates weighted to represent the adult population in the U.S. Tax-advantaged accounts in this figure include HSAs and health reimbursement arrangements.
Individuals who purchase their plans directly through the federal and state marketplaces may face challenges accessing HSA-eligible health plans and HSAs for reasons related to plan availability and consumer price sensitivity.
· Plan availability. Marketplace consumers may not have many HSA-eligible plans to choose from, as most marketplace plans are not HSA eligible. For example, according to the Centers for Medicare & Medicaid Services data, only 3 percent of plans on the federal marketplaces and state marketplaces using the federal platform were HSA eligible in 2023.[55]
· Price sensitivity. Officials from four of the external stakeholder groups we interviewed noted that consumers purchasing health insurance on the marketplaces are price sensitive and described ways in which HSA-eligible plans may not be attractive to such consumers. For example, officials from two of these groups noted that HSA-eligible plans may not be attractive to many marketplace consumers because they often cannot afford to contribute to an HSA.[56] Officials from three of these groups stated that HSA-eligible plans available through a marketplace may not be attractive to marketplace consumers because the premiums for these plans are often higher than other comparable marketplace plans; officials from two of these groups noted that the higher premiums may be due to differences in plan requirements. For example, a 2022 report indicated that in recent years, the maximum out-of-pocket limit for HSA-eligible plans was lower than the maximum out-of-pocket limit for all plans sold on the marketplaces.[57] Officials from one stakeholder group noted that due to these lower out-of-pocket limits, an issuer designing an HSA-eligible plan for the marketplace would need to offer a lower out-of-pocket maximum than other marketplace plans, which would likely result in the issuer charging a higher premium to offset their costs.
Agency Comments
We provided a draft of this report to IRS and the Department of Health and Human Services for review and comment. Both agencies provided technical comments, which we incorporated as appropriate.
As agreed with your office, unless you publicly announce the contents of this report earlier, we plan no further distribution until 30 days from the report date. At that time, we will send copies to the Secretary of Health and Human Services, Acting Commissioner of the IRS, and other interested parties. In addition, the report will be available at no charge on GAO’s website at http://www.gao.gov.
If you or your staff have any questions about this report, please contact me at DickenJ@gao.gov. Contact points for our Office of Congressional Relations and Office of Public Affairs can be found on the last page of this report. Other major contributors to this report are listed in appendix III.

John E. Dicken
Director, Health Care
The total amount of tax savings health savings account (HSA) holders realize on their contributions is based on several factors, including the account holder’s top marginal tax rate and how the contributions are made. Employer/employee contributions—including those made via payroll deductions—typically result in greater tax savings for the HSA holder, as these contributions are exempt from both the account holder’s income tax and payroll taxes (such as Social Security and Medicare).[58] Comparatively, individual contributions—those made directly to an HSA from a personal account or source—are only exempt from income tax. (See table 6.)
Table 6: Illustrative Tax Savings to Health Savings Account (HSA) Holders with Different Incomes and Contribution Methods for a $3,000 Annual HSA Contribution, 2023
|
|
Individual annual taxable income, single filer in 2023 (top marginal tax rate) |
|||||
|
|
$35,000 (12%) |
$80,000 (22%) |
$165,000 (24%) |
$300,000 (35%) |
$600,000 (37%) |
|
|
Employer/employee contributions |
|
|
|
|
|
|
|
Savings from forgone income tax |
$360 |
$660 |
$720 |
$1,050 |
$1,100 |
|
|
Savings from forgone Social Security taxa |
$186 |
$186 |
$0 |
$0 |
$0 |
|
|
Savings from forgone Medicare taxb |
$44 |
$44 |
$44 |
$71 |
$71 |
|
|
Total tax savings |
$590 |
$890 |
$764 |
$1,121 |
$1,181 |
|
|
Tax savings as a percentage of the total contribution |
20% |
30% |
25% |
37% |
39% |
|
|
Individual contributions |
|
|
|
|
|
|
|
Savings from forgone income tax |
$360 |
$660 |
$720 |
$1,050 |
$1,100 |
|
|
Tax savings as a percentage of the total contribution |
12% |
22% |
24% |
35% |
37% |
|
Source: GAO analysis based on Internal Revenue Service information. | GAO‑25‑107480
Notes: For the purposes of this table, we assume that HSA contributions are treated like the last dollars of income received and reflect the top marginal tax rates that would apply to the contribution if it was counted as taxable income. Social Security and Medicare payroll taxes are owed on individual contributions, but not on contributions from employers or from employees made through payroll deductions.
aIncome above a certain amount is not subject to Social Security tax. As a result, there was no Social Security tax reduction for income above $160,200 in 2023.
bBeginning in 2013, Medicare taxes increased by 0.9 percent for some taxpayers, including single filers, for incomes above $200,000.
The total tax costs that HSA holders must pay on non-qualified withdrawals vary based on the account holder’s top marginal tax rate and age. Non-qualified HSA withdrawals are typically taxed as regular income; non-qualified HSA withdrawals taken by account holders younger than 65 are generally subject to an additional 20 percent tax, unless they were made after the account holder became disabled or died. (See table 7.)
Table 7: Illustrative Tax Costs to Health Savings Account (HSA) Holders with Different Incomes for a $1,500 Non-Qualified HSA Withdrawal, 2023
|
|
Individual annual taxable income, single filer in 2023 (top marginal tax rate) |
||||||
|
|
$35,000 (12%) |
$80,000 (22%) |
$165,000 (24%) |
$300,000 (35%) |
$600,000 (37%) |
||
|
Age 65 and oldera |
|
|
|
|
|
||
|
Cost from income tax |
$180 |
$330 |
$360 |
$525 |
$555 |
||
|
Tax costs as a percentage of total non-qualified withdrawal |
12% |
22% |
24% |
35% |
37% |
||
|
Under age 65b |
|
|
|
|
|
||
|
Cost from income tax |
$180 |
$330 |
$360 |
$525 |
$555 |
||
|
Cost from additional 20% tax |
$300 |
$300 |
$300 |
$300 |
$300 |
||
|
Total cost for non-qualified withdrawal |
$480 |
$630 |
$660 |
$825 |
$855 |
||
|
Tax costs as a percentage of total non-qualified withdrawalc |
32% |
42% |
44% |
55% |
57% |
||
Source: GAO analysis based on Internal Revenue Service information. | GAO‑25‑107480
Notes: For the purposes of this table, we assume that HSA withdrawals are treated like the last dollars of income received and are subject to the account holders’ top marginal tax rates.
aThis population also includes individuals under age 65 who are disabled or deceased.
bThis population does not include deceased or disabled individuals under age 65.
cWhile the additional 20 percent tax is consistent across incomes, the tax is proportionately higher than the income tax for the lower income groups. For example, the additional 20 percent tax is 167 percent of income tax for a single filer making $35,000 compared to 54 percent of income tax for a single filer making $600,000.
Appendix II: Information about Individuals Aged 18-64 Enrolled in One Private Health Plan, 2019-2023
Table 8: Select Demographic Characteristics for Different Groups of Individuals Aged 18-64 Enrolled in One Private Health Plan with No Other Coverage, 2019-2023
|
|
Total estimated annual averages |
|||||
|
Characteristic |
All individuals |
Individuals in health plans with high deductibles |
Individuals with tax-advantaged savings accounts linked to health plans with high deductibles |
|||
|
|
N (millions) |
Percent of all individuals |
N (millions) |
Percent of individuals in plans with high deductibles |
N (millions) |
Percent of individuals with linked savings accounts |
|
Total |
102.1 |
100% |
43.4 |
100% |
20.7 |
100% |
|
Family income (as percent of the NHIS poverty threshold) |
|
|
|
|
|
|
|
Up to 274% |
20.5 |
20% |
7.2 |
17% |
2.3 |
11% |
|
275 - 424% |
23.5 |
23% |
9.8 |
23% |
3.9 |
19% |
|
425 - 599% |
22.7 |
22% |
9.8 |
23% |
4.8 |
23% |
|
600 - 999% |
23.1 |
23% |
10.5 |
24% |
6.0 |
29% |
|
At or above 1,000% |
12.3 |
12% |
6.0 |
14% |
3.7 |
18% |
|
Race and ethnicity |
|
|
|
|
|
|
|
Asian, non-Hispanic |
7.3 |
7% |
3.0 |
7% |
1.6 |
8% |
|
Black or African American, non-Hispanic |
9.5 |
9% |
2.7 |
6% |
1.1 |
5% |
|
Hispanic or Latino |
13.5 |
13% |
4.2 |
10% |
1.4 |
7% |
|
White, non-Hispanic |
69.5 |
68% |
32.6 |
75% |
16.2 |
78% |
|
Self-reported health status |
|
|
|
|
|
|
|
Excellent or very good |
69.7 |
68% |
29.9 |
69% |
15.2 |
73% |
|
Good |
25.5 |
25% |
10.6 |
24% |
4.6 |
22% |
|
Fair or poor |
6.9 |
7% |
2.9 |
7% |
1.0 |
5% |
|
Age |
|
|
|
|
|
|
|
18 - 25 |
12.3 |
12% |
4.1 |
9% |
2.0 |
10% |
|
26 - 34 |
20.0 |
20% |
8.6 |
20% |
4.1 |
20% |
|
35 - 44 |
23.1 |
23% |
10.3 |
24% |
5.4 |
26% |
|
45 - 54 |
23.3 |
23% |
10.0 |
23% |
4.8 |
23% |
|
55 - 64 |
23.4 |
23% |
10.4 |
24% |
4.4 |
21% |
|
Sex |
|
|
|
|
|
|
|
Female |
51.1 |
50% |
21.8 |
50% |
10.3 |
50% |
|
Male |
51.0 |
50% |
21.6 |
50% |
10.4 |
50% |
Source: GAO analysis of Centers for Disease Control and Prevention’s National Center for Health Statistics National Health Interview Survey (NHIS) data. | GAO‑25‑107480
Notes: Numbers may not add to 100 percent due to rounding. Individuals in this figure include civilian, non-institutionalized individuals aged 18-64 who were enrolled in a private health plan. Some of these plans have a high deductible, meaning they meet or exceed Internal Revenue Service’s minimum deductible amount for health savings account (HSA) eligibility, but do not necessarily meet other requirements to be HSA eligible. To calculate annual average estimates, we pooled the sample across our analysis period and created a pooled sampling weight for each year by dividing the appropriate sampling weight by the number of years (five) in our analysis period. The results of our analysis are annual average estimates weighted to represent the adult population in the U.S. Tax-advantaged accounts in this table include HSAs and health reimbursement arrangements.
Family income was measured relative to estimated poverty thresholds calculated for use in NHIS, which account for household size and—for one- and two-person households—age. For example, in 2023, the NHIS poverty threshold was $15,000 for a single person under age 66 and $30,000 for a family of four. We defined the income groups for this analysis and calculated them based on the population of NHIS respondents aged 18-64 who had one private health plan and no other coverage. Family income values were imputed for an estimated 18 percent of these respondents.
An estimated 2.2 million individuals aged 18-64 from various racial and ethnic groups are not included in the race and ethnicity breakouts shown in the chart above and, as a result, percentages do not sum to 100. These groups include American Indians and Alaska Natives and other single or multiple races. We excluded these groups because either their data did not meet the data presentation standards we applied to this analysis, or because the level of detail available in the NHIS data was not associated with one specific group (e.g., the category “other single and multiple races”).
Figure 11: Among Individuals Aged 18-64 with One Private Health Plan, Estimated Annual Shares of Those Enrolled in Health Plans with High Deductibles and Those with Linked Tax-Advantaged Savings Accounts, 2019-2023
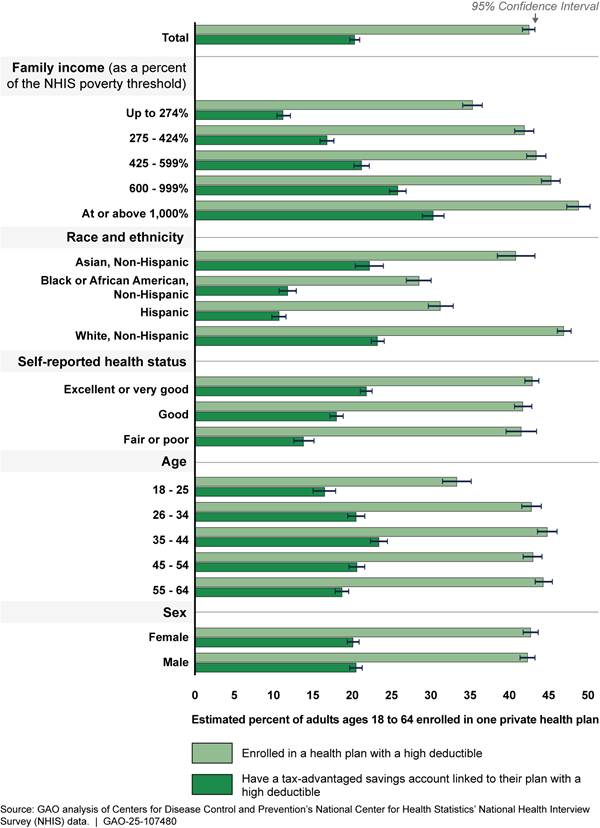
Notes: Individuals in this figure include an annual average estimated 102.1 million civilian, non-institutionalized individuals aged 18-64 who were enrolled in one private health plan with no other coverage. While some of these plans have a high deductible, meaning they meet or exceed Internal Revenue Service’s minimum deductible amount for health savings account (HSA) eligibility, they do not necessarily meet other requirements to be HSA eligible. To calculate annual average estimates, we pooled the sample across our analysis period and created a pooled sampling weight for each year by dividing the appropriate sampling weight by the number of years (five) in our analysis period. The results of our analysis are annual average estimates weighted to represent the adult population in the U.S. Tax-advantaged accounts in this figure include HSAs and health reimbursement arrangements.
Family income was measured relative to estimated poverty thresholds calculated for use in NHIS, which account for household size and—for one- and two-person households—age. For example, in 2023, the NHIS poverty threshold was $15,000 for a single person under age 66 and $30,000 for a family of four. We defined the income groups for this analysis and calculated them based on the population of NHIS respondents ages 18-64 who had one private health plan and no other coverage. Family income values were imputed for an estimated 18 percent of these respondents.
An estimated 2.2 million individuals aged 18-64 from various racial and ethnic groups are not included in the race and ethnicity breakouts shown in the chart above and, as a result, percentages do not sum to 100. These groups include American Indians and Alaska Natives and other single or multiple races. We excluded these groups because either their data did not meet the data presentation standards we applied to this analysis, or because the level of detail available in the NHIS data was not associated with one specific group (e.g., the category “other single and multiple races”).
GAO Contact
John E. Dicken, DickenJ@gao.gov
Staff Acknowledgments
In addition to the contact named above, Gerardine Brennan (Assistant Director), Emily Bippus Simmons (Analyst-in-Charge), Megan Johnson, and Lisa Minich made key contributions to this report. Deborah Healy, Drew Long, Jennifer Rudisill, Ethiene Salgado-Rodriquez, and Ravi Sharma also made important contributions.
The Government Accountability Office, the audit, evaluation, and investigative arm of Congress, exists to support Congress in meeting its constitutional responsibilities and to help improve the performance and accountability of the federal government for the American people. GAO examines the use of public funds; evaluates federal programs and policies; and provides analyses, recommendations, and other assistance to help Congress make informed oversight, policy, and funding decisions. GAO’s commitment to good government is reflected in its core values of accountability, integrity, and reliability.
Obtaining Copies of GAO Reports and Testimony
The fastest and easiest way to obtain copies of GAO documents at no cost is through our website. Each weekday afternoon, GAO posts on its website newly released reports, testimony, and correspondence. You can also subscribe to GAO’s email updates to receive notification of newly posted products.
Order by Phone
The price of each GAO publication reflects GAO’s actual cost of production and distribution and depends on the number of pages in the publication and whether the publication is printed in color or black and white. Pricing and ordering information is posted on GAO’s website, https://www.gao.gov/ordering.htm.
Place orders by calling (202) 512-6000, toll free (866) 801-7077,
or
TDD (202) 512-2537.
Orders may be paid for using American Express, Discover Card, MasterCard, Visa, check, or money order. Call for additional information.
Connect with GAO
Connect with GAO on X,
LinkedIn, Instagram, and YouTube.
Subscribe to our Email Updates. Listen to our Podcasts.
Visit GAO on the web at https://www.gao.gov.
To Report Fraud, Waste, and Abuse in Federal Programs
Contact FraudNet:
Website: https://www.gao.gov/about/what-gao-does/fraudnet
Automated answering system: (800) 424-5454
Media Relations
Sarah Kaczmarek, Managing Director, Media@gao.gov
Congressional Relations
A. Nicole Clowers, Managing Director, CongRel@gao.gov
General Inquiries
[1]HSAs and HDHPs were authorized by the Medicare Prescription Drug, Improvement, and Modernization Act of 2003. Pub. L. No. 108-173, § 1201, 117 Stat. 2066, 2469 (codified as amended at 26 U.S.C. § 223). Deductibles are the amounts individuals have to pay for health care services their health plans cover before their plans begin to pay.
[2]See Devenir Research, 2023 Year-End HSA Market Statistics & Trends - Executive Summary (Mar. 26, 2024).
[3]See GAO, Health Savings Accounts: Participation Increased and Was More Common among Individuals with Higher Incomes, GAO‑08‑474R (Washington, D.C.: Apr. 1, 2008).
[4]The estimate does not include forgone payroll taxes. See Department of the Treasury, Office of Tax Analysis, Tax Expenditures Fiscal Year 2025 (Mar. 11, 2024). In addition to HSA forgone federal taxes, the estimate includes Archer Medical Savings Accounts, which is an older, more restrictive version of an HSA that are only available to certain self-employed people and small businesses. See 26 U.S.C. § 220. Individuals generally have not been able to open or contribute to Archer Medical Savings Accounts since 2007. In 2022, about 5,300 tax returns indicated contributions to their Archer Medical Savings Accounts while the number receiving employer contributions was unknown. In contrast, about 2.1 million and about 12.9 million tax returns indicated individual and employer HSA contributions, respectively, in the same year. See Internal Revenue Service, Statistics of Income—2022 Individual Income Tax Returns Line Item Estimates, Publication 4801 (Washington, D.C.: December 2024). IRS data refer to HSA expenses as distributions; however, for the purpose of this report, we refer to these as withdrawals.
[5]The report focused primarily on four of the largest HSA trustees. See Consumer Financial Protection Bureau, Health Savings Accounts: Issue Spotlight (May 2024).
[6]We classified HSA providers as one of the following five types based our review of IRS publications pertaining to HSA providers: bank, credit union, insurance company, broker-dealer (an entity that buys or sells securities on behalf of its customers, its own account, or both), and other nonbank (for example, major financial institutions and state or non-profit retirement entities).
[7]We inflation-adjusted all dollar amounts reported across these data sources to 2023 dollars using the gross domestic product price index, unless otherwise noted.
[8]Tax filers must file a Form 8889 to report HSA contributions, withdrawals, and other HSA activity in the tax year. An HSA holder might not have any activity to report (e.g., no contributions or withdrawals) so the account holder would not need to file a Form 8889 that year. As such, the IRS data likely underestimates the universe of HSA holders. Additionally, IRS’s data are estimates based on returns filed that were sampled statistically and then weighted to estimate the entire tax year. IRS officials told us that the estimates do not account for amended returns or audit updates. We reported 95 percent confidence intervals when reporting multi-year IRS data.
[9]Devenir Research is an HSA industry research firm, and its market summary reports are based on its own proprietary database. Officials from Devenir Research told us their database accounted for about 82 percent of HSAs in 2023, and that they believed their reports to be representative of the overall HSA market due to their financial modeling and back tests against IRS data.
[10]KFF, formerly known as Kaiser Family Foundation, is a health policy research firm. KFF’s Employer Health Benefits Survey is conducted annually by interviewing business owners and human resources/benefits managers at over 2,000 firms. The estimates are weighted using the Census Bureau’s 2020 Statistics of U.S. Businesses and 2017 Census of Government totals.
[11]The HSA-related publications from the Employee Benefit Research Institute, an employee-focused research firm, are based on its own proprietary database. At the end of 2022, the Employee Benefit Research Institute’s HSA database contained 14 million accounts with assets totaling $42.5 billion.
[12]NHIS annually collects data from a nationally representative sample of civilian, non-institutionalized adults and children related to a broad range of health topics, including information about health plans and linked tax-advantaged savings accounts. Specifically, NHIS asks respondents who report having a health plan with a high deductible or those who do not know the amount of their health plan’s deductible, whether they have a tax-advantaged HSA or health reimbursement arrangement (HRA) linked to their health plans.
[13]NHIS data do not differentiate between respondents who had an HSA and those who had an HRA. Based on KFF survey estimates of the shares of employees enrolled in health plans that were linked to HRAs and our review of NHIS data, we conservatively estimate that more than 60 percent of the tax-advantaged savings accounts linked to health plans with high deductibles in the NHIS data we analyzed were HSAs.
[14]Using these NHIS data, we identified an estimated annual average 125.7 million civilian, non-institutionalized individuals aged 18-64 enrolled in one private health plan with no other coverage, and 102.1 million of these reported sufficient information to be included in our analysis. We chose these criteria for inclusion because they align with the criteria for contributing to an HSA: an individual cannot be claimed as a dependent on someone else’s tax return (including children), cannot be enrolled in Medicare (including people aged 65 or older) and—with limited exceptions—are not covered by health insurance other than an HSA-eligible HDHP. The private health plans in our analysis include those that offer either single coverage (covers only the policyholder) or family coverage (covers the policyholder and one or more family members). To calculate annual average estimates, we pooled the sample across our analysis period and created a pooled sampling weight for each year by dividing the appropriate sampling weight by the number of years (five) in our analysis period. The results of our analysis are annual average estimates weighted to represent the adult population in the U.S.
[15]NHIS provided imputed values for the 23 percent to 24 percent of all respondents who did not provide information about their exact family income and the approximately 1 percent of respondents who did not provide information about their race and ethnicity in each year; we used these imputed values in our analysis.
We assigned respondents to one of five income groups by percent of estimated poverty thresholds calculated for use in NHIS: up to 274, 275 to 424, 425 to 599, 600 to 999, and at or above 1,000. We developed the first four of these groups to represent relatively even numbers of individuals enrolled in a health plan with a high deductible and the fifth group to represent all “topcoded” responses across the 5 years of NHIS data. Topcoding is the practice of censoring data points with values above an upper bound by recording the value of that upper bound. In 2019, NHIS topcoded its income variable at 1,000 percent of its estimated poverty thresholds. Starting in 2020, NHIS topcoded its income variable at 1,100 percent. The estimated poverty thresholds are based on the official poverty thresholds published each year by the U.S. Census Bureau and are calculated based on household size, and—for one- and two-person households—age.
[16]An estimated 800,000 individuals aged 18-64 who received their insurance through another method—including through a state or local government, school, parents, other relative, or other method—were not included in this analysis. These individuals make up less than 1 percent of individuals aged 18-64 enrolled in one private health plan with no other coverage.
[17]Certain coverage is disregarded, such as dental and long-term care coverage. See 26 U.S.C. § 223(c)(1)(B). In July 2025, Congress passed and the President signed a law which, among other things, expands HSA eligibility. For example, beginning in 2026, the law treats all bronze-level and catastrophic plans on the marketplace as HSA-eligible HDHPs. This report reviews HSA-eligible HDHPs under laws in effect through January 2023 and does not include plans that may be eligible under these expanded eligibility provisions. See An Act To provide for reconciliation pursuant to title II of H. Con. Res. 14, Pub. L. No. 119-21, § 71307, 139 Stat. 72, 325 (2025) (codified as amended at 26 U.S.C. § 223(c)(2)(H)).
[18]Qualified medical expenses are defined in the Internal Revenue Code and detailed in IRS guidance. See 26 U.S.C. § 213(d); and Internal Revenue Service, Medical and Dental Expenses, Publication 502(2024) (Nov. 18, 2024). HSAs are interest bearing savings accounts. HSA providers may offer the opportunity to open an investment account for HSA funds where an account holder can invest in options such as mutual funds, exchanged traded funds, and stocks.
[19]The 20 percent additional tax does not apply to non-qualified expenses paid after an individual reaches the age of Medicare eligibility, becomes disabled, or dies.
[20]Flexible spending arrangements, sometimes known as flexible spending accounts, are employer-established benefits that reimburse employees for certain medical expenses and are usually funded by employees through a salary-reduction agreement.
[21]HSAs are portable and account holders can take withdrawals at any time, but they must be enrolled in an HSA-eligible HDHP and generally have no other health coverage to make contributions. Account holders who fail to maintain HSA eligibility while making contributions and those who make excess contributions above the HSA annual limit are subject to additional taxes.
[22]HSA holders may only make contributions to their HSAs while enrolled in an HSA-eligible health plan, but they may maintain or use any accumulated funds in the HSA even if they are no longer enrolled in an HSA-eligible plan.
[23]26 U.S.C.§ 223(c)(2). Deductible and out-of-pocket spending limits are adjusted annually for cost-of-living. In 2023, the minimum deductible for an HDHP was $1,500 for single coverage and $3,000 for family coverage, and the maximum out-of-pocket limit for an HDHP was $7,500 for single coverage and $15,000 for family coverage.
[24]An HSA-eligible HDHP can cover certain types of services without a deductible, or with a deductible that is less than the annual deductible applicable to all other services. See, e.g., 26 U.S.C. § 223(c)(2)(C) (safe harbor for absence of preventive care deductible).
[25]For purposes of this report, we refer to HDHPs that meet the statutory criteria as HSA-eligible HDHPs.
[26]Most Americans—212 million, or about 64 percent, in 2023—receive health coverage through employer-sponsored (178 million) or direct purchase (34 million) private health plans. See Katherine Keisler-Starkey and Lisa N. Bunch, Health Insurance Coverage in the United States: 2023, U.S. Census Bureau, Current Population Reports, P60-284 (Washington, D.C.: September 2024).
[27]Federal support for employer-sponsored plans is provided through various tax benefits. The employer’s share of the premiums for these plans is excluded from their employees’ gross income so it is not subject to federal income or payroll taxes (such as for Social Security and Medicare). In addition, the employee’s share of premiums is also excluded from their taxable wages and therefore not subject to federal income or payroll taxes.
[28]KFF did not find the estimates to be statistically different year over year. KFF, Employer Health Benefits – 2023 Annual Survey (San Francisco, Calif: October 2023).
[29]See generally Pub. L. No. 111-148, tit. I, subtit. D, 124 Stat. 119, 162-213 (2010) (codified as amended at 42 U.S.C. § 18021 et seq.).
[30]This data only includes states using the federal eligibility and enrollment platform. States that operate their own state-based exchanges are excluded. Centers for Medicare & Medicaid Services, 2024 Marketplace Open Enrollment Period Public Use Files – 2014-2024 OEP Plan Design Public Use File (Baltimore, Md).
[31]This estimate includes HSA-eligible health plans as well as plans with deductibles of at least $1,000 for single coverage and $2,000 for family coverage that are paired with an HRA. See KFF, Employer Health Benefits – 2023.
[32]In 2022, the Consumer Financial Protection Bureau announced an initiative to reduce certain fees it referred to as “junk fees” that are charged by banks and other financial companies. The bureau sought public comments on fees for things people believed were covered by the baseline price of a product or service, unexpected fees for a product or service, fees that seemed too high for the purported service, and fees where it was unclear why they were charged. The bureau issued a final rule in December 2024 that would have increased consumer protections that apply to overdraft fees charged by certain large financial institutions, but in May 2025, Congress passed and the President signed a joint resolution that nullified the rule. See Pub. L. No. 119-10, 139 Stat. 53 (2025).
[33]See 12 C.F.R. § 1030.4 (2024).
[34]Interest rates were as of late 2024 and early 2025 when we conducted interviews with selected HSA providers. The Federal Deposit Insurance Corporation reported that as of December 16, 2024, the average national rate for interest checking account rates was 0.07 percent for an account with a $2,500 balance.
[35]While non-invested HSA funds can be insured by the Federal Deposit Insurance Corporation, HSA investments are not. The account holder is responsible for making the decision to invest and bears the risks and rewards for investment losses or gains.
[36]Our analysis of IRS tax filings only reports on HSA contributions and withdrawals, but IRS Form 8889 includes other HSA activity; for example, the Form 8889 also captures if the tax filers failed to maintain HDHP coverage during the year. Tax returns can be filed as (1) married filing jointly; (2) qualifying widow; (3) head of household; (4) single; or (5) married filing separately. Therefore, one tax return can represent more than one person. In 2022, over half of the tax returns that reported HSA contributions or withdrawals were filed by married persons filing jointly and widows.
[37]IRS data refer to all contributions from employers and contributions from employees made through payroll deductions as employer contributions. For the purpose of this report, we refer to these as employer/employee contributions. Individual contributions are those made directly from the individual to the account.
[38]See Devenir Research, 2022 Year-End HSA Market Statistics & Trends – Executive Summary (Mar. 30, 2023).
[39]See KFF, Employer Health Benefits – 2022 Annual Survey (San Francisco, Calif.: October 2022).
[40]KFF defined small firms as those with three to 199 employees, and large firms as those with 200 or more employees.
[41]See Jake Spiegel and Paul Fronstin, “Health Savings Account Balances, Contributions, Distributions, and Other Vital Statistics: Evidence from the EBRI HSA Database,” Employee Benefit Research Institute, Issue Brief, no. 603 (Mar. 7, 2024).
[42]For all account holders under age 65, non-qualified withdrawals made after the account holder dies or becomes disabled are also exempt from the additional tax.
[43]The age 65 and older population also includes individuals under age 65 who are disabled or deceased.
[44]Devenir Research reported that there is seasonality in the percentage of accounts that are unfunded, because accounts are often opened during the fall open enrollment season, but remain unfunded until early the following year when the accounts would be eligible for contributions once the HSA-eligible plan takes effect in the new year. Devenir Research also reported that as of June 30, 2023, an estimated 18 percent of accounts were unfunded, a 3 percent decrease from the end of 2022. See Devenir Research, 2022 Year-End HSA Market Statistics & Trends – Executive Summary (Mar. 30, 2023); and Devenir Research, 2023 Midyear HSA Market Statistics & Trends – Executive Summary (Sept. 21, 2023).
[45]See Spiegel and Fronstin, “Health Savings Account.”
[46]See Devenir Research, 2023 Year-End HSA Market Statistics & Trends – Executive Summary (Mar. 26, 2024).
[47]See Jake Spiegel and Paul Fronstin, “Trends in Health Savings Account Balances, Contributions, Distributions, and Investments, 2011-2022,” Employee Benefit Research Institute Issue Brief, No. 604 (Mar. 21, 2024).
[48]See Devenir Research, 2023 Year-End HSA Market Statistics & Trends – Executive Summary (Mar. 26, 2024).
[49]See Spiegel and Fronstin, “Health Savings Account.”
[50]The results of our analysis are annual average estimates weighted to represent the adult population in the U.S.
[51]The CDC conducted its own analysis of NHIS data on having a tax-advantaged savings account linked to a plan with a high deductible and had similar findings. See Centers for Disease Control and Prevention, Enrollment in High-Deductible Health Plans Among People Younger Than Age 65 With Private Health Insurance: United States, 2019-2023, National Health Statistics Reports, no. 214 (Dec. 5, 2024).
[52]Family income was measured relative to estimated poverty thresholds calculated for use in NHIS, which account for household size and—for one- and two-person households—age. For example, in 2023, the NHIS poverty threshold was $15,000 for a single person under age 66 and $30,000 for a family of four. The Congressional Research Service’s analysis of IRS’s Statistics of Income data also found that HSA contributions and withdrawals generally increased with income. See Congressional Research Service, Health Savings Accounts (HSAs), R45277 (Feb. 11, 2025).
[53]We were not able to determine the strength of the relationship between income and race and ethnicity due to small sample sizes and presence of other factors, like educational attainment or employment status, that may have influenced the likelihood of having these accounts.
[54]We were not able to determine the strength of the relationship between income and self-reported health status due to small sample sizes and presence of other factors, like educational attainment or employment status, that may have influenced the likelihood of having these accounts.
[55]See Centers for Medicare & Medicaid Services, 2024 Marketplace Open Enrollment Period. The percentage of HSA-eligible plans reports an enrollee-weighted average of the percentage of HSA-eligible plan variations in each county among the federal and state marketplace state using Healthcare.gov as the platform for eligibility and enrollment. The percentage excludes state marketplaces using their own platforms for eligibility and enrollment. The percentage of HSA-eligible plans on the marketplace may increase in 2026 since all bronze-level and catastrophic plans will be HSA-eligible under legislation enacted in July 2025. See An Act To provide for reconciliation pursuant to title II of H. Con. Res. 14, Pub. L. No. 119-21, § 71307, 139 Stat. 72, 325 (2025) (codified as amended at 26 U.S.C. § 223(c)(2)(H)).
[56]A prior GAO report found that in 2022, around 53 percent of all covered individuals enrolled in marketplace plans in states that used the Healthcare.gov platform had incomes from 100 to 250 percent of the federal poverty level, and that at least 35 percent had incomes at or below 150 percent of the federal poverty level. See GAO, Private Health Plans: Comparison of Employer-Sponsored Plans to Healthcare.gov Marketplace Plans, GAO‑25‑106798 (Washington, D.C.: Nov. 27, 2024).
[57]See, for example, Peterson-KFF Health System Tracker, ACA’s Maximum Out-of-Pocket Limit is Growing Faster Than Wages (July 20, 2022).
In 2023, the maximum out-of-pocket limit for HSA-eligible plans was $7,500 for self-only coverage and $15,000 for family coverage compared to $9,100 and $18,200 for all marketplace self-only and family coverage plans.
[58]Internal Revenue Service data refer to all contributions from employers and contributions from employees made through payroll deductions as employer contributions. For the purpose of this report, we refer to these as employer/employee contributions. Individual contributions are those made directly from the individual to the account.
Employers also realize tax savings for HSA contributions made via payroll deductions, as these deductions are not considered earned income and therefore are not subject to the employer’s payroll taxes (such as Social Security and Medicare).