AVIATION WORKFORCE
Contributions and Characteristics of Selected Airport Workers
Report to Congressional Committees
United States Government Accountability Office
A report to congressional committees
For more information, contact: Danielle Giese at giesed@gao.gov.
What GAO Found
Airport service workers support the U.S. commercial air transportation industry by loading cargo and baggage, cleaning aircraft and terminals, assisting passengers with disabilities, driving shuttle buses, and providing food and beverages, among other functions. The revenue generated by businesses associated with these workers can provide insight into their economic contributions. For example, Federal Aviation Administration (FAA) data show that in 2023, the nation’s busiest 138 commercial service airports earned approximately $5.9 billion in revenue from ground transportation and parking services, and $2.3 billion from terminal concessions. These earnings accounted for nearly 30 percent of those airports’ annual operating revenue.
GAO’s analysis of airport service workers’ economic characteristics found that they are generally better off than service workers in all industries and worse off than air transportation workers overall (a population that includes workers like flight attendants and mechanics). For example, the median wage for airport service workers paid hourly was estimated to be $19.74 (in 2024 dollars), according to 2018 through 2024 Current Population Survey data. This wage was higher than that of service workers in all industries and lower than that of air transportation workers overall.
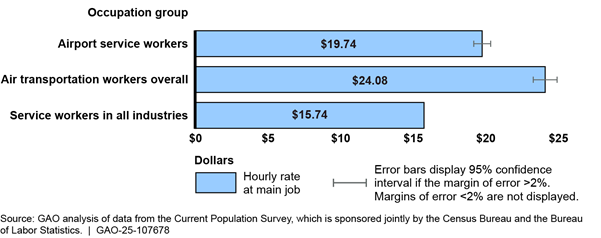
Notes: For the purposes of this report, airport service workers are private sector employees in 36 selected occupations within the air transportation industry. Air transportation workers overall include all private sector employees in the air transportation industry, such as flight attendants and mechanics. Service workers in all industries are private sector employees—in all industries combined—working in the same 36 selected occupations as airport service workers. GAO’s wage analysis only includes workers who reported that they were paid hourly.
GAO’s analysis also found that approximately 7 percent of airport service workers lived at or below the poverty line when they responded to the U.S. Census Bureau’s American Community Survey from 2018 through 2022. The same analysis found 15 percent of service workers in all industries lived at or below the poverty line, as did 4 percent of air transportation workers overall.
Why GAO Did This Study
The U.S. air transportation industry is a key component of the nation’s economy, enabling the movement of goods and passengers throughout the nation and the world.
The FAA Reauthorization Act of 2024 included a provision for GAO to conduct a comprehensive review of domestic airport service workers, including their role in, importance to, and impact on the aviation economy.
This report provides information about selected airport service workers’ economic contributions to airports and their economic characteristics, among other topics.
To describe airport service workers’ economic contributions to airports, GAO analyzed 2023 data from FAA’s Certification Activity Tracking System. GAO also reviewed economic impact reports representing 26 large hub airports (defined as airports that have 1 percent or more of the annual national passenger boardings). In addition, GAO interviewed FAA officials and representatives from 12 organizations, including airports, airlines and other employers, and labor unions.
To describe the workers’ economic characteristics, GAO analyzed the U.S. Census Bureau’s American Community Survey 5-year data from 2018 through 2022. GAO also analyzed 2018 through 2024 data from the Current Population Survey, which is sponsored jointly by the U.S. Census Bureau and the Bureau of Labor Statistics. For each of these data sources, GAO analyzed the most recently finalized data available at the time of its analysis.
|
Abbreviations |
|
|
|
|
|
BUR |
Hollywood Burbank Airport |
|
CWA |
Communication Workers of America |
|
DAL |
Dallas Love Field |
|
DFW |
Dallas Fort Worth International Airport |
|
DHS |
Department of Homeland Security |
|
DOT |
Department of Transportation |
|
FAA |
Federal Aviation Administration |
|
GAO |
Government Accountability Office |
|
HPN |
Westchester County Airport |
|
JFK |
John F. Kennedy International Airport |
|
LAWA |
Los Angeles World Airports |
|
LAX |
Los Angeles International Airport |
|
SEIU |
Service Employees International Union |
|
SNAP |
Supplemental Nutrition Assistance Program |
|
TSA |
Transportation Security Administration |
This is a work of the U.S. government and is not subject to copyright protection in the United States. The published product may be reproduced and distributed in its entirety without further permission from GAO. However, because this work may contain copyrighted images or other material, permission from the copyright holder may be necessary if you wish to reproduce this material separately.
August 21, 2025
The Honorable Ted Cruz
Chairman
The Honorable Maria Cantwell
Ranking Member
Committee on Commerce, Science, and Transportation
United States Senate
The Honorable Sam Graves
Chairman
The Honorable Rick Larsen
Ranking Member
Committee on Transportation and Infrastructure
House of Representatives
The U.S. air transportation industry is a key component of the nation’s economy, enabling the transportation of goods and passengers throughout the nation and the world. In 2022, U.S. air carriers transported more than 760 million domestic passengers, and airline operations directly or indirectly supported nearly $400 billion in economic output, according to the Federal Aviation Administration (FAA). Service workers at airports help facilitate this activity by loading cargo and baggage, cleaning aircraft and terminals, assisting passengers with disabilities, checking boarding passes, and providing food and beverages, among other functions.
In addition, airport service workers help prevent or mitigate situations that could result in threats to passenger safety or security breaches. For example, a preliminary report from the National Transportation Safety Board found that in March 2025, ramp workers at the Denver International Airport extinguished a fire that broke out in an aircraft’s engine after it arrived at the gate, prior to the arrival of the airport’s firefighters.[1] Similarly, the importance of service workers being vigilant for security risks is underscored by recent incidents like a passenger bypassing boarding pass scans and trespassers hiding in aircraft wheel wells.[2] Recognizing the roles of these workers, over the last 25 years, more than a dozen states, localities, or airport authorities have adopted wage requirements to retain them.[3]
The FAA Reauthorization Act of 2024 includes a provision for us to conduct a comprehensive review of U.S. airport service workers, including their role in, importance to, and impact on the aviation economy.[4] This report provides information about selected airport service workers’ (1) safety and security functions, (2) economic contributions to airports and communities, (3) economic characteristics, and (4) demographic characteristics.
For the purpose of this report, unless otherwise noted, we defined airport service workers as private sector employees within the air transportation industry who reported to the Census Bureau that their primary job was one of 36 occupations that we identified as related to the transportation of passengers, cargo or mail; concessions; and airline catering, among other functions.[5] When conducting data analysis and interviews, we grouped these selected occupations into the following categories: (1) baggage and cargo handlers; (2) cleaning staff; (3) concessions and catering workers; (4) contracted security staff; (5) passenger attendants; (6) skycaps; and (7) ticketing and customer service agents.
To describe the safety and security functions that airport service workers are expected to perform, we reviewed Department of Transportation (DOT) and Transportation Security Administration (TSA) policies and guidance related to safety and security.[6] We also analyzed information from FAA’s Accident and Incident Data System from calendar years 2022 through 2024 to identify safety incidents involving airport service workers. We analyzed all 173 event narratives on incidents involving commercial service aircraft to determine how many descriptions mention the involvement of airport service workers. We assessed the reliability of the information by reviewing technical documentation and contacting FAA officials and determined that the information was sufficiently reliable for our purposes of identifying safety incidents involving airport service workers. In addition, we interviewed or received written responses from representatives of 12 organizations with knowledge of the safety and security roles of airport service workers. When describing views of these organizations, we refer to comments from two or three organizations as “a few interviewees,” four to six organizations as “some interviewees,” and seven to 11 organizations as “most interviewees.” Not all organizations had comments on each topic we discussed. Interviewees included representatives of six airports, two airlines, one contractor that provides airport operations services, and three labor unions representing airport service workers.[7] We asked each union to invite airport service workers to participate in interviews to gain insights on workers’ perspectives. We interviewed a total of 15 workers from the three unions. We also interviewed officials from FAA and TSA.
To describe the economic contributions of airport service workers, we reviewed economic impact studies of large hub airports to identify those that specifically discuss airport service workers.[8] The reports’ descriptions of airport service workers might not align with our definition. For example, a report that includes “security workers” in its economic analysis could include government workers that we excluded, like TSA agents or local police. Nevertheless, we believe these economic impact reports provide relevant insight into the general economic contributions of airport service workers to their local economies. In addition, we analyzed airport financial data from FAA’s Certification Activity Tracking System for fiscal year 2023—the most reliable, recent data at the time of our analysis—to describe revenue sources related to airport service workers. We assessed the reliability of the system’s data by reviewing technical documentation and interviewing FAA officials. Based on these efforts, we determined that these data were sufficiently reliable for the purpose of describing revenue sources related to airport service workers. We also sought the views of the 12 previously described organizations on the economic contributions of airport service workers.
To provide information on the economic characteristics of airport service workers, we estimated median hourly wages using 2018 through 2024 data from the Current Population Survey, which is sponsored jointly by the Census Bureau and the Bureau of Labor Statistics. We determined that the survey’s data were generally reliable for developing hourly wage estimates for five of the seven airport service workers occupation categories. However, we could not produce a reliable wage estimate for two of the categories due to the small sample size.[9] We also analyzed variables from the U.S. Census Bureau’s 2018-2022 American Community Survey 5-year data that we believe provide insight into workers’ economic characteristics and financial well-being. These variables include health insurance coverage, rent burden, and workers in households at or below the poverty line.[10] This 5-year compilation of data was the most recent available at the time of our analysis, and we refer to it henceforth as the 2018-2022 American Community Survey for the purposes of this report. We assessed the reliability of the survey’s data by reviewing documentation on the survey’s general design and on the specific elements that we used in our analysis. Based on these efforts, we determined that these data were sufficiently reliable to provide descriptive statistics on the selected variables.
To provide information on the demographic characteristics of airport service workers, we analyzed variables from the 2018-2022 American Community Survey. Based on the efforts described above, we determined that these data were sufficiently reliable for the purpose of describing these characteristics.
To provide context for our economic and demographic analyses of airport service workers, we analyzed data on:
· all workers in the air transportation industry, which we refer to as “air transportation workers overall.” This occupation group includes pilots, flight attendants, mechanics and other air transportation occupations in addition to airport service workers; and
· workers in all industries, including the air transportation industry, who reported having the same occupations as airport service workers (e.g., “janitor,” “cook,” and “customer service representative”). For the purposes of this report, we refer to this occupation group as “service workers in all industries.”
Thus, both the “air transportation workers overall” occupation group and the “service workers in all industries” occupation group include airport service workers.
Further information about our methodology is provided in appendix I.
We conducted this performance audit from July 2024 to August 2025 in accordance with generally accepted government auditing standards. Those standards require that we plan and perform the audit to obtain sufficient, appropriate evidence to provide a reasonable basis for our findings and conclusions based on our audit objectives. We believe that the evidence obtained provides a reasonable basis for our findings and conclusions based on our audit objectives.
Background
U.S. Airports and Airport Service Workers
U.S. airports vary substantially in size and in the extent of services they support, with large airports spanning thousands of acres and serving as the worksite for tens of thousands of workers employed by businesses like airlines and service contractors. In calendar year 2023, the nation’s 138 primary commercial service airports served approximately 97 percent of air travelers.
Workers at airports provide a variety of services in the terminal, on the ramp (the area where aircraft park, load, and unload), or other locations on and around the property. For example:
· Baggage and cargo handlers load, unload, and sort baggage, as well as move freight, stock, or other materials. They may also conduct other ramp services, such as guiding an aircraft to the jet bridge.
· Cleaning staff vacuum, disinfect, and search aircraft cabins between flights, as well as remove items and trash left by previous passengers. Work can also include servicing and restocking bathrooms, keeping the terminals clean, and tidying rooms at on-site hotels.
· Concessions and catering workers prepare and cook food; deliver catered food to aircraft; serve drinks at bars; drive shuttle buses; assist with vehicle parking; and facilitate transactions at vendor locations throughout the terminal.
· Contracted security staff guard, patrol, or monitor airport facilities and grounds.[11] They might also inspect items entering certain areas, like catering carts being delivered to aircraft.
· Passenger attendants transport passengers needing wheelchair assistance and may assist unaccompanied minors in the airport.
· Skycaps transport baggage from passenger vehicles into the airport.
· Ticketing and customer service agents verify passenger identification; check baggage and process ticket transactions; and handle complaints.
Certain workers provide multiple types of services, depending on the expectations of their employer. For example, workers may load baggage as well as clean an aircraft.
Passenger Safety Roles and Responsibilities at Airports
FAA oversees the safety of the nation’s aviation system, including some oversight of airport terminals and ramp areas where airport service workers perform their jobs. FAA’s oversight of these areas is generally exercised indirectly through its certification of airports and airlines, both of which are more directly responsible for passenger safety.[12] For example, commercial service airports and airlines must provide (or ensure the provision of) assistance to passengers with disabilities at the airport when requested, including wheelchair assistance. In December 2024, the Department of Transportation (DOT) published a rule that clarified that such assistance must be “safe” (i.e., does not put the passenger at heightened risk of bodily injury).[13]
FAA has statutory authority to investigate aviation accidents or incidents including those that occur in ramp areas.[14] In addition, FAA is responsible for investigating incidents where vehicles or pedestrians—including airport service workers—deviate onto runways, which can pose a safety threat to aircraft that are taking off or landing.
Security Roles and Responsibilities at Airports
As the federal agency with primary responsibility for securing the nation’s civil aviation system, TSA, within the Department of Homeland Security (DHS), is responsible for establishing security measures and regulating the implementation of those measures by airport operators and other regulated entities. TSA inspects airports, air carriers, and other regulated entities to ensure that they are complying with federal aviation security regulations, TSA-approved airport security programs, and other requirements, including those related to controlling access to secure areas of an airport. In general, secured areas include the spaces that provide passengers access to boarding aircraft as well as places where workers must clearly display their TSA-authorized credentials, such as the ramp. Airport operators must implement security requirements in accordance with their TSA-approved airport security programs.
Safety and Security Functions of Selected Airport Service Workers
What safety functions do airport service workers typically perform?
Airport service workers in the terminal area typically perform safety functions such as 1) identifying hazards that can cause passenger injury or affect public health, and 2) assisting passengers in the case of fires, medical emergencies, natural disasters, and other emergencies, according to most of our interviewees.[15] For example:
· One airport representative told us that airport service workers are encouraged to report incidents that they perceive as dangerous to passengers’ safety into a mobile application. When the airport’s operations center receives the safety alert, an appropriate person is sent to address the issue. For example, if a worker reports a spill, the operations center will dispatch a custodian to mop up the liquid.
· A union representative said that airport service workers assist passengers in finding appropriate exits to prevent passengers inadvertently entering areas that could put their safety at risk.
Like workers in the terminal, workers on the ramp are also expected to remain vigilant for possible hazards that may harm passenger safety, according to some interviewees.[16] Our review of information from FAA’s Accident and Incident Data System from 2022 through 2024 found at least eight instances when ramp workers mitigated issues that, if unaddressed, could have potentially threatened passenger safety.[17] Examples include:
· In 2023 at Chicago O’Hare International Airport, ground personnel noticed that the right-wing evacuation slide was missing from an aircraft that had just arrived at the gate. The slide was later found in the yard of a residence near the airport.
· In 2022 at Denver International Airport, ramp workers observed smoke coming from the landing gear of an aircraft that had arrived at the gate, after which passengers evacuated the plane through emergency slides. The smoke came from a fire located in the aircraft’s right-hand wheel well.
· In 2022 at Ronald Reagan Washington National Airport, ground crew noticed a hole in an aircraft that had just arrived at the gate. An investigation determined that the aircraft had hit a runway light.
In addition, airport service workers in the ramp area are responsible for correctly operating equipment and vehicles in a manner that protects passenger safety, according to some interviewees. Ramp areas are complex and crowded, and safety responsibilities in these areas vary by airport and even by terminal, as we have previously reported.[18] Service workers not performing their jobs correctly can lead to undesirable safety situations, according to some interviewees. According to our analysis of 173 FAA accident and incident event narratives from 2022 through 2024, airport service workers contributed negatively to at least 20 events.[19] Examples include:
· In 2024 at Boston Logan International Airport, when preparing for departure, a pushback tug vehicle driver oversteered, resulting in aircraft contact with the tug vehicle and damage to the aircraft’s nose. Following the incident, passengers were required to deplane.
· In 2022 at George Bush Intercontinental Airport in Houston, ground crew left an external Bluetooth communications box connected to the aircraft. Following departure, the flight crew heard a loud banging sound, declared an emergency, and returned to the airport. Inspection later found damage to the skin of the aircraft near the access door for the ground power unit.
What occupation-specific safety functions do airport service workers typically perform?
Interviewees provided examples of occupation-specific safety functions for all types of airport service workers. Functions include identifying and removing public health hazards, safely transporting passengers through airport terminals, and ensuring the safety of pedestrians in curbside areas (see fig. 1).
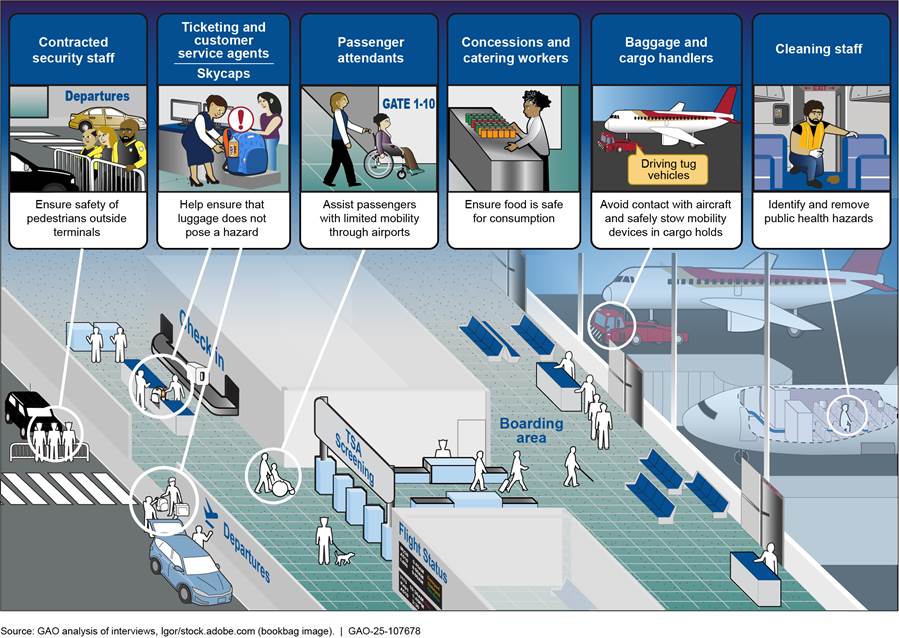
Baggage and cargo handlers. Baggage and cargo handlers conduct a variety of safety-specific functions while also navigating a busy operating environment with unpredictable weather conditions, according to interviewees. For example, these workers:
· operate equipment and vehicles to transport baggage and cargo while preventing unintended contact with aircraft;
· conduct foreign object debris walks to ensure no debris is near the aircraft; and
· stow passenger mobility devices, such as wheelchairs, in cargo holds to ensure passengers with disabilities have access to their devices at their destination.[20]
Cleaning staff. Cleaning staff are responsible for maintaining certain elements of passenger safety in the terminal and cabin. Interviewees told us that specific safety functions include:
· wiping down wet floors in the terminals during weather events to prevent slips and falls; and
· identifying and removing public health hazards from aircraft cabins such as airsickness bags, blood, diapers, human waste, and syringes.
A few interviewees also described cleaners’ increased sanitation responsibilities during the coronavirus pandemic, such as wiping down each chair tray in an aircraft with disinfectant cleaner.
Concessions and catering workers. Concessions and catering workers’ safety responsibilities include preparing and maintaining food at the correct temperatures to prevent bacteria growth, according to a few interviewees.
Contracted security staff. Contracted security staff direct traffic to ensure the safety of pedestrians in terminal curbside areas, according to an airport representative.
Passenger attendants. Passenger attendants, also called wheelchair attendants, are responsible for assisting individuals with limited mobility in moving safely through airports. Specific safety functions can include the following, according to interviewees:
· verifying the integrity of the wheelchair before using it with a passenger, such as checking for faulty brakes or loose wheels;
· ensuring that nothing hits a passenger’s body while wheeling the passenger through the airport; and
· transferring passengers from a wheelchair to an airline seat.
Skycaps. Skycaps help ensure that luggage does not pose a hazard, according to a few interviewees.
Ticketing and customer service agents. Ticketing and customer service agents help ensure that luggage does not pose a hazard, according to a few interviewees. For example, one agent described the importance of safely checking firearms.
What security functions do airport service workers typically perform?
All airport service workers are trained to remain alert for and report anything suspicious, such as unattended items, according to most interviewees. Airport service workers are assigned airport access badges based on job function, allowing them access to appropriate areas, according to TSA. Some interviewees said that as part of the process of receiving an access badge, airport service workers undergo training, including about their obligations such as escorting individuals in secured areas and challenging individuals who do not appear to be appropriately badged for a given area.
What occupation-specific security functions do airport service workers typically perform?
Interviewees provided examples of occupation-specific security functions for all types of airport service workers except for skycaps. Functions include conducting security searches of aircraft, accounting for sharp objects in restaurants and food preparation facilities, and verifying that passengers have proper identification (see fig. 2).
Figure 2: Examples of Occupation-Specific Security Functions Selected Airport Service Workers Perform
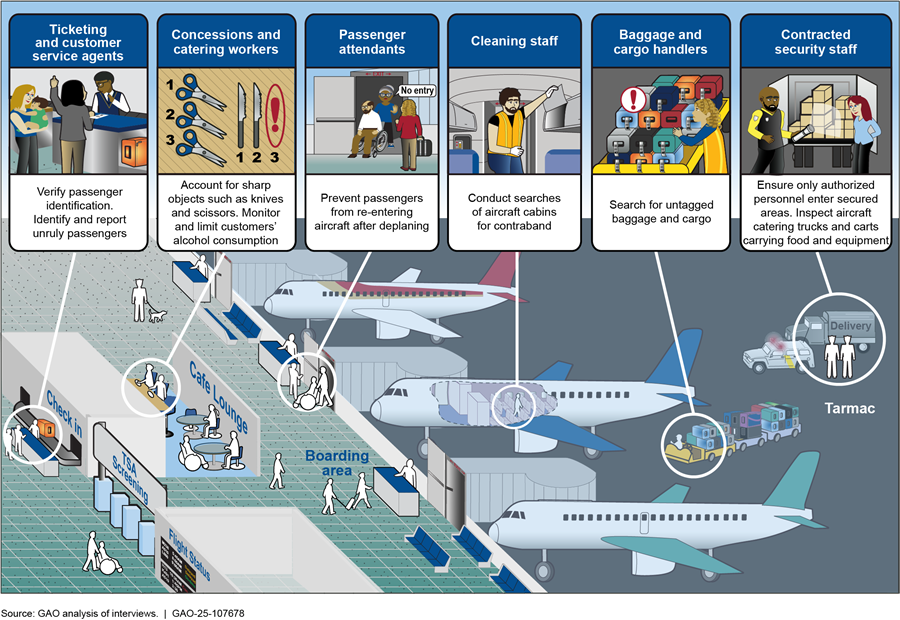
Baggage and cargo handlers. Baggage and cargo handlers are expected to remain alert for suspicious baggage and cargo that contain items that can harm passengers, according to some interviewees. One handler told us that he is expected to report suspicious bags and has reported bags sitting on aircraft jet bridges that do not have any tags.
Cleaning staff. Cabin cleaners conduct security sweeps for some flights, such as searching under seats and in seat pockets for contraband that can pose risks to travelers’ security, like box cutters, according to a few interviewees. Two aircraft cleaners said that cleaners conduct these searches under time constraints, and an airline representative stated that the airline relies on airport service workers to complete aircraft security searches in a timely manner to avoid departure delays.
Concessions and catering workers. Concessions and catering workers must account for sharp objects that are prohibited in boarding areas of airports and on aircraft but are necessary for food preparation, such as kitchen knives and scissors, according to a few interviewees. One union member who works in an aircraft catering facility described accounting for his sharp objects once per hour, with inspections taking place up to eight times per shift. TSA officials stated that when a sharp object goes missing, TSA, the airport security coordinator, and law enforcement are informed, after which interviews and investigations commence, and a response is determined based on the level of the incident.
Workers are also responsible for serving alcohol according to serving limits and monitoring the behavior of travelers who are consuming alcohol, according to a few interviewees. One bartender told us that if a customer is intoxicated, her airport’s protocol requires employees to notify managers to ensure that the customer is not served at other locations. In 2019, we reported that stakeholders from airlines, airports, airport law enforcement, and other industry associations cited alcohol consumption as a factor that may contribute to physical aggression by passengers.[21]
Contracted security staff. Contracted security staff ensure that only authorized personnel enter secured areas of the airport and inspect items that are loaded onto aircraft, according to interviewees.[22] For example, one airport representative stated that security staff monitor passenger exit lanes to ensure no unauthorized individuals access the boarding area. Representatives from one union also told us that contracted security staff inspect carts and trucks holding food and equipment that will enter the aircraft for contraband such as knives, guns, or drugs. For example, two catering security employees described a process of using flashlights and mirrors to examine food and equipment covered in plastic wrap on food carts and sealing the carts to indicate to flight attendants that security staff have inspected the items.
Passenger attendants. Passenger attendants—also called wheelchair attendants—help manage passenger behavior, according to interviewees. One interviewee told us that she calms down passengers who are irritable or stressed. Another interviewee described preventing a passenger from re-entering the aircraft to retrieve a forgotten item left onboard.
Ticketing and customer service agents. Ticketing and customer service agents ensure that passengers have proper identification and documentation, according to interviewees. Ticketing and customer service agents also help manage unruly passengers, according to airline and union representatives. One of these interviewees told us that ticketing and customer service agents monitor passengers for aggressive behavior that may pose a security threat to other passengers, such as verbal abuse. Reports of unruly passengers sharply increased in 2021 and have stayed higher than pre-pandemic numbers of such incidences over the past several years, according to FAA. One agent we interviewed described calling security to remove unruly passengers from flights and providing support to flight attendants who are dealing with unruly passengers.
Economic Contributions of Selected Airport Service Workers to Airports and Communities
How do airport service workers help generate revenue for airports?
Certain types of airport service workers can help generate revenue for airports through on-site businesses, according to interviewees. This type of revenue, called non-aeronautical revenue, is derived from business operations that employ service workers, such as concessions, car rentals, and parking.[23] A portion of the sales from these operations can be provided to the airport through negotiated revenue sharing agreements and can add substantially to the airport’s overall budget. Airport authorities can use non-aeronautical revenue for capital and operating costs of an airport, according to FAA officials.
FAA data on non-aeronautical revenue can provide insight into airport service workers’ contributions to airport revenue.[24] According to our analysis, when taken as a group, the nation’s busiest 138 commercial service airports reported that about 46 percent of their operating revenue in 2023 came from non-aeronautical revenue (see fig. 3). The percent of operating revenue represented by non-aeronautical revenue varies from airport to airport. For example, in 2023, non-aeronautical revenue represented about 19 percent of the total operating revenue at John F. Kennedy International Airport, compared to approximately 54 percent at Dallas Fort Worth International Airport.[25]
Figure 3: Combined Operating Revenue of Selected Commercial Service Airports in the United States in 2023
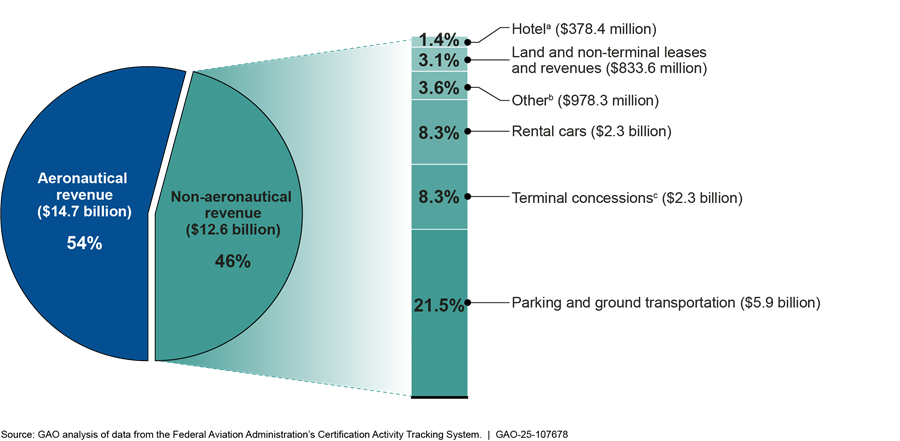
Notes: Selected airports include small, medium, and large hub airports and exclude non-hub airports.
Aeronautical revenue is derived from the operation and landing of aircraft, passengers, or freight. The data is as of December 5, 2024.
aThe Hotel category refers to revenues received from hotel operations that are owned by the airport, and/or fees for hotels operated by a third party for the airport under a management contract.
bItems in the Other category can include revenue generated from badging services, concessions operations and maintenance, permit fees, and other non-aeronautical operating revenues.
cThe Terminal concessions category combines (1) terminal food and beverages; (2) terminal retail stores and duty-free shops; and (3) terminal services and other.
How do airport service workers contribute to local economies?
Economic impact studies and our interviewees point to the contributions airport service workers make to their local economies, such as helping businesses generate revenue, enabling local business activities, and spending their income locally.
Helping businesses generate revenue. By doing their jobs, airport service workers help generate revenue for the businesses that employ them, but determining the amount of revenue associated solely with certain airport workers can be difficult or impossible, according to interviewees. For example, businesses may not calculate revenue at the occupational level. Nevertheless, of the 18 airport economic impact studies we reviewed, four studies reported the revenue of services that are closely associated with certain airport service workers. While it is not clear how much revenue can be directly and exclusively attributed to airport service workers, these examples can provide general insight into the economic contributions of this workforce. Specifically:
· At Phoenix Sky Harbor International Airport, passenger services such as retail, food services, skycap, baggage, security, on-site parking, and car rental services generated revenue of $1.5 billion in 2022. Approximately 7,000 workers provided these services.[26]
· At San Francisco International Airport, retail, concessions, and other services generated approximately $406 million in revenue in fiscal year 2020. Approximately 3,100 workers provided these services.[27] In addition, security firm services generated $97 million in revenue, and approximately 1,200 workers provided these services. The airport’s on-site hotel generated approximately $24 million in revenue. Approximately 180 workers provided these services.[28]
· At San Diego International Airport, restaurants and retail stores, car rental services, and on-site parking services generated approximately $456 million in revenue in 2017. Approximately 1,900 workers provided these services.[29]
· At Seattle-Tacoma International Airport, car rental companies generated approximately $319 million in revenue in 2017. Approximately 600 workers provided these services.[30]
Enabling local business activities. A few interviewees told us that customers having a pleasant experience at an airport—in part due to the quality of service of airport service workers—makes customers more inclined to use that airport, which, in turn, supports other businesses in the region. For example, one concessions worker speaking on behalf of her union said that the presence of bars and restaurants at the airport where she works makes customers more likely to use the airport as a gateway to cruise departures in the region. Similarly, an airport representative told us that air passengers support multiple industries in the region, including entertainment, financial services, special events, and retail services. He said that if an airport is not able to provide services at the optimal level, fewer travelers would choose to use the airport, thereby affecting these businesses.
Spending their income. As with other airport employees, airport service workers contribute to local economies through spending their salaries and wages in their communities. An economic impact study by San Diego County Regional Airport Authority described the effects of aviation employees’ spending—including airport service workers’ spending—as a “ripple effect” of expenditures throughout an economy.[31] For example, in fiscal year 2020, spending of income by airport workers and employees of suppliers to on-airport businesses at San Francisco International Airport supported nearly 15,000 additional jobs throughout the Bay Area, according to an economic impact study.[32] These workers primarily spent their wages on health care and social assistance (e.g., child day care services).
Economic Characteristics of Selected Airport Service Workers
How much are airport service workers paid?
The median wage for airport service workers who were paid hourly was $19.74 (in 2024 dollars), according to our analysis of the Current Population Survey from 2018 to 2024.[33] Airport service workers had lower hourly wages than air transportation workers overall and higher hourly wages than service workers in all industries (see fig. 4).
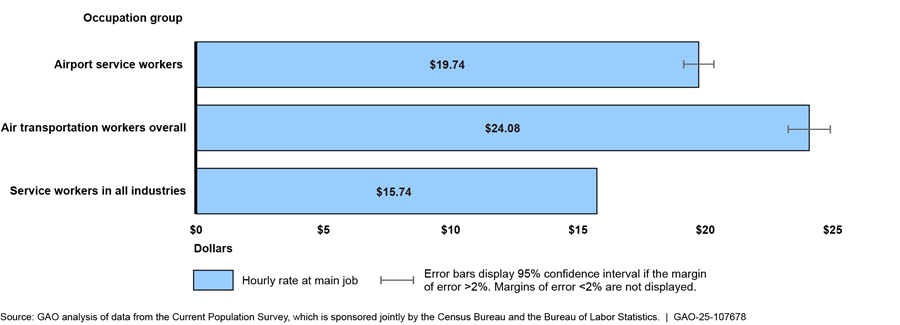
Note: For the purposes of this report, airport service workers are private sector employees in 36 selected occupations within the air transportation industry. Air transportation workers overall include all private sector employees in the air transportation industry, such as flight attendants and mechanics. Service workers in all industries are private sector employees—in all industries combined—working in the same 36 selected occupations as airport service workers. Our wage analysis only includes workers who reported that they were paid hourly.
Within the airport service worker group, there were variations in hourly wages between occupations. For example, the median hourly wage for ticketing and customer service agents was higher than the median wage of concessions and catering workers (see fig. 5). The sample sizes of passenger attendants and contracted security staff were too small to reliably estimate their median hourly wages. However, we have previously reported that the passenger attendant role is typically an entry-level, minimum-wage role, according to contractors.[34]
Figure 5: Median Wages for Airport Service Workers Paid Hourly, by Occupation, 2018-2024 (in 2024 dollars)
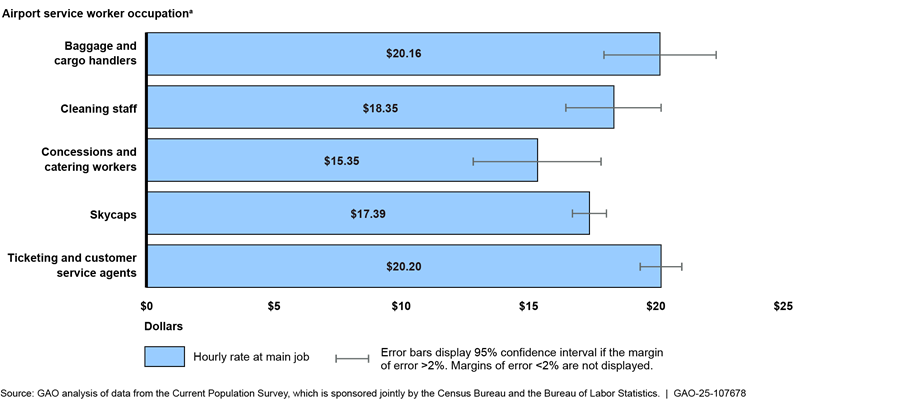
Note: Our wage analysis only includes workers who reported that they were paid hourly. The sample sizes of passenger attendants and contracted security staff were too small to support statistically reliable median hourly wages estimation for these occupations.
aFor the purposes of this report, the airport service workers occupation group includes private sector employees in the air transportation industry whose service occupation related to the transportation of passengers, cargo or mail; concessions; and airline catering, among others. We classified each of the 36 selected service occupations into one of seven occupational categories. We refer to these seven occupational categories as “airport service worker occupations.”
We found that two airport service worker occupations had statistically significant differences in estimated median hourly wages when compared to the same occupations in all industries. Cleaning staff in the airport service worker group earned an estimated median hourly wage of $18.35, compared to $15.91 for cleaning staff in all industries. In addition, ticketing and customer service agents in the airport service worker group earned an estimated median hourly wage of $20.20, compared to $17.75 for ticketing and customer service agents in all industries.
What percentage of airport service workers have health insurance coverage?
Approximately 92 percent of airport service workers had health insurance, based on our analysis of the 2018-2022 American Community Survey. About 73 percent of all airport service workers received their insurance through an employer or union, compared to about 51 percent of service workers in all industries (see fig. 6).[35]
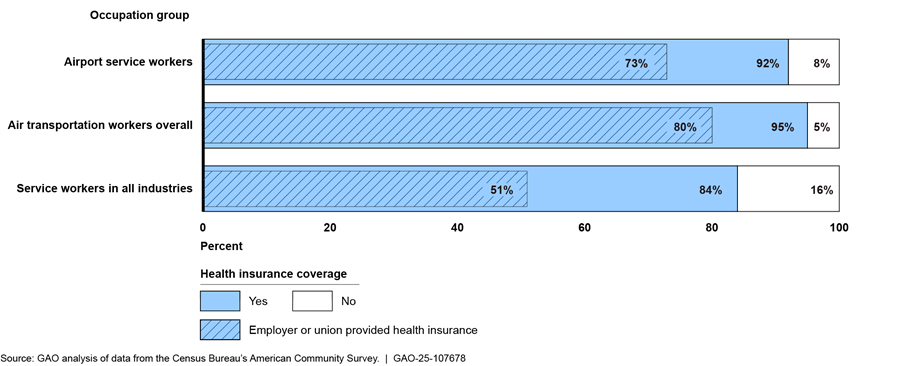
Notes: American Community Survey estimates are period estimates that describe the average characteristics of the population and their housing over the period of data collection. The 2018-2022 American Community Survey 5-year period is from January 1, 2018 through December 31, 2022.
For the purposes of this report, the airport service workers occupation group includes private sector employees in the air transportation industry whose service occupation related to the transportation of passengers, cargo or mail; concessions; and airline catering, among others. The air transportation workers overall group includes private sector employees in the air transportation industry. Airport service workers are included in this group. The service workers in all industries group includes private sector employees working in selected service occupations in any industry. Airport service workers are included in this group.
The second most common type of health insurance for airport service workers was Medicaid, with 10 percent of all airport service workers enrolled in this program. In contrast, about 21 percent of service workers in all industries and about 5 percent of air transportation workers overall reported receiving Medicaid insurance. Other sources of health care coverage include insurance purchased directly from an insurance company and coverage received from Medicare and the U.S. Department of Veterans Affairs, among other health insurance programs. Workers may have coverage from more than one type of insurance.[36] For example, a military veteran may have health insurance coverage through the U.S. Department of Veterans Affairs and through employer-provided insurance.
What percentage of airport service workers are at or below the federal poverty line?
Approximately 7 percent of airport service workers lived in households at or below the federal poverty line, roughly half the rate of poverty for service workers in all industries, according to our analysis of the 2018-2022 American Community Survey.[37] In addition, approximately 11 percent of airport service workers were at a household income level that may be eligible for certain forms of federal support, such as free or reduced school lunches (see fig. 7).
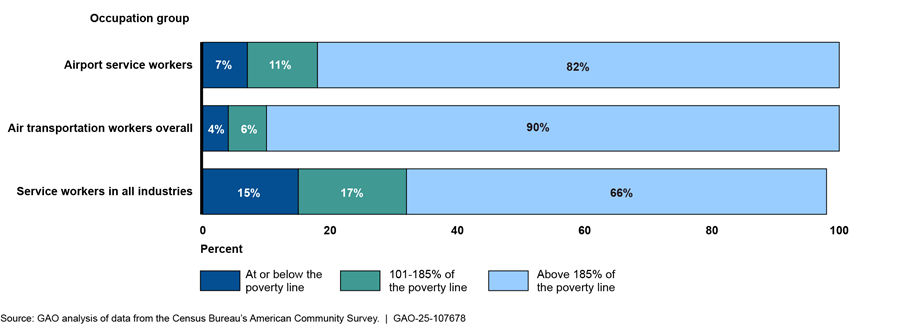
Notes: American Community Survey estimates are period estimates that describe the average characteristics of the population and their housing over the period of data collection. The 2018-2022 American Community Survey 5-year period is from January 1, 2018 through December 31, 2022.
For the purposes of this report, the airport service workers occupation group includes private sector employees in the air transportation industry whose service occupation related to the transportation of passengers, cargo or mail; concessions; and airline catering, among others. The air transportation workers overall group includes private sector employees in the air transportation industry. Airport service workers are included in this group. The service workers in all industries group includes private sector employees working in selected service occupations in any industry. Airport service workers are included in this group.
According to the U.S. Department of Agriculture income eligibility criteria, students in households at or below 130 percent of the poverty line are eligible to receive free lunches and between 130-185 percent of the federal poverty line are eligible to receive reduced-price lunches. Income-to-poverty ratio data were not available for individuals living in certain situations, such as group quarters. Due to rounding and missing data, percentages for service workers in all industries do not add up to 100 percent.
What percentage of airport service workers experience rent burden?
Of the airport service workers who rented their home when surveyed in 2018 through 2022, about 44 percent reported being moderately or severely rent burdened (spending 31-50 percent of household income on rent or more than 50 percent of household income on rent, respectively), according to our analysis.[38] Additionally, more airport service workers reported moderate or severe rent burden when compared to air transportation workers overall, but fewer reported severe rent burden when compared to service workers in all industries (see fig. 8).[39]
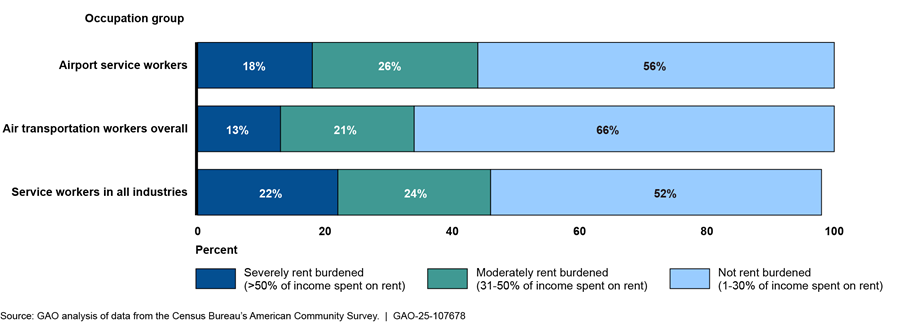
Notes: American Community Survey estimates are period estimates that describe the average characteristics of the population and their housing over the period of data collection. The 2018-2022 American Community Survey 5-year period is from January 1, 2018 through December 31, 2022.
For the purposes of this report, the airport service workers occupation group includes private sector employees in the air transportation industry whose service occupation related to the transportation of passengers, cargo or mail; concessions; and airline catering, among others. The air transportation workers overall group includes private sector employees in the air transportation industry. Airport service workers are included in this group. The service workers in all industries group includes private sector employees working in selected service occupations in any industry. Airport service workers are included in this group.
We used the U.S. Department of Housing and Urban Development’s definitions of cost burdens. In this figure, the margins of error for the airport service workers occupation group were 2.1 percent for severely rent burdened, 2.5 percent for moderately rent burdened, and 3.0 percent for not rent burdened. Due to rounding and missing data, percentages may not add up to exactly 100 percent.
What percentage of airport service workers live in households that receive Supplemental Nutrition Assistance Program benefits?
About 12 percent of airport service workers reported living in households that receive Supplemental Nutrition Assistance Program (SNAP) benefits, according to our analysis of the 2018-2022 American Community Survey.[40] Airport service workers were approximately twice as likely to live in households that received SNAP benefits than air transportation workers overall, but less likely than service workers in all industries (see fig. 9).
Figure 9: Households Receiving Supplemental Nutrition Assistance Program Benefits, by Occupation Group, 2018-2022
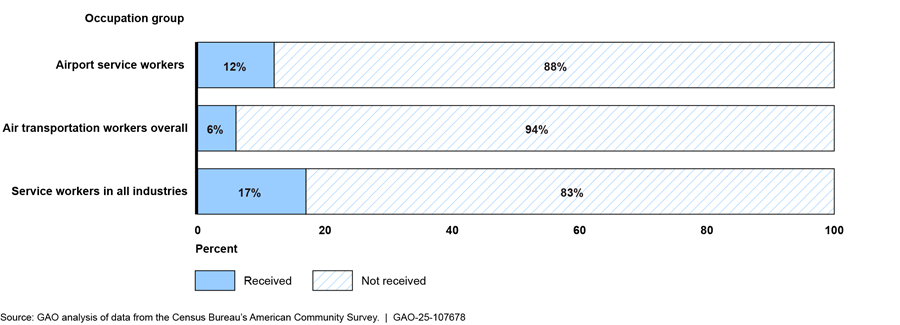
Notes: American Community Survey estimates are period estimates that describe the average characteristics of the population and their housing over the period of data collection. The 2018-2022 American Community Survey 5-year period is from January 1, 2018 through December 31, 2022.
For the purposes of this report, the airport service workers occupation group includes private sector employees in the air transportation industry whose service occupation related to the transportation of passengers, cargo or mail; concessions; and airline catering, among others. The air transportation workers overall group includes private sector employees in the air transportation industry. Airport service workers are included in this group. The service workers in all industries group includes private sector employees working in selected service occupations in any industry. Airport service workers are included in this group.
Demographic Characteristics of Selected Airport Service Workers
What education level have airport service workers completed?
The most common level of education completed by airport service workers was some college or a 2-year degree, according to our analysis of the 2018-2022 American Community Survey. Airport service workers on average obtained higher levels of education than service workers in all industries but lower levels of education than air transportation workers overall (see fig. 10).
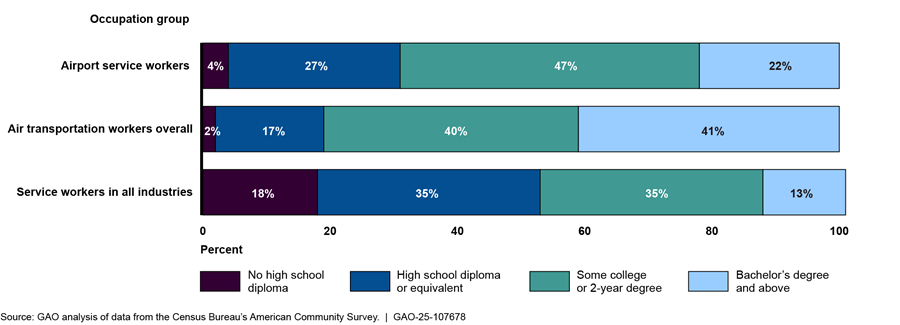
Notes: American Community Survey estimates are period estimates that describe the average characteristics of the population and their housing over the period of data collection. The 2018-2022 American Community Survey 5-year period is from January 1, 2018 through December 31, 2022.
For the purposes of this report, the airport service workers occupation group includes private sector employees in the air transportation industry whose service occupation related to the transportation of passengers, cargo or mail; concessions; and airline catering, among others. The air transportation workers overall group includes private sector employees in the air transportation industry. Airport service workers are included in this group. The service workers in all industries group includes private sector employees working in selected service occupations in any industry. Airport service workers are included in this group. Due to rounding, percentages may not add up to exactly 100 percent.
The level of education completed varied among airport service workers based on their occupations. For example, about 25 percent of ticketing and customer service agents had a bachelor’s degree or above, in contrast to about 10 percent of cleaning staff.[41] Appendix II provides more detailed information on educational attainment for all airport service worker occupation categories.
What is the age composition of airport service workers?
From 2018 through 2022, the average age of an airport service worker was 44 years, based on our analysis of the American Community Survey.[42] In general, we found a higher proportion of airport service workers in the age categories for 40 years and older than service workers in all industries, and a lower proportion than air transportation workers overall (see fig. 11).
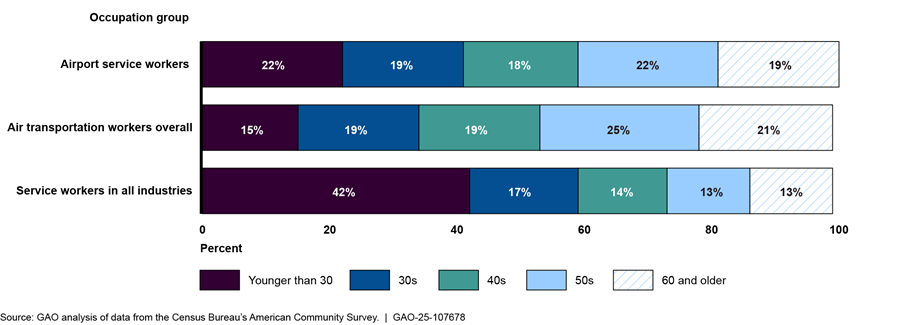
Notes: American Community Survey estimates are period estimates that describe the average characteristics of the population and their housing over the period of data collection. The 2018-2022 American Community Survey 5-year period is from January 1, 2018 through December 31, 2022.
For the purposes of this report, the airport service workers occupation group includes private sector employees in the air transportation industry whose service occupation related to the transportation of passengers, cargo or mail; concessions; and airline catering, among others. The air transportation workers overall group includes private sector employees in the air transportation industry. Airport service workers are included in this group. The service workers in all industries group includes private sector employees working in selected service occupations in any industry. Airport service workers are included in this group. Due to rounding, percentages may not add up to exactly 100 percent.
Differences in age were more pronounced across certain service worker occupations. For example, about 34 percent of baggage and cargo handlers were younger than 30, in contrast to about 12 percent of contracted security workers.[43] Appendix II provides more detailed information on age composition for all airport service worker occupation categories.
What is the racial and ethnic composition of airport service workers?
The most common racial group airport service workers reported was White (non-Hispanic), with an estimated 38 percent of workers in this group, based on our analysis of the 2018 through 2022 data from the American Community Survey. Approximately 21 percent of airport service workers of any race reported Hispanic or Latino ethnicity, compared to 15 percent of air transportation workers overall and 23 percent of service workers in all industries (see fig. 12).
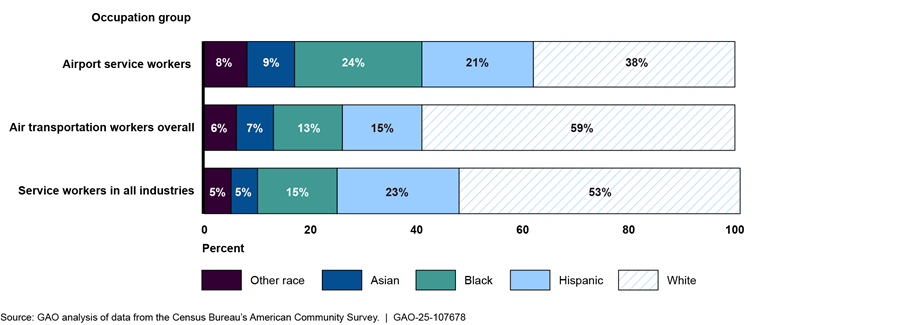
Notes: American Community Survey estimates are period estimates that describe the average characteristics of the population and their housing over the period of data collection. The 2018-2022 American Community Survey 5-year period is from January 1, 2018 through December 31, 2022.
For the purposes of this report, the airport service workers occupation group includes private sector employees in the air transportation industry whose service occupation related to the transportation of passengers, cargo or mail; concessions; and airline catering, among others. The air transportation workers overall group includes private sector employees in the air transportation industry. Airport service workers are included in this group. The service workers in all industries group includes private sector employees working in selected service occupations in any industry. Airport service workers are included in this group.
In this figure, the race categories include only non-Hispanic members of White, Black, Asian, and “Other” categories. The Hispanic category includes Hispanic/Latino origin for all races. People who reported races other than White, Black, or Asian, and those who reported more than one race, are included in the category reported as “Other.” Due to rounding, percentages may not add up to exactly 100 percent.
Within the airport service worker group, racial composition varied by occupation for all categories except “other,” which had no significant differences. For example, about 15 percent of concessions and catering workers were Asian, in contrast to the overall airport service worker average of approximately 9 percent.[44] Appendix II provides more detailed information on racial and ethnic composition for all airport service worker occupation categories.
What is the male/female composition of airport service workers?
About 51 percent of airport service workers are male and about 49 percent are female, according to our analysis of the 2018-2022 American Community Survey. Air transportation workers overall had a higher proportion of male workers while service workers in all industries had a higher proportion of female workers (see fig. 13).
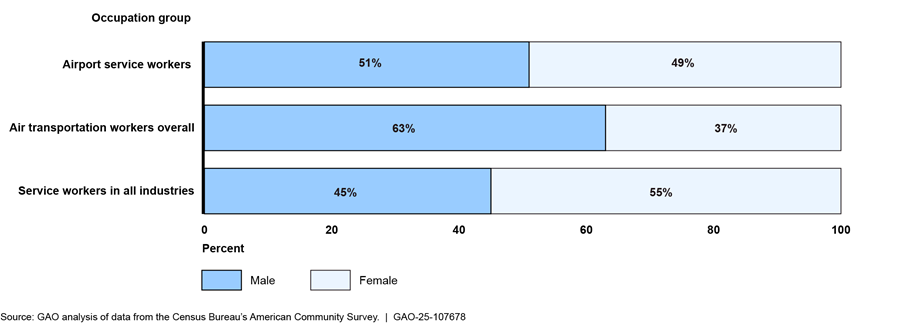
Notes: American Community Survey estimates are period estimates that describe the average characteristics of the population and their housing over the period of data collection. The 2018-2022 American Community Survey 5-year period is from January 1, 2018 through December 31, 2022.
For the purposes of this report, the airport service workers occupation group includes private sector employees in the air transportation industry whose service occupation related to the transportation of passengers, cargo or mail; concessions; and airline catering, among others. The air transportation workers overall group includes private sector employees in the air transportation industry. Airport service workers are included in this group. The service workers in all industries group includes private sector employees working in selected service occupations in any industry. Airport service workers are included in this group.
While airport service workers as a group were relatively evenly split between males and females, there were variances between some airport service worker occupations. For example, baggage and cargo handlers were disproportionately male (see fig. 14).
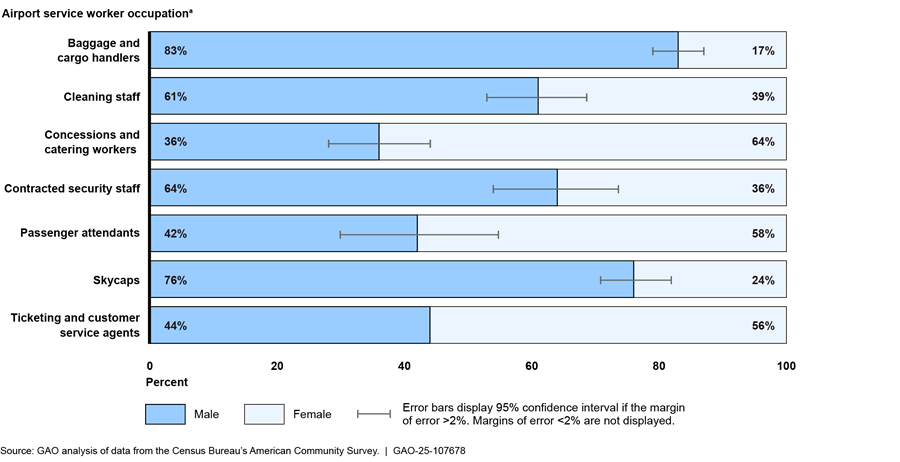
aAmerican Community Survey estimates are period estimates that describe the average characteristics of the population and their housing over the period of data collection. The 2018-2022 American Community Survey 5-year period is from January 1, 2018 through December 31, 2022. For the purposes of this report, the airport service workers occupation group includes private sector employees in the air transportation industry whose service occupation related to the transportation of passengers, cargo or mail; concessions; and airline catering, among others. We classified each of the 36 selected service occupations into one of seven occupational categories. We refer to these seven occupational categories as “airport service worker occupations.”
What is the citizenship status of airport service workers?
Approximately 92 percent of airport service workers reported as U.S. citizens in 2018 through 2022, according to our analysis of the American Community Survey.[45] The citizenship status varied slightly between occupation groups, but at least 90 percent of workers in all groups were U.S. citizens (see fig. 15).
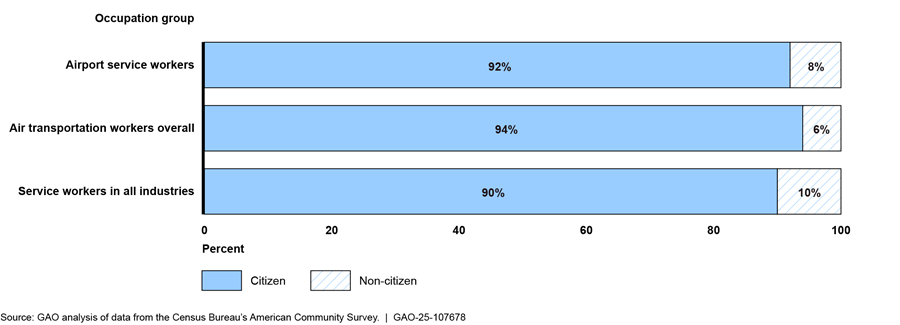
Notes: American Community Survey estimates are period estimates that describe the average characteristics of the population and their housing over the period of data collection. The 2018-2022 American Community Survey 5-year period is from January 1, 2018 through December 31, 2022.
For the purposes of this report, the airport service workers occupation group includes private sector employees in the air transportation industry whose service occupation related to the transportation of passengers, cargo or mail; concessions; and airline catering, among others. The air transportation workers overall group includes private sector employees in the air transportation industry. Airport service workers are included in this group. The service workers in all industries group includes private sector employees working in selected service occupations in any industry. Airport service workers are included in this group.
Within the airport service worker group, cleaning staff were less likely to be citizens than baggage and cargo handlers, ticketing and customer service agents, and skycaps. There were no statistically significant differences in citizenship rates among the other occupations. Appendix II provides more detailed information on citizenship status for all airport service worker occupation categories.
Agency Comments
We provided a copy of this report to DOT and DHS for review and comment. DOT and DHS did not have any comments on the report.
We are sending copies of this report to the appropriate congressional committees, the Secretary of Transportation, the Secretary of Homeland Security, and other interested parties. In addition, the report is available at no charge on the GAO website at https://www.gao.gov.
If you or your staff have any questions concerning this report, please contact me at GieseD@gao.gov. Contact points for our offices of Congressional Relations and Public Affairs may be found on the last page of this report. Key staff who made contributions to this report are listed in appendix III.

Danielle Giese
Acting Director, Physical Infrastructure
The objectives of this report were to provide information on selected airport service workers’ (1) safety and security roles, (2) economic contributions to airports and communities, (3) economic characteristics, and (4) demographic characteristics. We used the definition of “covered service worker” from the 2023 “Good Jobs for Good Airports Act” proposed in the 118th Congress.[46]
Interviews
For our first two objectives, we conducted semi-structured interviews with representatives from two federal agencies and 12 organizations to obtain views on the safety and security roles that airport service workers may perform as well as their contributions to the aviation economy. This included interviews with officials from the Federal Aviation Administration (FAA) and the Transportation Security Administration (TSA), and with representatives from selected airports, airlines, a ground handling contractor, and unions (certain union members were also included, as described below). We accepted written responses in place of or in addition to the interviews. We defined “safety” as preventing injury of the traveling public. We defined “security” as the secure transport of passengers or cargo (e.g., maintaining proper security protocols to prevent unauthorized access to secured areas).
Interviewee Selection
Airport representatives. We selected large hub airports that (1) had the most passenger boardings in 2022, which was the most recent finalized data at the time of our analysis, and (2) were within a 50-mile radius of a small or medium hub airport.[47] Using these criteria, we selected Dallas Fort Worth International Airport, John F. Kennedy International Airport, and Los Angeles International Airport. We also selected three medium and two small airports near these large airports, and three of the five agreed to participate: Dallas Love Field, Hollywood Burbank Airport, and Westchester County Airport. We interviewed or received written responses from airport officials, airport operators, or other relevant entities.
Airlines and contractors. We selected three airlines that (1) provided service to at least 75 percent of our selected airports and (2) were ranked by the Bureau of Transportation Statistics as among the top 10 airlines with regards to full-time equivalent employees and number of passengers in 2023. Two airlines agreed to participate and provided written responses. We also reviewed the International Air Transportation Association’s online directory of businesses that provide ground handling services. We selected two companies that (1) were based in the United States, (2) provided services related to our selected occupations, and (3) employed over 10,000 people. Additionally, we asked certain airport officials to identify key contractors that provide services at their facilities. Based on these steps, we contacted a total of four contractors and received a written response from one.
Unions. We searched publicly available bargaining contracts and press releases to identify a group of unions that collectively covered each of the selected service worker occupations. We sought to include unions that represented workers at the selected airlines or large airports when possible. We selected four unions that each represented at least one of the selected airport service worker occupations and represented workers from at least one selected airline or airport. Three of the unions agreed to participate. We also asked the selected unions to invite airport service worker members to the interviews to gain their perspectives. We interviewed 15 airport service workers during the union interviews.
Table 1 lists the entities that we interviewed or that provided written responses.
|
Entity name |
Interviewee type |
|
Alaska Airlines |
Airline |
|
American Airlines |
Airline |
|
Communication Workers of America (CWA) |
Union |
|
Dallas Love Field (DAL) |
Airport representative |
|
Dallas Fort Worth International Airport (DFW) |
Airport representative |
|
Hollywood Burbank Airport (BUR) |
Airport representative |
|
Los Angeles World Airports (LAWA) - Los Angeles International Airport (LAX) |
Airport representative |
|
Port Authority of New York and New Jersey - John F. Kennedy International Airport (JFK) |
Airport representative |
|
Service Employees International Union (SEIU) |
Union |
|
Unifi |
Contractor |
|
Unite Here |
Union |
|
Westchester County Airport (HPN) |
Airport representative |
Source: GAO. | GAO‑25‑107678
FAA’s Accident and Incident Data System
To address the first objective, we analyzed information from FAA’s Accident and Incident Data System. We analyzed all 173 event narratives on incidents involving commercial service aircraft from January 2022 to December 2024 to determine how many descriptions mentioned the involvement of airport service workers. To complete this analysis, the team used a double-blind coding approach in which two analysts separately analyzed the narrative of each event and determined if airport service workers were involved. In such cases, the analysts then further coded the events according to whether the airport service workers’ involvement was most accurately characterized as (1) contributing to the accident/incident, (2) mitigating the problem or a future problem in some way, (3) both, or (4) neither. To resolve any differences in coding outcomes, the two analysts discussed the rationale for their decisions and reached consensus.
We assessed the reliability of FAA’s Accident and Incident Data System by reviewing technical documentation and reviewing written explanations from FAA officials. We determined that the information from our selected time frame was sufficiently reliable for providing descriptive information and context for the types of actions that airport service workers take related to passenger safety. However, while the information in these event narratives is sufficiently accurate for our purposes, it may not be complete. There may be cases where airport service workers’ involvement was not described in the brief narratives.
FAA’s Certification Activity Tracking System
To address the second objective, we obtained and analyzed large, medium, and small hub airport revenue data from FAA’s Certification Activity Tracking System for fiscal year 2023 (the most complete, recent data at the time of our analysis). We combined the total revenue amounts for the large, medium, and small hub airports and combined three of the revenue categories for ease of reporting. The categories of “Terminal-food and beverage,” “Terminal-retail stores and duty free,” and “Terminal-service and other” were combined into the single category of “Terminal concessions.”
We assessed the reliability of FAA’s Certification Activity Tracking System by reviewing technical documentation, performing manual checks, and interviewing FAA officials. According to FAA officials, airports with 2,500 or more annual enplanements (i.e., passenger boardings) are required to provide an Operating and Financial Summary report to FAA. The number of airports that report each year varies due to variation in enplanements and timing differences for inputting data into the Certification Activity Tracking System, which is manually performed by FAA analysts. FAA officials told us that airports self-certify their data and are not required to file audited information. However, FAA stated that larger airports tend to supply audited information and that potential errors would not significantly change the data. We determined that the data were sufficiently reliable for our purpose of describing non-aeronautical revenue at the national scale.
Airport Economic Impact Studies
To address the second objective, we analyzed publicly available airport economic impact studies from large hub airports across the nation published before December 2024. We searched for economic impact studies for all 31 large hub airports in the United States and verified that we had obtained the most recent publicly available study. To focus on relatively recent economic information, we excluded studies that relied on data collected prior to 2017. We reviewed 18 economic impact studies, representing 26 of the 31 large hub airports, for which data were collected in 2017 or later. Of these, we describe the four studies that mention an airport service worker occupation or group of occupations in connection with an economic impact valuation. We reviewed these four studies and determined that the cited content was appropriate for our report’s descriptive purposes.
American Community Survey
To address objectives three and four, we analyzed 2018-2022 American Community Survey 5-year data. This was the most recent 5-year data available at the time of our analysis. The U.S. Census Bureau’s American Community Survey is a nationwide survey that collects and produces information on demographic, economic, housing, and social characteristics of the U.S. population. The survey is based on a probability sample of about 3.5 million housing units selected from county and county-equivalents in the United States. The 5-year data is a compilation of survey information from a specific time period. The 2018-2022 American Community Survey 5-year period is from January 1, 2018 through December 31, 2022. For the purposes of this report, we refer to this compilation of data as the 2018-2022 American Community Survey.
Occupation Group Development
To enable comparative analysis in objectives three and four within the American Community Survey, the team developed three occupation groups: airport service workers, air transportation workers overall, and service workers in all industries.
Airport Service Workers. To identify airport service workers, three analysts separately reviewed all standard occupation codes within the air transportation industry from the 2018-2022 American Community Survey, excluding the results from federal, state, and local government workers because our focus was on private sector workers. Using definitions provided by the Bureau of Labor Statistics, each analyst determined which occupation codes met the definition of “covered service worker” as described in the “Good Jobs for Good Airports Act” proposed in the 118th Congress. To resolve any differences in coding outcomes, the three analysts discussed the rationale for their decisions and the group reached consensus. For dataset consistency, we removed two occupations that were not present in the Current Population Survey data from 2018 through 2024.
After coding the occupations, we sorted the occupations into categories. To minimize the margin of error in our data analysis, we sought to create categories with at least 100 observations (i.e., survey respondents) in the 2018-2022 American Community Survey data. In some cases, we could not consolidate airport service worker occupations into a category that contained at least 100 respondents. As a result, these lower-frequency occupations are not reflected in our airport service worker population. In total, we developed seven categories of airport service worker occupations, comprising a total of 36 standard occupation codes. Some categories contained just one occupation, while others were groups of occupations (see table 2).
Table 2: Standard Occupation Classifications for Selected Airport Service Worker Groups and Occupations
|
Airport service worker occupation groups |
Occupation |
Standard occupation classification |
|
Baggage and cargo handlers |
||
|
|
Laborers and freight, stock, and material movers |
53-7062 |
|
Concessions and catering workers |
|
|
|
|
Bartenders |
35-3011 |
|
|
Cashiers |
41-2010 |
|
|
Chefs and head cooks |
35-1011 |
|
|
Cooks |
35-2010 |
|
|
Counter and rental clerks |
41-2021 |
|
|
Dining room and cafeteria attendants and bartender helpers |
35-9011 |
|
|
Fast food and counter workers |
35-3023 |
|
|
First-line supervisors of food preparation and serving workers |
35-1012 |
|
|
First-line supervisors of retail sales workers |
41-1011 |
|
|
Food preparation and serving related workers, all other |
35-9099 |
|
|
Food preparation workers |
35-2021 |
|
|
Food servers, non-restaurant |
35-3041 |
|
|
Gambling services workers |
39-3010 |
|
|
Hosts and hostesses, restaurant, lounge, and coffee shop |
35-9031 |
|
|
Hotel, motel, and resort desk clerks |
43-4081 |
|
|
Laundry and dry-cleaning workers |
51-6011 |
|
|
Parking attendants |
53-6021 |
|
|
Receptionists and information clerks |
43-4171 |
|
|
Retail salesperson |
41-2031 |
|
|
Shuttle drivers and chauffeurs |
53-3053 |
|
|
Travel agents |
41-3041 |
|
|
Ushers, lobby attendants, and ticket takers |
39-3031 |
|
|
Waiters and waitresses |
35-3031 |
|
Contracted security staff |
|
|
|
|
Crossing guards and flaggers |
33-9091 |
|
|
Police officers |
33-3050 |
|
|
Security guards and gambling surveillance officers |
33-9030 |
|
|
Transportation security screeners |
33-9093 |
|
Cleaning staff |
|
|
|
|
Cleaners of vehicles and equipment |
53-7061 |
|
|
First-line supervisors of housekeeping and janitorial workers |
37-1011 |
|
|
Janitors and building cleaners |
37-201X |
|
|
Maids and housekeeping cleaners |
37-2012 |
|
Passenger attendants |
|
|
|
|
Passenger attendants |
53-6061 |
|
Skycaps |
|
|
|
|
Baggage porters, bellhops, and concierges |
39-6010 |
|
Ticketing and customer service agents |
|
|
|
|
Customer service representatives |
43-4051 |
|
|
Reservation and transportation ticket agents and travel clerks |
43-4181 |
Source: GAO . | GAO‑25‑107678
Air Transportation Workers Overall. This group includes workers of all occupations classified as within the air transportation industry under the North American Industry Classification System, including those counted as airport service workers.
Service Workers in All Industries. This group includes workers in the same occupations as airport service workers, but without restrictions on the industry in which those jobs are performed. Workers in the air transportation industry (i.e., airport service workers) are included.
Variables Re-coded
We combined information for the following variables from the American Community Survey:
· Rent Burden. We used the Department of Housing and Urban Development’s definitions of cost burdens to help analyze the housing cost burden of renters. Using these definitions as guidelines, we developed the following categories for analysis: severely rent burdened (spending over 50 percent of household income on gross rent, which includes utilities), moderately rent burdened (spending between 31 and 50 percent of household income on gross rent), and not rent burdened (spending 30 percent or less of household income on gross rent).
· Income to Poverty Ratio. To identify households above the poverty line but still potentially facing economic stress, we used the Department of Agriculture’s income eligibility guidelines for reduced price meals at school, which applies to families within 185 percent of the federal poverty line. We used the following categories for analysis: at or below 100 percent of poverty level, within 101-185 percent of poverty level, and at or above 186 percent of poverty level.
· Education. We combined responses to create four categories capturing the highest level of education achieved: (1) respondents who did not earn a high school diploma or equivalent; (2) respondents who earned a high school diploma or an equivalent; (3) respondents with some college or a 2-year degree; and (4) respondents who had obtained a bachelor’s degree or a more advanced degree.
· Age. We created the following categories for analysis: Younger than 30, 30-39, 40-49, 50-59, and 60 and older.
· Race and Ethnicity. We created race categories that include only non-Hispanic members of White, Black, Asian, and “Other” categories. The Hispanic category includes Hispanics of all races. People who reported races other than White, Black, or Asian, and those who reported more than one race, are included in the category reported as “Other.”
Because the survey data are based on probability samples, estimates are calculated using the appropriate sample weights provided, which reflect the sample design. To account for the sample representation and design used in the American Community Survey, we used the person weight present in the American Community Survey data. We used the successive difference replication method to estimate the standard errors around any population estimate.
Current Population Survey
To address the third objective, we analyzed 2018 through 2024 basic monthly data from the Current Population Survey. These data were the most recent at the time of our analysis. The Current Population Survey is sponsored jointly by the U.S. Census Bureau and the U.S. Bureau of Labor Statistics. The Census Bureau surveys approximately 60,000 eligible households every month using a probability selected sample from all 50 states plus the District of Columbia. To be eligible to participate in the survey, individuals must be non-institutionalized, over age 15, and not in the Armed Forces. Generally, one person responds on behalf of all eligible members of the household. Households are in the survey for 4 consecutive months, are removed for 8 months, and returned to the sample for another 4 months. Thus, a household first sampled in January through April 2023 would be sampled again in January through April 2024. Earnings information is collected in the 4th and 8th month of the sample, so each respondent has two wage responses associated with their sample. As a result, some workers will have their wage counted twice while others will have their wages counted only once (for example, if the sample was cut off at the beginning or end of our time frame). All wages were adjusted to 2024 dollars.
As with the 2018-2022 American Community Survey, we analyzed information for airport service workers, air transportation workers overall, and service workers in all industries. To create these groups, we used the same standard occupation codes that we used for our analysis of the 2018-2022 American Community Survey.
Data Reliability and Limitations
To assess the reliability of these data for the purposes of understanding the economic and demographic characteristics of airport service workers, we reviewed technical documentation on the data elements as well as general design and methods. We also conducted electronic data testing, including calculating margins of error for all estimates. In general, we found the American Community Survey data to be sufficiently reliable for describing the selected demographic and economic characteristics of workers. However, we did not find it to be the most reliable source for estimating wages for the selected occupations. The American Community Survey asks respondents to describe the job they worked last week, or, if they did not work that week, to describe their most recent job from the past five years. The survey then asks respondents to report their annual income, which might not reflect wages earned at the reported job. Therefore, we used data from the Current Population Survey, which we found to be reliable for the purposes of estimating wages for the selected occupations. However, we were unable to report median wage information for two occupation groups (contracted security workers and passenger attendants) because the sample sizes were too small to develop statistically reliable estimates.
While surveys are subject to sampling and non-sampling errors, the Census Bureau takes steps to mitigate errors, such as following up on nonresponse. To further mitigate any errors, we calculated the margins of error for all estimates and displayed all margins of error greater than 2 percent. We also report median wages instead of the mean to mitigate the impacts of rounding in Current Population Survey wage data that started during 2023.
Federal Agency Policies and Guidance
We reviewed Department of Transportation (DOT) and Transportation Security Administration (TSA) policies and guidance related to safety and security. For example, we reviewed DOT’s rule related to ensuring safe accommodations for travelers with disabilities, and TSA policies related to sharp objects in certain areas of airport terminals, among other information. To provide context, we also reviewed relevant statutes and regulations that set forth the roles of federal agencies in safety and security at airports, such as those that delineate FAA’s role in overseeing airports and airline safety and TSA’s role in enforcing security requirements for airport operators.
We conducted this performance audit from July 2024 to August 2025 in accordance with generally accepted government auditing standards. Those standards require that we plan and perform the audit work to obtain sufficient, appropriate evidence to provide a reasonable basis for our findings and conclusions based on our audit objectives. We believe that the evidence obtained provides a reasonable basis for our findings and conclusions based on our audit objectives.
For this report, we analyzed 2018-2022 American Community Survey 5-year data. The U.S. Census Bureau’s American Community Survey is a nationwide survey that collects and produces information on demographic, economic, housing, and social characteristics of the U.S. population. Figures 16 through 19 present demographic characteristics of airport service workers by occupation in the following areas: educational level, age composition, racial and ethnic composition, and U.S. citizenship status.
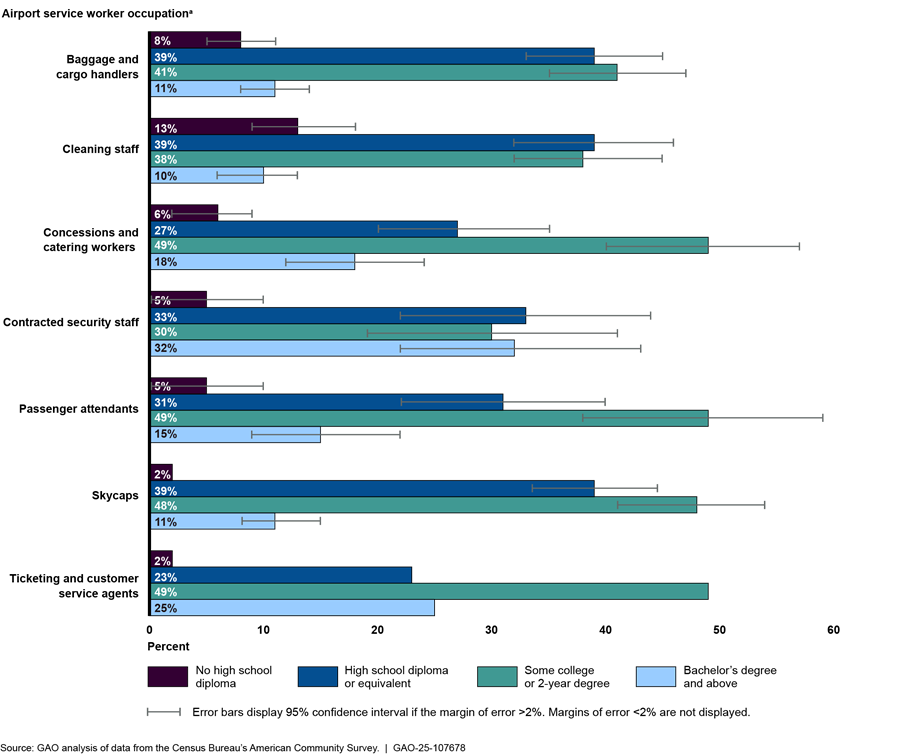
aAmerican Community Survey estimates are period estimates that describe the average characteristics of the population and their housing over the period of data collection. The 2018-2022 American Community Survey 5-year period is from January 1, 2018 through December 31, 2022. For the purposes of this report, the airport service workers occupation group includes private sector employees in the air transportation industry whose service occupation related to the transportation of passengers, cargo or mail; concessions; and airline catering, among others. We classified each of the 36 selected service occupations into one of seven occupational categories. We refer to these seven occupational categories as “airport service worker occupations.”
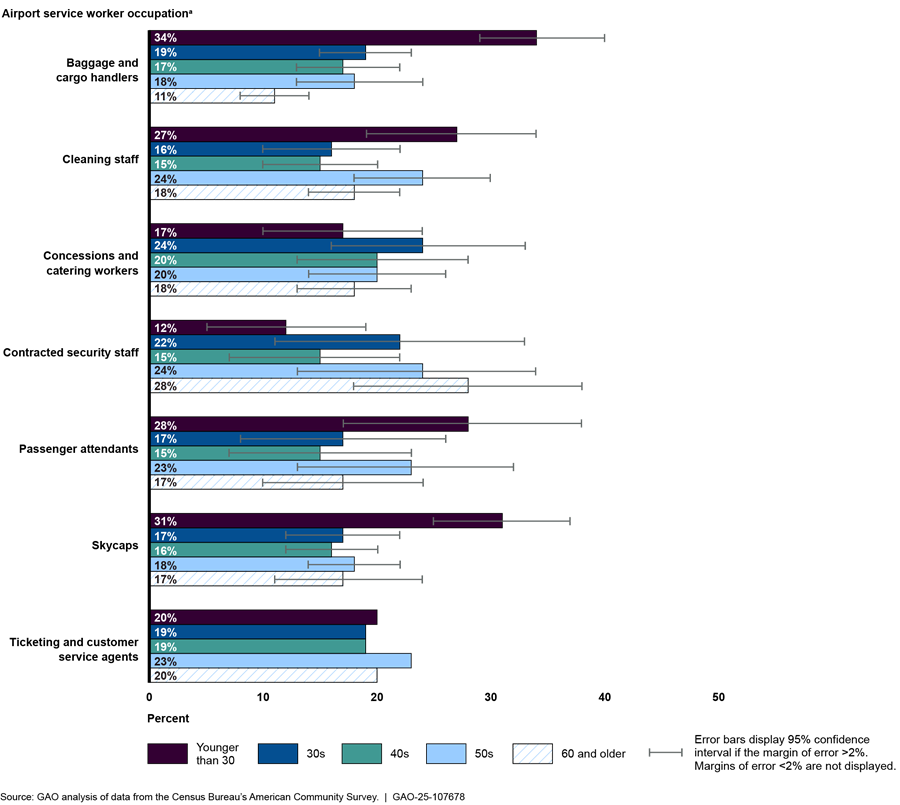
aAmerican Community Survey estimates are period estimates that describe the average characteristics of the population and their housing over the period of data collection. The 2018-2022 American Community Survey 5-year period is from January 1, 2018 through December 31, 2022. For the purposes of this report, the airport service workers occupation group includes private sector employees in the air transportation industry whose service occupation related to the transportation of passengers, cargo or mail; concessions; and airline catering, among others. We classified each of the 36 selected service occupations into one of seven occupational categories. We refer to these seven occupational categories as “airport service worker occupations.”
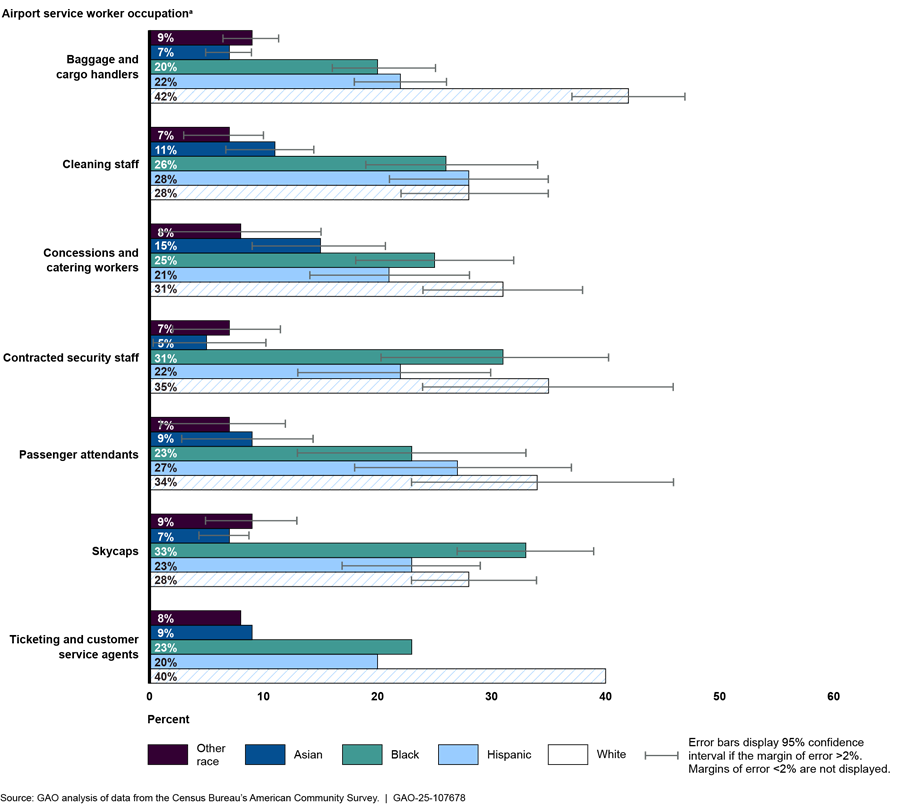
aAmerican Community Survey estimates are period estimates that describe the average characteristics of the population and their housing over the period of data collection. The 2018-2022 American Community Survey 5-year period is from January 1, 2018 through December 31, 2022. For the purposes of this report, the airport service workers occupation group includes private sector employees in the air transportation industry whose service occupation related to the transportation of passengers, cargo or mail; concessions; and airline catering, among others. We classified each of the 36 selected service occupations into one of seven occupational categories. We refer to these seven occupational categories as “airport service worker occupations.”
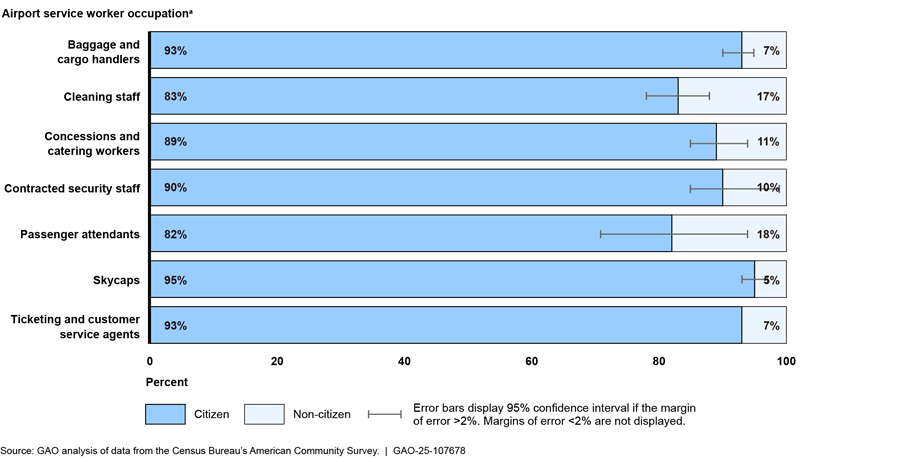
aAmerican Community Survey estimates are period estimates that describe the average characteristics of the population and their housing over the period of data collection. The 2018-2022 American Community Survey 5-year period is from January 1, 2018 through December 31, 2022. For the purposes of this report, the airport service workers occupation group includes private sector employees in the air transportation industry whose service occupation related to the transportation of passengers, cargo or mail; concessions; and airline catering, among others. We classified each of the 36 selected service occupations into one of seven occupational categories. We refer to these seven occupational categories as “airport service worker occupations.”
GAO Contact
Danielle T. Giese, GieseD@gao.gov
Staff Acknowledgments
In addition to the contact named above, Heather Halliwell (Assistant Director), Alison Snyder (Analyst-in-Charge), Melissa Bodeau, Laura Bonomini, Annie Chou, Victor Elliott, Melissa Lefkowitz, Ying Long, Lydie Loth, Rebecca Morrow, and Malika Williams made key contributions to this report.
The Government Accountability Office, the audit, evaluation, and investigative arm of Congress, exists to support Congress in meeting its constitutional responsibilities and to help improve the performance and accountability of the federal government for the American people. GAO examines the use of public funds; evaluates federal programs and policies; and provides analyses, recommendations, and other assistance to help Congress make informed oversight, policy, and funding decisions. GAO’s commitment to good government is reflected in its core values of accountability, integrity, and reliability.
Obtaining Copies of GAO Reports and Testimony
The fastest and easiest way to obtain copies of GAO documents at no cost is through our website. Each weekday afternoon, GAO posts on its website newly released reports, testimony, and correspondence. You can also subscribe to GAO’s email updates to receive notification of newly posted products.
Order by Phone
The price of each GAO publication reflects GAO’s actual cost of production and distribution and depends on the number of pages in the publication and whether the publication is printed in color or black and white. Pricing and ordering information is posted on GAO’s website, https://www.gao.gov/ordering.htm.
Place orders by calling (202) 512-6000, toll free (866) 801-7077,
or
TDD (202) 512-2537.
Orders may be paid for using American Express, Discover Card, MasterCard, Visa, check, or money order. Call for additional information.
Connect with GAO
Connect with GAO on X,
LinkedIn, Instagram, and YouTube.
Subscribe to our Email Updates. Listen to our Podcasts.
Visit GAO on the web at https://www.gao.gov.
To Report Fraud, Waste, and Abuse in Federal Programs
Contact FraudNet:
Website: https://www.gao.gov/about/what‑gao‑does/fraudnet
Automated answering system: (800) 424-5454
Media Relations
Sarah Kaczmarek, Managing Director, Media@gao.gov
Congressional Relations
A. Nicole Clowers, Managing Director, CongRel@gao.gov
General Inquiries
[1]In addition, according to the National Transportation Safety Board’s preliminary report, passengers who exited onto the wing used a vehicle that service workers use to load and unload baggage to reach the ground.
[2]According to a criminal complaint, in November 2024, an unticketed woman boarded a flight and flight attendants did not discover her until the plane was airborne. In addition, according to airline press statements, between December 2024 and January 2025, three bodies were found in the wheel wells of two aircraft.
[3]For example, see Reich, Hall, and Jacobs, “Living Wages and Economic Performance: The San Francisco Airport Model,” Institute of Industrial Relations (March 2003) and Port of Seattle Memorandum, “Minimum Requirements for Aeronautical Workers with Safety and Security Responsibilities at the Seattle-Tacoma International Airport,” (June 26, 2014).
[4]FAA Reauthorization Act of 2024, Pub. L. No. 118-63, § 438, 138 Stat. 1025, 1178-79 (2024).
[5]In 2023, the “Good Jobs for Good Airports Act” defined covered service workers as employees furnishing services on the property or premises of large, medium, and small hub airports. Some services included in this definition were assistance to passengers, security, ticketing and check-in functions, ground handling of the aircraft, aircraft cleaning, terminal cleaning, transportation within the airport property, ramp agent functions, hotel services, concessions services, and airline catering services. The bill explicitly excluded individuals furnishing various services such as fueling, de-icing, and other mechanic-related services. The bill also excluded, for example, state or municipal employees. S. 753, 118th Cong. § 3 (2023). This bill was not enacted in the 118th Congress and did not become law. For our definition, we generally sought to reflect these parameters. We also excluded any federal government workers. For more information about the occupations and our selection process, see appendix I.
[6]For the purposes of this report, we defined “safety” functions as those upholding the health and welfare of the traveling public, such as efforts to avoid accidental injury. It does not refer to the safety of airport service workers. We defined “security” functions as those promoting the secure transport of passengers and cargo, such as the prevention of unauthorized entry into secured areas.
[7]We selected three large hub airports based on passenger boardings in 2022 and the presence of medium or small hubs within a 50-mile radius. These airports were John F. Kennedy International Airport, the Dallas Fort Worth International Airport, and the Los Angeles International Airport. We also selected one small hub (Westchester County Airport) and two medium hub airports (Dallas Love Field and Hollywood Burbank Airport) that were located within 50 miles of the selected large airports. We interviewed or received written responses from airport officials, operators, or other relevant authorities. We selected airlines based on annual passengers served and presence at our selected airports, and the contractor based in part on workforce size. We selected unions that represented one or more of the selected airport service worker occupations. We also considered whether the unions represented airport service workers at the selected airlines.
[8]We identified economic impact studies for all 31 large hub airports in the U.S. and verified that we had located the most recent publicly available study. Some studies covered more than one airport. To focus on relatively recent economic information, we eliminated studies that relied on data collected prior to 2017. We reviewed 18 economic impact studies, representing 26 of the 31 large hub airports, for which data were collected in 2017 or later. Of these, we describe the four studies that mention an airport service worker occupation or group of occupations in connection with an economic impact valuation.
[9]The sample sizes of passenger attendants and contracted security staff were too small to reasonably estimate the median hourly wages for these occupations.
[10]Because the American Community Survey is a sample survey, the results are estimates. All the information that we discuss in this report is statistically significant at the 95 percent confidence level with margins of error of less than 2 percent, unless otherwise noted.
[11]Security officers employed by a government entity, such as TSA employees or city police officers, are exempt from our definition of airport service workers. Our definition includes only private sector workers, such as employees of contracted security firms.
[12]FAA regulations at 14 C.F.R. Part 139 govern the certification and operation of airports that serve scheduled passenger-carrying operations of an air carrier operating aircraft with more than 9 seats and unscheduled passenger-carrying operations of an air carrier operating aircraft with at least 31 passenger seats. FAA regulations at 14 C.F.R. Parts 121 and 135 set forth operating requirements for air carriers that provide commercial air service.
[13]Ensuring Safe Accommodations for Air Travelers With Disabilities Using Wheelchairs, 89 Fed. Reg. 102398, 102403-04 (Dec. 17, 2024). The final rule became effective January 16, 2025, and subsequently, DOT announced that enforcement actions would not take place before August 1, 2025. On February 18, 2025, Airlines for America and several airlines filed a petition for review of the final rule in the Fifth Circuit Court of Appeals. Airlines for Am. v. Dep’t. Transp., No. 25-60071 (5th Circ. filed Feb. 18, 2025).
[14]49 U.S.C. §§ 40113, 46101(a)(2).
[15]When describing the views of the 12 organizations we interviewed, we refer to comments from two or three organizations as “a few interviewees,” four to six organizations as “some interviewees,” and seven to 11 organizations as “most interviewees.” Not all organizations had comments on each topic we discussed. Airport service workers who work in the terminal area include cleaning staff, concessions workers, contracted security staff, passenger attendants, skycaps, and ticketing and customer service agents, according to interviewees.
[16]Airport service workers who work on the ramp include baggage and cargo handlers, catering workers, cleaning staff, and contracted security staff.
[17]FAA’s Accident and Incident Data System is the official system of record for accidents and incidents that occur in the National Airspace System. An accident is an occurrence between the time any person boards an aircraft with the intention of flight and until the persons have disembarked in which (1) any person suffers death or serious injury or (2) the aircraft receives substantial damage, such as damage or failure that adversely affects the structural strength, performance, or flight characteristics of the aircraft. 49 C.F.R. § 830.2. An aircraft incident is an occurrence that does not meet the personal injury or aircraft damage thresholds in the definition of an accident that affects or could affect the safety of operations. 49 C.F.R. § 830.2. For example, a collision between aircraft and birds while on approach or departure from airports constitutes an incident, according to the FAA.
[18]GAO, Aviation Safety: Opportunities Exist for FAA to Improve Airport Terminal Area Safety Efforts, GAO‑19‑639 (Washington, D.C.: Aug. 30, 2019).
[19]FAA accident/incident reports describe what occurred and the investigator’s opinion on the operational factors that led to the accident/incident. We reviewed 173 accident/incident event narratives and used our professional judgment to determine whether airport service workers contributed negatively to the events. We counted two narratives separately that described the same event and did not mention airport service workers.
[20]In December 2024, DOT published a rule requiring airlines to repair or replace wheelchairs or scooters that airlines mishandle and to provide and pay for loaner wheelchairs after airline mishandlings. If a passenger with a disability must wait for a return, repair, or replacement of a mishandled wheelchair or scooter, airlines must consult with the passenger to ensure that the loaner device fits the passenger’s safety-related needs. The final rule defines “safe” as assistance provided to individuals with disabilities that does not put them at heightened risk of bodily injury, which may include loss or damage to wheelchairs and other assistive devices that results in bodily injury. Ensuring Safe Accommodations for Air Travelers With Disabilities Using Wheelchairs, 89 Fed. Reg. 102398,102401-04 (Dec. 17, 2024). The final rule became effective January 16, 2025, and subsequently, DOT announced that enforcement actions would not take place before August 1, 2025. On February 18, 2025, Airlines for America and several airlines filed a petition for review of the final rule in the Fifth Circuit Court of Appeals. Airlines for Am. v. Dep’t. Transp., No. 25-60071 (5th Circ. filed Feb. 18, 2025).
[21]GAO, Commercial Aviation: Information on Passenger Assaults against Airline Customer Service Agents at Airports, GAO‑19‑683 (Washington, D.C.: Sep. 17, 2019).
[22]In general, security at airports can be provided by a variety of workers such as contracted guards, TSA, and police officers. TSA and police officers are government employees and are therefore excluded from the scope of our report. “Contracted security staff” refers to security workers who are private sector employees.
[23]Our analysis of 36 occupations that represent the airport service workforce include food servers, desk clerks for on-site hotels, parking attendants, rental clerks, and retail salespeople. To view a list of the selected occupations, see Table 2 in appendix I.
[24]This data, from FAA’s Certification Activity Tracking System, captures airport financial information, such as revenues generated through business operations. It is not possible to determine the revenue associated solely with airport service workers’ labor from this information.
[25]Airports can update previous revenue submissions. The data in our analysis was current as of December 9, 2024.
[26]Seidman Research Institute, W.P Carey School of Business, Arizona State University, Economic Impact of the Phoenix Airport System (Tempe, AZ: June 2024).
[27]The study refers to workers by headcount, which includes part-time and full-time workers, not full-time equivalents.
[28]EBP, Economic Impact Study of San Francisco International Airport: FY 2020 & FY 2021 Impact and Initial Recovery from COVID-19 (Boston, MA: n.d.).
[29]CDM Smith, San Diego International Airport Economic Impact Study (Cincinnati, OH: June 2018).
[30]Community Attributes Inc., Sea-Tac International Airport Economic Impacts (Seattle, WA: August 2018).
[31]CDM Smith, San Diego International Airport.
[32]The study defines labor income as the sum of salaries, wages, proprietors’ income, and employer-paid benefits paid for labor. In fiscal year 2020, the workers described are on-airport workers and include airport service workers as well as workers in other occupations, such as construction workers and federal employees. EBP, Economic Impact Study of San Francisco International Airport.
[33]The Current Population Survey collects earnings information in the period of time respondents prefer, including hourly, weekly, biweekly, monthly, and annually. At a 95 percent confidence interval, between 74 and 81 percent of airport service workers reported that they were paid hourly. Similarly, between 80 and 81 percent of service workers in all industries reported that they were paid an hourly rate. Between 54 and 58 percent of air transportation workers reported that they were paid an hourly rate. Our wage analysis reflects the wages of hourly workers only.
[34]GAO, Passengers with Disabilities: Airport Accessibility Barriers and Practices and DOT’s Oversight of Airlines’ Disability-Related Training, GAO‑21‑354 (Washington, D.C.: Apr. 14, 2021).
[35]Because the survey does not identify health insurance account holders, this coverage could have been provided by the employer or union of another individual, such as the airport service worker’s spouse.
[36]Because the survey allows respondents to check the box for all of their insurance coverage sources, multiple sources cannot be graphically displayed together due to overlap.
[37]The U.S. Census Bureau computes respondents’ ratio of income to poverty by comparing a family’s total income with a poverty threshold based on family size and age of family members. For example, a family’s total income of $40,000 would be divided by a threshold to determine a ratio that indicates whether the family is in poverty. A ratio of 0.98 would mean that the family’s total income is 98 percent of the poverty threshold, thereby classifying them as being “in poverty.”
[38]We used the U.S. Department of Housing and Urban Development’s definitions of cost burdens to analyze the housing cost burden of renters. Using these definitions as guidelines, we developed the following categories for analysis: severely rent burdened (spending over 50 percent of household income on gross rent, which includes utilities), moderately rent burdened (spending between 31 and 50 percent of household income on gross rent), and not rent burdened (spending 30 percent or less of household income on gross rent). Using a 95 percent confidence interval, the margin of error for moderate rent burden of airport service workers was 2.5 percent and for severe rent burden it was 2.1 percent.
[39]The difference in moderate rent burden between airport service workers and service workers in all industries was not statistically significant at the 95 percent confidence level.
[40]The Supplemental Nutrition Assistance Program, formerly known as “food stamps,” provides food benefits to low-income families.
[41]Using a 95 percent confidence interval, the margin of error for cleaning staff with a bachelor’s degree or above was 3.8 percent.
[42]Both the mean and median age for airport service workers was 44 years old. Using a 95 percent confidence interval, the margin of error for the median was 2.2 percent.
[43]Using a 95 percent confidence interval, the margin of error for baggage and cargo handlers younger than 30 was 5.6 percent and was 7.4 percent for contracted security staff younger than 30.
[44]Using a 95 percent confidence interval, the margin of error for concessions and catering airport service workers who are Asian was 5.8 percent.
[45]The American Community Survey asks whether respondents are citizens by birth in the United States, Puerto Rico, Guam, the U.S. Virgin Islands, or Northern Marianas, a citizen through birth abroad to a U.S. citizen parent or parents, or a U.S. citizen by naturalization.
[46]The “Good Jobs for Good Airports Act” (S. 753, 118th Cong. (2023)) defined covered service workers as employees furnishing services on the property or premises of large, medium, and small hub airports. Some services included in this definition were assistance to passengers, security, ticketing and check-in functions, ground-handling of the aircraft, aircraft cleaning, terminal cleaning, transportation within the airport property, ramp agent functions, hotel services, concessions services, and airline catering services. The bill explicitly excluded individuals furnishing various services such as fueling, de-icing, and other mechanic-related services. The bill also excluded, for example, state or municipal employees, those exempted under section 13(a)(1) of the Fair Labor Standards Act of 1938 employed in an executive capacity with, among other things, primarily management functions, and outside salesmen. In general, an “outside salesman” is defined to mean an employee whose primary duty is making certain types of sales or obtaining orders or contracts for services or for the use of facilities, who is customarily and regularly engaged away from the employer’s place or places of business in performing such primary duty. See e.g., 29 U.S.C. § 213(a)(1); 29 C.F.R. §§ 541.500-03. We did not include occupations and classes of workers excluded by statute or regulation in our analysis. The “Good Jobs for Good Airports Act” was not enacted in the 118th Congress and did not become law.
[47]FAA categorizes commercial service airports based on the percentage of annual passenger boardings. Airports that have 1 percent or more of the annual national passenger boardings are designated “large hubs.” Airports that have between 0.25 and 1 percent of the annual national passenger boardings are designated “medium hubs,” while airports that have between 0.05 and 0.25 percent of the annual national passenger boardings are considered “small hubs.”