FEDERAL WORKFORCE
Current and Potential Alternatives for Locality Pay Methodology
Report to the Committee on Armed Services, House of Representatives
United States Government Accountability Office
For more information, contact Dawn G. Locke at locked@gao.gov.
Highlights of GAO-25-107788, a report to
the Committee on Armed Services, House of Representatives
Current and Potential Alternatives for Locality Pay Methodology
Why GAO Did This Study
FEPCA created annual locality-based pay adjustments for GS employees to reduce reported pay gaps between federal and nonfederal employees in each locality area to no more than 5 percent.
However, the goal to reduce the pay gap has not been met since 1994—the first year of FEPCA’s implementation. This is due to actions taken by the President, Congress, or both since that time. Over time, the Pay Agent and the council have raised budgetary and methodological concerns with how the pay gap is calculated.
House Report 118-529, accompanying the National Defense Authorization Act for Fiscal Year 2025, includes a provision for GAO to review locality pay determinations and potential alternatives for the locality pay formula under Title 5, which refers to the pay comparability system established by FEPCA.
This report describes (1) the number of federal civilian employees who received locality pay, by agency and pay plan, in fiscal years 2019 through 2023; and (2) the methodology used to calculate locality pay, alternative methods identified by federal agencies and advisory councils, and costs of the alternative methods.
GAO analyzed data from OPM on federal employees. GAO also reviewed relevant federal laws, council memorandums, Pay Agent reports, and OPM and BLS documents; and conducted a literature search to identify alternatives. GAO also interviewed OPM and BLS officials, OMB staff, and council members.
What GAO Found
The Federal Employees Pay Comparability Act of 1990 (FEPCA) authorized locality pay for General Schedule (GS) employees to address agencies’ challenges with recruitment and retention of skilled employees in areas where nonfederal wages exceeded federal wages. Under FEPCA, the President’s Pay Agent and Federal Salary Council recommend locality pay adjustments to help reduce pay gaps. The Pay Agent is comprised of the Secretary of Labor and the Directors of the Office of Personnel Management (OPM) and the Office of Management and Budget (OMB). The council is an advisory group—appointed by the President—comprised of three experts in pay and labor relations and six representatives of employee organizations.
Of the 2.3 million federal civilian employees in the data analyzed for fiscal year 2023, approximately 1.4 million, or 60 percent, received locality pay. These employees consisted primarily of GS employees, along with certain non-GS employees, such as administrative law judges, authorized by the President to receive locality pay under Title 5.
The council and Pay Agent use data collected by the Bureau of Labor Statistics (BLS) and OPM to determine the gap between federal and nonfederal pay. Since 2019, the council and Pay Agent have considered, but not agreed upon, ways to enhance the credibility of the methodology used to calculate locality pay. For example:
· using indicators—such as attrition data—to verify pay gap calculations,
· including nonsalary benefits when comparing federal to nonfederal pay, and
· calculating separate rates by major occupational group.
All proposed alternatives would have additional costs, but these costs are largely unknown, according to the council and BLS officials.
This is a work of the U.S. government and is not subject to copyright protection in the United States. The published product may be reproduced and distributed in its entirety without further permission from GAO. However, because this work may contain copyrighted images or other material, permission from the copyright holder may be necessary if you wish to reproduce this material separately.
|
Abbreviations |
|
|
|
|
|
BLS |
Bureau of Labor Statistics |
|
council |
Federal Salary Council |
|
EHRI |
Enterprise Human Resource Integration-Statistical Data Mart |
|
FEPCA |
Federal Employees Pay Comparability Act of 1990 |
|
NCS |
National Compensation Survey |
|
OEWS |
Occupational Employment and Wage Statistics |
|
OMB |
Office of Management and Budget |
|
OPM |
Office of Personnel Management |
|
Pay Agent |
President’s Pay Agent |
April 30, 2025
The Honorable Mike Rogers
Chairman
The Honorable Adam Smith
Ranking Member
Committee on Armed Services
House of Representatives
The Federal Employees Pay Comparability Act of 1990 (FEPCA) was designed, in part, to address federal agencies’ challenges with recruitment and retention of skilled employees in areas where nonfederal wages exceeded federal wages.[1] The act created annual locality-based pay adjustments for General Schedule (GS) employees to reduce reported pay gaps between federal and nonfederal employees in each locality area to no more than 5 percent by 2002.[2]
As established under FEPCA, the President’s Pay Agent and Federal Salary Council are tasked with recommending GS locality pay adjustments to help reduce pay gaps. The Pay Agent is comprised of the Secretary of Labor and the Directors of the Office of Personnel Management (OPM) and the Office of Management and Budget (OMB). The Federal Salary Council is an advisory group—appointed by the President—comprised of three experts in pay and labor relations and six representatives of employee organizations representing large numbers of GS employees.
However, the goal to reduce pay differences between federal and nonfederal workers has not been met since 1994—the first year of the FEPCA’s implementation—because both the President and Congress may adjust the formula for locality-based pay adjustments. In all subsequent years through 2025, the President, Congress, or both, have taken action resulting in a locality-based payment that was far less than the one recommended by the Pay Agent. According to estimates reported by the council and the Pay Agent for 2025, the overall remaining pay gap was 27.54 percent (i.e., federal pay was less than nonfederal pay).[3] Closing the pay gap in 2025 would cost an estimated $26 billion, according to the Pay Agent’s annual report.[4]
Over time, the Pay Agent and the council have raised budgetary and methodological concerns with how the pay gap is calculated. For example, in its 2023 annual report the Pay Agent expressed concerns that the single pay adjustment per locality pay area did not account for differing labor markets for major occupational groups (i.e., that the pay gap may differ by occupation within a locality area).[5] To address methodological concerns, the Pay Agent and council have proposed alternatives to improve the validity of the pay gap’s calculation.
House Report 118-529, accompanying the National Defense Authorization Act for Fiscal Year 2025, includes a provision for us to review locality pay determinations and potential alternatives for the locality pay formula under Title 5.[6] Title 5 includes, among other things, rules governing federal civilian employee pay, including the procedures established in FEPCA to reduce pay gaps between federal and nonfederal employees. This report describes (1) the number of federal civilian employees who received locality pay, by agency and pay plan, for fiscal years 2019 through 2023; and (2) the methodology used to calculate locality pay, alternative methods identified by federal agencies and advisory councils, and costs of the alternative methods.
To address the first objective, we analyzed data from OPM’s Enterprise Human Resource Integration-Statistical Data Mart (EHRI) database, focusing on employees who received locality pay under Title 5.[7] Locality pay under Title 5 refers to the pay comparability system established by FEPCA.[8] We analyzed the number of employees, as reported in EHRI, receiving this locality pay by agency and pay plans. We used fiscal years 2019 through 2023 to align with the time frame for analysis of our second objective. Fiscal year 2023 was the most recent year of data available at the time of our review.
A limitation of the EHRI data variable we analyzed is that it includes other pay supplements, such as market pay under Title 38, in addition to locality pay under Title 5.[9] According to OPM officials, the number of employees receiving these other pay supplements is relatively small within the data variable. Through reviews of statutory pay provisions and documentation from the Pay Agent, we excluded employees who received these other pay supplements to the extent possible.
We assessed the reliability of EHRI data elements we used through documentation review and electronic or manual data testing to identify missing data, out of range values, and logical inconsistencies. We also interviewed OPM officials familiar with the data to understand any limitations of the data.[10] We determined these data were sufficiently reliable for our purposes of describing the number of employees receiving locality pay by agency and pay plan.
To address the second objective, we reviewed annual Federal Salary Council memorandums and the Pay Agent reports, council working group reports and public meeting minutes, and Bureau of Labor Statistics (BLS) documentation. We reviewed these documents for fiscal years 2019 through 2024.[11] We also conducted a literature search to identify proposed alternative methods by federal agencies and advisory councils for calculating locality pay.[12] In addition, we interviewed officials from BLS, OPM, and the Department of Labor, as well as OMB staff. We also interviewed seven council members, or their representatives, who were on the council in October 2024.[13]
We conducted this performance audit from August 2024 to April 2025 in accordance with generally accepted government auditing standards. Those standards require that we plan and perform the audit to obtain sufficient, appropriate evidence to provide a reasonable basis for our findings and conclusions based on our audit objectives. We believe that the evidence obtained provides a reasonable basis for our findings and conclusions based on our audit objectives.
Background
Under Title 5, federal employees covered by the GS pay system receive an annual pay adjustment comprised of two components: (1) the across-the-board pay adjustment and (2) a locality-based pay adjustment. For example, in 2025 GS employees received an across-the-board pay adjustment of 1.7 percent and an average locality pay adjustment of 0.3 percent, for an average total pay adjustment of 2 percent. The total pay adjustment ranged from 1.9 percent to 2.4 percent, depending on locality. The locality pay adjustment rate is set separately for each of the 58 locality pay areas, and all eligible employees in the same locality pay area receive the same adjustment rate.[14]
Each year, the Pay Agent provides a report to the President that includes a recommendation for the amount needed to close the pay gap to within 5 percent of nonfederal pay for each locality. The President may decide either to provide locality pay adjustment amounts based on the Pay Agent’s recommendation or provide pay adjustment amounts (including no adjustment) through the President’s alternative pay plan authority when there is a national emergency or serious economic conditions affecting the general welfare. Further, Congress, through legislation, may also provide for pay adjustment amounts (including no adjustment) that differ from either the Pay Agent’s recommendations or President’s alternative plans. See figure 1 for an example using the Washington, D.C., locality pay area’s recommended locality payment compared to the enacted payment, as a percentage of the base GS pay.
Figure 1: Annual Recommended and Final Locality Payments for Washington, D.C. as a Percentage of Base General Schedule Pay, Calendar Years 1994—2025
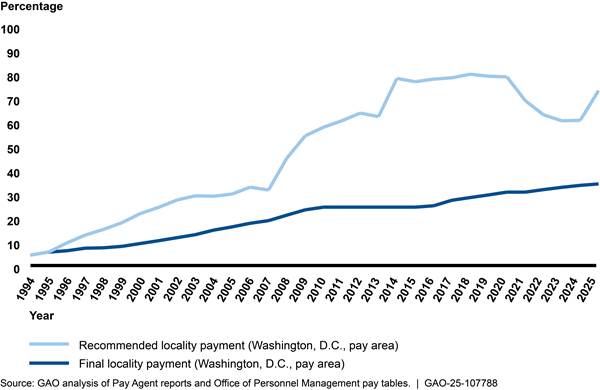
Note: No locality pay increases were provided in 2011 through 2015 and 2021.
The difference between federal and nonfederal pay, or the pay gap, varies by GS pay grade and locality pay area. See table 1 for examples.[15]
Table 1: Estimated Gap Between Federal and Nonfederal Pay by Examples of Grades and Locality Pay Areas for 2025
|
General Schedule (GS) grade and examples of occupations |
Percent gap between federal and nonfederal pay by grade and locality pay area, as estimated for 2025 |
|||
|
Corpus Christi, Texas |
Detroit, Michigan |
Washington, D.C. |
San Francisco, California |
|
|
GS-7: mostly entry-level and administrative positions (e.g., human resources assistant, pharmacy technician, consumer safety inspector) |
23.8 |
50.4 |
56.9 |
92.7 |
|
GS-11: mostly mid-level technical and first-level supervisory positions (e.g., engineer, information technology specialist, budget analyst, nurse) |
39.7 |
54.7 |
80.1 |
106.2 |
|
GS-14: top-level technical and supervisory position (e.g., physician, intelligence specialist, supervisory contract specialist, attorney) |
23.6 |
30.4 |
56.3 |
88.7 |
|
Average (all grades) |
35.9 |
53.3 |
81.4 |
109.4 |
Source: GAO analysis of USAjobs.gov and data from the President’s Pay Agent. | GAO‑25‑107788
Note: We selected locality pay areas with the lowest (Corpus Christi) and highest (San Francisco) average pay gaps. We selected Detroit and Washington, D.C., as examples of localities with average pay gaps between the lowest and highest.
The Pay Agent also issues an annual memorandum to the heads of executive agencies identifying additional categories of federal employees who are approved to receive Title 5 locality pay, such as administrative law judges. These employees are not paid under the GS pay system and thus are not automatically eligible.
Other federal employees outside the GS pay system may receive payments similar to locality adjustments which are under a different authority than Title 5. For example, financial regulatory agencies such as the Securities and Exchange Commission have the flexibility to establish their own compensation programs—including locality pay—without regard to various statutory provisions on classification and pay for executive branch agencies.[16] For the purposes of our review, we are only considering locality pay that is authorized under Title 5.
Some categories of federal employees are not eligible for locality pay or similar payments. For example, federal employees paid by the hour who work in trade, craft, and labor (under the Federal Wage System) do not receive locality payments. The Federal Wage System sets prevailing (or market) rates by local wage area.
A Majority of Federal Civilian Employees Received Locality Pay in Fiscal Years 2019—2023
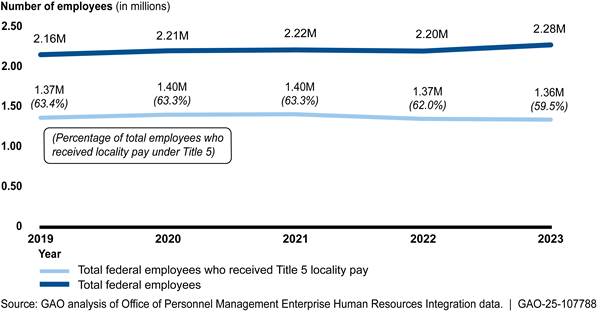
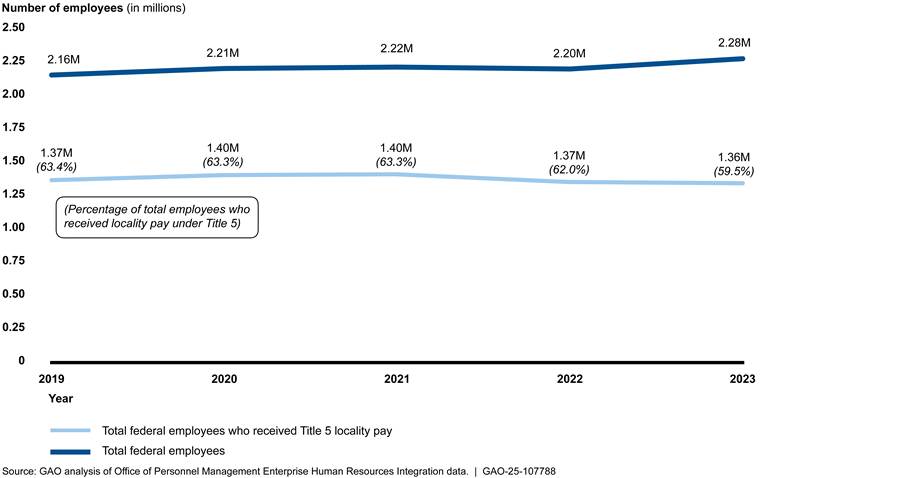
We analyzed data on approximately 2.3 million civilian employees who worked in the federal government in fiscal year 2023.[17] Of those, approximately 1.4 million, or 60 percent, received locality pay and were primarily GS employees. The percentage of the federal employees in the dataset receiving locality pay was a steady 63 percent from 2019 through 2021 before decreasing over the following 2 years (see fig. 2). This change was the result of a larger number of total employees in fiscal year 2023 in addition to a smaller number of employees receiving locality pay in fiscal years 2022 and 2023. For example, a category of employees at the Department of Veterans Affairs stopped receiving locality pay under Title 5 in fiscal year 2022.[18]
Figure 2: Number of Federal Civilian Employees and Number Who Received Locality Pay Under Title 5, Fiscal Years 2019—2023
Employees at 106 of 134 federal government agencies in OPM’s dataset (79 percent) received locality pay in fiscal year 2023, according to our analysis. The 10 agencies with the largest number of such employees are shown in figure 3. Approximately 90 percent of employees who received locality pay in fiscal year 2023 worked in one of these 10 agencies.
Not every employee at these agencies received Title 5 locality pay. For example, nearly half of the employees at the Department of Defense did not receive Title 5 locality pay. Approximately 125,000 of those employees are paid under the Federal Wage System, which sets prevailing (or market) rates by local wage area. See appendix I for a full list of agencies and pay plans with employees who received locality pay in fiscal year 2023.
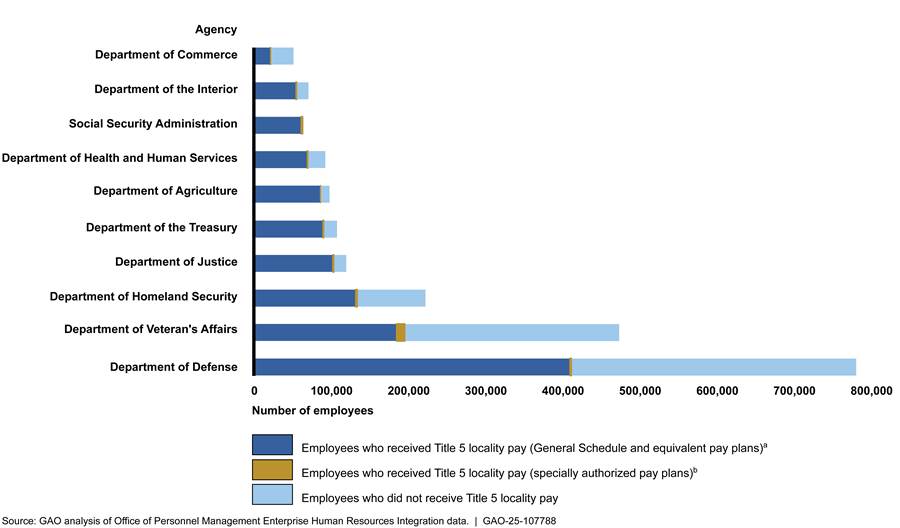
Note: Department of Defense includes the number of employees at the Departments of the Air Force, Army, Navy, and Defense.
aEmployees in the General Schedule (GS) equivalent pay plans include employees formerly covered by the Performance Management and Recognition System (pay plan GM) and employees who are law enforcement officers who receive special base rates (pay plan GL).
bFor purposes of this report, specially authorized pay plans are those listed in the President’s Pay Agent memorandum as eligible for Title 5 locality pay even though they are not covered by the GS pay plan. The Pay Agent issues an annual memorandum to the heads of executive agencies identifying additional categories of federal employees who are approved to receive Title 5 locality pay.
Over 98 percent of the federal employees who received locality pay in 2023 are part of the GS pay plan. The other pay plans authorized for locality pay under Title 5, as listed in the Pay Agent memorandum for 2023, include approximately 20,000 employees, or 1.5 percent of all employees who received locality pay in 2023. These specially authorized employees—such as law enforcement officers and faculty at military academies—are distributed across 36 agencies. Table 2 shows the number of employees by pay plan.
Table 2: Number of Federal Civilian Employees Who Received Locality Pay Under Title 5, by Pay Plan and Agency, Fiscal Year 2023
|
Pay plan and description |
Number
of agencies providing locality pay under pay plan and agency name |
Number of employees who received locality pay under pay plan |
|
|
Total General Schedule (GS) and GS equivalent pay plans |
101 |
1,334,680 |
|
|
Total specially authorized pay plansb |
36 |
20,630 |
|
|
|
AD - Administratively determined rates not elsewhere specified |
9 |
12,100 |
|
|
AL - Administrative law judges |
24 |
1,670 |
|
|
LE - U.S. Secret Service |
1 (Department of Homeland Security) |
1,610 |
|
|
FP - Foreign Service personnelc |
5 |
1,300 |
|
|
IJ - Immigration judges |
1 (Department of Justice) |
720 |
|
|
EN - National Nuclear Security Administration Excepted Service |
1 (Department of Energy) |
670 |
|
|
SP - Park police |
1 (Department of the Interior) |
520 |
|
|
GG – National Foreign Affairs Training Center employees, among others |
1 (Department of State) |
500 |
|
|
TR - Police forces |
1 (Department of the Treasury) |
460 |
|
|
FO - Foreign Service officersc |
3 |
340 |
|
|
VN - Optometrists and chiropractors |
1 (Department of Veterans Affairs) |
130 |
|
|
EJ - The Department of Energy Organization Act Excepted Service |
1 (Department of Energy) |
110 |
|
|
Other specially authorized pay plans |
9 |
380 |
Source: GAO analysis of Office of Personnel Management Enterprise Human Resources Integration data. | GAO‑25‑107788
Note: Numbers have been rounded to the nearest tenth. Pay plan descriptions are based on the Office of Personnel Management’s (OPM) Data Standards and the President’s Pay Agent memorandum on the Continuation of Locality Payments for Non-General Schedule Employees.
aAccording to OPM, administrative law judges (pay plan AL), Foreign Service personnel (pay plan FP), and Foreign Service officers (pay plan FO) are eligible for Title 5 locality pay regardless of agency. All the other pay plans that are authorized to receive Title 5 locality pay in this table correspond to a specific agency, as listed in the Pay Agent memorandum.
bFor purposes of this report, specially authorized pay plans are those listed in the Pay Agent memorandum as eligible for Title 5 locality pay even though they are not covered by the General Schedule pay plan. The Pay Agent issues an annual memorandum to the heads of executive agencies identifying additional categories of federal employees who are approved to receive Title 5 locality pay
cMembers of the Foreign Service who work at the Department of State are not included in OPM’s Enterprise Human Resources Integration data.
In our analysis of OPM data, we did not find evidence of locality payments for every category of employee listed as eligible in the Pay Agent memorandums. For example, members of the Senior Executive Service or employees covered by Senior Level or Scientific and Professional pay systems who work in a nonforeign area are eligible for locality pay.[19] We did not find any such employees who received locality pay from fiscal years 2019 through 2023 in the OPM data.
Support Among Council Members Has Varied for Proposed Alternative Methods and Bureau of Labor Statistics Cost Estimates Are Limited
Methodology for Calculating Locality Pay and Changes Since 2019
The Federal Salary Council and the Pay Agent use data collected by the Bureau of Labor Statistics (BLS) and OPM to calculate the gap between federal and nonfederal pay. See text box for an overview of the process for comparing federal and nonfederal pay.
|
Process for Comparing Federal and Nonfederal Pay to Calculate the Gap for Each Locality and Recommending Pay Adjustments · The Bureau of Labor Statistics (BLS) combines data from two of its survey programs—the National Compensation Survey (NCS) and Occupational Employment and Wage Statistics (OEWS) program—to model a statistical estimate of nonfederal pay rates by locality area, occupation, and General Schedule grade level. These BLS surveys collect salary data from firms of all sizes in private industry and state and local governments. · With technical assistance from Office of Personnel Management (OPM) staff, the Federal Salary Council and the President’s Pay Agent use (1) OPM data on federal pay by occupation and grade level, and (2) BLS estimates on nonfederal pay from the NCS/OEWS model to calculate gaps for federal and nonfederal pay. · The Federal Salary Council uses the pay gap data to calculate locality pay rates for each locality. The council sends a memorandum with its recommendations for the next calendar year to the President’s Pay Agent. · The Pay Agent considers the recommendations of the council and submits an annual report to the President that includes a recommendation for the locality payment needed to bring pay within 5 percent of nonfederal pay for each locality. |
Source: GAO analysis of BLS, OPM, council, and Pay Agent documentation. | GAO‑25‑107788
Note: For purposes of the statistical estimates of nonfederal pay, occupations are classed in five broad occupational groups: Professional, Administrative, Technical, Clerical, and Officer.
Since 2019, changes to the methodology for calculating locality pay have been limited to technical revisions related to the use of survey data, according to BLS officials. For example, in 2021, BLS proposed a change to how it estimates nonfederal pay using survey data by adding an additional method for calculating average nonfederal pay. BLS officials stated that the purpose of this change was to increase consistency with the overall methodology of the National Compensation Survey (NCS). Following this change, BLS provided estimates to the council using two different ways of calculating average nonfederal pay:
· surveyed occupations in the NCS with more employees do not always have more influence on the average nonfederal pay (original method); or
· surveyed occupations in the NCS with more employees consistently have more influence on the average nonfederal pay (modified method).
Each year since BLS has provided both estimates, the council has chosen to continue to use the estimates from the original method, according to BLS officials. The Chair told us that the council decided to use the original method because of concerns that estimates giving more influence to larger occupations could fluctuate more year to year. BLS officials told us that their research found that the modified method, over time, would not lead either to consistently higher or lower estimates compared to the original method. BLS officials also said that they improved the modified method for 2024 and found that the two estimates were more similar to each other than in prior years.
Support for and Cost of Locality Pay Methodology
Support for the methodology for calculating locality pay has varied among council members since 2019. In a memorandum to the Pay Agent in May 2019, three council members raised concerns about the methodology. For example, they stated that the methodology at that time relied too heavily on statistical modeling using BLS surveys and suggested that more actual data on nonfederal pay would produce more accurate estimates. In this same memorandum, four council members representing employee organizations disagreed with these concerns, stating that the locality pay methodology was of high quality. Specifically, they stated that the use of statistical modeling was an economical and scientific way to produce estimates needed for comparison of nonfederal and federal pay. Five members of the 2024 council that we spoke to were generally supportive of the locality pay methodology.[20] One council member was neutral on the methodology and stated that the lack of funding for the locality pay program is the larger issue.
BLS officials said that the agency has no estimate for how much it costs to produce the pay estimates used in locality pay calculations each year. They said BLS could not estimate the cost because the pay estimates use data collected through two surveys—the NCS and the Occupational Employment and Wage Statistics (OEWS) program—which are used in multiple BLS products.
Alternative Methods Proposed Since 2019 and Related Cost Estimates
Since 2019, the council and Pay Agent have considered ways to change the methodology used to calculate locality pay. These proposed changes include seven alternatives in total. Four of the seven alternatives were presented in the council’s May 2019 memorandum. Three of the seven alternatives were considered since that time: consideration of estimates by occupation, increasing the number of survey firms, and collecting data on salary ranges.[21]
|
Roles in Proposing and Recommending Alternative Methods · The Bureau of Labor Statistics, at the request of the Federal Salary Council, collects data and provides cost estimates to inform council decisions on alternative methods. · The Federal Salary Council may submit recommendations in its annual memorandum to the President's Pay Agent on the process for making pay comparisons, which may include changes to the method for calculating locality pay. · The Pay Agent considers the recommendations of the council, including on alternative methods, and will include the views and recommendations of the council in its annual report to the President. Source: GAO analysis of relevant federal laws and interviews with agency officials. | GAO‑25‑107788 |
See side bar for the roles of different federal entities in proposing and recommending alternative methodologies.
2019 council memorandum. The council identified four alternatives to the methodology for setting locality pay in its May 2019 memorandum to the Pay Agent. In that memorandum, the council stated that all members could not reach consensus on which alternative methodology, if any, should be recommended to the Pay Agent for consideration or even if these alternatives should be studied further. According to our analysis of council meeting minutes, these alternative methodologies were not further pursued by the council, following the publication of the 2019 memorandum.
See table 3 for the four alternatives that the council proposed in 2019 and council members’ views expressed in the 2019 memorandum, as well as 2024 council members’ comments on each alternative.
Table 3: Alternative Methodologies for Calculating Locality Pay Proposed by the Federal Salary Council in 2019 and Council Member Views
|
Proposed alternative |
Description |
Change in law needed, as reported by council |
Council member views in the memorandum and comments to GAO (2019a and 2024b) |
|
Modify the existing salary survey methodology to reduce statistical modeling |
Reduce the extent of statistical modeling by increasing the survey’s sample size of firms and targeting firms with nonfederal jobs similar to federal jobs. |
No |
· 2019: Three council members believed this would enhance market sensitivity by providing potentially more accurate overall nonfederal average pay in each locality pay area. This change also included selecting benchmark jobs for comparing nonfederal and federal pay by occupation and grade level. Four members objected to all proposed alternative methodologies and voiced support for the existing methodology, which they said was of high quality and economical. · 2024: Five council members discussed various changes to the existing survey methodology, such as collecting data on salary ranges. Of these five members, none voiced support for the 2019 proposal to reduce the extent of statistical modeling. |
|
Verify the results of the methodology |
Use human capital data related to recruitment and retention to verify estimated pay gaps. For example, analyze attrition data to determine if a locality’s pay gap is significant enough to lead to employees leaving federal agencies. |
No |
· 2019: To the extent findings from analysis of other pay data or attrition data would be consistent with findings from the existing survey methodology, this option might help address concerns regarding the validity of the method’s statistical modeling, according to three council members. Four council members opposed all proposed alternatives. · 2024: Three council members said that they did not believe that human capital data would be a valid way to assess pay estimates. Three other council members were supportive of using human capital data to inform locality pay discussions but said that its validity would depend on the human capital data used. |
|
Assess the total compensation gap |
Include nonsalary benefits such as employer payments for their employees’ health insurance, life insurance, and pensions when comparing federal and nonfederal pay. |
Yes |
· 2019: Three council members expressed concern that federal and nonfederal benefits are not considered in locality pay calculations. They noted that employee benefits cannot be considered in setting federal pay under current law. Four council members opposed all proposed alternatives. · 2024: Three council members said that they believe this comparison would not be useful, as they view salary as the primary driver in recruitment, rather than total compensation. In addition, three other council members said that comparing the cost of federal and nonfederal benefits lacks validity because of challenges such as monetizing certain benefits and the accuracy in comparing federal and nonfederal retirement benefits. |
|
Establish a commission to periodically review federal civilian compensation |
Conduct a comprehensive, periodic review of total compensation for federal civilians, patterned after other efforts to review federal compensation. |
Yes |
· 2019: Three council members believed that this option would provide for a bicameral, bipartisan forum to review and make recommendations on changes to civil service pay and benefits. Four council members opposed all proposed alternatives. · 2024: Four council members said that such a commission would be of little value and duplicate council responsibilities under the current law. Two council members said that they were open to a periodic review of federal compensation. |
Source: GAO analysis of Federal Salary Council documentation to summarize alternatives and 2019 council members’ views and interviews with 2024 council members to discuss their views on the 2019 alternatives. | GAO‑25‑107788
aThe 2019 council had eight members, seven of whom provided views on the alternatives in the May 2019 Federal Salary Council memorandum to the President’s Pay Agent.
bThe 2024 council had nine members, and we interviewed seven of the council members or their representatives. We did not include in the summary of views the comments of members who expressed neutral views on that alternative.
According to the 2019 memorandum, the council considered the cost of implementing the four alternative methodologies and determined that all the alternatives would require additional costs. They generally noted that costs would be dependent on specifics of chosen additions or changes, but did not provide detailed cost estimates in the memorandum. According to BLS officials, the council did not request formal cost estimates on any of the four alternatives proposed in 2019 or since then.
Since 2019, three additional alternatives have been considered by the Pay Agent or council members.
Consideration of occupational estimates. Each annual report of the Pay Agent from 2019 to 2024 has noted that the underlying methodology for locality pay has “lacked credibility” since the beginning of locality pay in 1994. The Pay Agent attributes this to the use of a single locality rate per pay area, without regard for differing labor markets for occupational groups. In its 2019 through 2023 reports, the Pay Agent did not recommend specific changes to the method of calculating locality pay but did broadly call for legislative reform of the General Schedule (GS) federal pay system. In its November 2024 report, the Pay Agent did not call for legislative reform of the pay system but did reiterate the concerns in the 2019 through 2023 reports.
BLS officials said that it would be possible to calculate separate rates by major occupational group because it delivers separate estimates by major occupational groups to OPM for use in calculating the single locality rate. However, they cautioned that additional research would be needed to determine whether the separate rates would be reliable enough to meet the Pay Agent’s needs. This research would take at least 12 to 18 months, depending on how occupations are defined, and the cost is unknown, according to BLS officials.
Changes to the number of surveyed firms. In 2010, BLS announced a reduction in the number of firms surveyed for the National Compensation Survey (NCS) due to budget cuts. As we reported in 2012, BLS said that the results from combining the NCS at the reduced number of firms with Occupational Employment and Wage Statistics (OEWS) data could still be used to calculate pay gaps.[22] Officials also stated in 2010 that only the number of firms surveyed for the NCS changed, not the substance of what is collected, and that the reduction should not affect the ability to compare nonfederal and federal pay.
One council member told us that increasing the number of surveyed firms for the NCS remained a valid alternative.[23] The council wrote in its 2011 through 2014 memorandums to the Pay Agent that it had concerns about the reduction in the number of firms surveyed for the NCS and asked the Pay Agent to reinstate the full number. In its 2013 annual report, the Pay Agent said that restoring the number of surveyed firms for the NCS was not feasible given economic circumstances. Since 2014, the council has not raised the issue in its memorandums.
When BLS reduced the NCS sample size in 2010, it estimated at that time that the change would save $9.8 million. BLS officials we spoke with said that this estimate is no longer accurate because of changes in survey procedures and the addition of 26 locality pay areas from 2010 to 2024. BLS does not have a current cost estimate for this alternative.
Salary range differences between federal and nonfederal jobs. According to the council Chair, the narrowness of the pay ranges for GS employees compared to broader nonfederal pay ranges may partially explain the size of the current pay gap. The Chair recommended, in the 2024 memorandum to the Pay Agent, and the council members unanimously agreed to ask BLS to collect data from a sample of survey respondents on nonfederal salary ranges (i.e., the minimum and maximum pay for a given position). The GS pay system has a pay range of 30 percent for most grades (i.e., the maximum salary is generally about 30 percent higher than the minimum salary within a grade). The Chair said that he requested that BLS produce a formal estimate of the cost to collect these data. BLS officials confirmed that the council requested these data and the cost estimate. In 2024, the President’s Pay Agent expressed support for the council’s interest in additional analysis into the impact of salary ranges on the pay gap.[24]
BLS currently collects data on average nonfederal salaries and does not have the resources to undertake the proposed additional data collection, according to BLS officials. Further, they told us that they would require additional resources to evaluate the council Chair’s request to both collect the additional data and determine the cost for doing so. BLS officials said that they previously estimated in 2018 that a one-time survey to collect nonfederal pay range data from firms would cost between $400,000 and $600,000 annually. BLS said this estimate does not include survey development costs.
Agency Comments
We provided a draft of this report to the Acting Secretary of Labor, the Director of OMB, and the Acting Director of OPM for their review and comment. Labor and OPM did not have any comments on the report. OMB did not provide a response on the report.
We are sending copies of this report to the appropriate congressional committees, the Secretary of Labor, the Director of OMB, the Acting Director of OPM, and other interested parties. In addition, the report will be available at no charge on the GAO website at http://www.gao.gov.
If you or your staff have any questions about this report, please contact me at LockeD@gao.gov. Contact points for our Offices of Congressional Relations and Public Affairs may be found on the last page of this report. GAO staff who made key contributions to this report are listed in appendix II.

Dawn G. Locke
Director, Strategic Issues
Appendix I: Additional Information on Number of Employees Who Received Locality Pay in Fiscal Year 2023
Table 4: Number of Employees Who Received Locality Pay Under Title 5, by Agency and Pay Plan, Fiscal Year 2023
|
Number of employees includes General Schedule
employees only |
|
|
Agency and pay plan |
Number of employees |
|
Administrative Conference of the United States |
<20 |
|
African Development Foundation |
30 |
|
American Battle Monuments Commission |
40 |
|
AmeriCorps |
50 |
|
NX – Senior level employees |
50 |
|
Appalachian Regional Commission |
<20 |
|
Architectural and Transportation Barriers Compliance Board |
30 |
|
Arctic Research Commission |
<20 |
|
Armed Forces Retirement Home |
290 |
|
Barry Goldwater Scholarship and Excellence in Education Foundation |
<20 |
|
Chemical Safety and Hazard Investigation Board |
40 |
|
Commission for the Preservation of America’s Heritage Abroad |
<20 |
|
Commission of Fine Arts |
<20 |
|
Commission on Civil Rights |
50 |
|
Committee for Purchase from People Who Are Blind and Severely Disabled |
40 |
|
Consumer Product Safety Commission |
540 |
|
Council of Economic Advisers |
<20 |
|
Council of the Inspectors General on Integrity and Efficiency |
20 |
|
Council on Environmental Quality |
30 |
|
Court Services and Offender Supervision Agency for the District of Columbia |
1,020 |
|
GL General Schedule (GS) employees paid a law enforcement officer special rate |
80 |
|
GS - General Schedule |
940 |
|
Defense Nuclear Facilities Safety Board |
100 |
|
DN - Professional, scientific, and technical personnel |
70 |
|
GS - General Schedule |
30 |
|
Denali Commission |
<20 |
|
Department of Agriculture |
84,740 |
|
AL – Administrative law judges |
<20 |
|
FO – Foreign Service officers |
20 |
|
FP – Foreign Service personnel |
<20 |
|
GL - GS employees paid a law enforcement officer special rate |
90 |
|
GM - Employees covered by the Performance Management and Recognition System |
<20 |
|
GS - General Schedule |
84,600 |
|
Department of Commerce |
20,090 |
|
FO - Foreign Service officers |
<20 |
|
FP - Foreign Service personnel |
30 |
|
GL - GS employees paid a law enforcement officer special rate |
<20 |
|
GM - Employees covered by the Performance Management and Recognition System |
<20 |
|
GS - General Schedule |
20,030 |
|
Department of Defense |
93,360 |
|
AD - College faculty, among others |
1,510 |
|
GL - GS employees paid a law enforcement officer special rate |
<20 |
|
GM - Employees covered by the Performance Management and Recognition System |
<20 |
|
GS - General Schedule |
91,840 |
|
Department of Education |
3,440 |
|
AD - Director and Deputy Director of the National Assessment Governing Board |
<20 |
|
AL - Administrative law judges |
<20 |
|
GS - General Schedule |
3,430 |
|
Department of Energy |
11,410 |
|
AL - Administrative law judges |
<20 |
|
EJ – The Department of Energy Organization Act excepted service |
110 |
|
EN – National Nuclear Security Administration excepted service |
670 |
|
GM - Employees covered by the Performance Management and Recognition System |
<20 |
|
GS - General Schedule |
10,600 |
|
Department of Health and Human Services |
67,820 |
|
AA - Administrative appeals judges |
<20 |
|
AL - Administrative law judges |
150 |
|
GL - GS employees paid a law enforcement officer special rate |
<20 |
|
GM - Employees covered by the Performance Management and Recognition System |
<20 |
|
GS - General Schedule |
67,630 |
|
Department of Homeland Security |
131,980 |
|
AD - Coast Guard Academy faculty, among others |
50 |
|
AL - Administrative law judges |
<20 |
|
GL - GS employees paid a law enforcement officer special rate |
2,800 |
|
GM - Employees covered by the Performance Management and Recognition System |
<20 |
|
GS - General Schedule |
127,490 |
|
LE – U.S. Secret Service |
1,610 |
|
Department of Housing and Urban Development |
8,270 |
|
AL - Administrative law judges |
<20 |
|
GL - GS employees paid a law enforcement officer special rate |
<20 |
|
GS - General Schedule |
8,260 |
|
Department of Justice |
101,330 |
|
AL - Administrative law judges |
<20 |
|
GL - GS employees paid a law enforcement officer special rate |
22,720 |
|
GM - Employees covered by the Performance Management and Recognition System |
<20 |
|
GS - General Schedule |
77,880 |
|
IJ - Immigration judges |
720 |
|
Department of Labor |
14,790 |
|
AA - Administrative appeals judges |
<20 |
|
AL - Administrative law judges |
40 |
|
GM - Employees covered by the Performance Management and Recognition System |
<20 |
|
GS - General Schedule |
14,740 |
|
Department of Statea |
13,130 |
|
AD - Miscellaneous positions |
50 |
|
ED - Experts appointed under 5 U.S.C. 3109 |
<20 |
|
EF - Consultants appointed under 5 U.S.C. 3109 |
<20 |
|
GG - National Foreign Affairs Training Center and U.S. mission to the United Nations employees, among others |
500 |
|
GM - Employees covered by the Performance Management and Recognition System |
<20 |
|
GS - General Schedule |
12,570 |
|
Department of the Air Force |
88,250 |
|
GL - GS employees paid a law enforcement officer special rate |
40 |
|
GS - General Schedule |
88,210 |
|
Department of the Army |
129,870 |
|
GL - GS employees paid a law enforcement officer special rate |
100 |
|
GS - General Schedule |
129,760 |
|
Department of the Interior |
53,530 |
|
AL - Administrative law judges |
<20 |
|
GL - GS employees paid a law enforcement officer special rate |
1,160 |
|
GM - Employees covered by the Performance Management and Recognition System |
<20 |
|
GS - General Schedule |
51,830 |
|
SP - Park police |
520 |
|
Department of the Navy |
98,020 |
|
GL - GS employees paid a law enforcement officer special rate |
130 |
|
GS - General Schedule |
97,890 |
|
Department of the Treasury |
88,390 |
|
GL - GS employees paid a law enforcement officer special rate |
240 |
|
GS - General Schedule |
87,690 |
|
TR – Police forces |
460 |
|
Department of Transportation |
9,510 |
|
Department of Veterans Affairs |
193,420 |
|
AD - Medical support personnel, trainees, and students |
9,810 |
|
AL - Members of the Board of Veteran’s Appeals |
130 |
|
GL - GS employees paid a law enforcement officer special rate |
<20 |
|
GM - Employees covered by the Performance Management and Recognition System |
<20 |
|
GS - General Schedule |
183,270 |
|
SR - Non-physician, non-dentist, and non-nurse employees |
70 |
|
VN - Optometrists and chiropractors |
130 |
|
Development Finance Corporation |
550 |
|
Environmental Protection Agency |
15,020 |
|
AD - Miscellaneous types of positions |
<20 |
|
AL - Administrative law judges |
<20 |
|
GL - GS employees paid a law enforcement officer special rate |
<20 |
|
GM - Employees covered by the Performance Management and Recognition System |
<20 |
|
GS - General Schedule |
14,980 |
|
Equal Employment Opportunity Commission |
2,210 |
|
GM - Employees covered by the Performance Management and Recognition System |
<20 |
|
GS - General Schedule |
2,200 |
|
Export-Import Bank of the United States |
350 |
|
Federal Communications Commission |
1,190 |
|
AL - Administrative law judges |
<20 |
|
GS - General Schedule |
1,180 |
|
Federal Deposit Insurance Corporation |
<20 |
|
AL - Administrative law judges |
<20 |
|
Federal Election Commission |
280 |
|
Federal Financial Institutions Examination Council |
<20 |
|
Federal Labor Relations Authority |
100 |
|
AL - Administrative law judges |
<20 |
|
GS - General Schedule |
100 |
|
Federal Maritime Commission |
120 |
|
AL - Administrative law judges |
<20 |
|
GS - General Schedule |
110 |
|
Federal Mediation and Conciliation Service |
200 |
|
Federal Mine Safety and Health Review Commission |
50 |
|
AL - Administrative law judges |
<20 |
|
GS – General Schedule |
40 |
|
Federal Permitting Improvement Steering Council |
<20 |
|
Federal Retirement Thrift Investment Board |
230 |
|
Federal Trade Commission |
1,210 |
|
AL - Administrative law judges |
<20 |
|
GM - Employees covered by the Performance Management and Recognition System |
<20 |
|
GS - General Schedule |
1,200 |
|
General Services Administration |
12,510 |
|
GM - Employees covered by the Performance Management and Recognition System |
<20 |
|
GS - General Schedule |
12,510 |
|
Government Printing Office |
<20 |
|
Gulf Coast Ecosystem Restoration Council |
20 |
|
Harry S. Truman Scholarship Foundation |
<20 |
|
Intellectual Property Enforcement Coordination |
<20 |
|
Interagency Council on the Homeless |
<20 |
|
Inter-American Foundation |
50 |
|
International Boundary Commission: United States and Canada |
<20 |
|
International Joint Commission: United States and Canada |
<20 |
|
Japan-United States Friendship Commission |
<20 |
|
Judicial Branch |
150 |
|
Marine Mammal Commission |
<20 |
|
GM - Employees covered by the Performance Management and Recognition System |
<20 |
|
GS - General Schedule |
<20 |
|
Merit Systems Protection Board |
180 |
|
National Aeronautics and Space Administration |
17,550 |
|
GL - GS employees paid a law enforcement officer special rate |
<20 |
|
GM - Employees covered by the Performance Management and Recognition System |
<20 |
|
GS - General Schedule |
17,540 |
|
National Archives and Records Administration |
2,480 |
|
AD - Director of the Center for Legislative Archives and the Director of the National Historical Publications and Records Commission |
<20 |
|
GM - Employees covered by the Performance Management and Recognition System |
<20 |
|
GS - General Schedule |
2,470 |
|
National Capital Planning Commission |
30 |
|
National Council on Disability |
<20 |
|
National Foundation on the Arts and the Humanities |
360 |
|
National Labor Relations Board |
1,160 |
|
AL - Administrative law judges |
40 |
|
GM - Employees covered by the Performance Management and Recognition System |
<20 |
|
GS - General Schedule |
1,120 |
|
National Mediation Board |
30 |
|
National Science Foundation |
1,520 |
|
AD - Professional and technical employees |
560 |
|
ED - Experts appointed under 5 U.S.C. 3109 |
<20 |
|
EE - Experts not appointed under 5 U.S.C. 3109 |
60 |
|
EG - Consultants not appointed under 5 U.S.C. 3109 |
<20 |
|
GS - General Schedule |
890 |
|
National Security Council |
60 |
|
National Transportation Safety Board |
390 |
|
AL - Administrative law judges |
<20 |
|
GS - General Schedule |
390 |
|
Navajo And Hopi Indian Relocation Commission |
<20 |
|
Northern Border Regional Commission |
<20 |
|
Nuclear Regulatory Commission |
50 |
|
AJ - Administrative judges |
<20 |
|
SN - Senior level employees |
40 |
|
Nuclear Waste Technical Review Board |
<20 |
|
Occupational Safety and Health Review Commission |
50 |
|
AL - Administrative law judges |
<20 |
|
GS - General Schedule |
40 |
|
Office of Administration |
230 |
|
Office of Government Ethics |
70 |
|
Office of Management and Budget |
680 |
|
Office of National Drug Control Policy |
60 |
|
Office of Personnel Management |
2,700 |
|
Office of Science and Technology Policy |
30 |
|
Office of Special Counsel |
120 |
|
Office of the Cyber Director |
<20 |
|
Office of the Special Representative for Trade Negotiations |
210 |
|
Peace Corps |
610 |
|
FP – Foreign Service personnel |
610 |
|
Pension Benefit Guaranty Corporation |
930 |
|
Railroad Retirement Board |
830 |
|
Securities and Exchange Commission |
<20 |
|
AL - Administrative law judges |
<20 |
|
Selective Service System |
170 |
|
Small Business Administration |
7,870 |
|
GL - GS employees paid a law enforcement officer special rate |
<20 |
|
GM - Employees covered by the Performance Management and Recognition System |
<20 |
|
GS - General Schedule |
7,860 |
|
Smithsonian Institution |
3,150 |
|
GM - Employees covered by the Performance Management and Recognition System |
<20 |
|
GS - General Schedule |
3,140 |
|
Social Security Administration |
60,970 |
|
AA - Administrative appeals judges |
50 |
|
AL - Administrative law judges |
1,230 |
|
GL - GS employees paid a law enforcement officer special rate |
<20 |
|
GS - General Schedule |
59,680 |
|
Surface Transportation Board |
110 |
|
Trade and Development Agency |
60 |
|
U.S. Agency for Global Media |
1,130 |
|
FP – Foreign Service personnel |
<20 |
|
GS – General Schedule |
1,120 |
|
U.S. Agency for International Development |
3,000 |
|
AD - Miscellaneous types of positions |
100 |
|
FO - Foreign Service officers |
300 |
|
FP - Foreign Service personnel |
660 |
|
GS - General Schedule |
1,950 |
|
U.S. Holocaust Memorial Museum |
110 |
|
U.S. Tariff Commission |
410 |
|
AL - Administrative law judges |
<20 |
|
GS - General Schedule |
400 |
|
Utah Reclamation Mitigation and Conservation Commission |
<20 |
Source: GAO analysis of Office of Personnel Management (OPM) Enterprise Human Resources Integration data. | GAO‑25‑107788
Note: All employee counts are rounded to the nearest tenth. For confidentiality, no employee counts less than 20 are reported. Agency sub-totals may not sum to agency totals due to suppressions and rounding. Pay plan descriptions are based on the OPM’s Data Standards and the President’s Pay Agent memorandum. The Pay Agent issues an annual memorandum to the heads of executive agencies identifying additional categories of federal employees who are approved to receive Title 5 locality pay.
aMembers of the Foreign Service who work at the Department of State are not included the OPM’s Enterprise Human Resources Integration data.
GAO Contact
Dawn G. Locke, LockeD@gao.gov
Staff Acknowledgments
In addition to the contact named above, key contributors to this report were Janice Latimer (Assistant Director), Shelby Kain (Analyst-in-Charge), and Jenn Alexander. In addition, Madeline Barch, McLeod Brown, Joshua Brownstein, Jacqueline Chapin, Robert Robinson, and Clarette Yen made significant contributions to this report.
The Government Accountability Office, the audit, evaluation, and investigative arm of Congress, exists to support Congress in meeting its constitutional responsibilities and to help improve the performance and accountability of the federal government for the American people. GAO examines the use of public funds; evaluates federal programs and policies; and provides analyses, recommendations, and other assistance to help Congress make informed oversight, policy, and funding decisions. GAO’s commitment to good government is reflected in its core values of accountability, integrity, and reliability.
Obtaining Copies of GAO Reports and Testimony
The fastest and easiest way to obtain copies of GAO documents at no cost is through our website. Each weekday afternoon, GAO posts on its website newly released reports, testimony, and correspondence. You can also subscribe to GAO’s email updates to receive notification of newly posted products.
Order by Phone
The price of each GAO publication reflects GAO’s actual cost of production and distribution and depends on the number of pages in the publication and whether the publication is printed in color or black and white. Pricing and ordering information is posted on GAO’s website, https://www.gao.gov/ordering.htm.
Place orders by calling (202) 512-6000, toll free (866) 801-7077,
or
TDD (202) 512-2537.
Orders may be paid for using American Express, Discover Card, MasterCard, Visa, check, or money order. Call for additional information.
Connect with GAO
Connect with GAO on X,
LinkedIn, Instagram, and YouTube.
Subscribe to our Email Updates. Listen to our Podcasts.
Visit GAO on the web at https://www.gao.gov.
To Report Fraud, Waste, and Abuse in Federal Programs
Contact FraudNet:
Website: https://www.gao.gov/about/what-gao-does/fraudnet
Automated answering system: (800) 424-5454
Media Relations
Sarah Kaczmarek, Managing Director, Media@gao.gov
Congressional Relations
A. Nicole Clowers, Managing Director, ClowersA@gao.gov
General Inquiries
[1]Pub. L. No. 101-509, § 529, 104 Stat. 1389, 1427 (1990). According to the Office of Personnel Management’s guidance, a position is subject to the General Schedule, in part, if its primary duty requires knowledge or experience of an administrative, clerical, scientific, artistic, or technical nature not related to trade, craft, or manual labor work. See Office of Personnel Management, Handbook of Occupational Groups and Families (Washington, D.C.: December 2018).
[2]The locality component of the pay adjustment under FEPCA was to be phased in over a 9-year period. In 1994, the minimum comparability increase was two-tenths of the amount needed to reduce the pay disparity, or pay gap, to 5 percent according to the methodology required by current law. For each successive year, the comparability increase was scheduled to be at least an additional one-tenth of the amount needed to reduce the pay disparity to 5 percent. For 2002 and thereafter, the law authorized the full amount necessary to reduce the pay disparity in each locality pay area to 5 percent.
[3]Federal Salary Council, Level of Comparability Payments for January 2025 and Other Matters Pertaining to the Locality Pay Program (Washington, D.C.: Feb. 9, 2024). President’s Pay Agent, Report on Locality-Based Comparability Payments for the General Schedule: Annual Report of the President’s Pay Agent for Locality Pay in 2025 (Washington, D.C.: Nov. 27, 2024). These were the most recent council and Pay Agent reports and data at the time of our review.
[4]President’s Pay Agent, Report on Locality-Based Comparability Payments for the General Schedule: Annual Report of the President’s Pay Agent for Locality Pay in 2025 (Washington, D.C.: Nov. 27, 2024). In its report, the Pay Agent notes that the cost to close the pay gap may be higher than estimated, because it excludes increases in government contributions for retirement, life insurance, or other employee benefits that may be attributed to locality payments.
[5]President’s Pay Agent, Report on Locality-Based Comparability Payments for the General Schedule: Annual Report of the President’s Pay Agent for Locality Pay in 2024 (Washington, D.C.: Oct. 3, 2023). Data on nonfederal wages by occupation are collected by the Bureau of Labor Statistics and used in calculating locality pay gaps. However, per statute, there is a single pay adjustment per locality pay area and no variation by occupation within a locality pay area.
[6]H.R. Rep. No. 118-529, at 271 (2024).
[7]OPM’s EHRI database covers most of the federal executive branch civilian employees. It does not include the U.S. Postal Service, judicial branch employees, intelligence agencies, most legislative branch employees, or members of the Foreign Service at the Department of State.
[8]See 5 U.S.C. §§ 5304 and 5304a.
[9]Market pay is pay intended to reflect the recruitment and retention needs for the specialty or assignment of a particular physician, podiatrist, or dentist in a facility of the Department of Veterans Affairs. 38 U.S.C. § 7431.
[10]OPM officials told us that the agency relies on federal agencies to submit accurate data. Officials said that OPM does not validate data submitted to EHRI beyond checking for compliance with format standards.
[11]We also reviewed the Pay Agent report released November 27, 2024 (in fiscal year 2025). We used 2019 as the starting point for our analysis because that was the most recent year with multiple alternative methodologies proposed by the Federal Salary Council.
[12]Our literature search sought to identify alternatives proposed in government reports in the past 5 years. We conducted searches of various databases, such as Dialog, Google Advanced, Bloomberg Government, and Lexis+. These searches did not identify any relevant government reports other than those already identified from the Federal Salary Council, President’s Pay Agent, and Congressional Budget Office. We conducted these searches in October 2024.
[13]The remaining two council members in October 2024 did not respond to our request for an interview.
[14]For a description of the process of administering locality pay adjustments, including the establishment or modification of locality pay areas, see GAO, Human Capital: Administration and Implementation of the General Schedule Locality Pay Program, GAO‑22‑104580 (Washington, D.C.: Nov. 30, 2021).
[15]The GS workforce is divided into 15 pay grades.
[16]See 5 U.S.C. § 4802(c)-(d).
[17]Numbers of federal civilian employees are based on OPM’s Enterprise Human Resources Integration-Statistical Data Mart data, which cover most of the federal executive branch civilian employees, and do not include the U.S. Postal Service, judicial branch employees, intelligence agencies, most legislative branch employees, nor members of the Foreign Service at the State Department. Fiscal year 2023 was the most recent year of data at the time of our analysis.
[18]The President’s Pay Agent memorandum on the Continuation of Locality Payments for Non-General Schedule Employees for 2022, issued November 30, 2021, states that all employees who were authorized to receive locality pay in 2021 would be reauthorized for 2022 except a certain category of employees at the Department of Veterans Affairs who were at that point covered by a locality pay system under the department’s Title 38 authority and no longer received locality pay under Title 5.
[19]The Non-Foreign Area Retirement Equity Assurance Act of 2009, Pub. L. No. 111-84, tit. XIX, sub tit. B, §§ 1911-1919,123 Stat. 2190, 2619-2627 (2009) authorized locality pay to employees in Senior Executive Service, Senior Level, and Scientific or Professional positions whose official worksites were located in a nonforeign area. Nonforeign areas include states, commonwealths, territories, and possessions of the United States outside the 48 contiguous United States. 5 C.F.R. § 591.205(a).
[20]2024 council members were those appointed as of October 2024. We interviewed seven of the nine 2024 council members or their representatives. One council member said that they did not have enough knowledge of the methodology to give an opinion.
[21]We conducted a literature search of government documents from the previous 5 years to identify proposed alternative methodologies for calculating locality pay. Our search did not identify additional alternatives to those proposed by the Pay Agent and council during that time.
[22]GAO, Federal Workers: Results of Studies on Federal Pay Varied Due to Differing Methodologies, GAO‑12‑564 (Washington, D.C.: June 22, 2012).
[23]The council proposed a similar alternative in 2019 to increase the number of surveyed firms. However, the alternative this council member discussed is distinct and, unlike the 2019 alternative, did not suggest changes to how surveyed firms are selected.
[24]President’s Pay Agent, Report on Locality-Based Comparability Payments for the General Schedule: Annual Report of the President’s Pay Agent for Locality Pay in 2025 (Washington, D.C.: Nov. 27, 2024).