PRIVATE HEALTH INSURANCE
Provider Participation and Payments for Selected Services Before and After the No Surprises Act
Report to Congressional Committees
United States Government Accountability Office
A report to congressional committees
For more information, contact: John E. Dicken at dickenj@gao.gov
What GAO Found
The No Surprises Act, among its provisions, generally prohibits providers from balance billing in certain circumstances—such as emergency services—for individuals with private health insurance. Balance billing is when insured patients receive a bill from an out-of-network health care provider for the amount above any applicable cost-sharing that exceeds the health plan or issuer’s payment. An unexpected balance bill is referred to as a surprise bill.
GAO analyzed the percentage of claims that were in-network for selected specialties to examine potential changes in network participation after the act’s implementation. Increases in the percentage of in-network claims may indicate increases in provider participation, while decreases may indicate reduced participation.
Among specialties likely to be affected by the No Suprises Act protections—emergency medicine, radiology, anesthesiology, and air ambulance—the percentage of in-network claims increased for three of the four specialties after the act took effect. For example, GAO found the percentage of in-network facility claims (typically submitted by hospitals) and professional claims (typically submitted by physicians) for emergency medicine declined before the No Surprises Act took effect, then increased afterward.
Percentage of In-Network Facility (Hospital) and Professional (Physician) Claims for Emergency Medicine, 2019–2023
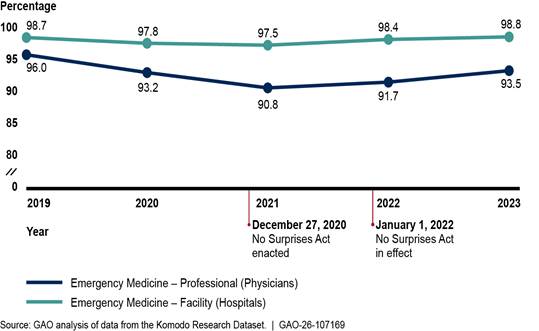
Payment changes for the selected services largely reflected continuations of trends prior to the No Surprises Act taking effect. For example, the inflation-adjusted payment for in-network emergency medicine services billed by facilities increased in 2022 and 2023, continuing the trend since 2019. Meanwhile, the inflation-adjusted payment for in-network emergency services billed by physicians or their practices decreased in 2022 and 2023, continuing previous trends.
Why GAO Did This Study
Health plans or issuers contract with certain providers by negotiating payment rates to create provider networks that serve their patients. In-network providers accept negotiated payment rates (including any applicable patient financial responsibility) as full payment. Providers outside of that network do not have such contracts and have not agreed to a payment rate with the issuer. This can cause financial strain for patients if the providers bill them for the charges exceeding the issuer’s payment.
The No Surprises Act was enacted on December 27, 2020. The act’s protections against surprise bills took effect beginning January 1, 2022.
The Consolidated Appropriations Act, 2021, includes a provision for GAO to review the effects of the No Surprises Act. This report describes (1) changes in network participation, as measured by the percentage of in-network claims billed, for selected provider specialties before and after the No Surprises Act went into effect and (2) changes in payments for selected services before and after the No Surprises Act went into effect.
GAO analyzed a large dataset that included health insurance claims, specifically looking at four specialties most likely to be affected by the No Surprises Act’s prohibition on balance billing. GAO examined trends in in-network claims and payments from 2019 through 2023. GAO also interviewed representatives from 20 stakeholder groups, including specialty provider associations, issuers, and state insurance departments, to discuss changes in network participation and payment rates after the No Surprises Act took effect. The Department of Health and Human Services and Department of Labor provided technical comments, which we incorporated as appropriate.
Abbreviations
CMS Centers for Medicare & Medicaid Services
CPT Current Procedural Terminology
CT computed tomography
HHS Department of Health and Human Services
IDR independent dispute resolution
MRI magnetic resonance imaging
This is a work of the U.S. government and is not subject to copyright protection in the United States. The published product may be reproduced and distributed in its entirety without further permission from GAO. However, because this work may contain copyrighted images or other material, permission from the copyright holder may be necessary if you wish to reproduce this material separately.
February 19, 2026
Congressional Committees
The majority of Americans receive their health coverage through private health plans, either by purchasing health coverage directly or receiving coverage through their employer. In 2023, about 202.3 million people—around 61.3 percent of the U.S population—were insured through private health plans, according to the National Center for Health Statistics.[1]
When a patient’s private insurance does not fully pay for a health care service, and the health care provider bills the unpaid portion to the patient, this practice is called balance billing. More specifically, balance billing occurs when a health care provider who does not contract with the patient’s health plan or issuer (known as an out-of-network provider) bills the patient for costs above any applicable cost-sharing, such as co-payments.[2] When a balance bill is unexpected, it is referred to as a surprise bill. Patients may receive a surprise bill from an out-of-network provider for services rendered in situations where patients generally do not have a choice of provider, such as emergency care. In one study, 18 percent of emergency room visits by people with large employer health coverage in 2017 had at least one out-of-network charge associated with the visit.[3] Surprise billing may create a significant financial strain for patients.
In an effort to protect patients from surprise bills, the No Surprises Act was enacted in December 2020 as part of the Consolidated Appropriations Act, 2021.[4] The No Surprises Act protections went into effect beginning on January 1, 2022, and address gaps in existing state laws by extending surprise billing protection for certain health plans and services.[5] For individuals with private health insurance, the No Surprises Act—among its provisions—generally prohibits health care providers from sending surprise bills for:
· Emergency services, including post-stabilization services, from out-of-network emergency departments and from out-of-network emergency medicine physicians working at an in-network or out-of-network emergency department.
· Non-emergency items or services furnished by out-of-network providers at certain in-network health care facilities. Examples include an out-of-network anesthesiologist’s or radiologist’s services provided to a patient during a stay at an in-network hospital.
· Air ambulance services furnished by out-of-network providers.
The Consolidated Appropriations Act, 2021, includes a provision for us to review the effects of the No Surprises Act on provider network participation and payment rates.[6] In this report, we describe
1. changes in network participation, as measured by the percentage of in-network claims billed, for selected provider specialties before and after the No Surprises Act went into effect and
2. changes in payments for selected services before and after the No Surprises Act went into effect.
For both reporting objectives, we analyzed the Komodo Research Dataset, which includes health insurance claims for more than 110 million patients per year. We examined calendar years 2019 through 2023, which allowed us to analyze trends for 3 years before and 2 years after the act went into effect to assess trends over time. Our analysis examined health insurance claims for private health plans, including group and individual plans.[7] We analyzed claims data for adults ages 18 through 64 in the 50 states and the District of Columbia.
We examined the percentage of in-network claims as a proxy for provider network participation in issuers’ networks. Increases in the percentage of in-network claims may indicate increases in provider participation, while decreases may indicate reduced provider participation.[8] To narrow our analysis, we chose four provider specialties that are among the most likely to be affected by the No Surprises Act protections: emergency medicine, radiology, anesthesiology, and air ambulance. We selected these specialties based on (1) references to certain specialties in the text of the No Surprises Act and (2) inclusion among the specialties with the highest numbers of payment determinations in the Centers for Medicare & Medicaid Services (CMS) data on the independent dispute resolution (IDR) process.[9] We first identified claims based on whether they contained a service related to one of our selected specialties. We limited the claims we included for emergency medicine, radiology, and anesthesiology by provider type (e.g., radiologist)—and when applicable—place of service (e.g., emergency room or outpatient hospital), focusing on the places of services where at least 10 percent of services were rendered by that specialty and that are affected by the No Surprises Act protections. We also selected four provider specialties unlikely to be affected by the No Surprises Act, such as family medicine, to use as comparison groups.
To describe changes in payments for selected services before and after the No Surprises Act protections went into effect, we selected specific services in each of the provider specialties in our review, based on the claims identified in the network participation analysis. We chose services that generally accounted for large number of expenditures in the claims data. We then analyzed in-network payment rates for services by provider specialty and places of service. For providers of emergency medicine, radiology, and anesthesiology services, we analyzed the payment for a weighted basket of services—a set of services that we examined over time—and adjusted payments for inflation to 2023 dollars.[10] For air ambulance providers, we examined payment rates for plane and helicopter transports, which are fixed service level charges. We did not analyze associated per mileage charges. We also analyzed changes in the proportion of out-of-network services where the issuer did not pay any portion of the bill—referred to as a $0 payment—and compared them to changes in the proportions of in-network services with a $0 payment.
To assess the reliability of the data, we interviewed Komodo Health officials about their data, reviewed relevant documentation, and conducted electronic tests of the data. We determined that the data were sufficiently reliable to provide descriptive statistics on national-level changes in the percentage of in-network claims and payment rates for selected services before and after the No Surprises Act protections went into effect. Limitations of our analysis include that (1) we cannot attribute any changes specifically to the No Surprises Act because other factors, such as the COVID-19 pandemic and health care market conditions, may have affected the percentage of in-network claims and payment rates over this time period, and (2) although the dataset includes some large U.S. issuers and several regional issuers, our results are not generalizable to the entire private market. Furthermore, we determined that we did not have the largest issuers for some states and therefore did not report at the state or local level. See appendix I for more details on the scope and methodology of these analyses.
In addition to the data analysis, we obtained selected stakeholders’ perspectives regarding changes in network participation and payment rates before and after implementation of the No Surprises Act protections. Specifically, we interviewed or received written responses from representatives of a nongeneralizable selection of 15 stakeholder groups: nine provider associations, two issuer associations, and four issuers.[11] We selected five provider associations that represent the specialties likely affected by the No Surprises Act, are national in scope, and have published information on the No Surprises Act. Additionally, we contacted four specialty provider associations to confirm that those specialties are not affected by the No Surprises Act protections.[12] We chose issuers to interview based on market share in the private health insurance market as well as representation in IDR dispute data. We further reviewed documentation shared with us by stakeholders, such as member surveys administered by both provider associations and issuer associations on the effects of the No Surprises Act. We interviewed these stakeholders from January through August of 2024 and contacted most of them again in June and July of 2025.
We also interviewed officials from state insurance departments in five selected states to (1) examine whether they were aware of changes in network participation and payment rates in their states after implementation of the No Surprises Act and (2) identify any concerns they had regarding changes to provider network participation and payment rates.[13] We selected states based on criteria including variation in geographic location, whether the state has its own surprise billing protections, and the extent to which the state collects information on changes in issuer provider networks. For the states with prior surprise billing protections, we also reviewed documentation from these states related to evaluating the effects of their state law, including on provider network participation and payment rates.
We conducted this performance audit from November 2023 to February 2026 in accordance with generally accepted government auditing standards. Those standards require that we plan and perform the audit to obtain sufficient, appropriate evidence to provide a reasonable basis for our findings and conclusions based on our audit objectives. We believe that the evidence obtained provides a reasonable basis for our findings and conclusions based on our audit objectives.
Background
Network Participation and Payment Rates
Issuers contract with providers by negotiating payment rates to create provider networks—physicians, hospitals, and other health care providers—to serve their patients. Contracted providers that participate in an issuer’s network—called in-network providers—accept negotiated payment rates with the issuer as full payment. Providers outside of that network—called out-of-network providers—do not have such contracts and have not agreed to a payment rate with the issuer. Instead, the issuer makes a determination of the payment rate based on its policy for paying for out-of-network services. Research has shown out-of-network payments—when claims are not denied—are generally higher than in-network payments, and that these higher out-of-network payments may influence contract negotiations over in-network payments.[14]
Research has also shown that participation in issuers’ provider networks and the prevalence of out-of-network billing varies by provider specialty and place of service, among other factors.[15] When considering whether to join an issuer’s network, providers may consider the potential of increased patient referrals, and the payment rate compared to the uncertainty of payment when out-of-network. However, certain providers—such as emergency medicine physicians—may have fewer reasons to contract with issuers because they would be less likely to receive an increase in the number of patients in exchange for lower payment rates. Patients generally do not control the circumstances under which they seek care from such providers, making it unlikely that the number of patients these providers treat will increase if they contract with a specific issuer.
No Suprises Act
The No Surprises Act generally prohibits health care providers from sending surprise bills for certain out-of-network emergency, non-emergency, and air ambulance services (see fig. 1 for example scenarios covered by the No Surprises Act). The act also established the federal IDR process, which allows issuers and out-of-network health care providers to resolve certain disputes regarding out-of-network payment rates through an arbitration process without involving the patients.[16] The third-party arbitrator that makes a payment determination through the IDR process must consider various factors in making a payment determination.
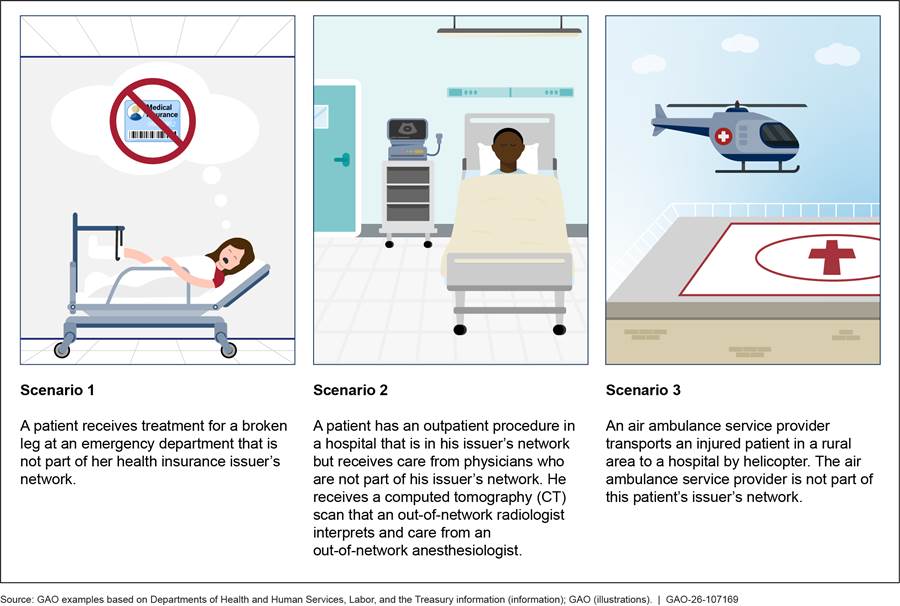
Notes: In these situations, the No Surprises Act generally limits the amount patients pay for care and specifies a process to be used to determine how much health plans or issuers must pay out-of-network providers if the provider and issuer cannot come to agreement on their own.
The No Surprises Act was enacted on December 27, 2020, and took effect on January 1, 2022. Pub. L. No. 116-260, div. BB, tit. I, 134 Stat. 1182, 2757 (2020) (codified at 42 U.S.C. § 300gg-111).
The act’s prohibition on surprise billing and its process to address payment disputes between issuers and providers could affect contracting dynamics and network participation. If the act contributes to lower out-of-network payments, issuers may, in turn, offer lower in-network payment rates when negotiating contracts with providers. Furthermore, if the act leads to higher payments for out-of-network providers, providers may lack incentives to become part of issuers’ networks. Both scenarios could lead to narrower provider networks, which could make patient access to in-network care more challenging and leave patients to receive more costly out-of-network care. Alternatively, providers’ inability to balance bill patients for certain services may make them more likely to participate in issuers’ networks.
Provider Specialties in Our Review
The No Surprises Act protections target services that are likely to be billed out-of-network and potentially lead to a patient receiving a surprise bill. Among the specialties most likely to be affected are emergency medicine, radiology, anesthesiology, and air ambulance. See table 1 for more information on the provider specialties, description of services, claim types, and places of service in our review.
|
Provider specialty |
Description of services |
Claim types and places of service |
|
Emergency medicine |
Evaluation, stabilization, and disposition of patients with various medical needs, including response to acute illness and injury. |
Emergency medicine services typically generate (1) a facility claim that covers the equipment, building costs, nurses, and other costs associated with running an emergency department and (2) a professional claim from the physician or their practice. Many emergency departments contract with physician staffing organizations rather than directly employ the physicians that staff the emergency department. Professional claims for emergency services state the place of service where the physician rendered services. Emergency services are commonly performed in emergency rooms. |
|
Radiology |
Use of imaging technology to diagnose and treat disease. Diagnostic radiology involves interpreting imaging procedures such as magnetic resonance imaging (MRI), computed tomography (CT), and X-rays to diagnose and manage patients and provide therapeutic options. Breast mammography uses X-rays to detect and evaluate breast cancer. |
Radiology services can generate two types of claims: (1) a facility claim for the performance of the test and (2) a professional claim for the radiologist to interpret the images. Radiology services can be performed in various places of service, including outpatient hospitals and emergency departments. |
|
Anesthesiology |
Care provided to a patient before, during, and after a surgical, diagnostic, or therapeutic procedure to limit pain. Such care includes preparing for such procedures, monitoring during them, and postoperative care. |
Anesthesiology services typically generate professional claims billed by the physician or certified registered nurse anesthetist rendering the service. Anesthesiology services can be performed in various places of service, including inpatient hospitals, outpatient hospitals, and ambulatory surgical centers.a |
|
Air ambulance |
Use of either a helicopter or airplane to transport critically ill or injured patients to or between different sites. For example, an air ambulance may transport a patient from a scene of an accident to a hospital. Air ambulance services generally include a transport service and per mile rate. |
Air ambulance services most often generate professional claims.b Various entities such as privately-owned air ambulance companies, hospitals, or health-systems may provide such services. |
Source: GAO (analysis); American Medical Association and provider association information (description of services), claim types and providers (Komodo Research Database). | GAO‑26‑107169
aAmbulatory surgical centers focus on providing same-day surgical care, including diagnostic and preventive procedures.
bHospital- or health system-affiliated air ambulance services may elect to submit either facility or professional claims; however, most air ambulance claims are submitted as professional claims.
In contrast, other provider specialties such as family medicine or dermatology, are less likely to be affected by the No Surprises Act. These are generally specialties where the patient can choose the provider. Patients typically choose providers within their issuer’s provider network to avoid incurring additional costs.[17]
Percentage of In-Network Claims Increased for Three of Four Selected Provider Specialties After the No Surprises Act
Changes in Percentage of In-Network Claims for Selected Provider Specialties Have Been Mostly Modest
We examined in-network private health insurance claims from 2019 through 2023 and found for three of the four selected specialties—emergency medicine, anesthesiology, and air ambulance—the percentage increased from 2021 to 2023, potentially indicating increases in network participation after the No Surprises Act. Of these three specialties, air ambulance services saw the largest increase in the percentage of in-network claims. While changes overall were mostly modest over these same years, changes were greater for emergency medicine and anesthesiology than for the comparison group of family medicine. Furthermore, any changes in the percentage of in-network claims during this time may be due to factors other than the act, such as the COVID-19 pandemic and consolidation in the health care market.[18]
Emergency Medicine
|
Emergency Medicine Claims We analyzed approximately 61.5 million emergency medicine claims from 2019-2023: - 44 percent were facility claims. - 56 percent were professional claims typically billed by physicians or their practices. Source: GAO analysis of data from the Komodo Research Dataset. | GAO‑26‑107169 |
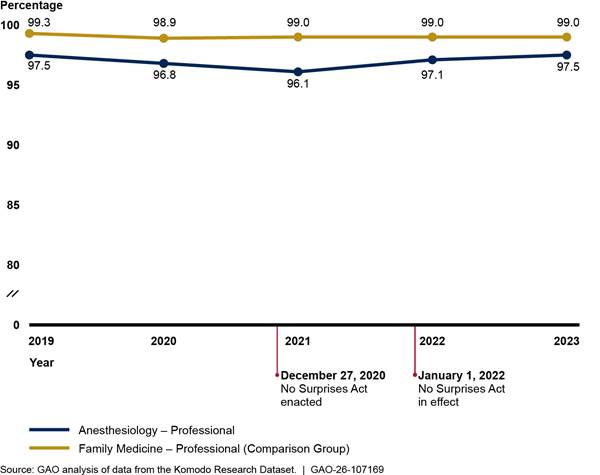
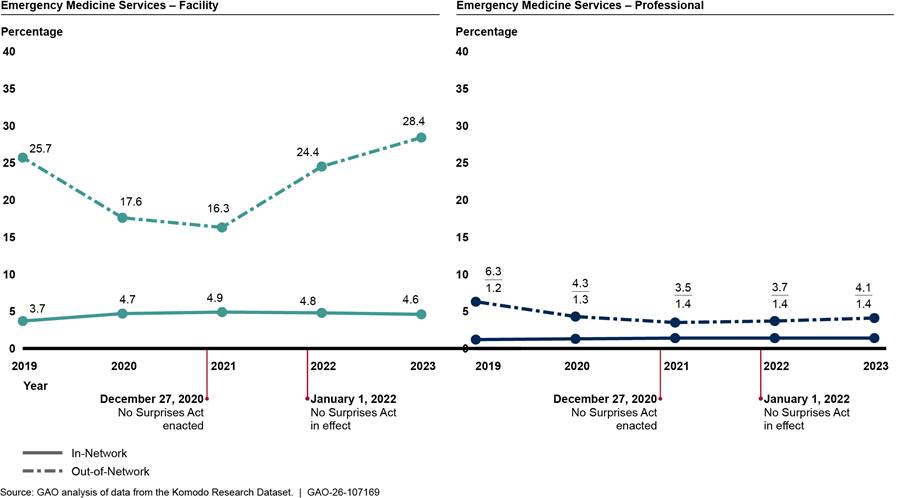
We found that the percentage of in-network facility and professional claims for emergency medicine declined before the No Surprises Act protections went into effect and increased afterward (see fig. 2). Further, facility claims had higher in-network percentages than professional claims, but professional claims experienced greater changes. According to representatives from emergency provider associations, facilities are more likely to be in-network than emergency physicians due to their larger size and ability to negotiate more favorable rates and contract terms across a range of services provided in the facility.[19] Changes in the percentage of in-network claims after the No Surprises Act protections took effect were larger for emergency medicine than for the comparison group—family medicine—though they were still modest, increasing less than 3 percentage points from 2021 to 2023.[20] See appendix II for additional analyses.
Figure 2: Percentage of In-Network Facility and Professional Claims for Emergency Medicine Versus Comparison Group, 2019–2023
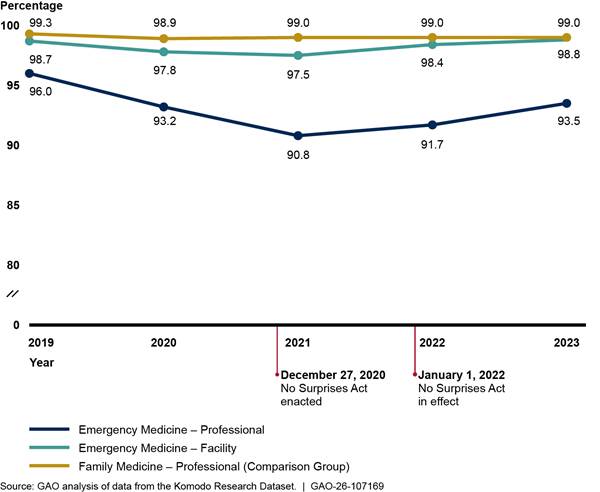
Notes: We analyzed private health insurance claims for services with emergency medicine Current Procedural Terminology codes that were rendered or billed by relevant provider types. For professional emergency medicine claims, we included services with emergency department as the place of service. We also present professional claims for family medicine as a comparison group that is unlikely to be affected by the No Surprises Act. We limited our analysis to claims from issuers that met a minimum threshold for complete network status data. Percentages are unadjusted.
See Pub. L. No. 116-260, div. BB, tit. I, 134 Stat. 1182, 2757 (2020) (codified at 42 U.S.C. § 300gg-111).
Radiology
|
Radiology Claims We analyzed approximately 153 million radiology claims from 2019-2023: - 43 percent were facility claims. - 57 percent were professional claims typically billed by physicians or their practices. Source: GAO analysis of data from the Komodo Research Dataset. | GAO‑26‑107169 |
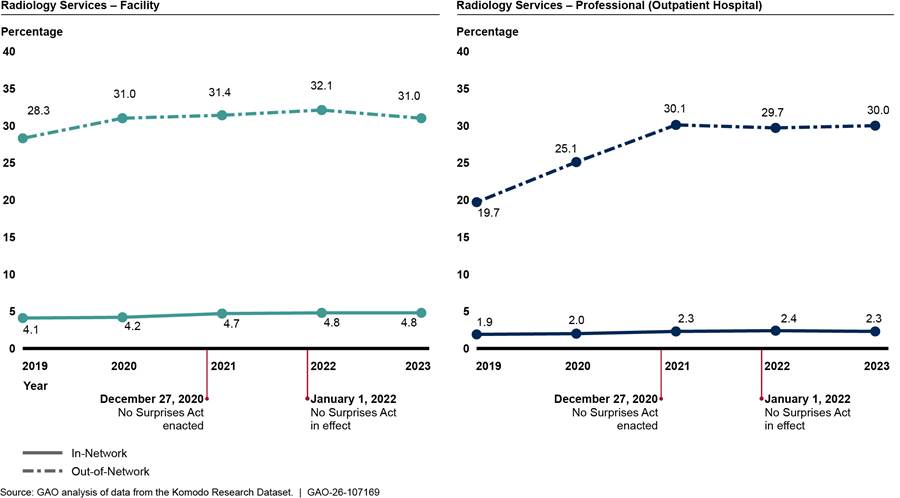
The percentage of in-network facility and professional claims for radiology both remained high and largely unchanged from 2019 through 2023 (see fig. 3). The comparison group of professional family medicine claims remained similarly high and relatively unchanged across the 5 years. See appendix II for additional analyses.
Figure 3: Percentage of In-Network Facility and Professional Claims for Radiology Versus Comparison Group, 2019–2023
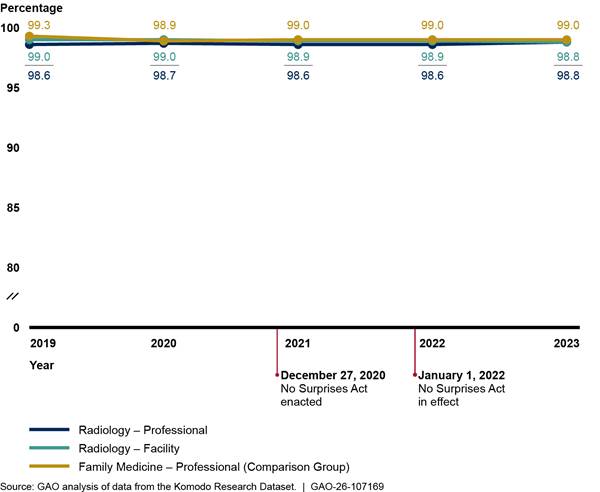
Notes: We analyzed private health insurance claims for services with radiology Current Procedural Terminology codes that were rendered or billed by relevant provider types. For professional radiology claims, we included services with on-campus outpatient hospital or emergency department as the place of service. We also present professional claims for family medicine as a comparison group that is unlikely to be affected by the No Surprises Act. We limited our analysis to claims from issuers that met a minimum threshold for complete network status data. Percentages are unadjusted.
See Pub. L. No. 116-260, div. BB, tit. I, 134 Stat. 1182, 2757 (2020) (codified at 42 U.S.C. § 300gg-111).
We also analyzed these professional radiology claims separately for two common places of service that are affected by the No Surprises Act: outpatient hospitals and emergency departments.[21] The percentage of in-network professional claims for radiology remained high and largely unchanged from 2019 through 2023 for both places of service. See appendix II for more details.
Anesthesiology
|
Anesthesiology Claims We analyzed approximately 18 million professional anesthesiology claims from 2019-2023. Professional claims, typically billed by physicians and certified registered nurse anesthetists or their practices, represent most (98 percent) anesthesiology claims in our dataset. Source: GAO analysis of data from the Komodo Research Dataset. | GAO‑26‑107169 |
We found that the percentage of in-network professional anesthesiology claims declined slightly before the No Surprises Act protections went into effect and then increased afterward (see fig. 4). In comparison, the percentage of in-network professional claims for family medicine remained relatively unchanged over the period we reviewed. See appendix II for additional analyses.
Figure 4: Percentage of In-Network Professional Claims for Anesthesiology Versus Comparison Group, 2019–2023
Notes: We analyzed private health insurance claims for services with anesthesiology Current Procedural Terminology codes that were rendered or billed by relevant provider types. We included professional claims with inpatient hospital, on-campus outpatient hospital, and ambulatory surgical center as the place of service. We also present professional claims for family medicine as a comparison group that is unlikely to be affected by the No Surprises Act. We limited our analysis to claims from issuers that met a minimum threshold for complete network status data. Percentages are unadjusted.
See Pub. L. No. 116-260, div. BB, tit. I, 134 Stat. 1182, 2757 (2020) (codified at 42 U.S.C. § 300gg-111).
We also analyzed these professional anesthesiology claims separately for three common places of service that are affected by the No Surprises Act: ambulatory surgical centers, inpatient hospitals, and outpatient hospitals.[22] Claims for services in ambulatory surgical centers experienced the largest changes, declining from 96.8 to 94.4 percent in-network between 2019 and 2021 and returning to 96.8 percent in-network by 2023. See appendix II for more details.
Air Ambulance
|
Air Ambulance Claims We analyzed approximately 69,000 professional air ambulance claims from 2019-2023, which represent most (88 percent) of the air ambulance claims in our dataset. Various entities such as privately-owned air ambulance companies, hospitals, or health-systems may provide such services. Source: GAO analysis of data from the Komodo Research Dataset. | GAO‑26‑107169 |
We found that the percentage of in-network professional claims for air ambulance services—including both helicopter and airplane services—changed modestly in the 3 years prior to the No Surprises Act protections taking effect and increased afterward (see fig. 5).[23] We did not compare in-network claims for air ambulance to a comparison group due to the unique nature of air ambulance services. See appendix II for additional analyses.
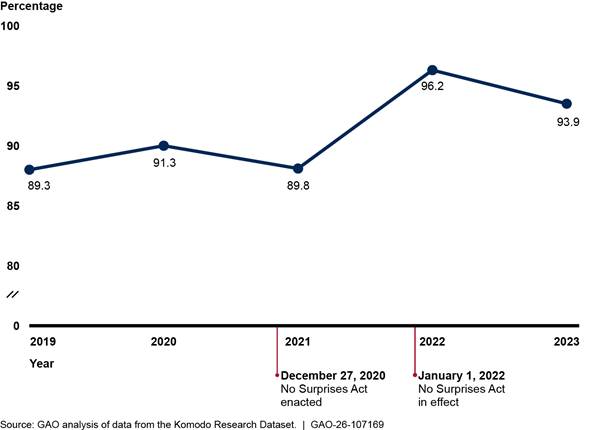
Notes: We analyzed private health insurance claims for services with air ambulance Current Procedural Terminology codes, including both helicopter and airplane services. We limited our analysis to include claims from issuers that met a minimum threshold for complete network status data. Percentages are unadjusted.
See Pub. L. No. 116-260, div. BB, tit. I, 134 Stat. 1182, 2757 (2020) (codified at 42 U.S.C. § 300gg-111).
When examining the change from 2021 to 2022 among professional air ambulance claims, we found that two issuers experienced 24 and 34 percentage point increases in in-network claims between these 2 years (see appendix II for additional analysis).[24] Representatives from one of these issuers told us they had contracted with two of the three large air ambulance providers in the country, leading to a large increase in network participation for these services.
Stakeholders’ Perspectives Varied on the Effect of the No Surprises Act on Network Participation
We found that perspectives on changes in network participation after the act’s protections went in effect varied across stakeholder groups. While provider associations said network participation had likely remained the same or decreased, issuers said participation likely stayed the same or increased. Further, officials from selected state insurance departments said they had not observed decreases in network participation in their states after the act went into effect.
Specialty provider associations: Representatives from all five provider associations for the selected specialties in our review told us that network participation for their specialties had likely remained the same or declined after the No Surprises Act protections went into effect. Representatives from one association told us that no members reported increased network participation after the act went into effect. Furthermore, the association said their members participated in a survey, and more than 80 percent of the survey respondents said they had at least one contract terminated after the No Surprises Act went into effect. However, representatives from a different association noted that contract terminations, while initially a concern, had leveled off for their specialty after the act’s initial implementation period.
Association representatives attributed any declines in network participation for their specialties to the No Surprises Act. Representatives said that after the law’s enactment, issuers were more likely to either (1) terminate contracts with providers or (2) attempt to negotiate lower in-network rates, leading some providers to leave networks.[25] We reviewed seven examples of issuer letters that terminated a provider contract or attempted to negotiate lower in-network rates. One of the seven explicitly mentioned the No Surprises Act.
Issuers: Representatives from the six issuers we interviewed reported either no changes or mostly increases in network participation after the act’s protections went into effect.[26] Specifically, representatives from two issuers told us network participation had mostly remained the same for the selected specialties, and another two issuers’ representatives said their internal data showed network participation had mostly increased across the selected specialties. Furthermore, issuer association representatives cited a survey they conducted that found about two-thirds of issuers reported network participation had increased, while one-third had no changes in network participation.[27] The survey examined overall network participation and did not distinguish by specialty.
Issuer representatives varied in their perspectives as to whether any changes in network participation for the selected specialties were due to the No Surprises Act. For example, representatives from one issuer told us the No Surprises Act had made certain providers more willing to join their networks, while representatives from another issuer said it was difficult to know if any changes were directly tied to the No Surprises Act. Representatives from one issuer noted that there are always changes in network participation but none that they would attribute to the act.
State insurance departments: Officials from four of the five selected state insurance departments said they had not observed decreases in network participation after the act’s implementation, while officials from one department noted their state had experienced increases in participation.[28] Officials from all selected departments said they were not concerned about adverse effects of the No Surprises Act on network participation within their states. Officials from four departments further noted that they had not heard many complaints or concerns about network participation.
Recent reports issued by two of the selected insurance departments with existing state surprise billing protections generally found either no changes or increases in network participation after implementing their state laws. For example, a 2024 Washington state report found there was an increase in the percentage of in-network claims for emergency medicine, radiology, and anesthesiology following implementation of the state law in 2020.[29] A 2024 Texas state report similarly found that the percentage of providers that billed in-network remained flat or increased for emergency physicians, anesthesiologists, and radiologists after the state implemented its law in 2020.[30]
Changes in Payments for Selected Services Varied by Provider Specialty and Place of Service
Payment Changes for Selected In-Network Services After the No Surprises Act Went into Effect Generally Continued Trends from Prior Years
We examined payments for selected in-network services in the four provider specialties—emergency medicine, radiology, anesthesiology, and air ambulance—from 2019 through 2023 and found that changes in these payments after implementation of the No Surprises Act protections varied.[31] In most cases, we found changes in these payments for certain weighted baskets for emergency medicine, radiology, and anesthesiology services were consistent with years prior to when the No Surprises Act protections took effect.[32] We also found that payment rates for air ambulance plane transports decreased after the No Surprises Act protections went into effect, while the payment rates for helicopter transports decreased in 2022, but increased in 2023. Denial rates were higher for services rendered by out-of-network providers from 2019 to 2021, and we found that this pattern continued after the No Surprises Act went into effect.
Emergency Medicine Services
|
Emergency Medicine Services Emergency medicine services are performed in emergency rooms and billed by different providers. We analyzed approximately: $17 billion in-network expenditures for facility services; and $10 billion in-network expenditures for professional services. Source: GAO analysis of data from the Komodo Research Dataset. | GAO‑26‑107169 |
We found that payment trends for in-network emergency medicine services remained relatively unchanged before and after the No Surprises Act protections took effect in 2022. (See fig. 6.) Specifically, payments for services billed by facilities (hospitals) continued to increase, while payments for services billed by professionals (physicians) continued to decrease from 2019 through 2023.[33] Across all years, the payment for the weighted basket of emergency medicine services billed through facility claims increased 12.2 percent, while the payment for the weighted basket of the same emergency services billed through professional claims decreased 20.1 percent.[34] In contrast, the payment for the weighted basket of professional family medicine services—a comparison provider specialty—did not change to the same extent as emergency medicine services. Specifically, the payment for the weighted basket of family medicine services decreased 4.2 percent during these years.[35] See appendix III for information on average payment rates for each emergency medicine service in the weighted baskets.
Figure 6: Payments for Weighted Baskets of Selected In-Network Emergency Medicine Services (Facility and Professional) and Family Medicine Services, 2019–2023
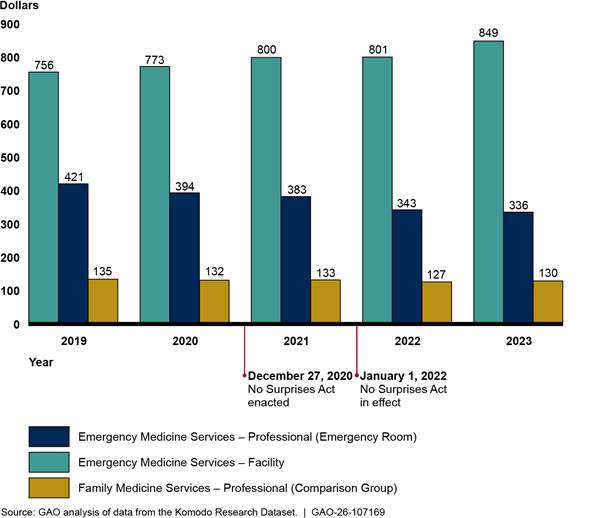
Notes: This figure shows the payments for weighted baskets of emergency medicine services—a measure that accounts for the price of the relative mix of services across time. Each weighted basket is based on the average in-network payment rates for and volume of five emergency medicine evaluation and management services and a critical care service in 2019. Facility charges represent services billed by hospitals, while professional charges are services billed by physicians or their practices. Combined, these services represent approximately $27.0 billion in-network expenditures from 2019 through 2023 in the Komodo Research Dataset. The weighted basket for family medicine services is based on the average in-network payment rates for and volume of five services for office or other outpatient visits for new or established patients. These five services represented approximately $10.4 billion in-network expenditures from 2019 through 2023 in the Komodo Research Dataset. Payments are adjusted for inflation to 2023 dollars.
See Pub. L. No. 116-260, div. BB, tit. I, 134 Stat. 1182, 2757 (2020) (codified at 42 U.S.C. § 300gg-111).
Radiology
|
Radiology Services Radiology services can be performed in various settings and billed by different providers. We analyzed approximately: $8.0 billion in-network expenditures billed by hospitals. $958 million in-network expenditures billed by physicians or their practices in outpatient hospitals. Source: GAO analysis of data from the Komodo Research Dataset. | GAO‑26‑107169 |
We found that payments for weighted baskets of in-network diagnostic radiology services—whether billed through facility claims or professional claims—declined before the implementation of the No Surprises Act and continued to decline in 2022, before increasing in 2023.[36] (See fig. 7.) However, the increases did not bring the payments to 2019 levels. Overall, from 2019 through 2023, payment for the weighted basket of in-network diagnostic radiology services billed through professional claims in outpatient hospitals decreased 9.4 percent, while payment for the weighted basket of in-network diagnostic radiology services billed through facility claims decreased by 2.2 percent. See appendix III for information about average payment rates for each diagnostic radiology service in the weighted baskets and average payment rates for selected breast mammography services.
Figure 7: Payments for Weighted Baskets of Selected In-Network Diagnostic Radiology (Facility and Professional) and Family Medicine Services, 2019–2023
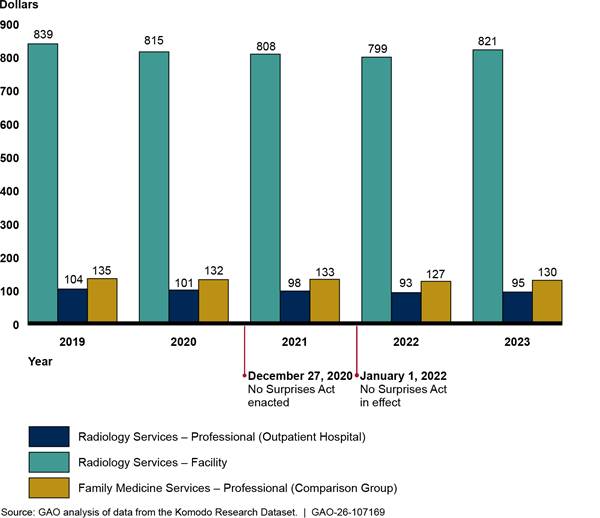
Note: This figure shows the payments for weighted basket of radiology services for facility charges and professional services for images done in outpatient hospital settings. Each weighted basket is based on the average in-network payment rates for and volume of five radiology services in 2019. These services were a computed tomography (CT) scan of the abdomen and pelvis with contrast, CT scan of the abdomen and pelvis without contrast, magnetic resonance imaging (MRI) scan of brain before and after contrast, MRI scan of lower extremity joint without contrast, and an X-ray of the chest (two views). These five services represented approximately $9.0 billion in-network expenditures from 2019 through 2023 in the Komodo Research Dataset. The weighted basket for family medicine services is based on the average in-network payment rates for and volume of five services for office or other outpatient visits for new or established patients. These five services represented approximately $10.4 billion in-network expenditures from 2019 through 2023 in the Komodo Research Dataset. Payment rates are adjusted for inflation to 2023 dollars.
We also analyzed a weighted basket of the same professional radiology services done in emergency rooms and found a similar decrease in payment for the weighted basket of services performed in outpatient hospital departments.
See Pub. L. No. 116-260, div. BB, tit. I, 134 Stat. 1182, 2757 (2020) (codified at 42 U.S.C. § 300gg-111).
Anesthesiology
|
Anesthesiology Services Anesthesiology services can be performed in various settings and billed by different providers. We analyzed approximately: $829 million in-network expenditures for professional services billed by physicians or their practices in inpatient hospitals. $1.4 billion in-network expenditures for professional services billed by physicians or their practices in outpatient hospitals, and $836 million in-network expenditures for professional services billed by physicians or their practices in ambulatory surgical centers. Source: GAO analysis of data from the Komodo Research Dataset. | GAO‑26‑107169 |
Generally, payments for in-network anesthesiology services—in inpatient hospitals, outpatient hospitals, and ambulatory surgical centers—declined both before and after implementation of the No Surprises Act.[37] (See fig. 8.) The one exception was that payment for the anesthesiology weighted basket in ambulatory surgical centers increased slightly in 2023, although not to the level of 2019. Overall, across the places of service, payments for the weighted baskets decreased by 9.0 to 11.9 percent from 2019 through 2023. See appendix III for information about average payment rates for specific anesthesiology services in the weighted baskets.
Figure 8: Payments for Weighted Baskets of Selected In-Network Anesthesiology (Professional—Inpatient Hospital, Outpatient Hospital, Ambulatory Surgical Centers) and Family Medicine Services, 2019–2023
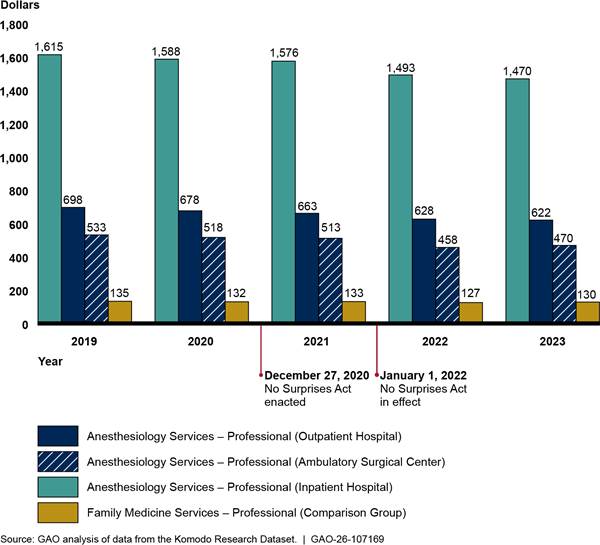
Notes: This figure shows the payments for weighted basket of anesthesiology services for professional services in inpatient hospitals, outpatient hospitals, and ambulatory surgical centers. Each weighted basket is based on the average in-network payment rate for and volume of five anesthesiology services in 2019. The payment rates were not adjusted for differences in the length of procedures due to differences in how insurers require claims to be submitted.
- For the inpatient hospital weighted basket, services were anesthesia services for: other procedure on brain, extensive surgery on spine, other procedure on upper abdomen, procedure on stomach for weight loss, and other procedure on lower abdomen. These five services represented approximately $829 million in-network expenditures billed through professional claims from physicians or their practices with inpatient hospital as the place of service from 2019 through 2023 in the Komodo Research Dataset.
- For the outpatient hospital weighted basket, services were anesthesia services for: other procedure on esophagus, stomach, or upper small bowel using an endoscope, other procedure on upper abdomen, other procedure on large bowel using an endoscope, exam of colon using an endoscope, and other procedure on lower abdomen. These five services represented approximately $1.4 billion in-network expenditures billed through professional claims from physicians or their practices with outpatient hospital as the place of service from 2019 through 2023 in the Komodo Research Dataset.
- For the ambulatory surgical center weighted basket, services were anesthesia services for: other procedure on esophagus, stomach, or upper small bowel using an endoscope, other procedure on large bowel using an endoscope, exam of colon using an endoscope, procedure on small and large bowel using an endoscope, and other procedure or exam of knee joint using an endoscope. These five services represented approximately $836 million in-network expenditures billed through professional claims from physicians or their practices with ambulatory surgical centers as the place of service from 2019 through 2023 in the Komodo Research Dataset.
The figure also includes a weighted basket of family medicine services based on the average in-network payment rates for and volume of five services for office or other outpatient visits for new or established patients. These five services represented approximately $10.4 billion in-network expenditures from 2019 through 2023 in the Komodo Research Dataset. Payments are adjusted for inflation to 2023 dollars.
See Pub. L. No. 116-260, div. BB, tit. I, 134 Stat. 1182, 2757 (2020) (codified at 42 U.S.C. § 300gg-111).
Air Ambulance
|
Air Ambulance Services Air ambulance services can be billed by entities such as privately-owned air ambulance companies or hospitals. We analyzed approximately $964 million in-network air ambulance expenditures billed through professional claims. Source: GAO analysis of data from the Komodo Research Dataset. | GAO‑26‑107169 |
Trends in average payment rates for in-network air ambulance transports differed somewhat by type of aircraft before and after implementation of the No Surprises Act. Average professional payment rates for airplane transports increased from 2019 through 2021, then decreased in 2022, before increasing in 2023, although not to the level of 2019. Average professional payments for helicopter transports increased in 2019 and 2020, then decreased in 2021 and 2022, before increasing in 2023 to a level slightly more than the 2019 average payment.
Figure 9: Professional Payment Rates for In-Network Air Ambulance Airplane and Helicopter Transport Services, 2019–2023
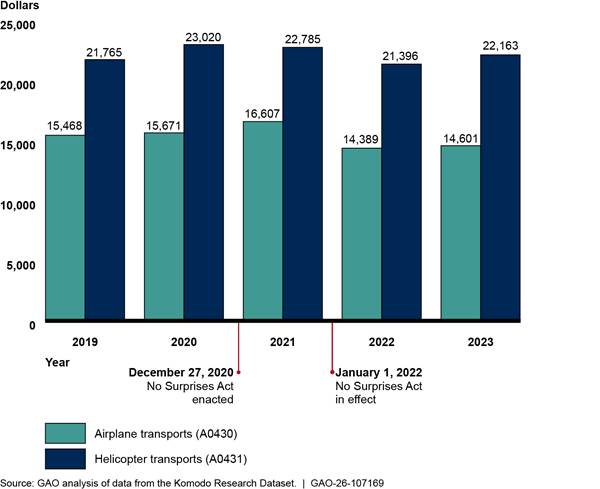
Notes: The figure includes average payment rates for airplane and helicopter transports—Current Procedural Terminology codes A0430 and A0431—billed through professional claims by entities such as privately owned air ambulance companies and does not include services for mileage rates. These services represent approximately $964 million in-network expenditures from 2019 through 2023 in the Komodo Research Dataset. Payment rates are adjusted for inflation to 2023 dollars.
See Pub. L. No. 116-260, div. BB, tit. I, 134 Stat. 1182, 2757 (2020) (codified at 42 U.S.C. § 300gg-111).
Denial of Payments for In- and Out-of-Network Services
Prior to the No Surprises Act’s protections, issuers were more likely to deny claims from out-of-network providers than from in-network providers. We found that the percentages of out-of-network services with $0 payments—meaning that the payments for services were denied—were consistently larger than the percentages of $0 payments for in-network services from 2019 through 2023 across all specialties.[38] This trend was consistent whether services were billed by facilities or by physicians and their practices in different places of service. For example, the percentages of out-of-network emergency medicine services with $0 payments were greater than in-network emergency medicine services with $0 payments, whether billed by facilities or physicians and their practices. (See fig. 10.)
Figure 10: Percentage of Facility and Professional Services with Payments of $0 for In-and Out-of-Network Emergency Medicine, 2019–2023
Notes: These figures include five emergency medicine evaluation and management services of increasing intensity and one critical care service with payments of $0, meaning that payments for the services were denied. Facility charges represent services billed by emergency departments, while professional charges are services billed by physicians or their practices.
See Pub. L. No. 116-260, div. BB, tit. I, 134 Stat. 1182, 2757 (2020) (codified at 42 U.S.C. § 300gg-111).
Similarly, the percentages of selected out-of-network radiology services with $0 payments were always greater than the percentages of such in-network radiology services from 2019 through 2023, whether billed by facilities or physicians and their practices. (See fig.11.)
Figure 11: Percentage of Facility and Professional Services with Payments of $0 for Selected In- and Out-of-Network Diagnostic Radiology, 2019–2023


Notes: These figures include selected radiology services billed by hospitals (facility charges) and those billed by physicians and their practices (professional charges) in a hospital outpatient setting with payments of $0, meaning that the services were denied. These services include a computed tomography (CT) scan of the abdomen and pelvis with contrast, CT scan of the abdomen and pelvis without contrast, magnetic resonance imaging (MRI) scan of brain before and after contrast, MRI scan of the lower extremity without contrast, and an X-ray of the chest (two views).
See Pub. L. No. 116-260, div. BB, tit. I, 134 Stat. 1182, 2757 (2020) (codified at 42 U.S.C. § 300gg-111).
We found similar results for anesthesiology and air ambulance services. See appendix III for information about the percentages of anesthesiology and air ambulance services with $0 payments for in-and out-of-network services.
Stakeholders’ Perspectives Differed on the Effect of the No Surprises Act on Payment Rates
Representatives from the stakeholder organizations we interviewed reported contrasting experiences regarding changes in payment rates for services after the No Surprises Act went into effect. For example, representatives from specialty provider associations said that in-network payment rates for services had remained the same or decreased, while representatives from issuers said that in-network payment rates had increased. State insurance officials said they were generally not aware of changes to payment rates.
Specialty provider associations: Representatives from three specialty provider associations in our review reported that payment rates for in-network services had remained the same or decreased after implementation of the No Surprises Act. Representatives from one association noted that payment rates that remained the same over time were effectively a payment decrease because of inflation and rising expenses. Further, representatives from one provider association stated that the only members who had increased payment rates had the increases previously included in their contracts. Representatives from two provider associations also stated that their members faced pressure from issuers to reduce payment rates to remain in-network.[39]
Representatives from four specialty provider associations also said that out-of-network payments had decreased, which they largely attributed to the No Surprises Act. One specialty provider association claimed that the act’s effects, particularly on smaller and medium sized practices, would increase physician consolidation in the longer term.[40] Representatives from some provider associations believed that certain aspects of the IDR process contributed to these lower payments.[41]
Issuers: Representatives from three issuers reported that in-network payment rates generally increased since the No Surprises Act’s implementation but largely did not attribute these changes specifically to the act. Representatives noted that multiple factors affect payment rates—such as inflation and the COVID-19 pandemic—and that it was difficult to distinguish the No Surprises Act’s effects from other factors.[42] For example, representatives from one issuer reported that in-network payment rate increases of about 1 to 2 percent per year on average were consistent with previous trends. Although the representatives noted that some specialties have seen higher or lower increases, they reported that on average, payment rate increases were within normal ranges.
Representatives from two issuers were concerned about the act’s effects on out-of-network payments. Providers have won a large majority of cases that went through the IDR process, which was established by the No Surprises Act to arbitrate cases where a provider and issuer cannot come to agreement on an out-of-network payment amount. Additionally, according to a 2025 Health Affairs article, the payments awarded to the providers through the process have been relatively high.[43] As a result, two issuers noted that if these higher payments through the IDR process continue, it will contribute to higher health care costs overall. For example, representatives from one issuer noted that if providers continue to receive high reimbursements through the IDR process, in-network providers will ask for higher payments, which in turn, would raise the cost of care.
State insurance departments: Officials from the state insurance departments we interviewed were generally not aware of changes in payment rates related to the No Surprises Act. That is, officials from four states had not heard concerns or complaints from stakeholders about the No Surprises Act’s effects on payment rates within their states. However, one official acknowledged that the department had limited information regarding payment rates.
Agency Comments
We provided a draft of this report to HHS, Department of Labor, Department of the Treasury, and the Office of Personnel Management. HHS and the Department of Labor provided technical comments, which we incorporated as appropriate.
We are sending copies of this report to the Secretaries of Health and Human Services, Labor, and Treasury, the Director of OPM, and other interested parties. In addition, the report will be available at no charge on GAO’s website at http://www.gao.gov.
If you or your staff have any questions about this report, please contact me at DickenJ@gao.gov. Contact points for our Office of Congressional Relations and Office of Public Affairs can be found on the last page of this report. Other major contributors to this report are listed in appendix IV.

John E. Dicken
Director, Health Care
List of Committees
The Honorable Mike Crapo
Chair
The Honorable Ron Wyden
Ranking Member
Committee on Finance
United States Senate
The Honorable Bill Cassidy, M.D.
Chair
The Honorable Bernard Sanders
Ranking Member
Committee on Health, Education, Labor, and Pensions
United States Senate
The Honorable Tim Walberg
Chairman
The Honorable Robert C. “Bobby” Scott
Ranking Member
Committee on Education and Workforce
House of Representatives
The Honorable Brett Guthrie
Chairman
The Honorable Frank Pallone, Jr.
Ranking Member
Committee on Energy and Commerce
House of Representatives
The Honorable Jason Smith
Chair
The Honorable Richard Neal
Ranking Member
Committee on Ways and Means
House of Representatives
In this report, we describe (1) changes in network participation, as measured by the percentage of in-network claims billed, for selected provider specialties before and after the No Surprises Act went into effect and (2) changes in payments for selected services before and after the No Surprises Act went into effect. In December 2020, the Consolidated Appropriations Act, 2021, which included the No Surprises Act, was enacted.[44] The No Surprises Act protections went into effect beginning on January 1, 2022, and address gaps in existing state laws by extending surprise billing protection to certain health plans and services.[45] This appendix provides additional details on the data and methods we used to address our objectives.
We selected four provider specialties that are among the most likely to be affected by the No Surprises Act: emergency medicine, radiology, anesthesiology, and air ambulance. We selected these specialties based on references to certain specialties in the text of the No Surprises Act and their inclusion among the specialties with the highest numbers of payment determinations in the Centers for Medicare & Medicaid Services (CMS) data on the independent dispute resolution (IDR) process established by the No Surprises Act.[46] For comparison purposes, we also selected four provider specialties unlikely to be affected by the No Surprises Act protections: dermatology, family medicine, internal medicine, and orthopedic surgery. We selected these specialties based on multiple factors, including (1) being identified in peer-reviewed academic literature or in the preamble to the No Surprises Act interim final rules as a specialty unlikely to engage in surprise billing and (2) lack of inclusion in CMS’s 2023 IDR public use file reporting on specialties with the highest numbers of IDR payment determinations.[47]
For both objectives, we analyzed data from the Komodo Research Dataset, which includes health insurance claims data for more than 110 million patients per year in our analysis. We examined calendar years 2019 through 2023, which provided 3 years of claims data prior to the law’s protections taking effect—including 1 year prior to the onset of the COVID-19 pandemic—and 2 years after the law went into effect to assess trends over time. Our analysis examined adjudicated claims for private health insurance plans, including group and individual plans, as well as plans offered by Federal Employees Health Benefit Program carriers.[48] We analyzed claims data for adults ages 18 through 64 in the 50 states and D.C. Specifically, we analyzed:
· facility claims for outpatient and ambulatory services. These claims are for facility fees, which may include the cost of infrastructure, equipment, and support staff.
· professional claims for services delivered in various places of service.[49] Professional claims may be for services performed by physicians or physician groups, for example, in an office or in a facility (e.g., inpatient hospital, outpatient hospital, or ambulatory surgical center).
Data Source and Reliability
The Komodo Research Dataset aggregates data from multiple data providers, including from health insurance claims management and revenue cycle management systems.[50] For our analyses, Komodo Health excluded Medicare and Medicaid claims, as these programs are not subject to the No Surprises Act. For years 2019 through 2023, the initial dataset contained approximately 5 billion private health insurance claims.
Health care providers typically submit health insurance claims to health plans or issuers for payment.[51] Claims can have multiple services listed on separate line items, with each service identified by its own code. For our purposes, we used Current Procedural Terminology (CPT) codes. Health insurance claims data provide multiple data points for each claim, including patient information, provider information, type of service provided, and amounts billed and paid for services.
To assess the reliability of the data for purposes of measuring changes in the percentage of in-network claims for selected specialties and payment rates for selected services, we (1) interviewed Komodo Health officials, (2) reviewed relevant documentation, and (3) conducted electronic tests of the data, including testing the completeness and logic of the data for several key variables. To do this testing, we used samples from quarters of two different years (2021 and 2023) due to the large size of the data files.
Two of the key variables for our analysis were network status and allowed amount:
· The network status variable indicates whether services are performed by a provider that is in or out of a patient’s health insurance network for those services.
· The allowed amount indicates the amount the issuer considers full payment or reimbursement as per the contract with the provider or payment policy. It typically includes both the amount the issuer will pay and any patient financial responsibility.
In regard to network status, Komodo Health categorizes network status as In-Network, Very Likely In-Network, Likely In-Network, Out-of-Network, or Unknown.[52] After interviewing knowledgeable Komodo Health officials and reviewing how Komodo assigned these values, we concluded that the Very Likely In-Network and Likely In-Network values could be included as in-network for our analysis.
We limited our analysis to claims from issuers that met a minimum threshold for complete network status data. Specifically, we used a minimum threshold of 90 percent, meaning that at least 90 percent of an issuer’s claims had a non-missing value for network status.
In regard to allowed amounts, we examined the distribution of dollar amounts for selected services and the extent of missing data. We removed missing and negative allowed amounts, and the top and bottom 1 percent of allowed amounts for each service to reduce potential outliers. We also examined modifiers—two-character codes added to CPT codes—to determine whether they were logically associated with specific types of services and determine any effect on reimbursement.[53] We excluded those services where a modifier affected the payment amount. We also reviewed other research on payment rates for emergency medicine services and radiology services, both facility and professional claims.
Overall, we determined that the data were sufficiently reliable to provide national-level descriptive statistics on changes in the percentage of in-network claims for selected provider specialties and payments for selected services before and after the No Surprises Act protections went into effect.
Analysis of Percentage of In-Network Claims
We focus on changes in the percentage of in-network claims as a proxy for changes in provider network participation in plans’ or issuers’ networks.[54] A higher percentage of in-network claims may indicate greater provider participation, while a lower percentage may mean reduced provider participation.
To describe changes in the percentage of in-network claims for selected provider specialties before and after the No Surprises Act protections went into effect, we first identified claims based on whether they contained a service line item with a CPT code related to one of our selected specialties. Health insurance claims can have multiple services listed on separate line items, and each service has its own CPT code. For example, if a claim had a line item with the CPT code for an emergency department visit involving evaluation and management using a high level of decision-making (99285), we marked it for potential inclusion as an emergency service claim. We used the following CPT codes for our selected specialties:
· Emergency medicine services - 99281-99285, 99291
· Radiology services - 70010-79999
· Anesthesiology services - 00100-01999
· Air ambulance services - A0430, A0431, A0435, and A0436
For emergency medicine and radiology, we analyzed both facility claims and professional claims. For anesthesiology and air ambulance services, we present results on only professional claims because most of these services are billed through professional claims.
We limited the claims we included for emergency medicine, radiology and anesthesiology by provider type—and when applicable—place of service. Specifically, we only included claims for services that were performed or billed by a provider with a relevant provider type based on the National Uniform Claim Committee provider taxonomy list.[55] For example, we included claims where an emergency service was provided by an emergency medicine physician or by a hospital that typically provides these services. For professional claims, we focused on places of service where at least 10 percent of services were rendered by that specialty and that are affected by the No Surprises Act protections.[56]
We also limited our analysis to emergency medicine, radiology, and anesthesiology providers that had 10 or more claims with a relevant CPT code per year and to air ambulance providers with three or more claims per year. We did this to focus our analysis on regular providers of these services, rather than outlier cases.
For the comparison groups, we identified commonly billed services for each group. For dermatology, internal medicine, and orthopedic surgery, we identified common services by determining the 25 most billed CPT codes on professional claims—for both office and on-campus outpatient hospital as the place of service—that were associated with a relevant provider type.[57] For family medicine, we identified the 25 most billed CPT codes on professional claims with office as the place of service. We identified claims that were associated with these most commonly billed CPT codes for each group and limited our analysis to only those with a relevant provider type. As with the selected specialties, we also limited claims to providers that had 10 or more claims with a relevant CPT code per year.
We further limited our analysis by:
· Including only issuers that had a minimum of 10,000 claims total across our four selected specialties and that met the 90 percent minimum threshold of complete data for the network status variable.
· Excluding claims with missing or mixed network status.
· Excluding claims with multiple unique billing providers, rendering providers, places of service, or insurance types.
We calculated starting and final claim counts for the four selected provider specialties. Starting claim counts included all professional and facility claims that contained at least one service with a CPT code for the specialty. Final claim counts for the selected specialties included the professional and facility claims remaining after implementing all scoping and analysis decisions. See table 2 below for the starting and final number of claims for each selected specialty.
|
Starting Claim Counts |
|||||||
|
Provider specialty |
Year |
Total |
|||||
|
2019 |
2020 |
2021 |
2022 |
2023 |
|||
|
Emergency Medicine |
28,951,663 |
25,533,118 |
27,808,858 |
28,297,191 |
28,597,392 |
139,188,222 |
|
|
Radiology |
97,501,344 |
86,574,056 |
94,834,567 |
96,320,116 |
98,793,231 |
474,023,314 |
|
|
Anesthesiology |
12,364,000 |
10,957,628 |
12,024,651 |
12,197,848 |
13,104,757 |
60,648,884 |
|
|
Air Ambulance |
27,986 |
30,698 |
36,029 |
37,377 |
37,882 |
169,972 |
|
|
Final Claim Counts |
|||||||
|
Provider specialty |
Year |
Total |
|||||
|
2019 |
2020 |
2021 |
2022 |
2023 |
|||
|
Emergency Medicine |
12,810,749 |
11,648,255 |
11,999,346 |
12,260,249 |
12,854,603 |
61,573,202 |
|
|
Radiology |
31,664,510 |
27,945,426 |
30,108,606 |
31,039,502 |
32,255,552 |
153,013,596 |
|
|
Anesthesiology |
3,964,453 |
3,443,874 |
3,704,715 |
3,723,483 |
3,871,897 |
18,708,422 |
|
|
Air Ambulance |
12,338 |
14,586 |
17,243 |
17,315 |
17,260 |
78,742 |
|
Source: GAO analysis of data from the Komodo Research Dataset. | GAO‑26‑107169
Note: Starting claim counts included all professional and facility claims that contained at least one service with a Current Procedural Terminology code for the specialty. Final claim counts included the professional and facility claims remaining after all scoping and analysis decisions were implemented.
Analysis of Payment Rates
To examine any changes in in-network payment rates for selected services before and after the No Surprises Act protections went into effect, we started with the claims identified in the percentage of in-network claims analysis. We then chose a select number of services (CPT codes) for each specialty to assess in-network payment rates. For emergency services we analyzed five emergency evaluation and management services and one critical care service. (See table 3.)
Table 3: Current Procedural Terminology (CPT) Codes, Description of Selected Emergency Medicine Services, and In-Network Expenditures, 2019–2023
|
CPT code |
Description of service |
Expenditures (in millions of dollars) |
|
99281 |
Emergency department visit for the evaluation and management of a patient that may not require the presence of a physician or other qualified health care professional |
137.6 |
|
99282 |
Emergency department visit for the evaluation and management of a patient which requires a medically appropriate history and/or examination and straightforward medical decision-making. |
657.3 |
|
99283 |
Emergency department visit for the evaluation and management of a patient, which requires a medically appropriate history and/or examination and low level of medical decision-making. |
4,979.4 |
|
99284 |
Emergency department visit for the evaluation and management of a patient, which requires a medically appropriate history and/or examination and moderate level of medical decision-making. |
9,876.2 |
|
99285 |
Emergency department visit for the evaluation and management of a patient, which requires a medically appropriate history and/or examination and high level of medical decision-making. |
10,637.3 |
|
99291 |
Critical care, first 30 to 74 minutes. |
749.4 |
Source: GAO summary of American Medical Association information and analysis of Komodo Research Dataset. | GAO‑26‑107169
Note: Emergency medicine services represent approximately $27.0 billion in-network expenditures billed by facilities or physicians and their practices for 2019 through 2023 in the Komodo Research Dataset. Payments are adjusted for inflation to 2023 dollars.
We selected diagnostic radiology services based on their expenditures in the Komodo data. We focused our selection on diagnostic radiology and breast mammography services because we determined they were associated with more expenditures than other types of radiology services. Within diagnostic radiology services, we chose services to represent a mix of imaging services—magnetic resonance imaging, computed tomography, and X-ray. We also chose breast mammography services representing high expenditures in the places of services we analyzed. (See table 4.)
Table 4: Current Procedural Terminology (CPT) Codes, Descriptions of Selected Diagnostic Radiology and Breast Mammography Services, and In-Network Expenditures 2019–2023
|
CPT code |
Description of service |
Expenditures (in millions of dollars) |
|
Diagnostic radiology services |
||
|
70553 |
Magnetic resonance imaging (MRI) scan of brain before and after contrast |
1,682.0 |
|
71046 |
X-ray of chest, two views |
783.3 |
|
73721 |
MRI scan of lower extremity joint without contrast |
433.2 |
|
74176 |
Computed tomography (CT) scan of abdomen and pelvis without contrast |
1,688.8 |
|
74177 |
CT scan of abdomen and pelvis with contrast |
4,379.5 |
|
Breast mammography services |
|
|
|
77063 |
Screening 3D mammography |
1,019.6 |
|
77067 |
Screening mammography |
3,057.4 |
Source: GAO summary of American Medical Association information and analysis of Komodo Research Dataset. | GAO‑26‑107169
Note: Diagnostic radiology services represent approximately $9.0 billion in-network expenditures and mammography radiology services represented approximately $4.1 billion in-network expenditures billed by facilities or by physicians and their practices in hospital outpatient departments from 2019 through 2023 in the Komodo Research Dataset. Payments are adjusted for inflation to 2023 dollars.
We chose anesthesiology services based on their expenditures in the Komodo data. Because of the variation in the anesthesiology services provided in different settings, we chose services that were among those that comprised the most in-network expenditures in each place of service.[58] (See table 5.)
Table 5: Current Procedural Terminology (CPT) Codes, Descriptions of Selected Anesthesiology Services, and In-Network Expenditures, 2019–2023
|
CPT Code |
Description of Service |
Expenditures (in millions of dollars) |
|
00210 |
Anesthesia for other procedure on brain |
83.4 |
|
00670 |
Anesthesia for extensive surgery on spine |
196.9 |
|
00731 |
Anesthesia for other procedure on esophagus, stomach, or upper small bowel using an endoscope |
384.1 |
|
00790 |
Anesthesia for other procedure on upper abdomen |
485.8 |
|
00797 |
Anesthesia for procedure on stomach for weight loss |
119.3 |
|
00811 |
Anesthesia for other procedure on large bowel using an endoscope |
317.0 |
|
00812 |
Anesthesia for exam of colon using an endoscope |
588.3 |
|
00813 |
Anesthesia for procedure on small and large bowel using an endoscope |
127.7 |
|
00840 |
Anesthesia for other procedure on lower abdomen |
693.4 |
|
01400 |
Anesthesia for other procedure or exam of knee joint using an endoscope |
835.7 |
Source: GAO summary of American Medical Association information and analysis of Komodo Research Dataset. | GAO‑26‑107169
Note: Anesthesiology services represent approximately $3.1 billion in-network expenditures billed by physicians and their practices in inpatient hospitals, outpatient hospital departments, and ambulatory surgical centers from 2019 through 2023 in the Komodo Research Dataset. Payments are adjusted for inflation to 2023 dollars.
We analyzed two air ambulance transport services—airplane transports and helicopter transports. (See table 6.) We limited our analysis to professional claims because they represented most (88 percent) of the air ambulance services.
Table 6: Current Procedural Terminology (CPT) Codes, Descriptions of Selected Air Ambulance Services, and In-Network Expenditures, 2019–2023
|
CPT codes |
Description of service |
Expenditures (in millions of dollars) |
|
A0430 |
Ambulance service, conventional air services, transport, one way (airplane) |
63.0 |
|
A0431 |
Ambulance service, conventional air services, transport, one way (helicopter) |
900.9 |
Source: GAO summary of American Medical Association information and analysis of Komodo Research Dataset. | GAO‑26‑107169
Note: Air ambulance transport services represented approximately $964.0 million in expenditures from 2019 through 2023 in the Komodo Research Dataset. Payments are adjusted for inflation to 2023 dollars.
For the comparison specialties, we selected five services billed by physicians and their practices in offices and five services billed in outpatient hospital departments for each specialty based on expenditures in the Komodo data.[59] (See table 7.)
Table 7: Current Procedural Terminology (CPT) Codes, Descriptions of Selected Comparison Services, and In-Network Expenditures, 2019–2023
|
CPT code |
Description of service |
Expenditures (in millions of dollars) |
|
Dermatology (professional - office) |
||
|
11102 |
Tangential biopsy of skin growth, single lesion |
367.7 |
|
99203 |
New patient office or other outpatient visit, 30-44 minutes |
495.2 |
|
99204 |
New patient office or other outpatient visit, 45-59 minutes |
243.4 |
|
99213 |
Established patient office or other outpatient visit, 20-29 minutes |
916.2 |
|
99214 |
Established patient office or other outpatient visit, 30-39 minutes |
711.9 |
|
Dermatology (professional - outpatient hospital) |
||
|
17311 |
Removal and microscopic exam of growth of head, neck, hands, feet, or genitals |
11.9 |
|
99204 |
New patient office or other outpatient visit, 45-59 minutes |
6.1 |
|
99213 |
Established patient office or other outpatient visit, 20-29 minutes |
12.0 |
|
99214 |
Established patient office or other outpatient visit, 30-39 minutes |
15.7 |
|
88305 |
Pathology examination of tissue using a microscope, intermediate complexity |
11.9 |
|
Family Medicine (professional - office) |
||
|
99204 |
New patient office or other outpatient visit, 45-59 minutes |
444.9 |
|
99213 |
Established patient office or other outpatient visit, 20-29 minutes |
3,156.9 |
|
99214 |
Established patient office or other outpatient visit, 30-39 minutes |
4,458.5 |
|
99395 |
Established patient periodic preventive medicine examination (18-39 years) |
671.2 |
|
99396 |
Established patient periodic preventive medicine examination (40-64 years) |
1,646.7 |
|
Internal Medicine (professional - office) |
||
|
99204 |
New patient office or other outpatient visit, 45-59 minutes |
197.5 |
|
99213 |
Established patient office or other outpatient visit, 20-29 minutes |
1,078.8 |
|
99214 |
Established patient office or other outpatient visit, 30-39 minutes |
1,620.7 |
|
99395 |
Established patient periodic preventive medicine examination (18-39 years) |
335.0 |
|
99396 |
Established patient periodic preventive medicine examination (40-64 years) |
924.8 |
|
Internal Medicine (professional - outpatient hospital) |
||
|
45385 |
Colonoscopy with removal of growths or lesions by snare technique |
12.2 |
|
99213 |
Established patient office or other outpatient visit, 20-29 minutes |
19.5 |
|
99214 |
Established patient office or other outpatient visit, 30-39 minutes |
42.9 |
|
99215 |
Established patient office or other outpatient visit, 40-54 minutes |
11.8 |
|
99223 |
Initial hospital inpatient care per day, typically 70 minutes. |
6.5 |
|
Orthopedic surgery (professional - office) |
||
|
20610 |
Aspiration and/or injection, large joint |
191.3 |
|
99203 |
New patient office or other outpatient visit, 30-44 minutes |
386.9 |
|
99204 |
New patient office or other outpatient visit, 45-59 minutes |
295.3 |
|
99213 |
Established patient office or other outpatient visit, 20-29 minutes |
513.4 |
|
99214 |
Established patient office or other outpatient visit, 30-39 minutes |
444.9 |
|
Orthopedic surgery (professional - outpatient hospital) |
||
|
27130 |
Replacement of thigh bone and hip joint with prosthesis |
191.6 |
|
27447 |
Replacement of knee joint, both sides of knee |
288.1 |
|
29827 |
Arthroscopy with repair of shoulder rotator cuff |
115.4 |
|
29881 |
Arthroscopy with removal of knee cartilage |
106.6 |
|
29888 |
Repair of anterior cruciate ligament of knee using an endoscope |
56.5 |
Source: GAO summary of American Medical Association information and analysis of Komodo Research Dataset. | GAO‑26‑107169
Note: From 2019 through 2023, dermatology services above represented approximately $2.8 billion in-network expenditures, family medicine services above represented approximately $10.4 billion in-network expenditures, internal medicine services above approximately represented $4.3 billion in-network expenditures, and orthopedic surgery services above represented approximately $2.6 billion in-network expenditures in the Komodo Research Dataset. Payments are adjusted for inflation to 2023 dollars.
We examined changes in payments before and after the No Surprises Act protections went into effect in two ways. We adjusted nominal payments to 2023 dollars using the Consumer Price Index All Urban Consumers: Medical Care from the U.S. Bureau of Labor Statistics to account for changes due to inflation. We determined the change in payment for a basket of in-network services for each provider specialty for each year from 2020 through 2023 compared to the payment for the same basket of services in 2019.[60] We developed the baskets of services using the average allowed amount for each service weighted by the volume and proportion of each service within the basket for 2019. For air ambulance providers, we examined payments for plane and helicopter transports, which are fixed service level charges. We did not analyze associated per mileage charges. For both in- and out-of-network services, we determined the proportion of selected services with $0 payments
Key Limitations
Several key limitations of our analyses exist, as summarized below:
· We cannot attribute any changes specifically to the No Surprises Act protections. The COVID-19 pandemic, health care market consolidation, and other factors may have affected the percentage of in-network claims and payments over this time period.
· While the dataset includes some of the largest U.S. issuers as well as several regional issuers, our results are not generalizable to the entire private health insurance market. Results pertain only to the claims and services we analyzed. Accordingly, results may be different using other data or examining other claims and services for other provider specialties. Further, results are not generalizable to public health insurance programs such as Medicare and Medicaid.
· Furthermore, we limited the dataset to include claims for issuers that met a minimum threshold for complete network status data. While we included the same set of issuers across all 5 years, providers could potentially move in and out of our dataset across the years. Such provider movement could influence the results.
· We present results on a nationwide basis. We determined that we did not have the largest issuers for some states and therefore did not report at the state or local level. The results may vary across health care markets. Results could differ according to how much market consolidation has occurred in an area, the relative bargaining position of issuers and providers, and pre-existing conditions in the market.
We describe national-level changes in the percentage of in-network claims for four selected provider specialties among the most likely to be affected by the No Surprises Act protections: emergency medicine, radiology, anesthesiology, and air ambulance. To describe these changes, we analyzed the Komodo Research Dataset for calendar years 2019 through 2023. Our analysis examined health insurance claims data for private health plans, including group and individual plans, as well as plans offered by Federal Employees Health Benefits Program carriers.[61] We analyzed claims data for adults ages 18 through 64 in the 50 states and the District of Columbia.
We provide supplemental data and figures for each specialty below, as well as for comparison groups.
Emergency Medicine
Table 8: Number and Percentage of In-Network and Out-of-Network Emergency Medicine Claims, 2019–2023
|
|
In-Network |
Out-of-Network |
Total Claims |
|||
|
Year |
Claim Type |
Number of claims |
Percentage of claims |
Number of claims |
Percentage of claims |
|
|
2019 |
Facility |
5,580,054 |
98.7 |
70,859 |
1.3 |
5,650,913 |
|
|
Professional |
6,871,977 |
96.0 |
287,859 |
4.0 |
7,159,836 |
|
2020 |
Facility |
4,888,774 |
97.8 |
109,589 |
2.2 |
4,998,363 |
|
Professional |
6,197,751 |
93.2 |
452,141 |
6.8 |
6,649,892 |
|
|
2021 |
Facility |
5,062,690 |
97.5 |
127,776 |
2.5 |
5,190,466 |
|
Professional |
6,184,438 |
90.8 |
624,442 |
9.2 |
6,808,880 |
|
|
2022 |
Facility |
5,263,533 |
98.4 |
86,677 |
1.6 |
5,350,210 |
|
Professional |
6,333,683 |
91.7 |
576,356 |
8.3 |
6,910,039 |
|
|
2023 |
Facility |
5,653,481 |
98.8 |
70,973 |
1.2 |
5,724,454 |
|
Professional |
6,668,257 |
93.5 |
461,892 |
6.5 |
7,130,149 |
|
Source: GAO analysis of data from the Komodo Research Dataset. | GAO‑26‑107169
Note: We analyzed private insurance claims for services with emergency medicine Current Procedural Terminology codes that were rendered or billed by relevant provider types. For professional emergency medicine claims, we included services with emergency departments as the place of service. We limited our analysis to claims from issuers that met a minimum threshold for complete network status data. Percentages are unadjusted.
Figure 12: Percentage of In-Network Emergency Medicine Claims for Group and Individual Plans, and Federal Employees Health Benefits Program Carriers, 2019–2023
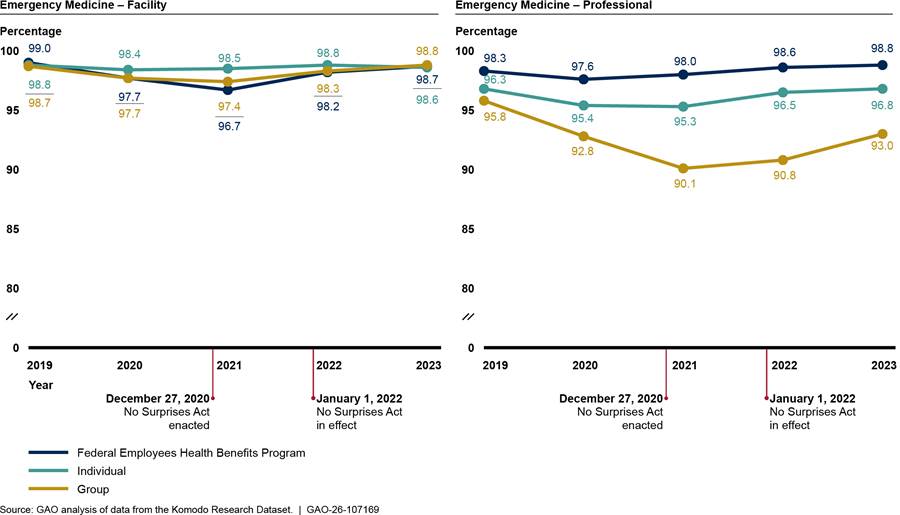
Notes: We analyzed private health insurance claims for services with emergency medicine Current Procedural Terminology codes that were rendered or billed by relevant provider types. For professional emergency medicine claims, we included services with emergency department as the place of service. We limited our analysis to claims from issuers that met a minimum threshold for complete network status data. Percentages are unadjusted.
See Pub. L. No. 116-260, div. BB, tit. I, 134 Stat. 1182, 2757 (2020) (codified at 42 U.S.C. § 300gg-111).
Radiology
|
|
In-Network |
Out-of-Network |
Total Claims |
|||
|
Year |
Claim Type |
Number of claims |
Percentage of claims |
Number of claims |
Percentage of claims |
|
|
2019 |
Facility |
13,521,281 |
99.0 |
139,860 |
1.0 |
13,661,141 |
|
|
Professional |
17,742,836 |
98.6 |
260,533 |
1.4 |
18,003,369 |
|
2020 |
Facility |
11,860,637 |
99.0 |
124,658 |
1.0 |
11,985,295 |
|
Professional |
15,749,906 |
98.7 |
210,225 |
1.3 |
15,960,131 |
|
|
2021 |
Facility |
12,991,760 |
98.9 |
142,399 |
1.1 |
13,134,159 |
|
Professional |
16,744,869 |
98.6 |
229,578 |
1.4 |
16,974,447 |
|
|
2022 |
Facility |
13,296,242 |
98.9 |
153,480 |
1.1 |
13,449,722 |
|
Professional |
17,338,930 |
98.6 |
250,850 |
1.4 |
17,589,780 |
|
|
2023 |
Facility |
14,066,546 |
98.8 |
166,374 |
1.2 |
14,232,920 |
|
Professional |
17,803,271 |
98.8 |
219,361 |
1.2 |
18,022,632 |
|
Source: GAO analysis of data from the Komodo Research Dataset. | GAO‑26‑107169
Note: We analyzed private insurance claims for services with radiology Current Procedural Terminology codes that were rendered or billed by relevant provider types. For professional radiology claims, we included services with on-campus outpatient hospital or emergency department as the place of service. We limited our analysis to include claims from issuers that met a minimum threshold for complete network status data. Percentages are unadjusted.
Table 10: Number and Percentage of In-Network and Out-of-Network Professional Radiology Claims by Place of Service, 2019–2023
|
|
In-Network |
Out-of-Network |
Total Claims |
|||
|
Year |
Place of Service |
Number of claims |
Percentage of claims |
Number of claims |
Percentage of claims |
|
|
2019 |
Emergency Room |
4,261,562 |
98.3 |
72,753 |
1.7 |
4,334,315 |
|
|
On-Campus Outpatient Hospital |
13,481,274 |
98.6 |
187,780 |
1.4 |
13,669,054 |
|
2020 |
Emergency Room |
3,846,856 |
98.5 |
60,293 |
1.5 |
3,907,149 |
|
On-Campus Outpatient Hospital |
11,903,050 |
98.8 |
149,932 |
1.2 |
12,052,982 |
|
|
2021 |
Emergency Room |
3,981,394 |
98.2 |
73,642 |
1.8 |
4,055,036 |
|
On-Campus Outpatient Hospital |
12,763,475 |
98.8 |
155,936 |
1.2 |
12,919,411 |
|
|
2022 |
Emergency Room |
4,275,177 |
98.1 |
80,699 |
1.9 |
4,355,876 |
|
On-Campus Outpatient Hospital |
13,063,753 |
98.7 |
170,151 |
1.3 |
13,233,904 |
|
|
2023 |
Emergency Room |
4,914,494 |
98.4 |
78,777 |
1.6 |
4,993,271 |
|
On-Campus Outpatient Hospital |
12,888,777 |
98.9 |
140,584 |
1.1 |
13,029,361 |
|
Source: GAO analysis of data from the Komodo Research Dataset. | GAO‑26‑107169
Note: We analyzed private insurance claims for services with radiology Current Procedural Terminology codes that were rendered or billed by relevant provider types. For professional radiology claims, we included services with on-campus outpatient hospital or emergency department as the place of service. We limited our analysis to include claims from issuers that met a minimum threshold for complete network status data. Percentages are unadjusted.
Figure 13: Percentage of In-Network Radiology Claims for Group and Individual Plans, and Federal Employees Health Benefits Program Carriers, 2019–2023
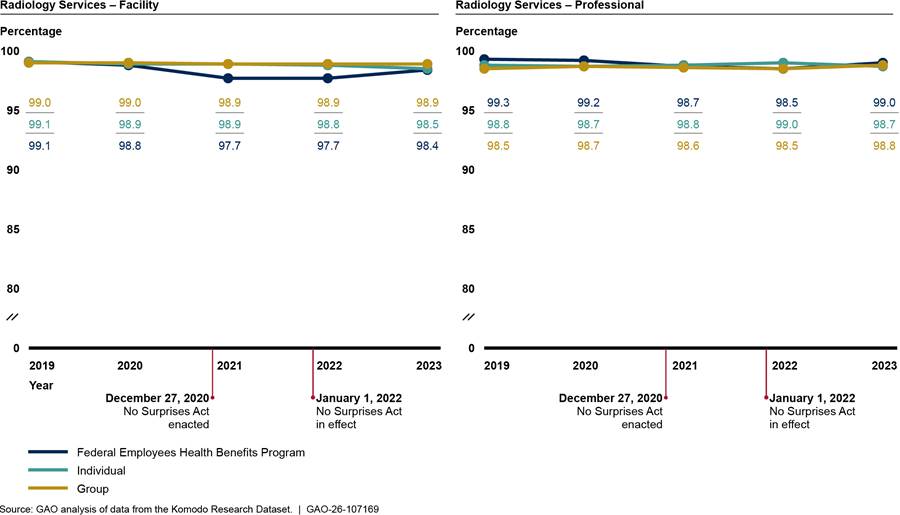
Notes: We analyzed private insurance claims for services with radiology Current Procedural Terminology codes that were rendered or billed by relevant provider types. For professional radiology claims, we included services with on-campus outpatient hospital or emergency department as the place of service. We limited our analysis to include claims from issuers that met a minimum threshold for complete network status data. Percentages are unadjusted.
See Pub. L. No. 116-260, div. BB, tit. I, 134 Stat. 1182, 2757 (2020) (codified at 42 U.S.C. § 300gg-111).
Anesthesiology
Table 11: Number and Percentage of In-Network and Out-of-Network Professional Anesthesiology Claims, 2019–2023
|
|
In-Network |
Out-of-Network |
Total Claims |
|||
|
Year |
Claim Type |
Number of claims |
Percentage of claims |
Number of claims |
Percentage of claims |
|
|
2019 |
Professional |
3,784,270 |
97.5 |
96,147 |
2.5 |
3,880,417 |
|
2020 |
Professional |
3,261,461 |
96.8 |
107,949 |
3.2 |
3,369,410 |
|
2021 |
Professional |
3,481,089 |
96.1 |
142,477 |
3.9 |
3,623,566 |
|
2022 |
Professional |
3,540,196 |
97.1 |
105,438 |
2.9 |
3,645,634 |
|
2023 |
Professional |
3,687,700 |
97.5 |
95,393 |
2.5 |
3,783,093 |
Source: GAO analysis of data from the Komodo Research Dataset. | GAO‑26‑107169
Note: We analyzed private health insurance claims for services with anesthesiology Current Procedural Terminology codes that were rendered or billed by relevant provider types. We included professional claims with inpatient hospital, on-campus outpatient hospital, and ambulatory surgical center as the place of service. We limited our analysis to claims from issuers that met a minimum threshold for complete network status data. Percentages are unadjusted.
Table 12: Number and Percentage of In-Network and Out-of-Network Professional Anesthesiology Claims by Place of Service, 2019–2023
|
|
In-Network |
Out-of-Network |
Total Claims |
||||
|
Year |
Place of Service |
Number of claims |
Percentage of claims |
Number of claims |
Percentage of claims |
|
|
|
2019 |
Ambulatory Surgical Center |
876,990 |
96.8 |
29,103 |
3.2 |
906,093 |
|
|
|
Inpatient Hospital |
955,270 |
97.9 |
20,256 |
2.1 |
975,526 |
|
|
|
On-Campus Outpatient Hospital |
1,952,010 |
97.7 |
46,788 |
2.3 |
1,998,798 |
|
|
2020 |
Ambulatory Surgical Center |
771,020 |
95.8 |
34,219 |
4.2 |
805,239 |
|
|
Inpatient Hospital |
841,737 |
97.3 |
23,278 |
2.7 |
865,015 |
||
|
On-Campus Outpatient Hospital |
1,648,704 |
97.0 |
50,452 |
3.0 |
1,699,156 |
||
|
2021 |
Ambulatory Surgical Center |
872,439 |
94.4 |
51,546 |
5.6 |
923,985 |
|
|
Inpatient Hospital |
804,708 |
96.1 |
32,943 |
3.9 |
837,651 |
||
|
On-Campus Outpatient Hospital |
1,803,942 |
96.9 |
57,988 |
3.1 |
1,861,930 |
||
|
2022 |
Ambulatory Surgical Center |
899,552 |
95.7 |
40,595 |
4.3 |
940,147 |
|
|
Inpatient Hospital |
789,224 |
97.1 |
23,716 |
2.9 |
812,940 |
||
|
On-Campus Outpatient Hospital |
1,851,420 |
97.8 |
41,127 |
2.2 |
1,892,547 |
||
|
2023 |
Ambulatory Surgical Center |
992,334 |
96.8 |
32,738 |
3.2 |
1,025,072 |
|
|
Inpatient Hospital |
791,798 |
97.4 |
21,288 |
2.6 |
813,086 |
||
|
On-Campus Outpatient Hospital |
1,903,568 |
97.9 |
41,367 |
2.1 |
1,944,935 |
||
Source: GAO analysis of data from the Komodo Research Dataset. | GAO‑26‑107169
Note: We analyzed private health insurance claims for services with anesthesiology Current Procedural Terminology codes that were rendered or billed by relevant provider types. We included professional claims with inpatient hospital, on-campus outpatient hospital, and ambulatory surgical center as the place of service. We limited our analysis to claims from issuers that met a minimum threshold for complete network status data. Percentages are unadjusted.
Figure 14: Percentage of In-Network Professional Anesthesiology Claims for Group and Individual Plans, and Federal Employees Health Benefits Program Carriers, 2019–2023
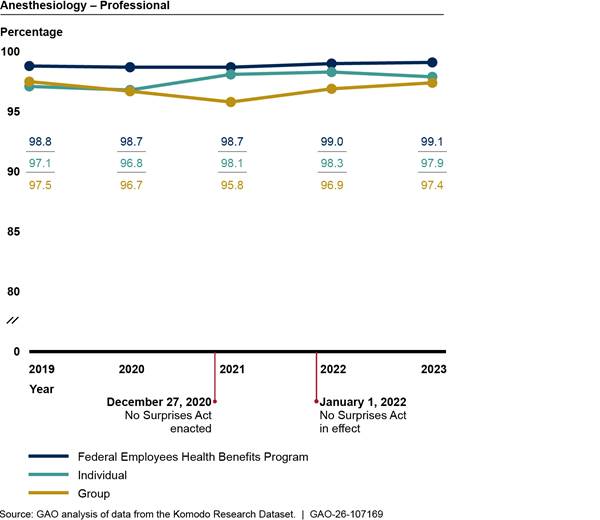
Notes: We analyzed private health insurance claims for services with anesthesiology Current Procedural Terminology codes that were rendered or billed by relevant provider types. We included professional claims with inpatient hospital, on-campus outpatient hospital, and ambulatory surgical center as the place of service. We limited our analysis to claims from issuers that met a minimum threshold for complete network status data. Percentages are unadjusted.
See Pub. L. No. 116-260, div. BB, tit. I, 134 Stat. 1182, 2757 (2020) (codified at 42 U.S.C. § 300gg-111).
Air Ambulance
Table 13: Number and Percentage of In-Network and Out-of-Network Professional Air Ambulance Claims, 2019–2023
|
|
In-Network |
Out-of-Network |
Total Claims |
|||
|
Year |
Claim Type |
Number of claims |
Percentage of claims |
Number of claims |
Percentage of claims |
|
|
2019 |
Professional |
9,298 |
89.3 |
1,109 |
10.7 |
10,407 |
|
2020 |
Professional |
11,544 |
91.3 |
1,105 |
8.7 |
12,649 |
|
2021 |
Professional |
13,665 |
89.8 |
1,559 |
10.2 |
15,224 |
|
2022 |
Professional |
14,966 |
96.2 |
596 |
3.8 |
15,562 |
|
2023 |
Professional |
14,625 |
93.9 |
958 |
6.1 |
15,583 |
Source: GAO analysis of data from the Komodo Research Dataset. | GAO‑26‑107169
Note: We analyzed professional private health insurance claims for services with air ambulance Current Procedural Terminology codes, including both helicopter and airplane services. We limited our analysis to include claims from issuers that met a minimum threshold for complete network status data. Percentages are unadjusted.
Figure 15: Percentage of In-Network Professional Air Ambulance Claims for Group and Individual Plans, 2019–2023
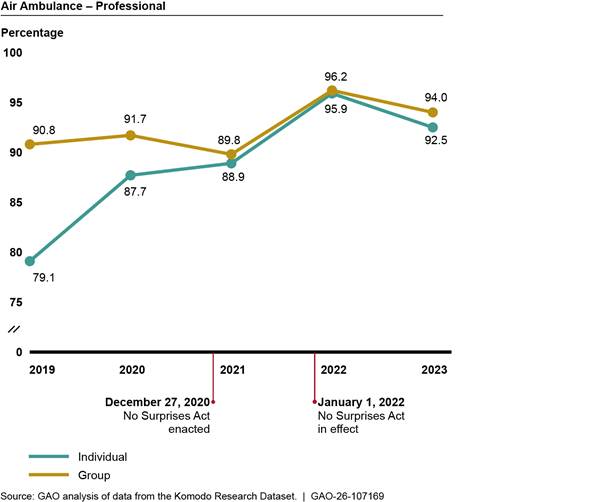
Notes: We analyzed private health insurance claims for services with air ambulance Current Procedural Terminology codes, including both helicopter and airplane services. We limited our analysis to include claims from issuers that met a minimum threshold for complete network status data. Percentages are unadjusted. Claims for Federal Employees Health Benefits Program carriers were omitted due to the low volume of these claims.
See Pub. L. No. 116-260, div. BB, tit. I, 134 Stat. 1182, 2757 (2020) (codified at 42 U.S.C. § 300gg-111).
Figure
16: Percentage of In-Network Professional Air Ambulance Claims for Five Issuers
with Highest Number of Claims, 2019–2023
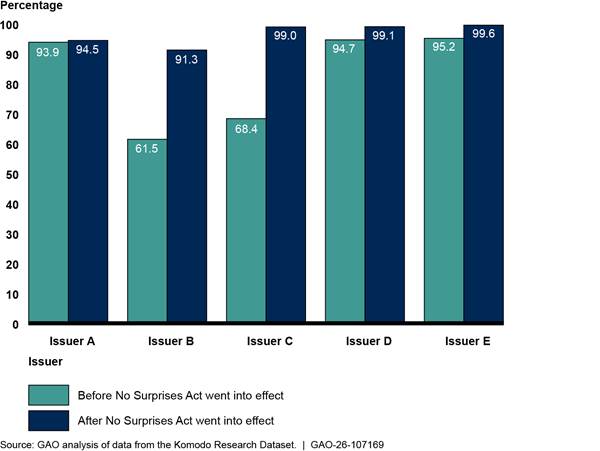
Notes: We analyzed private health insurance claims for services with air ambulance Current Procedural Terminology codes, including both helicopter and airplane services. We present data for the five issuers with the most air ambulance claims in the dataset. We limited our analysis to include claims from issuers that met a minimum threshold for complete network status data. Issuer names are anonymized. Percentages are unadjusted.
See Pub. L. No. 116-260, div. BB, tit. I, 134 Stat. 1182, 2757 (2020) (codified at 42 U.S.C. § 300gg-111).
Comparison Groups
Table 14: Number and Percentage of In-Network and Out-of-Network Professional Claims for Comparison Groups, 2019–2023
|
|
|
In-Network |
Out-of-Network |
Total Claims |
||
|
Year |
Provider specialty |
Number of claims |
Percentage of claims |
Number of claims |
Percentage of claims |
|
|
2019 |
Dermatology |
7,014,069 |
99.0 |
70,024 |
1.0 |
7,084,093 |
|
|
Family Medicine |
25,786,151 |
99.3 |
187,636 |
0.7 |
25,973,787 |
|
|
Internal Medicine |
18,592,111 |
99.0 |
196,216 |
1.0 |
18,788,327 |
|
|
Orthopedic Surgery |
6,576,925 |
98.8 |
78,521 |
1.2 |
6,655,446 |
|
2020 |
Dermatology |
5,949,642 |
99.1 |
56,821 |
0.9 |
6,006,463 |
|
|
Family Medicine |
23,719,964 |
98.9 |
266,776 |
1.1 |
23,986,740 |
|
|
Internal Medicine |
16,392,214 |
99.1 |
153,401 |
0.9 |
16,545,615 |
|
|
Orthopedic Surgery |
5,883,099 |
99.0 |
56,842 |
1.0 |
5,939,941 |
|
2021 |
Dermatology |
6,565,628 |
99.0 |
66,792 |
1.0 |
6,632,420 |
|
|
Family Medicine |
23,510,748 |
99.0 |
241,464 |
1.0 |
23,752,212 |
|
|
Internal Medicine |
16,568,269 |
98.8 |
201,101 |
1.2 |
16,769,370 |
|
|
Orthopedic Surgery |
6,290,330 |
98.9 |
71,561 |
1.1 |
6,361,891 |
|
2022 |
Dermatology |
6,611,267 |
98.9 |
76,774 |
1.1 |
6,688,041 |
|
|
Family Medicine |
24,217,100 |
99.0 |
254,590 |
1.0 |
24,471,690 |
|
|
Internal Medicine |
16,872,724 |
98.7 |
230,817 |
1.3 |
17,103,541 |
|
|
Orthopedic Surgery |
6,038,801 |
98.7 |
79,185 |
1.3 |
6,117,986 |
|
2023 |
Dermatology |
6,528,826 |
99.0 |
66,640 |
1.0 |
6,595,466 |
|
|
Family Medicine |
23,133,727 |
99.0 |
237,057 |
1.0 |
23,370,784 |
|
|
Internal Medicine |
16,773,356 |
98.8 |
209,013 |
1.2 |
16,982,369 |
|
|
Orthopedic Surgery |
5,811,049 |
98.8 |
67,867 |
1.2 |
5,878,916 |
Source: GAO analysis of data from the Komodo Research Dataset. | GAO‑26‑107169
Note: We analyzed professional private health insurance claims for services with common Current Procedural Terminology codes for these comparison groups and rendered or billed by relevant provider types. We limited our analysis to include claims from issuers that met a minimum threshold for complete network status data. Percentages are unadjusted.
We describe changes in the payments of selected in-network services for three selected provider specialties among the most likely to be affected by the No Surprises Act protections: emergency medicine, radiology, and anesthesiology. We also describe changes in payments for selected family medicine services—a comparison provider specialty. To describe these changes, we analyzed the Komodo Research Dataset for calendar years 2019 through 2023.[62] Our analysis examined services from health insurance claims for private health plans, including group and individual plans, as well as plans offered by Federal Employees Health Benefits Program carriers.[63] We analyzed claims data for adults ages 18 through 64 in the 50 states and the District of Columbia. We provide supplemental data and figures for number and average payment rates for selected services for each specialty provider below.
Emergency Medicine:
Figure 17: Average Facility Payment Rates for Selected In-Network Emergency Medicine Services, 2019–2023
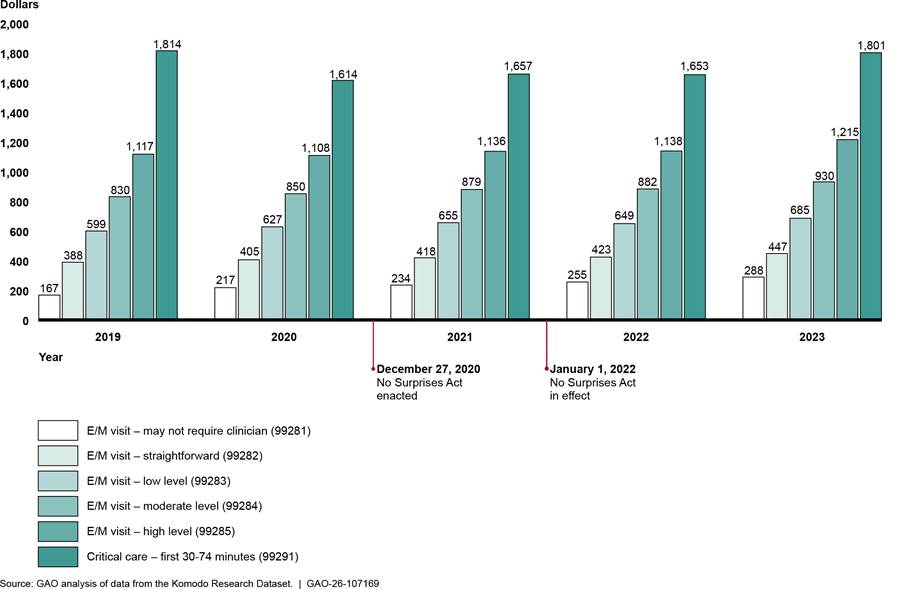
Notes: These five evaluation and management (E/M) services of increasing intensity and a critical care service represent approximately $16.8 billion in expenditures billed through facility claims from 2019 through 2023 in the Komodo Research Dataset. Services are shown with their respective Current Procedural Terminology codes. Payment rates are adjusted for inflation to 2023 dollars.
See Pub. L. No. 116-260, div. BB, tit. I, 134 Stat. 1182, 2757 (2020) (codified at 42 U.S.C. § 300gg-111).
Table 15: Number of and Average Payment Rates for In-Network Facility Emergency Medicine Services, 2019–2023
|
Year |
Current Procedural Terminology code |
Number of services |
Average payment (in dollars) |
|
2019 |
99281 |
165,844 |
167 |
|
|
99282 |
329,633 |
388 |
|
|
99283 |
1,413,709 |
599 |
|
|
99284 |
1,733,210 |
830 |
|
|
99285 |
815,610 |
1,117 |
|
|
99291 |
16,767 |
1,814 |
|
2020 |
99281 |
113,576 |
217 |
|
|
99282 |
284,322 |
405 |
|
|
99283 |
1,214,838 |
627 |
|
|
99284 |
1,479,864 |
850 |
|
|
99285 |
787,609 |
1,108 |
|
|
99291 |
17,309 |
1,614 |
|
2021 |
99281 |
115,504 |
234 |
|
|
99282 |
287,088 |
418 |
|
|
99283 |
1,273,266 |
655 |
|
|
99284 |
1,584,761 |
879 |
|
|
99285 |
820,045 |
1,136 |
|
|
99291 |
18,753 |
1,657 |
|
2022 |
99281 |
107,713 |
255 |
|
|
99282 |
289,806 |
423 |
|
|
99283 |
1,303,262 |
649 |
|
|
99284 |
1,618,660 |
882 |
|
|
99285 |
838,493 |
1,138 |
|
|
99291 |
19,081 |
1,653 |
|
2023 |
99281 |
87,585 |
288 |
|
|
99282 |
269,334 |
447 |
|
|
99283 |
1,213,811 |
685 |
|
|
99284 |
1,586,985 |
930 |
|
|
99285 |
884,237 |
1,215 |
|
|
99291 |
23,098 |
1,801 |
Source: GAO analysis of data from the Komodo Research Dataset. | GAO‑26‑107169
Note: These six services include five evaluation and management visits of increasing decision-making intensity (99281—may not require a clinician; 99282—straightforward, 99283—low level, 99284—moderate level, 99285—high level) and a critical care service (99291—critical care, first 30-74 minutes) which represent approximately $16.8 billion in expenditures billed through facility claims from 2019 through 2023 in the Komodo Research Dataset. Payment rates are adjusted for inflation to 2023 dollars.
Figure 18: Average Professional Payment Rates for Selected In-Network Emergency Medicine Services, 2019–2023
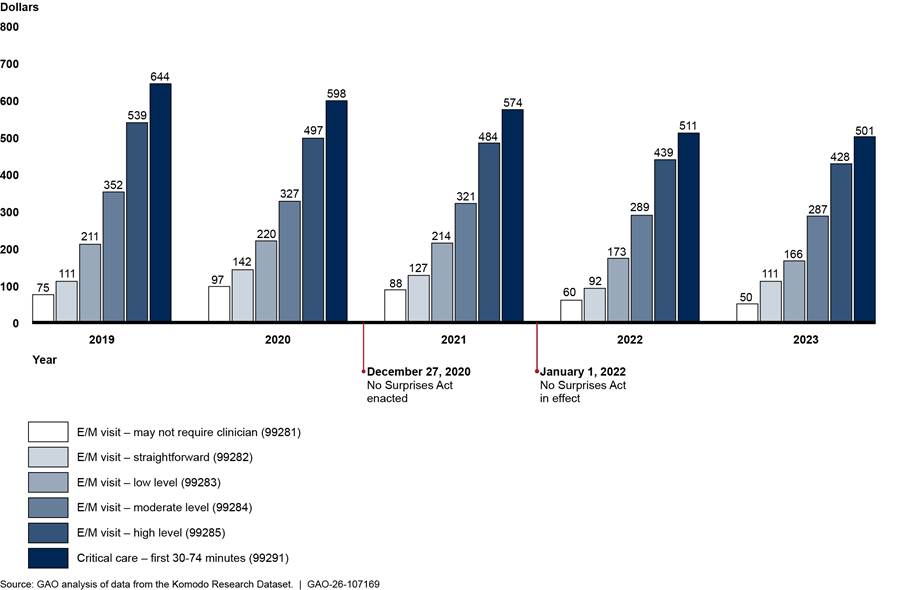
Notes: These five evaluation and management (E/M) services of increasing decision-making intensity and a critical care service represent approximately $10.3 billion in-network expenditures billed through claims from physicians or their practices from 2019 through 2023 in the Komodo Research Dataset. Services are shown with their respective Current Procedural Terminology codes. Payment rates are adjusted for inflation to 2023 dollars.
See Pub. L. No. 116-260, div. BB, tit. I, 134 Stat. 1182, 2757 (2020) (codified at 42 U.S.C. § 300gg-111).
Table 16: Number of and Average Payment Rates for In-Network Professional Emergency Medicine Services, 2019–2023
|
Year |
Current Procedural Terminology code |
Number of services |
Average payment (in dollars) |
|
2019 |
99281 |
14,781 |
75 |
|
|
99282 |
79,703 |
111 |
|
|
99283 |
983,329 |
211 |
|
|
99284 |
1,906,864 |
352 |
|
|
99285 |
2,741,266 |
539 |
|
|
99291 |
190,358 |
644 |
|
2020 |
99281 |
19,156 |
97 |
|
|
99282 |
110,636 |
142 |
|
|
99283 |
965,850 |
220 |
|
|
99284 |
1,577,415 |
327 |
|
|
99285 |
2,430,642 |
497 |
|
|
99291 |
198,690 |
598 |
|
2021 |
99281 |
17,995 |
88 |
|
|
99282 |
91,456 |
127 |
|
|
99283 |
914,868 |
214 |
|
|
99284 |
1,612,948 |
321 |
|
|
99285 |
2,445,591 |
484 |
|
|
99291 |
217,572 |
574 |
|
2022 |
99281 |
16,596 |
60 |
|
|
99282 |
83,121 |
92 |
|
|
99283 |
913,492 |
173 |
|
|
99284 |
1,693,781 |
289 |
|
|
99285 |
2,494,496 |
439 |
|
|
99291 |
206,631 |
511 |
|
2023 |
99281 |
1,475 |
50 |
|
|
99282 |
64,835 |
111 |
|
|
99283 |
512,512 |
166 |
|
|
99284 |
2,396,131 |
287 |
|
|
99285 |
2,168,022 |
428 |
|
|
99291 |
229,490 |
501 |
Source: GAO analysis of data from the Komodo Research Dataset. | GAO‑26‑107169
Note: These six services include five evaluation and management visits of increasing decision-making intensity (99281—may not require a clinician; 99282—straightforward, 99283—low level, 99284—moderate level, 99285—high level) and a critical care service (99291—critical care, first 30-74 minutes) which represent approximately $10.3 billion in-network expenditures billed through claims from physicians and their practices from 2019 through 2023 in the Komodo Research Dataset. Payment rates are adjusted for inflation to 2023 dollars.
Radiology:
Figure 19: Average Facility Payment Rates for Selected In-Network Diagnostic Radiology Services, 2019–2023
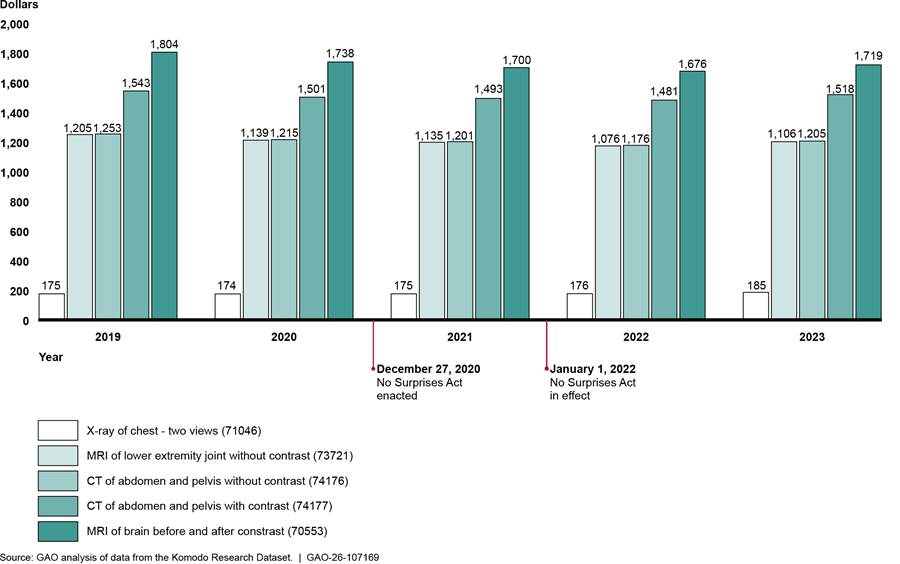
Notes: These computed tomography (CT), magnetic resonance imaging (MRI), and X-ray services represent approximately $8 billion in-network expenditures billed through facility claims in 2019 through 2023 in the Komodo Research Dataset. Services are shown with their respective Current Procedural Terminology codes. Payment rates are adjusted for inflation to 2023 dollars.
See Pub. L. No. 116-260, div. BB, tit. I, 134 Stat. 1182, 2757 (2020) (codified at 42 U.S.C. § 300gg-111).
Table 17: Number of and Average Payment Rates for In-Network Facility Diagnostic Radiology Services, 2019–2023
|
Year |
Current Procedural Terminology code |
Number of services |
Average payment (in dollars) |
|
2019 |
70553 |
175,813 |
1,804 |
|
|
71046 |
1,027,956 |
175 |
|
|
73721 |
63,431 |
1,205 |
|
|
74176 |
269,999 |
1,253 |
|
|
74177 |
537,175 |
1,543 |
|
2020 |
70553 |
156,611 |
1,738 |
|
|
71046 |
748,336 |
174 |
|
|
73721 |
53,273 |
1,139 |
|
|
74176 |
233,739 |
1,215 |
|
|
74177 |
488,749 |
1,501 |
|
2021 |
70553 |
169,467 |
1,700 |
|
|
71046 |
721,461 |
175 |
|
|
73721 |
58,252 |
1,135 |
|
|
74176 |
238,309 |
1,201 |
|
|
74177 |
534,687 |
1,493 |
|
2022 |
70553 |
168,661 |
1,676 |
|
|
71046 |
748,242 |
176 |
|
|
73721 |
56,122 |
1,076 |
|
|
74176 |
288,640 |
1,176 |
|
|
74177 |
516,168 |
1,481 |
|
2023 |
70553 |
167,168 |
1,719 |
|
|
71046 |
720,069 |
185 |
|
|
73721 |
51,395 |
1,106 |
|
|
74176 |
248,541 |
1,205 |
|
|
74177 |
572,250 |
1,518 |
Source: GAO analysis of data from the Komodo Research Dataset. | GAO‑26‑107169
Note: Services were a computed tomography (CT) scan of the abdomen and pelvis with contrast (74177), CT scan of the abdomen and pelvis without contrast (74176), magnetic resonance imaging (MRI) scan of brain before and after contrast (70553), MRI scan of lower extremity joint without contrast (73721), and an X-ray of the chest-two views (71046). These five services represented approximately $8 billion in-network expenditures billed through claims from physicians and their practices from 2019 through 2023 in the Komodo Research Dataset. Payment rates are adjusted for inflation to 2023 dollars.
Figure 20: Average Professional Payment Rates for Selected In-Network Diagnostic Radiology Services—Outpatient Hospital, 2019–2023
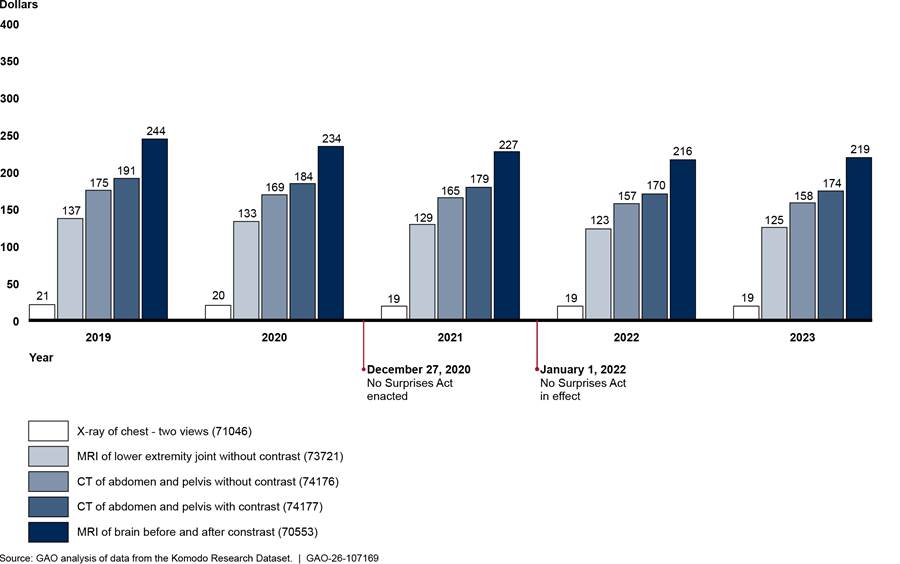
Notes: These computed tomography (CT), magnetic resonance imaging (MRI), and X-ray services represent approximately $958 million in-network expenditures from professional claims billed by physicians and their practices in hospital outpatient departments from 2019 through 2023 in the Komodo Research Dataset. Services are shown with their respective Current Procedural Terminology codes. Payment rates are adjusted for inflation to 2023 dollars.
See Pub. L. No. 116-260, div. BB, tit. I, 134 Stat. 1182, 2757 (2020) (codified at 42 U.S.C. § 300gg-111).
Table 18: Number of and Average Payment Rates for In-Network Professional (Outpatient Hospital) Diagnostic Radiology Services, 2019–2023
|
Year |
Current Procedural Terminology code |
Number of services |
Average payment (in dollars) |
|
2019 |
70553 |
218,907 |
244 |
|
|
71046 |
1,050,565 |
21 |
|
|
73721 |
193,652 |
137 |
|
|
74176 |
178,526 |
175 |
|
|
74177 |
442,091 |
191 |
|
2020 |
70553 |
194,283 |
234 |
|
|
71046 |
823,914 |
20 |
|
|
73721 |
160,278 |
133 |
|
|
74176 |
159,438 |
169 |
|
|
74177 |
411,584 |
184 |
|
2021 |
70553 |
206,341 |
227 |
|
|
71046 |
811,257 |
19 |
|
|
73721 |
175,341 |
129 |
|
|
74176 |
166,138 |
165 |
|
|
74177 |
443,114 |
179 |
|
2022 |
70553 |
206,924 |
216 |
|
|
71046 |
831,571 |
19 |
|
|
73721 |
176,249 |
123 |
|
|
74176 |
197,990 |
157 |
|
|
74177 |
429,834 |
170 |
|
2023 |
70553 |
201,502 |
219 |
|
|
71046 |
730,075 |
19 |
|
|
73721 |
164,382 |
125 |
|
|
74176 |
154,781 |
158 |
|
|
74177 |
418,708 |
174 |
Source: GAO analysis of data from the Komodo Research Dataset. | GAO‑26‑107169
Note: Services were a computed tomography (CT) scan of the abdomen and pelvis with contrast (74177), CT scan of the abdomen and pelvis without contrast (74176), magnetic resonance imaging (MRI) scan of brain before and after contrast (70553), MRI scan of lower extremity joint without contrast (73721), and an X-ray of the chest, two views (71046). These five services represent approximately $958 million in-network expenditures billed through professional claims by physicians and their practices from 2019 through 2023 in the Komodo Research Dataset. Payment rates are adjusted for inflation to 2023 dollars.
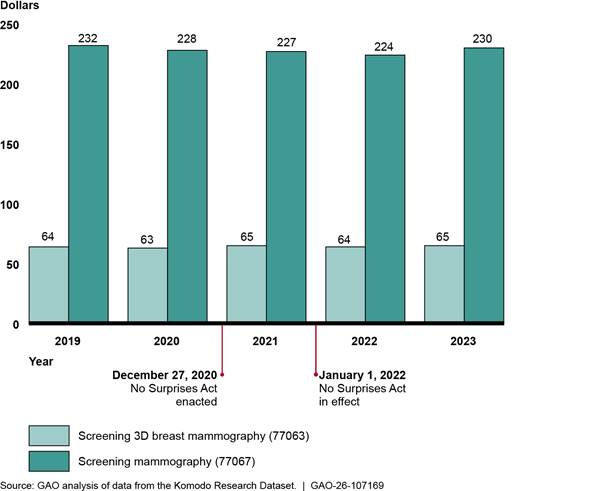
Notes: Screening 3D breast mammography (77063) and screening mammography (77067) represent approximately $2.8 billion in expenditures billed through facility claims from 2019 through 2023 in the Komodo Research Dataset. Services are shown with their respective Current Procedural Terminology codes. Payment rates are adjusted for inflation to 2023 dollars.
See Pub. L. No. 116-260, div. BB, tit. I, 134 Stat. 1182, 2757 (2020) (codified at 42 U.S.C. § 300gg-111).
Table 19: Number of and Average Payment Rates for Selected In-Network Facility Mammography Services, 2019–2023
|
Year |
Current Procedural Terminology code |
Number of services |
Average payment (in dollars) |
|
|
2019 |
77063 |
1,516,068 |
64 |
|
|
|
77067 |
2,146,874 |
232 |
|
|
2020 |
77063 |
1,447,083 |
63 |
|
|
|
77067 |
1,812,165 |
228 |
|
|
2021 |
77063 |
1,724,435 |
65 |
|
|
|
77067 |
2,014,765 |
227 |
|
|
2022 |
77063 |
1,863,672 |
64 |
|
|
|
77067 |
2,074,681 |
224 |
|
|
2023 |
77063 |
1,868,320 |
65 |
|
|
|
77067 |
2,018,789 |
230 |
|
Source: GAO analysis of data from the Komodo Research Dataset. | GAO‑26‑107169
Note: Screening 3D breast mammography (77063) and screening mammography (77067) services represent approximately $2.8 billion in expenditures billed through facility clams from 2019 through 2023 in the Komodo Research Dataset. Payment rates are adjusted for inflation to 2023 dollars.
Figure 22: Average Professional Payment Rates for Selected In-Network Mammography Services—Outpatient Hospital, 2019–2023
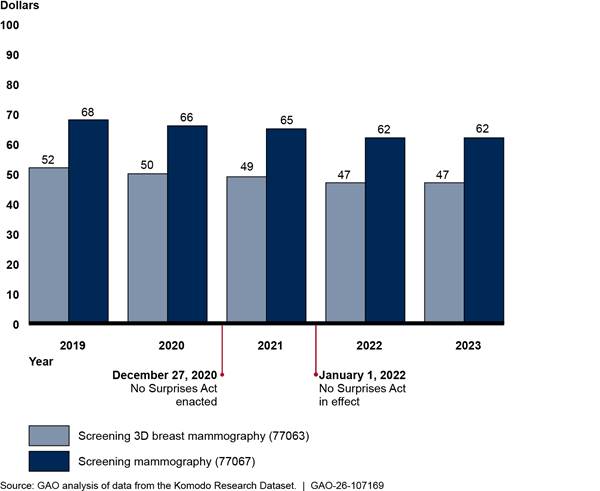
Notes: Screening 3D breast mammography (77063) and screening mammography (77067) services represent approximately $1.2 billion in-network expenditures billed through professional claims by physicians and their practices in hospital outpatient departments from 2019 through 2023 in the Komodo Research Dataset. Services are shown with their respective Current Procedural Terminology codes. Payment rates are adjusted for inflation to 2023 dollars.
See Pub. L. No. 116-260, div. BB, tit. I, 134 Stat. 1182, 2757 (2020) (codified at 42 U.S.C. § 300gg-111).
Table 20: Number of and Average Payment Rates for Selected In-Network Professional (Outpatient Hospital) Mammography Services, 2019–2023
|
|
|
In-Network |
|
|
Year |
Current Procedural Terminology code |
Number of services |
Average payment (in dollars) |
|
2019 |
77063 |
1,744,738 |
52 |
|
|
77067 |
2,501,364 |
68 |
|
2020 |
77063 |
1,702,322 |
50 |
|
|
77067 |
2,151,554 |
66 |
|
2021 |
77063 |
1,955,208 |
49 |
|
|
77067 |
2,291,602 |
65 |
|
2022 |
77063 |
2,197,102 |
47 |
|
|
77067 |
2,454,609 |
62 |
|
2023 |
77063 |
2,176,678 |
47 |
|
|
77067 |
2,338,387 |
62 |
Source: GAO analysis of data from the Komodo Research Dataset. | GAO‑26‑107169
Note: Screening 3D breast mammography (77063) and screening mammography (77067) represent approximately $1.2 billion in expenditures billed through professional claims by physicians and their practices from 2019 through 2023 in the Komodo Research Dataset. Payment rates are adjusted for inflation to 2023 dollars.
Anesthesiology:
Figure 23: Average Payment Rates for Selected In-Network Anesthesiology Services - Professional, Inpatient Hospital Setting 2019–2023
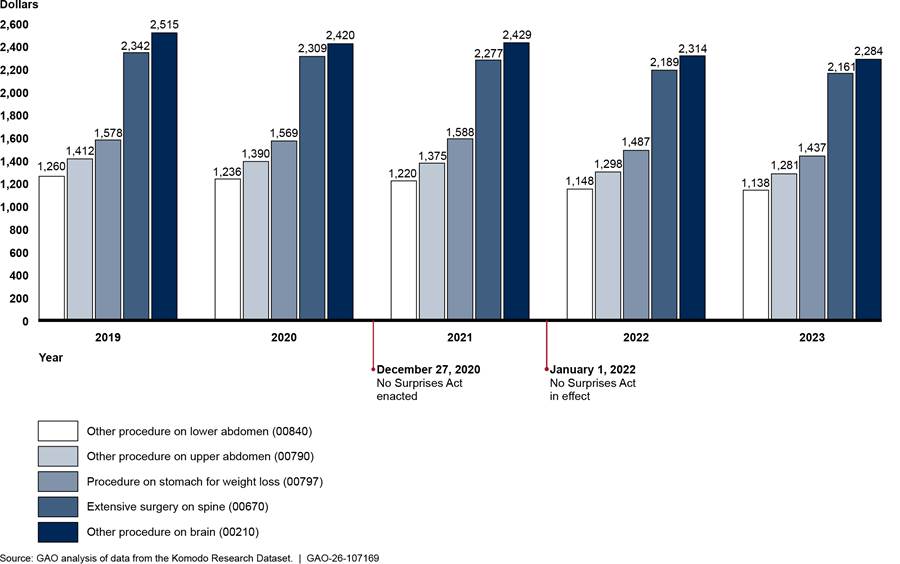
Notes: Anesthesiology payment rates above represent allowed amounts which incorporate, but do not specify, the amount of time a given procedure may take. These five services represent approximately $828.5 million in-network expenditures billed through professional claims from physicians and their practices with inpatient hospital as the place of service from 2019 through 2023 in the Komodo Research Dataset. Services are shown with their respective Current Procedural Terminology codes. Payment rates are adjusted for inflation to 2023 dollars.
See Pub. L. No. 116-260, div. BB, tit. I, 134 Stat. 1182, 2757 (2020) (codified at 42 U.S.C. § 300gg-111).
Table 21: Number of and Average Payment Rates for Selected In-Network Professional (Inpatient Hospital) Anesthesiology Services, 2019–2023
|
Year |
Current Procedural Terminology code |
Number of services |
Average payment (in dollars) |
|
2019 |
00210 |
7,810 |
2,515 |
|
|
00670 |
21,974 |
2,342 |
|
|
00790 |
39,430 |
1,412 |
|
|
00797 |
19,105 |
1,578 |
|
|
00840 |
40,287 |
1,260 |
|
2020 |
00210 |
7,002 |
2,420 |
|
|
00670 |
18,301 |
2,309 |
|
|
00790 |
33,695 |
1,390 |
|
|
00797 |
14,320 |
1,569 |
|
|
00840 |
33,628 |
1,236 |
|
2021 |
00210 |
6,506 |
2,429 |
|
|
00670 |
16,170 |
2,277 |
|
|
00790 |
32,302 |
1,375 |
|
|
00797 |
15,724 |
1,588 |
|
|
00840 |
32,056 |
1,220 |
|
2022 |
00210 |
6,768 |
2,314 |
|
|
00670 |
15,539 |
2,189 |
|
|
00790 |
32,822 |
1,298 |
|
|
00797 |
15,734 |
1,487 |
|
|
00840 |
30,617 |
1,148 |
|
2023 |
00210 |
6,724 |
2,284 |
|
|
00670 |
14,954 |
2161 |
|
|
00790 |
31,889 |
1281 |
|
|
00797 |
12,729 |
1437 |
|
|
00840 |
28,158 |
1138 |
Source: GAO analysis of data from the Komodo Research Dataset. | GAO‑26‑107169
Note: Anesthesiology payment rates above represent allowed amounts which incorporate, but do not specify, the amount of time a given procedure may take. Services were anesthesia for other procedure on brain (00210), anesthesia for extensive surgery on spine (00670), anesthesia for other procedure on upper abdomen (00790), anesthesia for procedure on stomach for weight loss (00797), and anesthesia for other procedure on lower abdomen (00840). These five services represent approximately $828.5 million in-network expenditures billed through professional claims from physicians and their practices with inpatient hospital as the place of service from 2019 through 2023 in the Komodo Research Dataset. Payment rates are adjusted for inflation to 2023 dollars.
Figure 24: Average Payment Rates for Selected In-Network Anesthesiology Services - Professional, Outpatient Hospital Setting 2019–2023
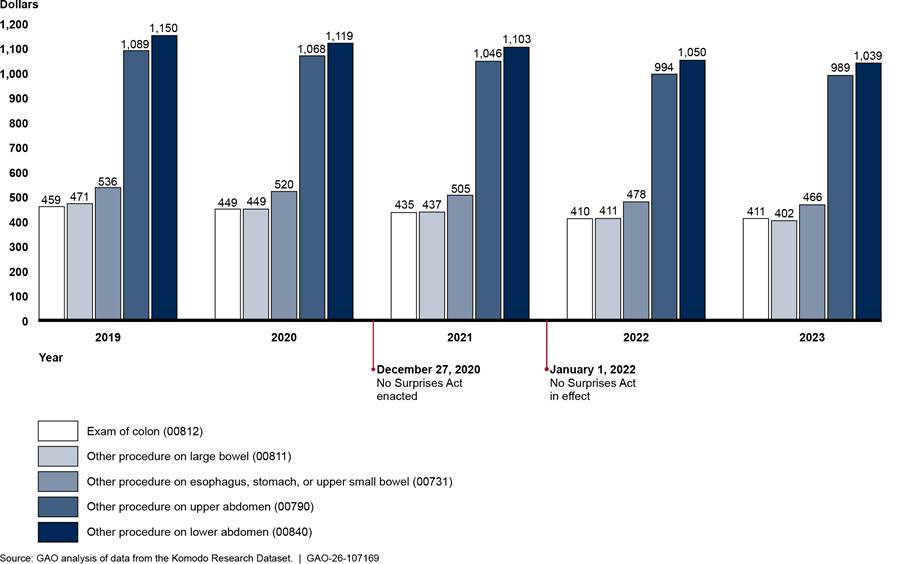
Notes: Anesthesiology payment rates above represent allowed amounts which incorporate, but do not specify, the amount of time a given procedure may take. The five services represent approximately $1.4 billion in-network expenditures billed through professional claims from physicians and their practices with outpatient hospital as the place of service from 2019 through 2023 in the Komodo Research Dataset. Services are shown with their respective Current Procedural Terminology codes. Payment rates are adjusted for inflation to 2023 dollars.
See Pub. L. No. 116-260, div. BB, tit. I, 134 Stat. 1182, 2757 (2020) (codified at 42 U.S.C. § 300gg-111).
Table 22: Number of and Average Payment Rates for Selected In-Network Professional (Outpatient Hospital) Anesthesiology Services, 2019–2023
|
Year |
Current Procedural Terminology code |
Number of services |
Average payment (in dollars) |
|
2019 |
00731 |
105,599 |
536 |
|
|
00790 |
57,215 |
1,089 |
|
|
00811 |
83,829 |
471 |
|
|
00812 |
128,092 |
459 |
|
|
00840 |
97,677 |
1,150 |
|
2020 |
00731 |
86,034 |
520 |
|
|
00790 |
48,025 |
1,068 |
|
|
00811 |
64,732 |
449 |
|
|
00812 |
95,316 |
449 |
|
|
00840 |
84,485 |
1,119 |
|
2021 |
00731 |
93,966 |
505 |
|
|
00790 |
48,111 |
1,046 |
|
|
00811 |
74,675 |
437 |
|
|
00812 |
128,995 |
435 |
|
|
00840 |
87,612 |
1,103 |
|
2022 |
00731 |
95,282 |
478 |
|
|
00790 |
48,673 |
994 |
|
|
00811 |
78,020 |
411 |
|
|
00812 |
164,206 |
410 |
|
|
00840 |
93,780 |
1,050 |
|
2023 |
00731 |
92,176 |
466 |
|
|
00790 |
43,685 |
989 |
|
|
00811 |
77,724 |
402 |
|
|
00812 |
173,743 |
411 |
|
|
00840 |
89,250 |
1,039 |
Source: GAO analysis of data from the Komodo Research Dataset. | GAO‑26‑107169
Note: Anesthesiology payment rates above represent allowed amounts which incorporate, but do not specify, the amount of time a given procedure may take. Services were anesthesia for other procedure on esophagus, stomach or upper small bowel using an endoscope (00731), anesthesia for other procedure on upper abdomen (00790), anesthesia for other procedure on large bowel using an endoscope (00811), anesthesia for exam of colon using an endoscope (00812), and anesthesia for other procedure on lower abdomen (00840). These five services represent approximately $1.4 billion in-network expenditures billed through professional claims from physicians and their practices with outpatient hospital as the place of service from 2019 through 2023 in the Komodo Research Dataset. Payment rates are adjusted for inflation to 2023 dollars.
Figure 25: Average Payment Rates for Selected In-Network Anesthesiology Services - Professional, Ambulatory Surgical Center Setting 2019–2023
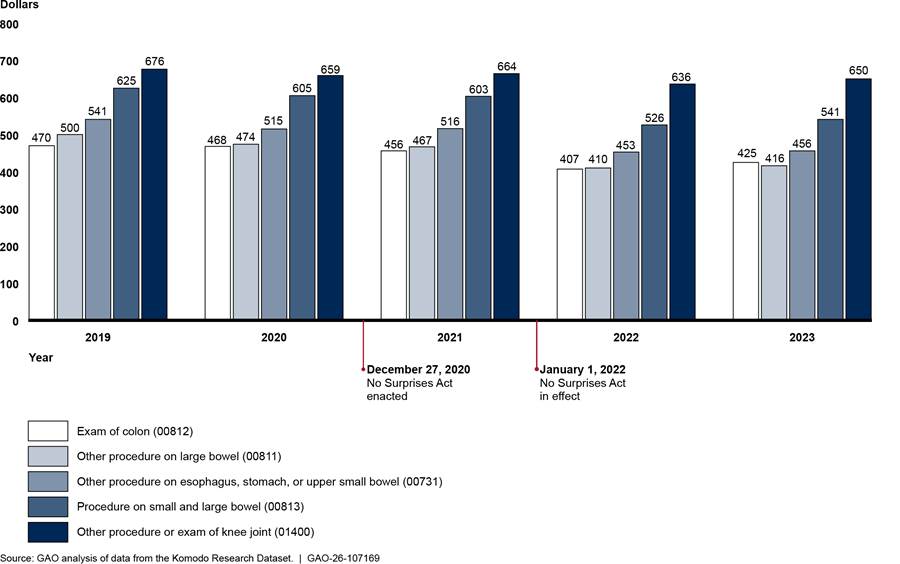
Notes: Anesthesiology payment rates above represent allowed amounts which incorporate, but do not specify, the amount of time a given procedure may take. These five services represent approximately $836 million in-network expenditures billed through professional claims from physicians and their practices with ambulatory surgical center as the place of service from 2019 through 2023 in the Komodo Research Dataset. Services are shown with their respective Current Procedural Terminology codes. Payment rates are adjusted for inflation to 2023 dollars.
See Pub. L. No. 116-260, div. BB, tit. I, 134 Stat. 1182, 2757 (2020) (codified at 42 U.S.C. § 300gg-111).
Table 23: Number of and Average Payment Rates for Selected In-Network Professional (Ambulatory Surgical Center) Anesthesiology Services, 2019–2023
|
Year |
Current Procedural Terminology code |
Number of services |
Average payment (in dollars) |
|
2019 |
00731 |
62,634 |
541 |
|
|
00811 |
68,267 |
500 |
|
|
00812 |
115,324 |
470 |
|
|
00813 |
39,636 |
625 |
|
|
01400 |
38,450 |
676 |
|
2020 |
00731 |
52,278 |
515 |
|
|
00811 |
58,053 |
474 |
|
|
00812 |
91,674 |
468 |
|
|
00813 |
36,915 |
605 |
|
|
01400 |
34,110 |
659 |
|
2021 |
00731 |
60,654 |
516 |
|
|
00811 |
71,422 |
467 |
|
|
00812 |
125,255 |
456 |
|
|
00813 |
47,187 |
603 |
|
|
01400 |
34,711 |
664 |
|
2022 |
00731 |
58,528 |
453 |
|
|
00811 |
67,229 |
410 |
|
|
00812 |
149,433 |
407 |
|
|
00813 |
46,924 |
526 |
|
|
01400 |
35,995 |
636 |
|
2023 |
00731 |
61,749 |
456 |
|
|
00811 |
71,990 |
416 |
|
|
00812 |
180,759 |
425 |
|
|
00813 |
50,787 |
541 |
|
|
01400 |
34,286 |
650 |
Source: GAO analysis of data from the Komodo Research Dataset. | GAO‑26‑107169
Note: Anesthesiology payment rates above represent allowed amounts which incorporate, but do not specify, the amount of time a given procedure may take. Services were anesthesia for other procedure on esophagus, stomach or upper small bowel using an endoscope (00731), anesthesia for other procedure on large bowel using an endoscope (00811), anesthesia for exam of colon using an endoscope (00812), anesthesia for procedure on small and large bowel using an endoscope (00813), and anesthesia for other procedure or exam of knee joint using an endoscope (01400). These five services represent approximately $836 million in-network expenditures billed through professional claims from physicians and their practices with ambulatory surgical center as the place of service from 2019 through 2023 in the Komodo Research Dataset. Payments are adjusted for inflation to 2023 dollars.
Figure 26: Average Payment Rates for Selected In-Network Family Medicine Services - Professional, Office 2019–2023
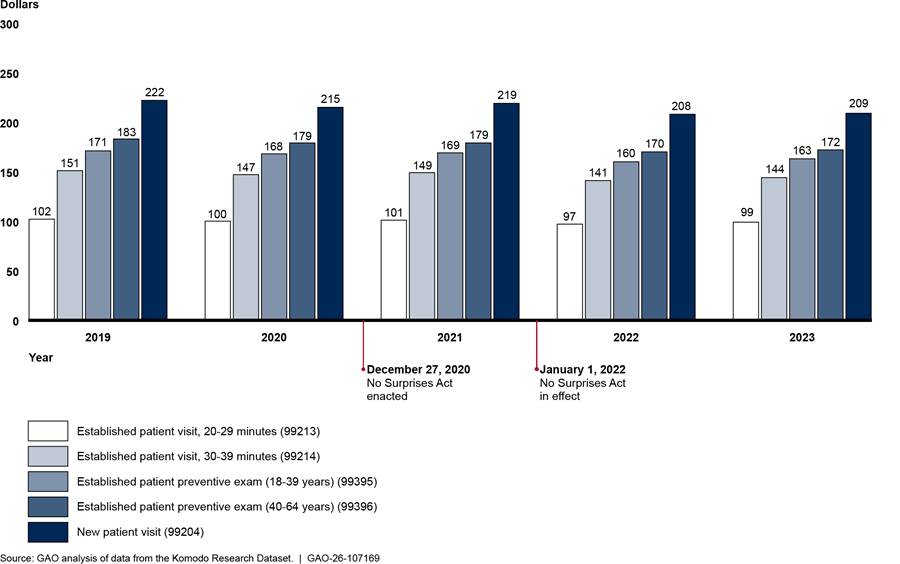
Notes: These five services represent approximately $10.4 billion in-network expenditures billed through professional claims by physicians and their practices with office as a place of service from 2019 through 2023 in the Komodo Research Dataset. Services are shown with their respective Current Procedural Terminology codes. Payment rates are adjusted for inflation to 2023 dollars.
See Pub. L. No. 116-260, div. BB, tit. I, 134 Stat. 1182, 2757 (2020) (codified at 42 U.S.C. § 300gg-111).
Table 24: Number of and Average Payment Rates for Selected In-Network Professional (Physician Office) Family Medicine Services, 2019–2023
|
Year |
Current Procedural Terminology code |
Number of services |
Average payment (in dollars) |
|
2019 |
99204 |
354,544 |
222 |
|
|
99213 |
7,944,878 |
102 |
|
|
99214 |
6,929,353 |
151 |
|
|
99395 |
838,932 |
171 |
|
|
99396 |
1,914,512 |
183 |
|
2020 |
99204 |
305,352 |
215 |
|
|
99213 |
6,842,806 |
100 |
|
|
99214 |
5,803,936 |
147 |
|
|
99395 |
735,402 |
168 |
|
|
99396 |
1,718,368 |
179 |
|
2021 |
99204 |
467,337 |
219 |
|
|
99213 |
6,135,534 |
101 |
|
|
99214 |
5,980,679 |
149 |
|
|
99395 |
820,657 |
169 |
|
|
99396 |
1,882,174 |
179 |
|
2022 |
99204 |
495,076 |
208 |
|
|
99213 |
5,750,976 |
97 |
|
|
99214 |
5,975,399 |
141 |
|
|
99395 |
822,280 |
160 |
|
|
99396 |
1,924,963 |
170 |
|
2023 |
99204 |
457,200 |
209 |
|
|
99213 |
4,888,123 |
99 |
|
|
99214 |
5,679,971 |
144 |
|
|
99395 |
817,801 |
163 |
|
|
99396 |
1,897,596 |
172 |
Source: GAO analysis of data from the Komodo Research Dataset. | GAO‑26‑107169
Services were new patient office or other outpatient visit, 45-59 minutes (99204), established patient office or other outpatient visit, 20-29 minutes (99213), established patient office or other outpatient visit, 30-39 minutes (99214), established patient periodic preventive medicine examination,18-39 years (99395), and established patient periodic preventive medicine examination, 40-64 years (99396). These five services represent approximately $10.4 billion in-network expenditures billed through professional claims by physicians or their practices with office as a place of service from 2019 through 2023 in the Komodo Research Dataset. Payment rates are adjusted for inflation to 2023 dollars.
Denials of Payment for Anesthesiology and Air Ambulance Services, In- and Out-of-Network
We analyzed whether denial rates changed in all selected specialties after the No Surprises Act went into effect. Emergency medicine services and radiology services were presented in the main text of the report. Here we present information about the percentages of anesthesiology and air ambulance services with $0 payments—meaning that the claim was denied—for in-and out-of-network services.
Figure 27: Percentage of Professional Services with Payments of $0 for In- and Out-of-Network Anesthesiology, 2019–2023
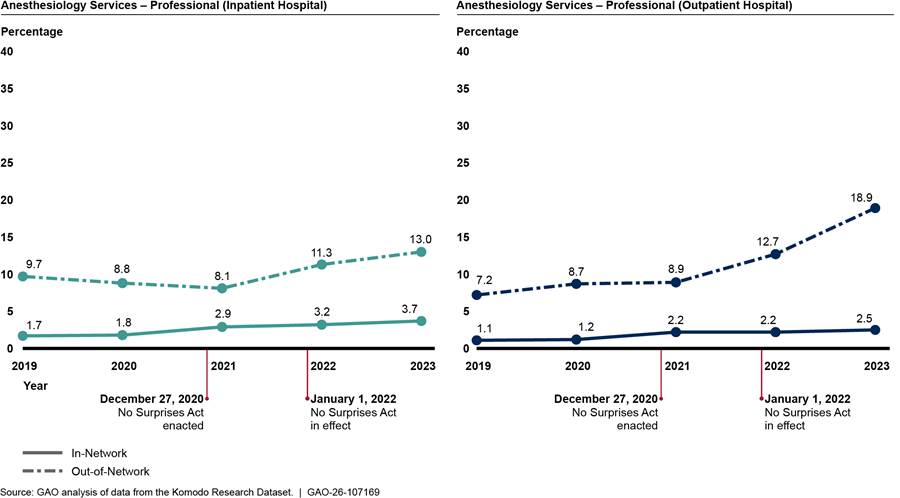
Notes: These figures each include the percentages of five types of anesthesiology services with payments of $0, meaning that payments for the services were denied.
- The five services for inpatient hospital place of service were anesthesia services for: other procedure on brain, extensive surgery on spine, other procedure on upper abdomen, procedure on stomach for weight loss, and other procedure on lower abdomen.
- The five services for outpatient hospital place of service were anesthesia services for: other procedure on esophagus, stomach, or upper small bowel using an endoscope, other procedure on upper abdomen, other procedure on large bowel using an endoscope, exam of colon using an endoscope, and other procedure on lower abdomen
See Pub. L. No. 116-260, div. BB, tit. I, 134 Stat. 1182, 2757 (2020) (codified at 42 U.S.C. § 300gg-111).
Figure 28: Percentage of Professional Services with Payments of $0 for In- and Out-of-Network Air Ambulance Transports, 2019–2023
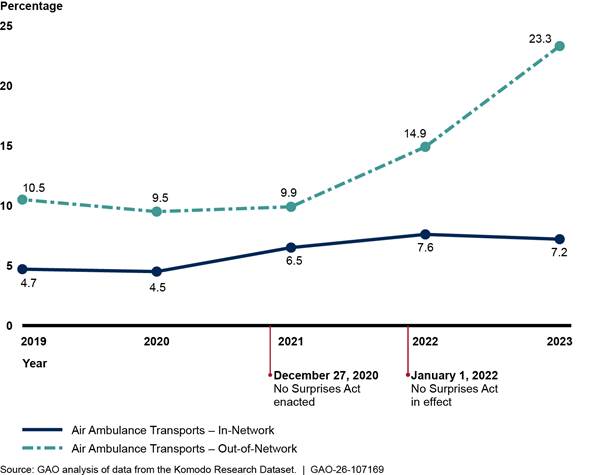
Notes: The figure represents the percentages of services with payments of $0, meaning that payments for the services were denied. Services include airplane and helicopter transports—Current Procedural Terminology codes A0430 and A0431—billed through professional claims by entities such as privately owned air ambulance companies.
See Pub. L. No. 116-260, div. BB, tit. I, 134 Stat. 1182, 2757 (2020) (codified at 42 U.S.C. § 300gg-111).
John E. Dicken, DickenJ@gao.gov
In addition to the contact named above, Lori Achman (Assistant Director), Manuel Buentello (Analyst-in-Charge), Christian Burks, Kelly Husted, and Daniel Ries made key contributions to this report. Sam Amrhein, Stephen Brown, Sarah Craig, Leia Dickerson, Jennifer Rudisill, Roxanna Sun, Jeffrey Tamburello, and Sirin Yaemsiri also made important contributions.
The Government Accountability Office, the audit, evaluation, and investigative arm of Congress, exists to support Congress in meeting its constitutional responsibilities and to help improve the performance and accountability of the federal government for the American people. GAO examines the use of public funds; evaluates federal programs and policies; and provides analyses, recommendations, and other assistance to help Congress make informed oversight, policy, and funding decisions. GAO’s commitment to good government is reflected in its core values of accountability, integrity, and reliability.
Obtaining Copies of GAO Reports and Testimony
The fastest and easiest way to obtain copies of GAO documents at no cost is through our website. Each weekday afternoon, GAO posts on its website newly released reports, testimony, and correspondence. You can also subscribe to GAO’s email updates to receive notification of newly posted products.
Order by Phone
The price of each GAO publication reflects GAO’s actual cost of production and distribution and depends on the number of pages in the publication and whether the publication is printed in color or black and white. Pricing and ordering information is posted on GAO’s website, https://www.gao.gov/ordering.htm.
Place orders by calling (202) 512-6000, toll free (866) 801-7077,
or
TDD (202) 512-2537.
Orders may be paid for using American Express, Discover Card, MasterCard, Visa, check, or money order. Call for additional information.
Connect with GAO
Connect with GAO on X,
LinkedIn, Instagram, and YouTube.
Subscribe to our Email Updates. Listen to our Podcasts.
Visit GAO on the web at https://www.gao.gov.
To Report Fraud, Waste, and Abuse in Federal Programs
Contact FraudNet:
Website: https://www.gao.gov/about/what-gao-does/fraudnet
Automated answering system: (800) 424-5454
Media Relations
Sarah Kaczmarek, Managing Director, Media@gao.gov
Congressional Relations
David A. Powner, Acting Managing Director, CongRel@gao.gov
General Inquiries
[1]R.A. Cohen and I.S. Sohi, Demographic Variation in Health Insurance Coverage: United States, 2023, National Center for Health Statistics. Oct. 2024.
[2]An issuer is an insurance company, insurance service, or insurance organization that is required to be licensed to engage in the business of insurance in the state. Providers who contract with a patient’s health plan or issuer are known as “in-network” providers, and providers who do not have a contract with a patient’s issuer are known as “out-of-network” providers. For purposes of this report, we use the term “issuers” to refer to plans and issuers. The term “providers” may include both individuals (e.g., physicians) and organizations (e.g., hospitals).
[3]See K. Pollitz et al., “An Examination of Surprise Medical Bills and Proposals to Protect Consumers From Them.” Peterson-KFF Health System Tracker (Feb. 10, 2020).
[4]Pub. L. No. 116-260, div. BB, tit. I, 134 Stat. 1182, 2757 (2020) (codified at 42 U.S.C. § 300gg-111).
[5]The No Surprises Act protections generally apply to claims for services submitted to private health plans, such as employer sponsored insurance, and not to claims submitted to public health insurance programs, such as Medicare and Medicaid. These protections apply to plan years beginning on or after January 1, 2022. See Department of Health and Human Services, Department of Labor, Department of the Treasury, No Surprises Act Overview of Key Consumer Protections (Washington, D.C.: Nov. 2023) for additional information.
[6]Consolidated Appropriations Act, 2021, Pub. L. No. 116-260, div. BB, tit. I, § 109(b), 133 Stat. 1182, 2860 (2020).
[7]Group plans include both fully insured and self-funded plans. Fully insured plans are plans for which the employer purchases coverage from a state-regulated issuer. Self-funded plans are plans for which the employer pays employee health insurance claims directly, bearing the risk of covering medical benefits generated by participants and beneficiaries. Self-funded plans may contract with a third party to administer the health insurance benefits.
[8]Previous research has also examined trends in in- and out-of-network billing. For examples, see Office of the Assistant Secretary for Planning and Evaluation, Department of Health and Human Services, Evaluation of the Impact of the No Surprises Act on Health Care Market Outcomes: Exploring Pre-Implementation Trends, Washington, D.C.: Nov. 21, 2024; FAIR Health, “In-Network and Out-of-Network Utilization and Pricing,” New York, NY Feb. 2024.
[9]Section 103 of the No Surprises Act established the IDR process, which allows issuers and out-of-network health care providers to resolve disputes regarding out-of-network payment rates without patient involvement for claims that are subject to the No Surprises Act. The No Surprises Act requires the Departments of Health and Human Services, Labor, and the Treasury to publish certain information about the IDR process. This information—IDR public use file data—includes, among other things, the number of services disputed, types of organizations that were party to a dispute, and payment determination outcomes for each calendar quarter. See 42 U.S.C. § 300gg-111(c)(7).
[10]Weighted baskets are based on the proportion that each service represents in the total quantity of services for each specialty provider in 2019. Because the weighted baskets are based on proportional utilization, it answers how much it would cost to purchase the same mix of services at a later time as in the base year—for our analysis, 2019. Specifically, the weighted basket compares payments per service regardless of underlying changes in the number of services each year. We used the average payment of each selected service for each year to create specific weighted baskets by specialty provider and place of service. We adjusted nominal payment rates to 2023 dollars using the Consumer Price Index for All Urban Consumers: Medical Care from the U. S. Bureau of Labor Statistics to account for changes due to inflation.
[11]We interviewed representatives from provider associations including the American College of Emergency Physicians, American College of Radiology, American Society of Anesthesiologists, Association of Air Medical Services, and the Emergency Department Practice Management Association. We interviewed representatives from issuer associations AHIP and the Blue Cross Blue Shield Association. We also interviewed representatives from issuers Aetna, Cigna, Blue Cross and Blue Shield of Texas, and UnitedHealthcare.
[12]These associations were the American Academy of Dermatology Association, American Academy of Family Physicians, American Association of Orthopaedic Surgeons, and the American College of Physicians.
[13]The five states were Arkansas, Maryland, South Dakota, Texas, and Washington. Additionally, we spoke to the National Association of Insurance Commissioners, which represents such departments.
[14]Congressional Budget Office, “An Analysis of Private Sector Prices for Physicians’ Services,” Working Paper 2008-01, Washington DC, January 2018, and U.S. Department of Health and Human Services, Office of the Assistant Secretary for Planning and Evaluation, Evaluation of the Impact of the No Surprises Act on Health Care Market Outcomes: Baseline Trends and Framework for Analysis – First Annual Report (July 2023).
[15]See U.S. Department of Health and Human Services, Office of the Assistant Secretary for Planning and Evaluation, Evaluation of the Impact of the No Surprises Act on Health Care Market Outcomes: Baseline Trends and Framework for Analysis – First Annual Report (July 2023); K. Pollitz et al., “An Examination of Surprise Medical Bills and Proposals to Protect Consumers From Them,” Peterson-KFF Health System Tracker, (Feb. 10, 2020).
[16]For more information on the IDR process, see GAO, Private Health Insurance: Roll Out of Independent Dispute Resolution Process for Out-of-Network Claims Has been Challenging, GAO‑24‑106335 (Washington, D.C.: December 12, 2023).
[17]Examples of services that these providers render commonly include evaluation and management of new or established (i.e., returning) patients.
[18]Health care consolidation refers to scenarios where health care entities join together under common ownership through either a merger or acquisition. For example, physician consolidation can occur when physician practices merge together (horizontal consolidation) or when practices are acquired by other types of entities (vertical consolidation). Some transactions can involve elements of both horizonal and vertical consolidation. For more information about physician consolidation, see GAO, Health Care Consolidation: Published Estimates of the Extent and Effects of Physician Consolidation, GAO‑25‑107450 (Washington, D.C.: Sept. 22, 2025).
[19]Emergency departments are typically connected to hospitals that provide a wide range of services beyond emergency care. However, emergency services furnished at independent freestanding emergency departments are subject to the No Surprises Act’s provisions.
[20]We examined three other comparison groups—internal medicine, dermatology, and orthopedic surgery—and found similar in-network percentages for 2019 through 2023 as with family medicine. More detailed information on the comparison groups is included in appendix II.
[21]Outpatient hospitals may be designated as either on-campus or off-campus. We focused our analysis of radiology claims on those with on-campus outpatient hospital as the place of service because they are more common than off-campus.
[22]Ambulatory surgical centers focus on providing same-day surgical care, including diagnostic and preventive procedures.
[23]In a 2019 report, we found that the percentage of in-network claims for air ambulance services in 2017 was 31 percent. The analysis was based on FAIR Health data, which may not be comparable to the analysis in this report. In-network percentages in this analysis are higher than our previous work on air ambulance services, which could be due to differences in data sources or differences in the years analyzed. See GAO, Air Ambulance: Available Data Show Privately-Insured Patients Are at Financial Risk, GAO‑19‑292 (Washington, D.C.: March 20, 2019).
[24]These two issuers were among the top five issuers with the most air ambulance claims in our dataset.
[25]One study of stakeholder perspectives on the effects of the No Surprises Act found providers reported a more confrontational tone in negotiations, and several providers reported contract terminations, payers presenting take-it-or-leave-it offers, and downward pressure on in-network prices. See Rasmussen, P., et al. “The Implications of the No Surprises Act on Contract Dynamics, Negotiations, and Finances: Perspectives from Key Stakeholders.” RAND; December 2024.
[26]The six issuers included two issuer associations and four issuers.
[27]See AHIP and Blue Cross Blue Shield Association, No Surprises Act Continues to Prevent More than 1 Million Surprise Bills Per Month, While Provider Networks Grow (Jan. 2024). The survey was distributed to 80 issuers, and 21 issuers—representing approximately 65 percent of the commercial market—responded to the survey.
[28]Each of these five insurance departments collects information on provider networks for plans under its jurisdiction, either through network adequacy regulations or reports on the effects of its state’s surprise billing laws.
[29]See Washington State Office of the Insurance Commissioner, Balance Billing Protection Act Impact Analysis: Biennial Report to the Legislature (Dec. 2024).
[30]See Texas Department of Insurance, Balance Billing Biennial Report (Nov. 2024). The report also showed an increase in the percentage of air ambulance providers that billed in-network, though the state balance billing law does not apply to such services according to the Texas Department of Insurance website.
[31]We used the allowed amount to analyze payment changes. The allowed amount indicates the amount the issuer considers full payment or reimbursement per the contract with the provider or payment policy. It typically includes both the amount the issuer will pay and any patient financial responsibility.
[32]Weighted baskets are based on the proportion that each service represents in the total quantity of services for each specialty provider in 2019. Because the weighted baskets are based on proportional utilization, it answers how much it would cost to purchase the same mix of services at a later time as in the base year—for our analysis, 2019. Specifically, the weighted basket compares payments per service regardless of underlying changes in the number of services each year. We used the average payment rate of each selected service for each year to create specific weighted baskets by specialty provider and place of service.
[33]All dollar amounts are adjusted for inflation to 2023 dollars.
[34]Analysis from the RAND Corporation also found disparities in changes in payment rates for emergency medicine services billed by facilities and physicians. Specifically, RAND found that facility payment rates increased about 19 percent from 2018 through 2022, while professional payments decreased about 7 percent during these years. The study adjusted payment rates for inflation and focused on the three most common evaluation and management emergency medicine services. The analysis did not distinguish between in-and out-of-network services. See “Strategies for Sustaining Emergency Care in the United States,” RAND Corporation, Santa Monica, CA (2025).
[35]The weighted basket for family medicine services included five services for office or other outpatient visits for new or established patients. We examined weighted baskets of services for three other provider specialties—internal medicine, dermatology, and orthopedic surgery—and also found small decreases for professional services.
[36]For services billed through professional claims, we analyzed services with outpatient hospital as the place of service.
[37]Due to differences in the procedures performed in each setting, the weighted baskets are specific to the place of service.
[38]Reasons for denying payment include that the service was not covered by the plan, may have been deemed medically unnecessary, or lacked prior authorization—specific approval from an issuer to cover a requested service.
[39]Similarly, others have reported providers have been facing lower in-network payment rate offers and have accepted rates lower than what they would have accepted prior to the No Surprises Act. See Rasmussen, P., et al. “The Implications of the No Surprises Act on Contract Dynamics, Negotiations, and Finances: Perspectives from Key Stakeholders.” RAND; December 2024.
[40]Physician consolidation refers to the process where multiple physician practices or healthcare entities join under common ownership, often through mergers or acquisitions.
[41]For example, representatives from two provider organizations believed that the qualifying payment amount— a component of the IDR process in determining the prevailing offer—was artificially low. Representatives from two other organizations also noted that the length of time to receive payments—despite winning during the IDR process—was often lengthy. For additional information on the roll out of the IDR process, See GAO, Private Health Insurance: Roll Out of Independent Dispute Resolution Process for Out-of-Network Claims Has Been Challenging, GAO‑24‑106335 (Washington, D.C.: December 12, 2023).
[42]Representatives from one issuer believed that the payment changes for self-insured plans can be linked to the No Surprises Act.
[43]See “Independent Dispute Resolution Process 2024 Data: High Volume, More Provider Wins” Health Affairs, June 11, 2025.
[44]Pub. L. No. 116-260, div. BB, tit. I, 134 Stat. 1182, 2757 (2020) (codified at 42 U.S.C. § 300gg-111).
[45]The No Surprises Act protections generally apply to claims for services submitted to private health plans, such as employer sponsored insurance, and not to claims submitted to public health insurance programs, such as Medicare and Medicaid. These protections apply to plan years beginning on or after January 1, 2022. See Department of Health and Human Services, Department of Labor, Department of the Treasury, No Surprises Act Overview of Key Consumer Protections (Washington, D.C.: Nov. 2023) for additional information.
[46]The IDR process provides a forum for issuers and out-of-network health care providers to resolve disputes regarding out-of-network payment rates without patient involvement for claims that are subject to the No Surprises Act. The No Surprises Act requires the Departments of Health and Human Services, Labor, and the Treasury to publish certain information about the IDR process including services disputed and payment determination outcomes for each calendar quarter.
[47]The preamble to the October 2021 interim final rules identified dermatology, family medicine, and internal medicine as being among specialties with infrequent surprise billing. See 86 Fed. Reg. 55,980, 56,059 (Oct. 7, 2021). The academic literature we reviewed also identified orthopedic surgery as a specialty that may be unlikely to surprise bill. See Z. Cooper et al., “Out-of-Network Billing and Negotiated Payments for Hospital-Based Physicians,” Health Affairs, Vol. 39, No. 1, Jan. 2020; Z. Cooper, F. Scott Morton, and N. Shekita, “Surprise! Out-of-Network Billing for Emergency Care in the United States,” Journal of Political Economy, Vol. 128, No. 9, Aug. 2020.
[48]Group plans include both fully insured and self-funded plans. Fully insured plans are plans for which the employer purchases coverage from a state-regulated issuer. Self-funded plans are plans for which the employer pays employee health insurance claims directly, bearing the risk of covering medical benefits generated by participants and beneficiaries. Self-funded plans may contract with a third party to administer the plan. Carriers participating in the Federal Employees Health Benefits Program are also subject to the No Surprises Act.
[49]We excluded facility claims for inpatient stays. The places of service for professional claims we included in our analysis varied depending on the specialty examined.
[50]Health insurance claims management systems refer to software that handles, processes, and manages claims submitted by patients or health care providers to insurance companies for payment. Revenue cycle management systems track the entire payment process from patient scheduling through billing and payment.
[51]An issuer is an insurance company, insurance service, or insurance organization that is required to be licensed to engage in the business of insurance in the state.
[52]Komodo Health categorizes some network status values as Very Likely In-Network or Likely In-Network if the network status is not directly supplied, but other information indicates it is likely to be in-network. Specifically, according to Komodo Health officials, values for the network status variable are either populated directly or derived from other codes.
[53]Modifiers provide additional information about specific circumstances for services to assist with accurate claims processing. For example, certain emergency medicine claims include the modifier “24,” indicating that the service was an unrelated evaluation and management service performed by the same physician during a postoperative period. The modifier does not affect reimbursement for this service.
[54]Previous research has also examined trends in in- and out-of-network billing. For examples, see U.S. Department of Health and Human Services, Office of the Assistant Secretary for Planning and Evaluation, Evaluation of the Impact of the No Surprises Act on Health Care Market Outcomes: Exploring Pre-Implementation Trends, Washington, D.C.: Nov. 21, 2024; FAIR Health, “In-Network and Out-of-Network Utilization and Pricing: A Study in Private Healthcare Claims,” New York, NY: Feb. 20, 2024.
[55]The National Uniform Claim Committee maintains the Health Care Provider Taxonomy code set, which is designed to facilitate electronic health care claim transactions. Health Care Provider Taxonomy codes indicate a provider’s specialty and are self-selected by the provider.
[56]Facility claims are typically billed by hospitals or other medical facilities. Professional claims are typically billed by individual providers or their practices. Only professional claims have a place of service associated with them.
[57]These specialties commonly bill using evaluation and management CPT codes—for services like office visits—that may be used by other specialties. They may also use codes that are specific to their specialty such as for a skin biopsy performed a dermatologist.
[58]Certain anesthesiology services represented high expenditures in more than one place of service. Accordingly, we analyzed the payment rate specific to that place of service.
[59]For family medicine, we chose only services based in physician offices.
[60]Weighted baskets are based on the proportion that each service represents in the total quantity of services for each specialty provider in 2019. Because the weighted baskets are based on proportional utilization, it answers how much it would cost to purchase the same mix of services at a later time as in the base year—for our analysis, 2019. Specifically, the weighted basket compares payments per service regardless of underlying changes in the number of services each year. We used the average payment rate of each selected service for each year to create specific weighted baskets by specialty provider and place of service.
[61]Group plans include both fully insured and self-funded plans. Fully insured plans are plans for which the employer purchases coverage from a state-regulated issuer. Self-funded plans are plans for which the employer pays employee health insurance claims directly, bearing the risk of covering medical benefits generated by participants and beneficiaries. Self-funded plans may contract with a third party to administer the plan.
[62]We used the allowed amount to analyze payment changes. The allowed amount indicates the amount the issuer considers full payment or reimbursement per the contract with the provider or payment policy. It typically includes both the amount the issuer will pay and any patient financial responsibility.
[63]Group plans include both fully insured and self-funded plans. Fully insured plans are plans for which the employer purchases coverage from a state-regulated issuer. Self-funded plans are plans for which the employer pays employee health insurance claims directly, bearing the risk of covering medical benefits generated by participants and beneficiaries. Self-funded plans may contract with a third party to administer the health insurance benefits.