PUBLIC LIBRARIES
Many Buildings Are Reported to Be in Poor Condition, with Increasing Deferred Maintenance
Report to Congressional Committees
United States Government Accountability Office
A report to congressional committees
For more information, contact: David Marroni at marronid@gao.gov.
What GAO Found
An estimated 38 percent (about 6,000) of the nation’s public libraries have at least one building system, such as heating, ventilation, and air conditioning (HVAC), in poor condition, according to GAO’s survey of libraries. An estimated 61 percent, or 9,800 libraries, have at least one building system or feature that poses a potential health or safety concern. Library size and physical accessibility were most frequently cited as potential concerns. For example, librarians we spoke with, and survey respondents, mentioned small library buildings can have inaccessible areas, obstructed walkways, and overcrowding.
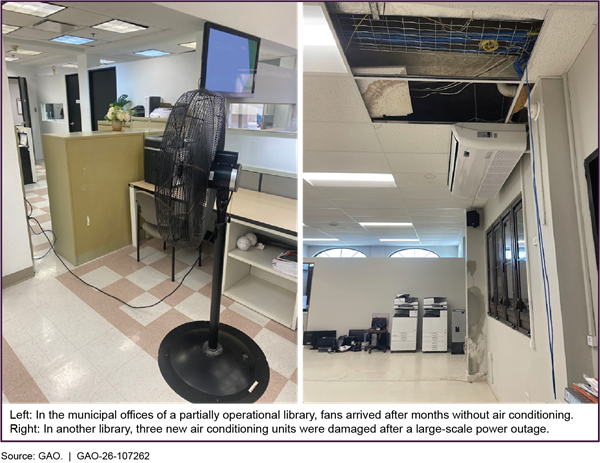
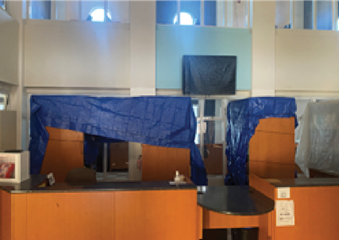
Shower Curtains Used Inside Library to Protect Books from Roof Leaks (left), and One of Several Damaged Air Conditioning Units (right)
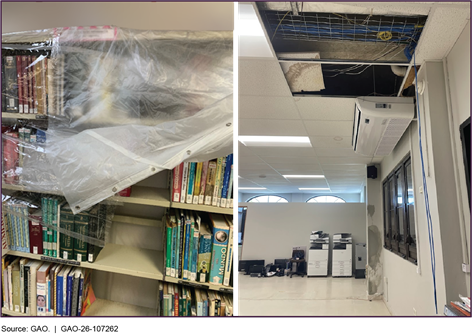
While the total cost to repair public library facilities nationwide is unknown, an estimated 70 percent (about 11,200 libraries) have a backlog of deferred maintenance and repair, according to GAO’s survey. According to budget forecasts and planned projects, an estimated 70 percent of libraries also expect deferred maintenance to persist or increase in the next 3 years. One librarian estimated needing about $60,000 for a new HVAC, and another librarian estimated more than $225,000 in construction costs for building repair needs, including for asbestos removal. An estimated 39 percent, or 6,200 libraries, had a deferred maintenance backlog of more than $100,000 each.
An estimated 71 percent of public libraries cited construction costs, such as labor and materials, and limited funding availability, as key challenges to addressing maintenance and repairs. An estimated 90 percent of libraries use local funding to address maintenance and repairs. However, reliance on local funding, particularly for small town rural libraries and libraries in high-poverty areas, can also pose challenges to addressing facility repair needs. For example, these areas may have less population and a more limited funding base, as well as fewer resources to apply for grants, provide required matching funds, or fundraise.
Beyond lending books, public libraries provide public spaces to host community programs and serve as voting sites and emergency centers. However, many libraries are in aging buildings, and their building systems may need repair or replacement to serve community needs. While the federal Institute of Museum and Library Services (IMLS), supports library programs and services, libraries are prohibited from using IMLS funds for building construction and repairs.
The Joint Explanatory Statement accompanying the Departments of Labor, Health and Human Services, and Education, and Related Agencies Appropriations Act, 2024, included a provision for GAO to study the availability and conditions of library facilities. This report examines the reported physical conditions of library facilities and the estimated cost and challenges to addressing facility repair needs, among other objectives.
Why GAO Did This Study
GAO conducted a nationally representative survey of about 16,400 public libraries in 50 states, the District of Columbia, and four territories. The survey results can be found in the “Additional Data” link of GAO’s website. GAO also visited 21 public and two tribal libraries in seven states and territories; reviewed data on estimated costs to address facility repair needs; and interviewed officials from IMLS; local and tribal libraries; state library administrative agencies; and other library stakeholders, including the American Library Association; Association of Tribal Archives, Libraries, and Museums; Association of Rural and Small Libraries; and Urban Libraries Council.
|
Abbreviations |
|
|
|
|
|
ADA |
Americans with Disabilities Act |
|
FEMA |
Federal Emergency Management Agency |
|
FY |
fiscal year |
|
HVAC |
heating, ventilation, and air conditioning |
|
ICA |
Impoundment Control Act |
|
IMLS |
Institute of Museum and Library Services |
|
RUCA |
Rural-Urban Commuting Area |
This is a work of the U.S. government and is not subject to copyright protection in the United States. The published product may be reproduced and distributed in its entirety without further permission from GAO. However, because this work may contain copyrighted images or other material, permission from the copyright holder may be necessary if you wish to reproduce this material separately.
December 18, 2025
The Honorable Shelley Moore Capito
Chair
The Honorable Tammy Baldwin
Ranking Member
Subcommittee on Labor, Health and Human Services, Education, and Related
Agencies
Committee on Appropriations
United States Senate
The Honorable Robert Aderholt
Chairman
The Honorable Rosa DeLauro
Ranking Member
Subcommittee on Labor, Health and Human Services, Education, and Related
Agencies
Committee on Appropriations
House of Representatives
Public libraries do more than lend books.[1] A 2022 survey found that libraries offer all kinds of different services, including providing locations for voter registration and polling and job-related training and support for those seeking employment.[2] Along with providing public spaces for the community, libraries provide emergency relief and shelter by functioning as cooling and warming centers during extreme temperatures and gathering sites during natural disasters.
In 2021, the American Library Association reported that the average library building is more than 40 years old and in need of renovation, expansion, or replacement to serve community needs and protect the safety of employees and patrons.[3] As libraries age, their building systems, such as roofs and heating, ventilation, and air conditioning (HVAC), require ongoing maintenance to ensure they function properly.[4] Deferring maintenance and repairs may increase the severity of problems and shorten the life of the building system.[5] We previously reported that deferred maintenance can reduce an organization’s ability to carry out its mission, decrease facility quality, and result in higher repair costs.[6]
The Institute of Museum and Library Services (IMLS) is a federal agency authorized to provide federal funding to libraries for programming and services.[7] In early 2025, an Executive Order directed IMLS to eliminate nonstatutory components and functions and reducing the related performance of statutory functions to the minimum required by law.[8] In November 2025, a federal district court vacated previous actions to implement the order and permanently enjoined further action to implement the order with respect to IMLS.[9] As the primary administrator of federal grants that support libraries nationwide, IMLS is responsible for managing and overseeing formula and discretionary grants, which totaled about $211 million to libraries in FY 2024, according to IMLS’s annual report. However, libraries are prohibited from using these funds for construction, including facility repair, according to IMLS agency documentation.[10]
The Joint Explanatory Statement accompanying the Departments of Labor, Health and Human Services, and Education, and Related Agencies Appropriations Act, 2024, includes a provision for us to examine the availability and conditions of library facilities.[11] This report addresses the (1) differences in availability of library facilities by geographic region, as well as the availability of library facilities in economically disadvantaged and underserved communities; (2) reported physical conditions of library facilities; (3) estimated cost to address facility repair needs; and (4) challenges to addressing facility repair needs.[12]
To address these objectives, we reviewed relevant federal laws and regulations, along with IMLS data and documents. We also interviewed IMLS officials; representatives from eight library associations; and other library stakeholders, such as state librarians.[13]
To examine the availability of library facilities, we conducted data analyses based on the physical location of libraries identified in IMLS’s FY 2022 Public Libraries Survey. We first conducted a literature review to identify units of measurements and demographic characteristics associated with assessing geographic and community differences in library availability. We then obtained geospatial data from IMLS’s FY 2022 Public Libraries Survey for the specific geographic locations of library outlets.[14] We assessed the reliability of these data by reviewing technical documentation, interviewing agency officials, and testing the data (e.g., for missing data, outliers, and obvious errors) and determined they were sufficiently reliable for the purpose of assessing the availability of libraries. We also used data from the U.S. Census Bureau and the Economic Research Service at the U.S. Department of Agriculture for census tract-level data on community characteristics.[15] With these data, we conducted two analyses:
· We analyzed the spatial distribution of library facilities to population centers in census tracts and estimated communities’ proximity to library facilities. Based on our literature review and an initial test run of our analysis on two states, we measured library availability by travel mode (driving and walking) and by travel time (10 minutes one way for driving and 20 minutes one way for walking).
· We used a statistical model to assess the extent to which library availability was associated with community characteristics, using data from the American Community Survey.[16]
To examine reported physical conditions of library facilities and the estimated costs and challenges to address facility maintenance and repair needs, we used multiple methods:
· Survey of libraries. We conducted a nationally representative survey of public libraries from December 2024 to February 2025.[17] From a population of 16,391 libraries, we sampled 692 libraries and received 436 valid survey responses, resulting in an unweighted and weighted response rate of about 63 percent. Estimates generated from the survey, adjusting for nonresponse, are generalizable to this target population of eligible libraries. The survey results can also be found in the “Additional Data” link of our website for this report, GAO‑26‑107262;
· Visits to selected libraries. To supplement information that we collected from the survey, we visited 23 libraries in seven states and territories (Alaska, California, the District of Columbia, Georgia, Indiana, Maine, and Puerto Rico).[18] This included visits to tribal libraries and libraries in Puerto Rico to obtain and supplement information that could not be collected from the survey. We visited these libraries to observe building features and interview library officials to get firsthand experience and perspectives on the physical conditions of library facilities; and
· Document reviews and interviews. We obtained and reviewed documents from some state library administrative agencies. We also interviewed and obtained documents from library associations or stakeholders to understand the estimated cost to address library facility repair needs. For a more detailed description of our scope and methodology, see appendix I.
We conducted this performance audit from January 2024 to December 2025 in accordance with generally accepted government auditing standards. Those standards require that we plan and perform the audit to obtain sufficient, appropriate evidence to provide a reasonable basis for our findings and conclusions based on our audit objectives. We believe that the evidence obtained provides a reasonable basis for our findings and conclusions based on our audit objectives.
Background
Library Systems and Governance Structures
Every state and territory included in our review has a library administrative agency charged with extension and development of public library services throughout the state, which includes distributing federal formula funding.[19] Within each state and territory are library systems, usually serving local jurisdictions, such as counties or municipalities.[20] There are 9,248 library systems nationwide, according to the FY 2022 Public Libraries Survey. As shown in figure 1, these systems have either one central library or multiple library outlets, also known as “branches,” which add up to about 17,500 individual libraries.[21]
Figure 1: Number of Library Systems and Branches, by States and Included Territories in Fiscal Year 2022
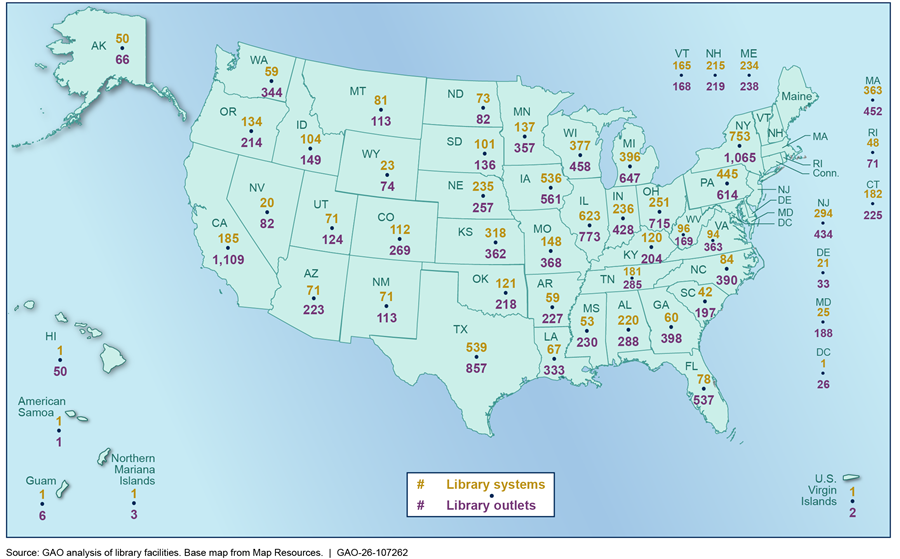
Note: Within each state and territory, there are library systems that have either one central library or multiple library outlets, also known as branches. The number of libraries here includes bookmobiles, books-by-mail service, and some tribal libraries. We did not include the number of library systems and branches in Puerto Rico due to incomplete data in the fiscal year 2022 Public Libraries Survey dataset, which were the most recent data available.
In addition to individual libraries operating under different library systems, they may also function under different types of local governance structures that can affect the responsibilities and funding available for facility maintenance and construction. According to IMLS documents, these local governance structures reflect the state or local law authorizing the library and can include the following types, among others:
· multijurisdictional entity jointly operated by a county and a city;
· part of a municipal government entity to provide for its population in a service area;
· local library district—other than a county, municipality, or township—that state law has authorized to establish and operate a public library (these districts have fiscal autonomy that requires support from local taxation dedicated to library purposes);
· part of a local tribal government to serve residents of a Native American reservation; or
· privately controlled nonprofit association or agency that meets the statutory definition of a public library in a given state. This includes association libraries and libraries with a 501(c) designation.
Characteristics of Library Facilities
Libraries exist within a variety of building configurations and may have different maintenance and repair needs from when they were originally built. Some libraries occupy buildings not originally designed to serve as libraries, such as former office buildings, retail mall spaces, or houses converted for use as libraries. Some are in standalone buildings, while others are co-located in residential or municipal buildings that can include administrative offices, businesses, or senior centers.
The responsibility for carrying out and paying for facility maintenance and repairs can vary depending on the governance framework and local government structure of the library. These responsibilities can also vary depending on the ownership of the specific building the library occupies. Libraries in leased spaces may rely on the building owners to handle all repairs or certain repairs, such as those affecting the outside of the building. Libraries that share a building with other entities, such as local government agencies, may need to coordinate with multiple entities for repair needs, such as a city and county.
Library design standards. As public institutions that serve local communities, libraries typically provide space for collections, public computers with internet access, desks or tables for user seating, a staff working area, and meeting rooms, among other types of spaces. Local communities are the users of libraries and, as such, their needs generally affect the design and planning of library facilities. Modern library design strategies call for building features that accommodate the needs of different users. This can include ensuring ease of access into the building or, in the case of children, adding storytelling spaces. However, no nationwide quantitative size standards (e.g., recommended number of square feet based on population) exist for public library facilities, according to the American Library Association.
Library facilities may be subject to various building codes, including following fire codes and other requirements, which may include requirements at the tribal, local, or state level.[22] Library facilities are also subject to certain federal requirements, including providing physical accessibility to people with disabilities, with certain exceptions. Although older buildings may have been constructed at a time when physical accessibility standards did not exist, the Americans with Disabilities Act (ADA) of 1990 requires new library buildings constructed after 1994 to accommodate people with disabilities, and any alterations that affect the usability of libraries must, to the maximum extent feasible, accommodate people with disabilities in the altered portion of the library.[23]
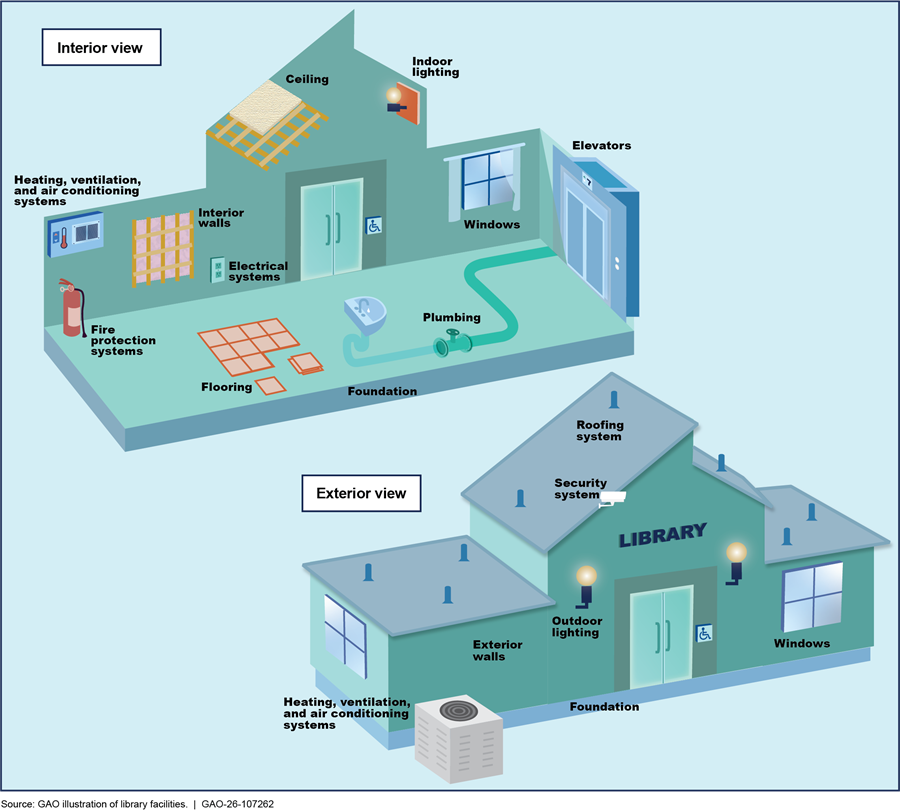
Common library building features. Common library building features include roof and exterior walls and systems such as HVAC, electrical, fire protection, and plumbing, as shown in figure 2.[24]
Facility assessments. Although not generally required, an assessment of the conditions of building systems can help libraries make informed decisions about maintaining their facilities. An inventory can include information such as the date of a system’s prior repair or replacement and the expected lifespan of a building system before replacement is needed. To identify deficiencies, libraries can conduct a systematic inspection of their building systems and features, also known as a facility condition assessment.[25] These facility condition assessments can help libraries identify their maintenance and repair needs and develop cost estimates to address facility deficiencies, which can help them plan and budget.[26]
IMLS Roles and Responsibilities
Although state or local laws may authorize libraries, Congress established IMLS as a federal agency in 1996 and authorized the agency to award grants supporting libraries in states, the District of Columbia, and selected U.S. territories.[27] In FY 2024, IMLS announced awards of about $180 million to libraries through the formula Grants to States program and about $31 million through all discretionary library services programs, according to its FY 2024 Annual Financial Report. The Grants to States program, which distributes funds through state library administrative agencies, is the largest source of federal funding support for library programs and services. In March 2025, an Executive Order directed IMLS to eliminate nonstatutory components and functions and reduce the related performance of statutory functions to the minimum required by law.[28] In November 2025, a federal district court vacated previous actions to implement the order and permanently enjoined further action to implement the order with respect to IMLS.[29]According to IMLS officials, the agency obligated all FY 2025 funds and reinstated all grants. IMLS released an official announcement on December 3, 2025 announcing the reinstatement of grants.[30]
In addition to awarding financial assistance, IMLS has statutory authority to collect data on library programs and information services.[31] In February 2024, IMLS officials told us that they began a study on library infrastructure to assess the physical conditions of libraries, in response to a provision included in House Report 117-403.[32] According to IMLS officials, the purpose of the study was to assess physical infrastructure needs of libraries and museums located in rural, disaster prone, and underserved regions in particular, as directed by Congress. The study was to explore the met and unmet infrastructure needs in these areas, which would lay the groundwork for future consideration of potential solutions. According to IMLS officials, data collection and several findings documents had been completed for the study, and they are working to refine a summary report for Congress.
As noted above, IMLS is currently prohibited from funding library construction—a prohibition that was added in 2003.[33] Historically, some federal funds were available for library construction. For example, the Library Services and Construction Act, as amended, previously provided funding for library construction.[34] In February 2024, IMLS officials told us that federal funds can be used for conservation purposes, such as addressing humidity or fire suppression, which fall short of construction. However, they also said that identifying how much physical construction goes into modifying buildings for conservation issues can be complicated; the prohibition for using federal funds for construction is a “grey area” and may also prohibit funding for certain facility maintenance and repair needs, such as strengthening a basement with a sump pump to remove any flooding water.
Availability of Library Facilities Varies Among Communities Based on Urbanicity, Regional Location, and Demographics
Library Availability Differs by Urbanicity and Vehicle Ownership Across Communities
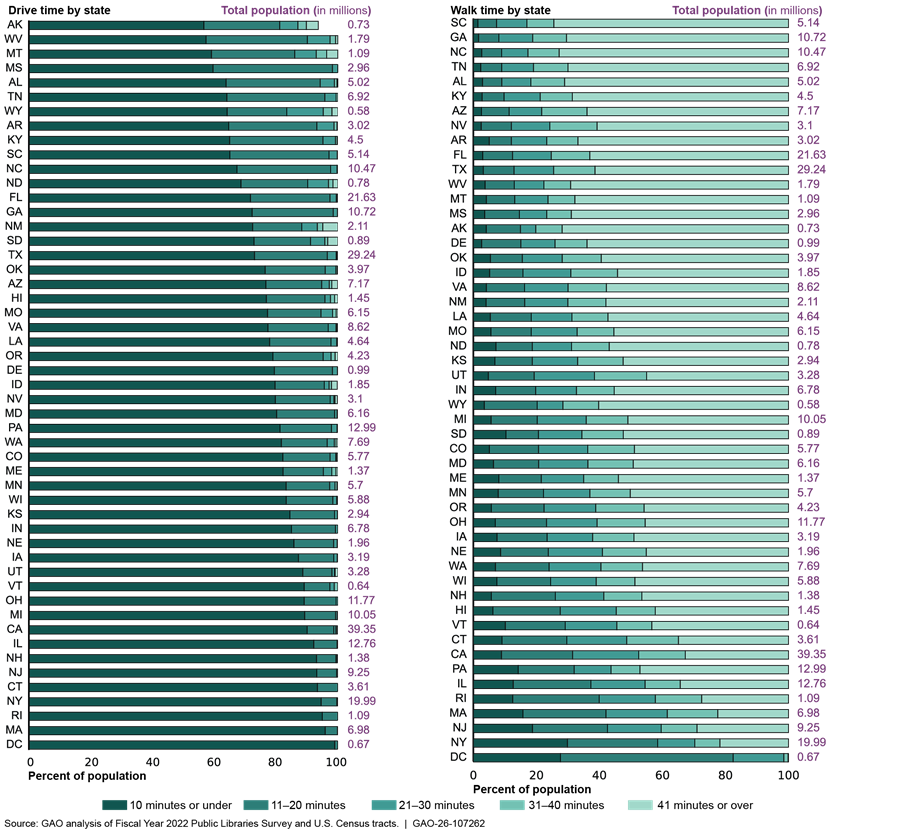
The availability of libraries varies among communities across the United States, based on urbanicity.[35] Library availability is defined as the ability for a person to travel to their nearest library facility within a certain amount of time. We define this as 10-minute driving and 20-minute walking time. While the majority of the 331 million of the U.S. population have a library within a 10-minute drive one way, travel times can differ in communities for both driving and walking to the nearest library. Nearly 1 million residents nationwide are further than a 40-minute drive, one way, and over 165 million residents are further than a 40-minute walk, one way, to their nearest library facility. The size of the library as another measure of library availability also varies by urbanicity.
Majority of Communities Are Within a 10-Minute Drive to Their Nearest Library
According to our analysis, the national average drive time between a community and their nearest library is about 7 minutes.[36] About 81 percent of the U.S. population has a library available to them within a 10-minute or less drive one way, based on our definition of driving availability.
The average drive times to the nearest library differ by urbanicity. Urban communities experience the shortest drive times (about 6 minutes one way, on average) and rural communities the longest (about 11 minutes one way, on average) (see table 1). Urban communities also have the highest percentage of their population within a 10-minute drive to their nearest library, at about 87 percent.
Table 1: One-Way Drive Time to Nearest Public Library Facility for U.S. Communities Overall and by Urbanicity
|
|
National |
Urbanb |
Suburban |
Large town |
Rural |
|
|
Total number of census tracts |
84,144 |
59,687 |
9,019 |
7,727 |
7,711 |
|
|
Drive time averagea (in minutes) |
7.17 |
6.25 |
10.48 |
8.26 |
10.70 |
|
|
Population within drive time to library (percent) |
|
|||||
|
0-10 minutes |
268,085,962 (80.98) |
213,069,347 |
19,243,669 (55.28) |
20,024,082 (71.01) |
15,748,864 (68.79) |
|
|
11-20 minutes |
55,194,689
|
30,764,715 (12.55) |
12,643,330 (36.32) |
6,866,125 (24.38) |
4,920,519 (21.49) |
|
|
21-30 minutes |
5,642,223 (1.70) |
1,157,355 (0.47) |
2,284,785 (6.56) |
915,105 (3.25) |
1,284,978 (5.61) |
|
|
31-40 minutes |
1,091,996 |
135,530 (0.065) |
380,013 (1.09) |
205,095 (0.73) |
371,358 (1.62) |
|
|
40+ minutes |
970,417 (0.29) |
36,319 (0.01) |
259,306
|
154,326 (0.55) |
520,466 |
|
Source: GAO analysis of fiscal year 2022 Public Libraries Survey and U.S. Census tracts. | GAO‑26‑107262
Note: We define urbanicity as the degree to which an area is considered urban or rural, ranging from highly urban environments (city centers) to rural settings; it measures where an area is on the urban-rural continuum.
aAverage drive time is population weighted. We found statistical differences in the estimated percent of population within each drive time range between national estimates and estimates for each community at the 95 percent confidence level, as measured by nonoverlapping confidence intervals.
bWe used the 2010 U.S. Department of Agriculture’s, Economic Research Service’s Rural-Urban Commuting Area codes, which classify census tracts using measures of population density, urbanization, and daily commuting. Census tracts were assigned one of the following four categories: (1) urban: contiguous, built-up areas of 50,000 people or more; (2) suburban: areas, often in metropolitan counties, with primary high commuting flow to urban and all other areas with secondary commuting flows of 30-49 percent of the population to urban areas; (3) large town: towns with populations of 10,000-49,999 and surrounding rural areas with 10 percent or more primary commuting flows to these towns, and towns with secondary commuting flows of 10 percent or more to urban areas; (4) rural: towns with populations below 10,000 and surrounding commuter areas with more than a 1-hour driving distance to the closest city.
Rural and suburban communities are farther from their nearest library facility than other communities.[37] Specifically, about 10 percent of the rural population and about 8 percent of the suburban population are a 21-minute drive or more to their nearest library. Furthermore, of the national population that is more than a 40-minute drive from the nearest library (nearly 1 million people), about 54 percent are in rural communities, while about 27 percent are in suburban communities.
Majority of Communities Are More Than Half an Hour’s Walk From Their Nearest Library
According to our analysis, over 60 percent of the U.S. population live more than a 30-minute walk from the nearest library. On average, communities are about a 42-minute walk away, and nearly 50 percent of the nation’s communities are over a 40-minute walk to reach a library. About 23 percent of the U.S. population is within our definition of library walking availability (walking 20 minutes or less one way).
The average walk time to the nearest library also differs by urbanicity. Urban communities experience the shortest walk times (about 41 minutes one way, on average,) and suburban communities have the longest (about 59 minutes one way, on average) (see table 2).[38] Urban communities have the highest percentage of their population within a 20-minute walk to their nearest library, at about 26 percent.
Table 2: One-Way Walk Time to Nearest Public Library Facility for U.S. Communities Overall and by Urbanicity
|
National |
Urbanc |
Suburban |
Large town |
Rural |
|
|
Total number of census tracts |
84,144 |
59,687 |
9,019 |
7,727 |
7,711 |
|
Walk time averagea (in minutes) |
42.31 |
40.70 |
58.80 |
43.99 |
42.37 |
|
Population within walk time (percent) |
|||||
|
0-10 minutes |
26,512,377 |
21,318,479 |
1,340,733 |
1,557,103 |
2,296,062 |
|
11-20 minutes |
51,010,963 |
42,232,572 |
2,091,769 |
3,599,019 |
3,087,603 |
|
21-30 minutes |
47,369,452 |
39,356,658 |
2,311,566 |
3,729,017 |
1,972,211 |
|
31-40 minutes |
40,890,922 |
34,132,049 |
1,979,371 |
2,977,680 |
1,801,822 |
|
40+ minutesb |
165,285,890 (49.92) |
108,160,793 (44.11) |
27,088,233 (77.81) |
16,301,914 (57.88) |
13,734,950(60.00) |
Source: GAO analysis of fiscal year 2022 Public Libraries Survey and U.S. Census tracts. | GAO‑26‑107262
Note: We define urbanicity as the degree to which an area is considered urban or rural, ranging from highly urban environments (city centers) to rural settings; it measures where an area is on the urban-rural continuum.
aAverage walk time is population weighted. We found statistical differences between average walk time and estimated percent of population within each walk time range between national estimates and estimates for each community at the 95 percent confidence level, as measured by nonoverlapping confidence intervals for individuals whose walk time could be estimated, except for large town, 21-30 minutes, and rural, 11-20 minutes.
bAverage walk times were also calculated only for communities where walking access to a library could be estimated. Communities located more than 5 miles from the nearest library were assumed to fall in the 40+-minute walk category, but no precise walk-time averages were calculated for these areas.
cWe used the 2010 U.S. Department of Agriculture’s Economic Research Service’s Rural-Urban Commuting Area codes, which classify census tracts using measures of population density, urbanization, and daily commuting. Census tracts were assigned one of the following four categories: (1) urban: contiguous, built up areas of 50,000 people or more; (2) suburban: areas, often in metropolitan counties, with primary high commuting flow to urban and all other areas with secondary commuting flows of 30-49 percent of the population to urban areas; (3) large town: towns with populations of 10,000-49,999 and surrounding rural areas with 10 percent or more primary commuting flows to these towns, and towns with secondary commuting flows of 10 percent or more to urban areas; (4) rural: towns with populations below 10,000 and surrounding commuter areas with more than a 1-hour driving distance to the closest city.
Suburban communities have to travel further to reach their nearest library facility than other communities. Specifically, about 78 percent of suburban communities are beyond a 40-minute walk to reach their nearest library. However, suburban communities are a small part (about 16 percent) of all communities that are beyond a 40-minute walk. In comparison, urban communities have a lower percentage of their population beyond a 40-minute walk (about 44 percent), but the majority of the population beyond a 40-minute walk are in urban areas (about 65 percent).
Walking distance to the nearest library is a particularly important measure of library availability for communities where car ownership is less common, as it may be the only way for some people to travel to a library. As table 3 shows, we found that, of the over 40,000 communities that were not within a walkable distance of 20 minutes or less, 755 were communities where more than 20 percent of households did not own a vehicle. We estimate that about 2.3 million people live in these communities. Relative to tracts with lower percentages of households without a vehicle, these 755 communities had a lower median household income and a higher poverty level, on average.
Table 3: Vehicle Ownership and Demographics in Census Tracts, by Public Library Facility Availability
|
|
Tracts within walking distance of a library |
Tracts not in walking distance of a library |
||
|
Percent of households without a vehicle |
0-20% |
20%+ |
0-20% |
20%+ |
|
Count of tracts |
35,217 |
7,521 |
39,853 |
755 |
|
Total population |
140,513,446 |
25, 077,069 |
162,631,212 |
2,339,200 |
|
Average median household income |
$81,660 |
$58,420 |
$84,692 |
$44,823 |
|
Average percent of the community in poverty |
9.80 |
20.07 |
7.97 |
22.73 |
Source: GAO analysis of fiscal year 2022 Public Libraries Survey and American Community Survey data. | GAO‑26‑107262
Note: Library availability is defined as the ability for a person to travel to their nearest library facility within a certain amount of time. We define this as 10-minute driving and 20-minute walking time. Census tracts generally have a population size of 1,200 to 8,000 people, with an optimum size of 4,000 people. The spatial size of census tracts varies widely depending on the density of settlement. Census tract boundaries generally follow visible and identifiable features, although boundaries may also follow legal boundaries. Census tract boundaries are contained within state and county boundaries.
Although libraries are located in close proximity to a majority of the population, library stakeholders told us that there can be other challenges in accessing libraries besides distance. Specifically, safe walking routes to the library and accessible roads and sidewalks may not exist in some communities. Mountains between towns, poor road conditions, or lack of transportation can also impede or inhibit access, even when the physical distance to the nearest library is not long. Additionally, about 14 U.S. communities (about 11,000 people) do not have a drivable or walkable library because they are on a separate landmass from the nearest library, or because libraries are inaccessible for other reasons.[39]
Rural Communities Have More Libraries and More Square Footage Than the National Average
According to our analysis, the number and size of libraries can vary by the urbanicity of communities. Large town and rural communities that are within driving distance of a library have larger libraries, with more square footage than the national average.[40] In contrast, as shown in table 4, suburban communities have the smallest library space available, by square footage, of all urbanicity types, although suburban communities have more libraries than the national average. In addition, rural communities have significantly more libraries per 10,000 people than the national average.
|
Measurements |
National |
Urbanb |
Suburban |
Large town |
Rural |
|
Population within drive availabilitya (percent) |
268,085,962 (80.98) |
213,069,347 (86.90) |
19,243,669 (55.28) |
20,024,082 (71.01) |
15,748,864 (68.79) |
|
Total number of census tracts |
84,144 |
59,687 |
9,019 |
7,727 |
7,711 |
|
Number of libraries per 10,000 people |
0.42 |
0.30 |
0.61 |
0.61 |
1.28 |
|
Library square footage per 1,000 people |
621.55 |
621.67 |
408.33 |
705.92 |
840.70 |
Source: GAO analysis of fiscal year 2022 Public Libraries Survey and U.S. Census tracts. | GAO‑26‑107262
Note: We define urbanicity as the degree to which an area is considered urban or rural, ranging from highly urban environments (city centers) to rural settings; it measures where an area is on the urban-rural continuum.
aLibrary availability is defined as the ability for a person to travel to their nearest library facility within a certain amount of time. We define this as 10-minute driving and 20-minute walking time. Census tracts generally have a population size of 1,200 to 8,000 people, with an optimum size of 4,000 people. The spatial size of census tracts varies widely depending on the density of settlement. Census tract boundaries generally follow visible and identifiable features, although boundaries may also follow legal boundaries. Census tract boundaries are contained within state and county boundaries.
bWe used the 2010 U.S. Department of Agriculture’s Economic Research Service’s Rural-Urban Commuting Area codes, which classify census tracts using measures of population density, urbanization, and daily commuting. Census tracts were assigned one of the following labels: (1) urban: contiguous, built up areas of 50,000 people or more; (2) suburban: areas, often in metropolitan counties, with primary high commuting flow to urban and all other areas with secondary commuting flows of 30-49 percent of the population to urban areas; (3) large town: towns with populations of 10,000-49,999 and surrounding rural areas with 10 percent or more primary commuting flows to these towns, and towns with secondary commuting flows of 10 percent or more to urban areas; (4) rural: towns with populations below 10,000 and surrounding commuter areas with more than a 1-hour driving distance to the closest city.
As mentioned, no national standard for library square footage exists, according to the American Library Association; however, a library stakeholder told us that library size as a measure of library availability sometimes lags in communities that have experienced significant recent population growth. For example, officials in a library we visited in Georgia told us that one of their libraries had served 2,000 residents when the building was built, but the community’s population has since increased to 100,000.
Library Availability Varies Regionally Within and Across States for Both Driving and Walking
According to our analysis, travel time to libraries varies between states (see fig. 3). In states such as Massachusetts, Rhode Island, and New York, approximately 95 percent of the population can drive to a library within 10 minutes. In contrast, fewer than 60 percent of the population in Mississippi, Montana, West Virginia, and Alaska have libraries within a 10-minute drive.
Walking access also shows considerable variation. Over 25 percent of the population in New York, Rhode Island, and Massachusetts can reach a library on foot within 20 minutes, compared with less than 7 percent in Kentucky, Tennessee, Georgia, North Carolina, Alabama, and South Carolina.
Note: Drive time estimates could not be generated for 14 communities in Alaska due to issues such as unrenderable road networks or missing drivable routes.
We also found variation in library availability among communities within states (see figs. 4 and 5). For instance, the state of New York, which has the highest percentage of its population within a 20-minute walk of a library, also contained six communities that were more than a 40-minute drive from the nearest library. Alaska, which contained the lowest percentage of its population within a 10-minute drive of a library, nonetheless had about 93 communities that were within this distance.
Variation also exists within states in the percentage of the population located within a 10-minute drive or a 20-minute walk of a library. For example, Michigan ranks ninth in percentage of state population within a 10-minute drive of their nearest library (about 89 percent) and ranks 23rd by percentage of state population within a 20-minute walk (about 20 percent); Nevada ranks 24th by percentage of state population within a 10-minute drive (about 80 percent) and ranks 43rd by walk (about 12 percent).
Figure 4: Percentage of County Population Within a 10-Minute Drive Time to a Public Library Facility, as Compared with the National Average of 81 Percent
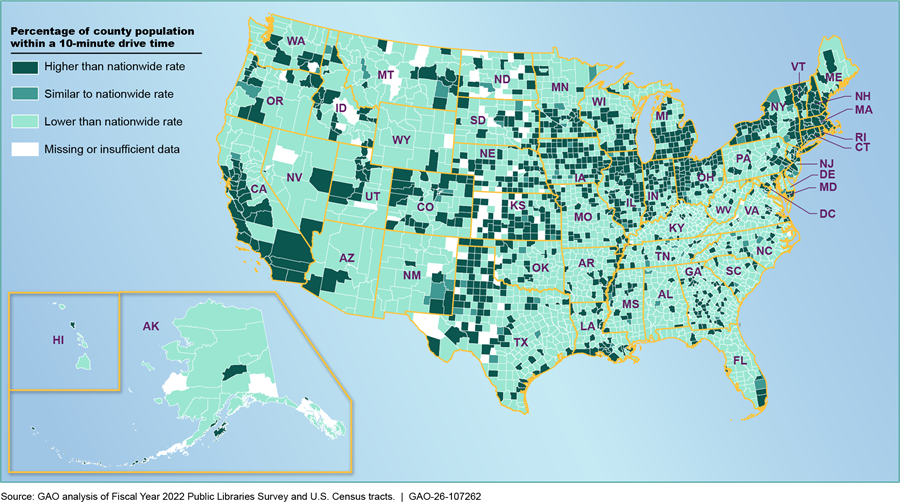
Note: To illustrate the distribution of library availability by driving, we developed a statistical map at the county level. Library availability was defined as the share of the county population within a 10-minute drive of a public library. Each county’s rate was compared with the national average (81 percent ±0.81) and categorized as “higher than nationwide rate,” “similar to nationwide rate,” “statistically lower than nationwide rate,” or “missing or insufficient data,” based on statistical difference at the 95 percent confidence level. Counties lacking sufficient data appear in white on the map. See app. I for methodology and data sources.
Figure 5: Percentage of County Population Within a 20-Minute Walk Time to a Public Library Facility, as Compared with the National Average of 23 Percent
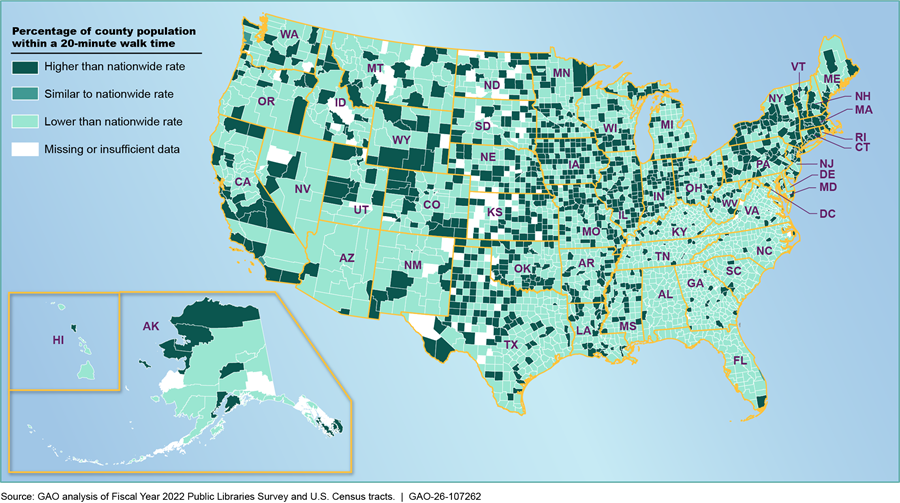
Note: To illustrate the distribution of library availability by walking, we developed a statistical map at the county level. Library availability was defined as the share of the county population within a 20-minute walk of a public library. Each county’s rate was compared with the national average (23 percent ±0.0003), and categorized as “higher than nationwide rate,” “similar to the nationwide rate,” “lower than the nationwide rate,” or “missing or insufficient data,” based on statistical significance at the 95 percent confidence level. Counties lacking sufficient population or availability data appear in white on the map. See app. I for methodology and data sources.
Economically Disadvantaged and Underserved Communities Generally Have a Greater Number of Libraries
On the basis of our analysis, we found that library availability is mixed based on community demographic characteristics and mode of travel, but there are generally more libraries available to economically disadvantaged and underserved communities.[41]
We looked at community characteristics, including ethnicity, income, and age and found some are generally associated with shorter walk times to the nearest library (see fig. 6). Specifically:
· Communities with higher percentages of people who are from historically underrepresented racial and ethnic groups; higher percentages of households without vehicles; and, except for urban areas, higher percentages of people in poverty, were associated with shorter walk times to the nearest library.[42] Urban areas with more people in poverty were associated with longer walk times to the nearest library.
· Communities with higher median household income were associated with longer walk times to the nearest library.
· There is an inconsistent relationship between the percentage of a community that was younger than 5 years old or older than 65 and the walk time to the nearest library across community urbanicity. For example, in urban and large town areas, communities with higher percentages of children under 5 are associated with increases in the walk time to the nearest library, but there were mixed results for suburban areas.
Figure 6: Walk Time to the Nearest Public Library as Community Demographics Increase, in Different Rural-Urban Commuting Area (RUCA)
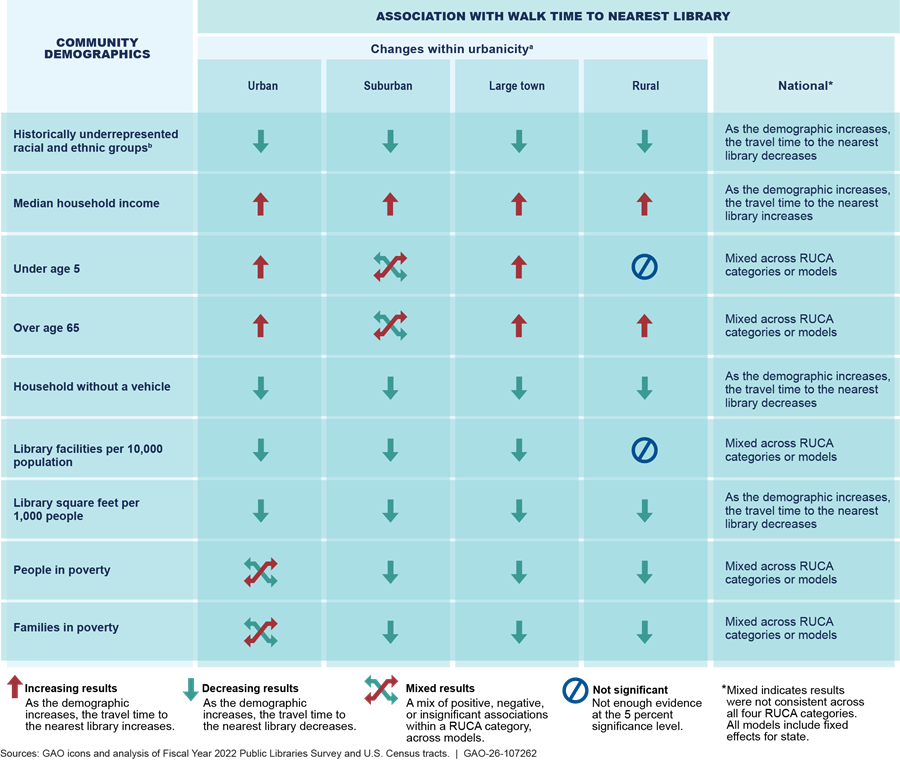
Note: Results are at the 5 percent significance level.
aWe define urbanicity as the degree to which an area is considered urban or rural, ranging from highly urban environments (city centers) to rural settings; it measures where an area is on the urban-rural continuum. We used the 2010 U.S. Department of Agriculture’s Economic Research Service’s Rural-Urban Commuting Area codes, which classify census tracts using measures of population density, urbanization, and daily commuting. Census tracts were assigned one of the following labels: (1) urban: contiguous, built up areas of 50,000 people or more; (2) suburban: areas, often in metropolitan counties, with primary high commuting flows to urban and all other areas with secondary commuting flows of 30-49 percent of the population to urban areas; (3) large town: towns with populations of 10,000-49,999 and surrounding rural areas with 10 percent or more primary commuting flows to these towns, and towns with secondary commuting flows of 10 percent or more to urban areas; (4) rural: towns with populations below 10,000 and surrounding commuter areas with more than a 1-hour driving distance to the closest city.
bFor historically underrepresented racial and ethnic groups, we include the following racial and ethnic reporting categories: Hispanic or Latino or Not Hispanic or Not Latino and: Black or African American alone; American Indian and Alaska Native alone; Asian alone; Native Hawaiian and Other Pacific Islander alone; some other race alone; and two or more races (two races including “some other race,” two races excluding “some other race,” and three or more races).
The relationship between demographics and driving time to the nearest library varies and depends on the rural-urban categorization of the community (see fig. 7). For example,
· Percent of a community who are from historically underrepresented racial and ethnic groups: For all urbanicity categories except rural, communities with higher percentages of people who are from historically underrepresented racial and ethnic groups are associated with shorter drive times to the nearest library. For rural communities, there was an insignificant association.
· Community median household income: For all but suburban communities, as the community’s median household income increases, the driving time to the nearest library increases. For suburban communities, there was insufficient information on the relationship between driving time and this demographic group.
· Percent of community who are under 5: Results were sometimes insignificant (large town and rural areas), sometimes showing shorter drive times (suburban areas), and sometimes showing longer drive times (urban areas) when assessing the association between communities with high percentages of people under 5 and drive time to the nearest library.
· Percent of community who are over 65: Except for urban areas, communities with higher percentages of people over 65 are associated with longer drive times to the nearest library. Urban areas had mixed results.
· Percent of community without a vehicle: For all rural-urban categories, communities with higher percentages of households without a vehicle are associated with shorter drive times to the nearest library, just as with the walk times.
· Percent of people in poverty: Results were mixed, where sometimes areas with higher percentages of people in poverty are associated with shorter drive times to the nearest library (urban areas) but other times had an insignificant or mixed association.
Figure 7: Drive Time to Nearest Public Library as Community Demographics Increase, in Different Rural-Urban Commuting Area (RUCA)
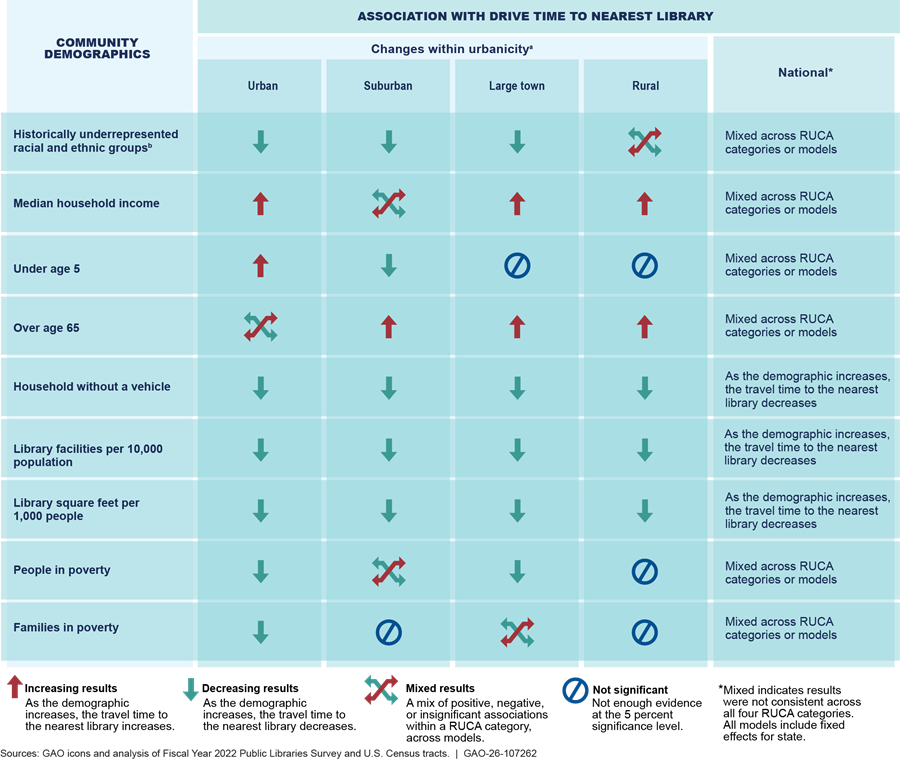
Note: Results are at the 5 percent significance level.
aWe define urbanicity as the degree to which an area is considered urban or rural, ranging from highly urban environments (city centers) to rural settings; it measures where an area is on the urban-rural continuum. We used the 2010 U.S. Department of Agriculture’s Economic Research Service’s Rural-Urban Commuting Area codes, which classify census tracts using measures of population density, urbanization, and daily commuting. Census tracts were assigned one of the following labels: (1) urban: contiguous, built up areas of 50,000 people or more; (2) suburban: areas, often in metropolitan counties, with primary high commuting flows to urban and all other areas with secondary commuting flows of 30-49 percent of the population to urban areas; (3) large town: towns with populations of 10,000-49,999 and surrounding rural areas with 10 percent or more primary commuting flows to these towns, and towns with secondary commuting flows of 10 percent or more to urban areas; (4) rural: towns with populations below 10,000 and surrounding commuter areas with more than a 1-hour driving distance to the closest city.
bFor historically underrepresented racial and ethnic groups, we include the following racial and ethnic reporting categories: Hispanic or Latino or Not Hispanic or Not Latino and: Black or African American alone; American Indian and Alaska Native alone; Asian alone; Native Hawaiian and Other Pacific Islander alone; some other race alone; and two or more races (two races including “some other race,” two races excluding “some other race,” and three or more races).
Some Libraries Identified at Least One Building System in Poor Condition; A Majority Are Estimated to Have Some Health or Safety Concern
An Estimated 38 Percent of Libraries Have Identified at Least One Building System in Poor Condition
On the basis of our nationally representative survey of libraries, we estimate 38 percent, or about 6,000 libraries, have at least one building system or feature in poor condition.[43] We also estimate that, of libraries with at least one system in poor condition, most libraries have only a single system in poor condition (at 52 percent), while few (3 percent) have six or more systems in poor condition.[44] In contrast, we estimate that 20 percent of libraries have all their systems in “good” or “very good” condition.[45] Those building features include exterior walls (77 percent) and foundation (74 percent), among others.[46] When looking at systems individually, at least 50 percent of libraries rated each system in “good” or “very good” condition.[47]
About 19 percent, or about 3,100 libraries, had some element of their building envelope in poor condition.[48] The building envelope – composed of exterior walls, windows, roof, and foundation – separates indoor and outdoor environments and affects comfort, lighting, and the functioning of other building systems, including their energy efficiency. Damage to the building envelope can increase energy use and costs; lead to moisture intrusions; and may cause mold or damage within the building, such as to furniture and books.[49]
Individual building systems libraries frequently cited as needing repair or replacement beyond routine maintenance were elevators, HVAC, flooring, and roof, among others (see fig. 8). We did not find significant differences between characteristics we examined – population density (i.e., urban, suburban, large town, and rural), library size, or poverty – and the percentage of libraries with each individual system in poor condition.
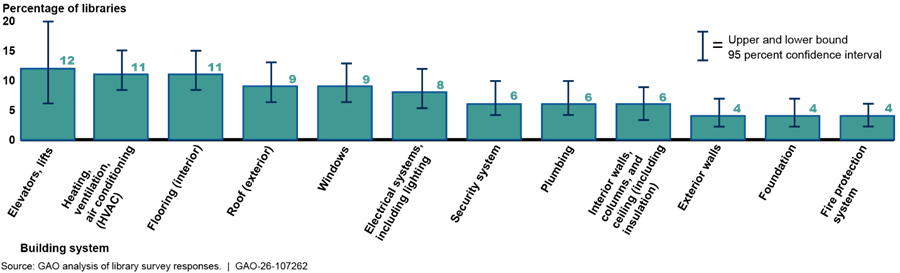
Note: Libraries self-assessed a building system as in poor condition if it needs repair or replacement beyond routine maintenance and is not functioning as required or not meeting the library’s needs. Response options were “very good,” “good,” “fair,” “poor,” “building does not have this feature but needs it,” “not sure,” and “not applicable.” Results in the figure are among those libraries with the applicable system. Each building system was applicable for 90 percent or more libraries, except for security systems (79 percent of libraries) and elevators/lifts (33 percent of libraries). We administered the survey from December 2024 to February 2025. The thin bars (whiskers) display the 95 percent confidence interval for each estimate. Bars with nonoverlapping whiskers are statistically different at the 5 percent significance level.
Elevators. An estimated 33 percent of libraries have elevators or lifts and, among these, 12 percent of libraries report they are in poor condition.[50] Among libraries we visited, libraries reported challenges such as an unreliable elevator that visitors were getting stuck in and an elevator that did not access all floors.
HVAC. We estimate about 1,800 libraries (11 percent) have HVAC systems in poor condition.[51] Eight of the 23 libraries we visited also reported issues with their HVAC system, including inefficient or ineffective systems. Officials from one library in California said that leaks from the HVAC unit on the roof had damaged collections and described instances of triple-digit weather causing a health hazard when many children and parents are in the library’s small space. Officials there also said the library system was not able to identify funds to install a new HVAC system, as the estimated cost is likely above $60,000. A stakeholder from a national library organization said that some rural libraries may close if they cannot keep the building temperature hot or cool enough for the public. Another library building we visited in Puerto Rico faced limited use of the library in certain areas, including needing to use the newly renovated children’s room for offices instead, due to their broken air conditioning system (see fig. 9). We previously reported that there are serious consequences to not maintaining or updating HVAC systems, including closing facilities.[52]
Over 30 respondents to our survey noted challenges with temperatures or HVAC inside their library, with some writing that their current HVAC system struggles to maintain comfortable temperatures. One respondent noted that building temperatures reached over 95 degrees after the HVAC system broke, and the library had to close for a month.
Most responding libraries in our sample with an HVAC system in poor condition either do not have a planned repair or replacement project within the next 5 years or do not have funding allocated to fix their HVAC system.[53]
Flooring. We estimate about 1,800 libraries (11 percent) also have flooring in poor condition.[54] Five libraries we visited had damaged flooring. Additionally, several respondents to open-ended questions in our survey wrote in concerns about tripping hazards due to the condition of carpets in their library. Eight library officials told us water intrusions have affected flooring; collections; technology; and other building systems, such as their HVAC system.
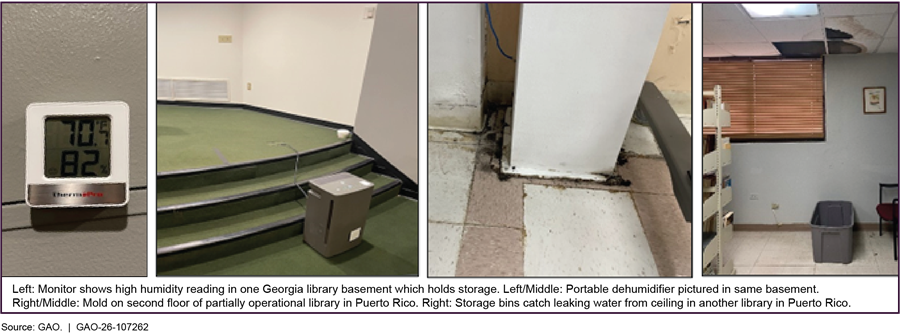
Eight of the 23 libraries we visited had experienced mold in their building due in part to water intrusion, and several respondents to our survey discussed mold or potential mold in their buildings. For example, one library in Puerto Rico flooded after a hurricane and sustained damage throughout its building, including to the library’s carpets, which developed mold. Officials in one partially operational library in Puerto Rico showed us mold growing on the floor (see fig. 10), and officials in another library said several areas and materials became covered in mold, as they were unable to clean the library immediately after Hurricane Maria due to being without power and water for months. Officials said this led to a total loss of those materials and other equipment. One library in Georgia needed a dehumidifier to mitigate high humidity levels in the basement that caused mildew in the space.
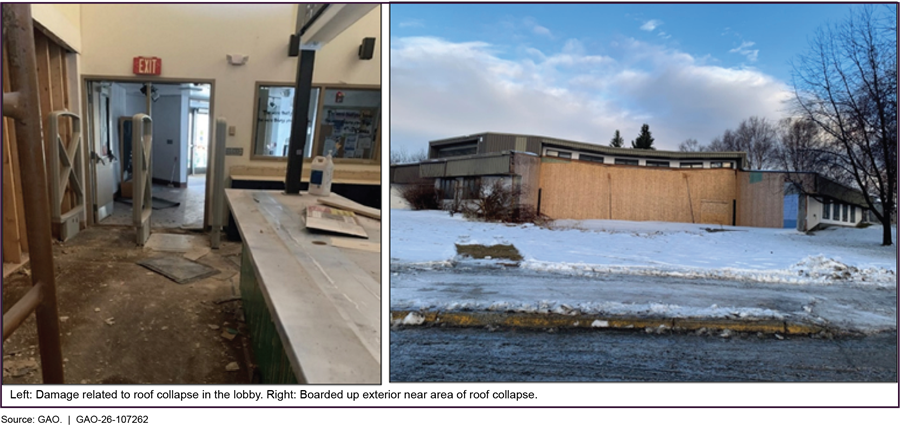
Roof. We estimate that about 1,400 libraries (9 percent) have their roof in poor condition.[55] Nine libraries we visited also mentioned needing roof repair or replacement. For example, large amounts of snowfall and poor building conditions in one library in Alaska led to the roof collapsing in the children’s section while patrons were in the building (see fig. 11). While no one was injured, the library closed for several months and is now housed in a temporary space.
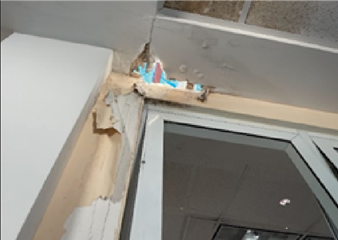
Figure 11: Interior Damage to Ceiling and Exterior of Area Related to Roof Collapse in a Now-Relocated Library in Alaska
A roof in disrepair can lead to water intrusion, which can negatively affect other building systems, services, or library collections. Officials from one California library that needed a roof repair said they were concerned water leaks threatened technology equipment. In Georgia, library officials told us their leaking roof, along with a deteriorating external façade, resulted in mold. In Puerto Rico, one library’s roof leaks caused damage to the air conditioning, furniture, and books. At the time of our visit, the library had suffered from a loss of services when the community partner who had occupied the second floor left, pending completed repairs.
Roof repairs can be high-cost projects. Officials in a small library in California told us they paid about $50,000 for a roof replacement in recent years. Officials from a library in Puerto Rico told us the Federal Emergency Management Agency (FEMA) estimated around $200,000 to replace a roof after hurricane damage. However, they received a contractor bid of about $300,000 to complete the work. They expect costs to be even higher, now that some years have passed.
|
Some Tribal Libraries Face Poor Facility Conditions We spoke to several representatives from national tribal organizations and tribal officials about issues facing tribal libraries, though they cautioned us not to generalize across all Tribes, as experiences vary. Natural disasters and extreme weather. A representative from a national tribal organization noted that buildings in poor condition are not resilient against natural disasters or extreme weather. They recalled a library impacted by a natural disaster that had to throw away many items with water damage and later faced mold issues. A tribal cultural center we visited had their library materials in storage after moving out of their original building due to its vulnerability to natural disasters. With no space to lend out materials in their temporary buildings, their materials are in storage in the basement, which experiences risk of flooding and standing water. Tribal officials said they have been in the temporary building since 2020 and expect to be there for at least another 3 years, until they can secure funding for a new facility. Inadequate building systems. A representative noted that buildings may not have the necessary conditions—such as climate controls—to preserve collections. They added that it is common for Tribes to not have a standalone library but to share space within another building, such as a government building, due to the expense of constructing a separate library facility. However, these buildings may not have appropriate climate controls, or they may be in poor condition, which can damage books. Further, poor facility conditions affect libraries’ ability to meet community needs, for example, providing access to internet and computers, which can be limited in tribal communities. |
Source: GAO analysis of interviews with tribal officials and representatives. | GAO‑26‑107262
An Estimated 43 Percent of Libraries Have Identified at Least One Physical Barrier to Accessibility
Of six specific physical barriers to accessibility – such as inaccessible entrances – we estimate that 43 percent of libraries, or nearly 7,000, have at least one barrier.[56] This estimate includes, for example, 21 percent that either do not have any accessible parking or there are not enough accessible parking spaces, and 18 percent with inaccessible or insufficient accessible bathrooms (see fig. 12).[57] We previously reported that facilities with physical barriers limiting access can exclude people with certain disabilities from participating in community and civic activities occurring in those facilities.[58]
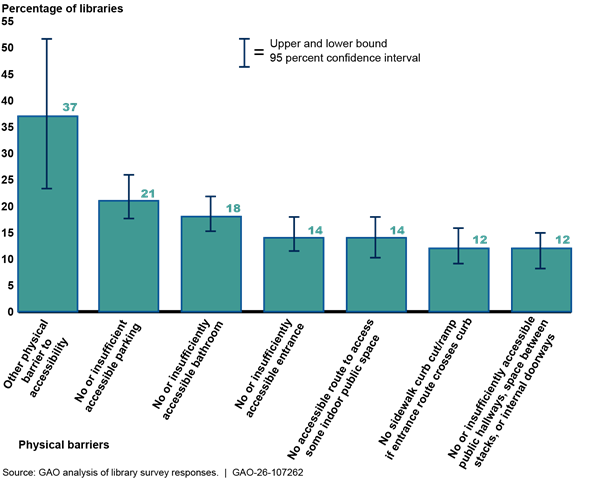
Note: In this report, we define barriers as structural or physical features that have the potential to limit access for a person with disabilities. Percentages shown are those answering “have this barrier.” Respondents could write in additional “other physical barriers,” which included high shelving, inaccessible service desk, uneven sidewalks, and other answers. We administered the survey from December 2024 to February 2025. The thin bars (whiskers) display the 95 percent confidence interval for each estimate. Bars with nonoverlapping whiskers are statistically different at the 5 percent significance level.
We found that physical barriers to accessibility are more common in rural libraries and small size libraries (i.e., less than 500 square feet).[59] We compared our survey results on accessibility barriers across libraries of different sizes, population densities, and poverty rates to identify any differences in experiences. We found significant associations between some categories:
· An estimated 55 percent of rural libraries have at least one barrier, compared with 33 percent of urban libraries.[60]
· Higher percentages of rural libraries and small size libraries have bathroom accessibility challenges than urban libraries (29 percent and 39 percent, compared with 9 percent, respectively).[61]
· An estimated 24 percent of rural libraries and 30 percent of small size libraries do not have an accessible entrance, or have an insufficiently accessible entrance, compared with 5 percent of urban libraries.[62]
· An estimated 30 percent of small size libraries have accessibility challenges with their public hallways, space between stacks, or internal doorways, compared with 6 percent of urban libraries and 9 percent of suburban libraries.[63]
· We did not find significant associations between the poverty rate and the percentage of libraries with each type of barrier to physical accessibility.
At 11 libraries we visited, officials cited concerns, such as the accessibility of entrances, ramps, and the configuration of public spaces, which can limit wheelchair access into, turning within, or movement through library areas. We saw instances where accessibility features were installed, but officials expressed concerns about the sufficiency of those features (see fig. 13). For example, officials in one library in Indiana noted that, though the library entrance was accessible, the library itself was located on a sloping hill, which made accessing the building site in a wheelchair challenging. Similarly, accessible parking was available in one library in Maine, but officials cited concerns with a steep and twisting ramp used to navigate from the parking lot. This was also the case in another library in Puerto Rico, where officials expressed concerns that the ramp to the front door steeply sloped down a long distance before providing any sort of landing to pause.
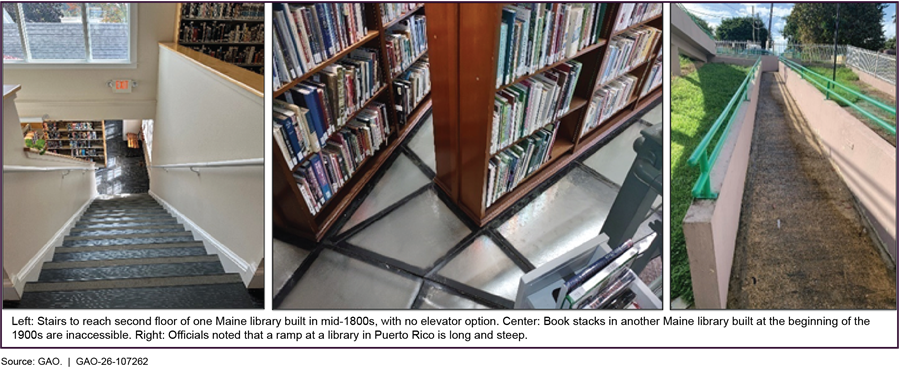
Some representatives from national library organizations emphasized that physical barriers are common among older libraries. Older buildings may have space or cost limitations that prevent them from being modernized with accessibility features, such as ramps or elevators. Officials from one state library said that about half of the libraries within their state were built prior to the passage of the ADA in 1990. We saw several older libraries with accessibility challenges, such as one in Maine that was built in the mid-1800s as a private home with a second floor only accessible by stairs. Another Maine library, built in the early 1900s, has an elevator that does not access the nonfiction books on the third floor. Some stacks in the library are also too narrow for a wheelchair to pass through.
An Estimated 61 Percent of Library Facilities Have Identified Potential Health or Safety Concerns
An estimated 61 percent of libraries, or about 9,800, identified at least one building system or facility issue that poses a potential health or safety concern.[64] One of the most frequent concerns identified in our survey was library size (such as overcrowding and blocked access routes), cited by an estimated 34 percent of libraries (see fig. 14).[65]
Figure 14: Estimated Percentage of Libraries with Potential Health or Safety Concerns Related to Building Issues
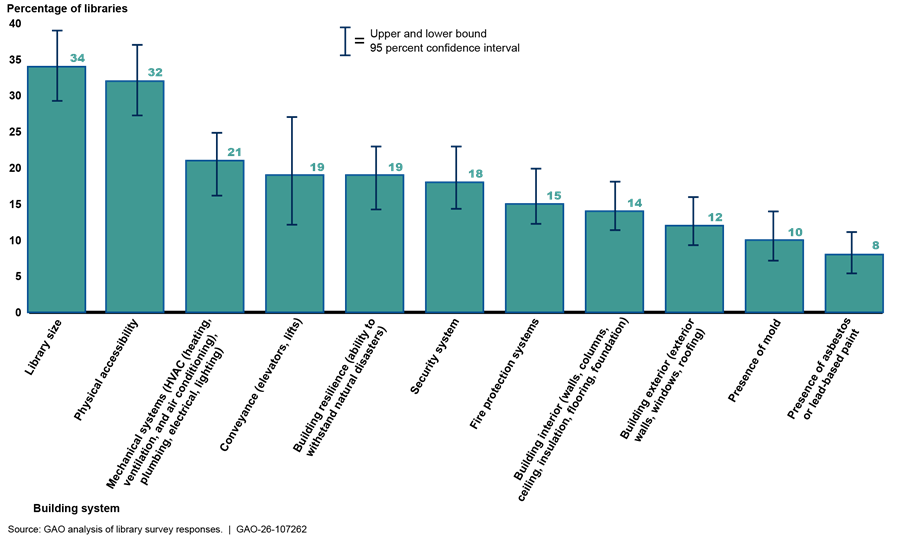
Note: We asked respondents to identify whether a building system was a health or safety concern. Percents shown are those answering “yes” and “somewhat.” The other response options were “no,” “not sure,” and “not applicable.” We administered the survey from December 2024 to February 2025. The thin bars (whiskers) display the 95 percent confidence interval for each estimate. Bars with nonoverlapping whiskers are statistically different at the 5 percent significance level.
Four libraries we visited, as well as some respondents to our survey, cited concerns with the size of their library as it relates to overcrowding and accessibility of movement within the library. Officials in one California library told us they worried about violating occupancy limits, with 90 children registered for the upcoming summer reading program. Though the area has experienced recent population growth, officials said they did not anticipate receiving funds to expand their library, and other libraries in the system had closed due to funding issues. Survey respondents also mentioned challenges in their library, with limited spaces to move or blocked routes due to not having sufficient space for visitors and their belongings or for library materials.
Physical accessibility (or physical barriers to movement or access) was also cited as a potential health or safety concern for 32 percent of libraries.[66] According to our analysis, rural libraries in particular experienced accessibility as a potential health or safety concern, with an estimated 43 percent citing concern, compared with 19 percent of urban libraries.[67] Respondents to our survey mentioned issues, such as trip hazards related to the condition of flooring, and concerns about navigation into and around their libraries. One respondent noted that visitors in a wheelchair need physical assistance to enter the library and then need to be returned to their wheelchair.
Survey respondents cited additional health or safety concerns, such as fire safety, adequacy of security systems, and building temperature. We estimate that 15 percent (about 2,200 libraries) self-report not having, but needing, a fire protection system.[68] For example, one library we visited in Maine told us their building does not have a fire protection system, and officials were concerned about the potential for electrical outlets to be overloaded. Similarly, one survey respondent said their library uses multiple space heaters due to an aging and unreliable heating system, and staff worry about the potential for a fire due to electrical overload.
Libraries Reported Challenges Meeting Community Needs and Withstanding Natural Disasters Partly Due to Aging Buildings
In the libraries’ current condition, many library buildings’ age, resiliency shortcomings, and size may limit the libraries’ ability to provide their communities the services expected from libraries today and may risk damage or loss of collections due to natural disasters and extreme weather.
Building Age. According to our survey, thousands of the nation’s libraries are over 60 years old, creating facility conditions that may be less able to withstand natural disasters and extreme weather or adapt to changing community needs. Specifically, we estimate that 31 percent of libraries, or about 5,000, are in buildings built prior to 1964.[69] Further, an estimated 16 percent of buildings, or about 2,700, were built over 100 years ago (prior to 1924; see fig. 15).[70] Small size libraries and rural libraries are more likely than urban libraries to be built over 60 years ago, at 45 percent and 43 percent, compared with 22 percent.[71]
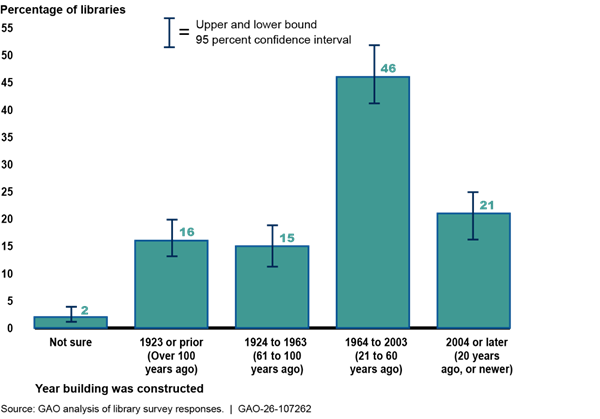
Note: We administered the survey from December 2024 to February 2025. The thin bars (whiskers) display the 95 percent confidence interval for each estimate. Bars with nonoverlapping whiskers are statistically different at the 5 percent significance level. Percentages may not add up to 100 due to rounding.
Older library buildings can have challenges that one library official called “aging building syndrome,” or having building systems that need more repair or replacement over time. Four libraries we visited mentioned facing maintenance and repair needs related to aging buildings, including entire systems that were repaired in a piecemeal fashion, or that now need total replacement. Officials from one state library told us that half of the libraries in their state are over 100 years old, and one library in a historic building only has one electrical outlet for all electronics. Officials from one library we visited in Maine, built over 180 years ago, estimated nearly $6 million for a major renovation, which includes addressing deferred maintenance on aging systems.
Building Resiliency. The age and condition of some older library buildings can lower the libraries’ resiliency to natural disasters and extreme weather. We estimate that about one-third of libraries (about 5,900) experienced a natural disaster or extreme weather from 2020 through 2024.[72] According to FEMA, building codes have improved over the past few decades to better protect against natural disasters, such as flooding, high winds, and earthquakes.[73] Older library buildings, particularly those with aging systems (such as an aging roof or windows), may be at greater risk of not withstanding extreme weather conditions or temperatures. For example, officials from libraries in California and Maine both told us their HVAC systems struggled with extreme temperatures. Officials in Maine were concerned with building temperatures that got too cold for visitors and risked pipes freezing and bursting.
Some stakeholders also mentioned that some libraries are expected to provide emergency services after a natural disaster or extreme weather. However, poor building conditions, particularly those in aging facilities, may mean that some may not be able to perform this function during natural disasters.[74] Officials from one library system we visited in California said they considered themselves an outlier, in that many of their library branches are highly resilient and serve as local assistance and resource centers after natural disasters. For example, they installed a backup generator that allows one library to serve as the county’s emergency operations center.
|
Libraries in Puerto Rico Continue to Experience Delays in Repairs After Hurricane Maria and Other Natural Disasters
At the time of our visit, a poorly repaired roof in one library continued to leak water, damaging collections, furniture, and the HVAC system. A partner organization had to leave the second floor of the library due to the damages, resulting in the loss of computers and the programming the organization provided to the community.
|
Source: GAO analysis of interviews with library officials and GAO (photos). | GAO‑26‑107262
Size and Technology. Library stakeholders also said older buildings were not designed to meet modern library functions, in part due to having outdated technology and being designed around a smaller footprint. Officials from six libraries we visited discussed the need to respond to changing roles and increasing expectations to provide additional community services. We estimate that 77 percent of libraries provide or host event space for public use, and 49 percent provide or host health care services.[75] These additional services require library buildings to be equipped to meet current technology use, to provide community meetings and programming, or to provide private spaces for telehealth meetings. However, we estimate that for 45 percent of libraries, their size does not meet needs, or only somewhat meets needs, with some respondents citing not having enough space to hold programming or community meetings.[76] Further, system upgrades are essential to meet today’s HVAC, energy, and lighting requirements, and libraries may need to undergo modernizations to address modern technology needs.
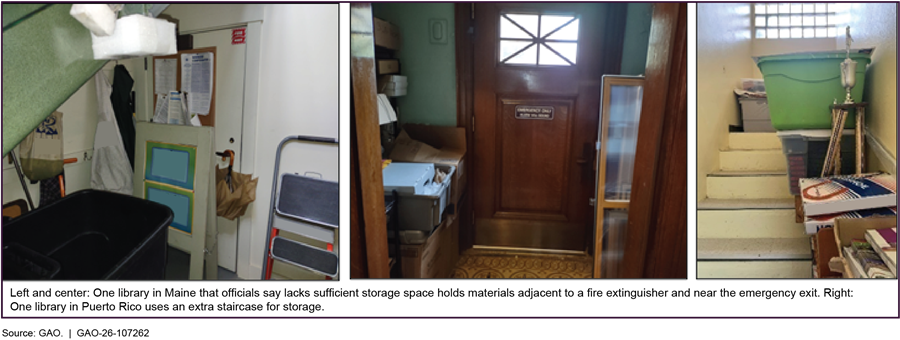
Risk to Collections. We estimate that for 54 percent of libraries (about 8,800) the condition of at least one of their building systems poses a risk, or potential risk, to their collections.[77] An estimated 30 percent of libraries cited concerns with the size of their storage space.[78] Some respondents discussed needing to discard materials due to lack of storage space, and others said they have to store collections in areas whose conditions put their collections at risk of water damage, such as from flooding. Ten libraries we visited discussed concerns about storage space — one library has some materials stored on a staircase (see fig. 16).
An estimated 22 percent cited risk, or potential risk, to collections due to the condition of mechanical systems, such as HVAC or plumbing, and 19 percent cited concerns with the building exterior, such as windows or roof.[79] Survey respondents noted leaks and other water intrusions, climate control issues that cause mold, as well as concerns about building resiliency to withstand natural disasters, among other issues that threaten collections.
Total Cost for Facility Repair Needs Is Unknown, but an Estimated 70 Percent of Libraries Defer Maintenance
Facility Repair Costs Nationwide Are Unknown, but Some States and Libraries Have Estimated Costs
Data on the total cost to address library facility maintenance and repair needs nationwide do not exist. This is due in part to the absence of a general requirement for data collection and reporting, according to a stakeholder from a national library organization, and differences in the way state libraries assess and review their facility conditions, as well as differences in how frequently data are collected. For example:
· Illinois is one of the few states where libraries self-report facility conditions as part of a biannual survey of public libraries.
· Georgia’s state library administrative agency commissioned a professional contractor to conduct facility condition assessments of a third of all its libraries in 2023.
· In Pennsylvania, libraries are required to self-report their facility needs assessment every 5 years, according to the state librarian.
Representatives of several state library agencies told us that they have not conducted statewide library facility assessments largely due to funding availability and in part due to not having the authority to conduct a study. The methods states used and estimated costs to address library facility maintenance and repair needs in selected states in the last 10 years are shown in table 5.[80]
Table 5: Methods Selected States Used to Estimate Costs to Address Library Facility Maintenance and Repair Needs
|
State |
Year |
Estimated cost (dollars in millions) |
Entity conducting review |
Cost estimate elements |
|
Alaska |
2021 |
$116.3 |
Libraries self-reported one-time need |
Remodel, roof, HVAC, electrical systems, ADA compliance |
|
California |
2024 |
$650 |
Libraries self-reported one-time need |
Deferred maintenance backlog after conducting a one-time survey of its libraries |
|
Georgia |
2023 |
$178.9 |
Contracted third-party |
Deferred maintenance, mostly to address aging of certain HVAC, plumbing, and electrical systems, among other building deficiencies |
|
Illinois |
2023 |
$913.9 |
Illinois State Library |
General repair and renovation, building additions, and new building construction for the next 2 years |
|
New York |
2023 |
$1,750.2 |
New York State Library (semiregular survey of all regional library systems) |
Construction needs for the next 5 years |
|
Washington |
2019 |
$259.6 |
Contracted third-party |
Limited to rural distressed counties; includes limited improvements, renovation, expansion, and new construction |
Legend: ADA = Americans with Disabilities Act
HVAC = heating, ventilation, and air conditioning
Source: State library administrative agency documents. | GAO‑26‑107262.
Note: Cost estimates are from the respective states, and we did not assess the reported estimates for data reliability. These figures are not adjusted for inflation. We identified and obtained information on these selected states during our site visits and interviews with stakeholders.
As with states, there is variation in the way local libraries have conducted facility condition assessments. On the basis of our survey, we estimate that 33 percent of libraries have conducted a facility condition assessment in the last 10 years.[81] In particular, we estimate that 23 percent of rural libraries and 43 percent of urban libraries have conducted a facility condition assessment.[82] Representatives from four libraries we visited also told us that they had assessed their facilities, while eight libraries did not. One state librarian we spoke to said that local libraries are asked to self-report their needs in their statewide facilities assessment. However, the official said that some libraries are challenged because they do not have sufficient facility staff or funding to hire experts who can assess building conditions and estimate repair costs. Officials from two library associations we spoke to also noted that individual librarians may be aware of facility issues at their library but do not have the expertise to develop cost estimates.
An Estimated Majority of Libraries Expect Their Backlog of Deferred Maintenance to Persist or Increase
We estimate that a majority of libraries (70 percent, or about 11,200) have a backlog of deferred facility maintenance, with many libraries having over $100,000 in deferred maintenance and repairs.[83] Having a backlog of deferred maintenance does not necessarily indicate greater future maintenance and repair needs, for example, if there are no plans to make repairs because a new system will be installed in the near future.[84]
However, deferring needed maintenance and repair can lead to systems not functioning as required, resulting in poor facility conditions, such as leaking roofs, mold, or HVAC systems that are no longer energy efficient or safe. For example, an official from a branch library in a rural town we visited said they estimated needing about $60,000 for a new HVAC system, and another estimated $226,000 in construction costs for exterior and interior building improvements, including asbestos removal.
We and others have previously reported that deferred maintenance can have negative consequences, including limiting an organization’s ability to carry out its mission, shortening the life and value of a facility, and potentially resulting in significantly higher maintenance and repair costs.[85] A significant backlog of deferred maintenance can even necessitate the construction of an entirely new building. For example, officials from a library we visited said that their library building had not been updated since 1985, leading in part to its roof collapsing and the need to construct a new library building.
Many libraries were unable to significantly reduce their deferred maintenance backlog in recent years. On the basis of our survey, we estimate that 39 percent of libraries (about 6,200) report having a current deferred maintenance backlog over $100,000.[86] In contrast, about 12 percent of libraries (about 1,900) spent over $100,000 on deferred maintenance in 2023.[87] We estimate that in 2023, about 16 percent of libraries did not spend any money addressing their deferred maintenance backlog, as shown in figure 17.[88]
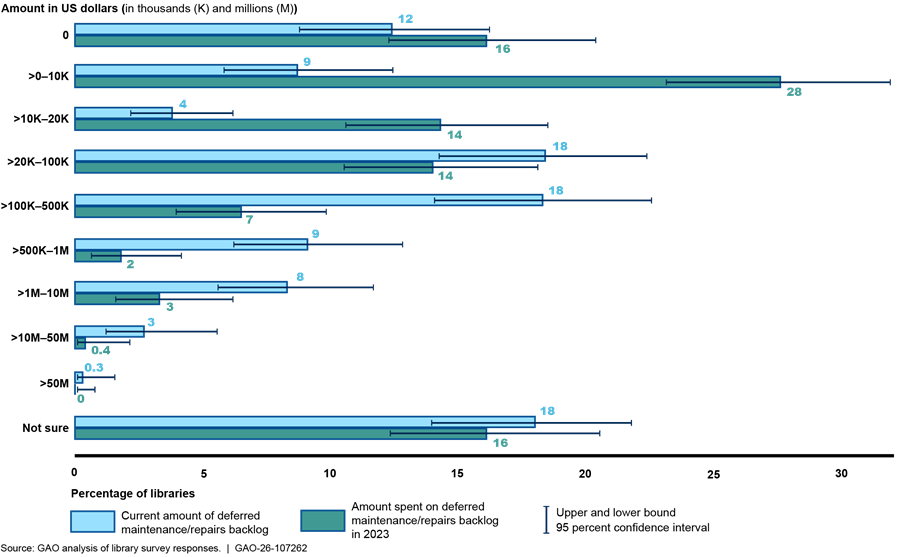
Note: Our survey asked respondents to self-report their estimated amount of deferred facility maintenance. We administered the survey from December 2024 to February 2025. The thin bars (whiskers) display the 95 percent confidence interval for each estimate. Bars with nonoverlapping whiskers are statistically different at the 5 percent significance level.
Moreover, an estimated 71 percent of libraries experienced an increase or no change in the size of their deferred maintenance backlog in the past 3 years (see fig. 18).[89] Specifically, 30 percent experienced an increase, while 41 percent experienced no change.[90] Ten percent experienced a reduction.[91] Further, we estimate that 79 percent of urban libraries experienced an increase or no change in their deferred maintenance backlog in the past 3 years, compared with 55 percent of suburban libraries and 53 percent of small size libraries.[92]
Figure 18: Estimated Percentage of Libraries Whose Deferred Maintenance Backlog Increased, Decreased, or Remained the Same, 2022 to 2024
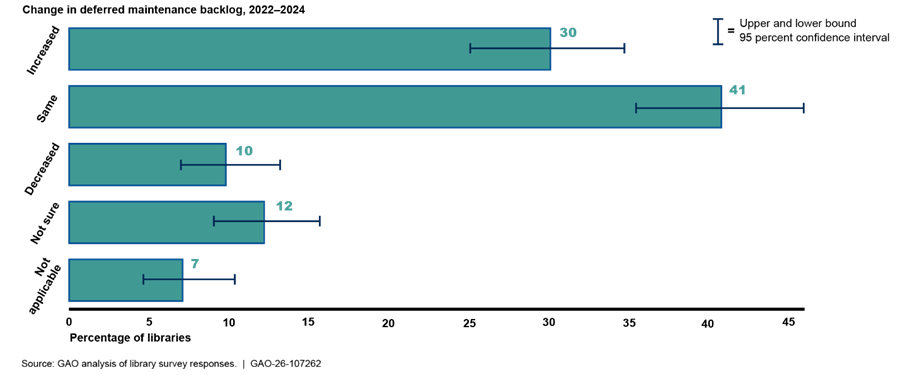
Note: Our survey asked respondents to self-report whether their estimated amount of deferred facility maintenance changed from 2022 to 2024. We administered the survey from December 2024 to February 2025. The thin bars (whiskers) display the 95 percent confidence interval for each estimate. Bars with nonoverlapping whiskers are statistically different at the 5 percent significance level. Survey respondents had the choice of selecting “not applicable” as a response option, but we did not collect data on why the change in deferred maintenance backlog is not applicable.
Based on their budget forecasts and planned projects, libraries expressed pessimism about being able to address their deferred maintenance backlog. We estimate that 70 percent expect deferred maintenance for their facilities to remain the same or increase in the next 3 years, with 35 percent of libraries expecting the backlog to increase (see fig. 19).[93]
Figure 19: Estimated Percentage of Libraries Expecting Deferred Maintenance to Increase, Decrease, or Remain the Same in the Next 3 Years
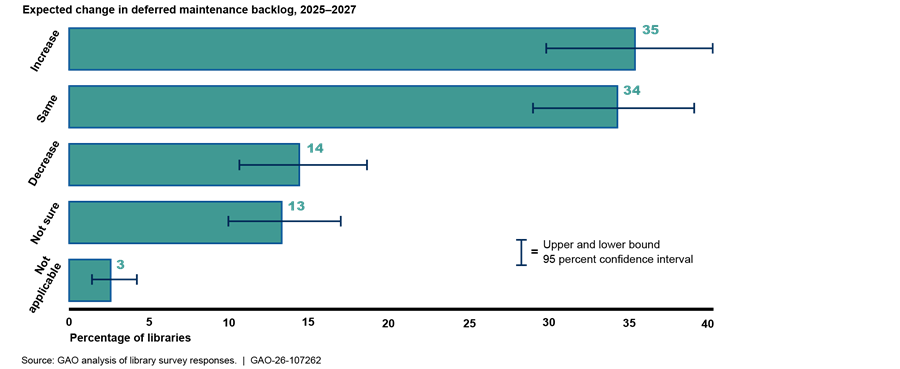
Note: Our survey asked respondents to self-report whether they expect their estimated amount of deferred facility maintenance to change in the next 3 years. We administered the survey from December 2024 to February 2025. The thin bars (whiskers) display the 95 percent confidence interval for each estimate. Bars with nonoverlapping whiskers are statistically different at the 5 percent significance level. Survey respondents had the choice of selecting “not applicable” as a response option, but we did not collect data on why their expected change is not applicable.
Libraries Have Identified Construction Costs and Funding Availability as Key Challenges to Addressing Library Maintenance and Repair Needs
The two most common challenges to addressing facility maintenance and repair needs that libraries cited in response to our survey are construction costs and funding availability (see fig. 20).
Figure 20: Estimated Percentage of Libraries Rating a Challenge to Addressing Maintenance and Repair Needs as “Major” or “Moderate”
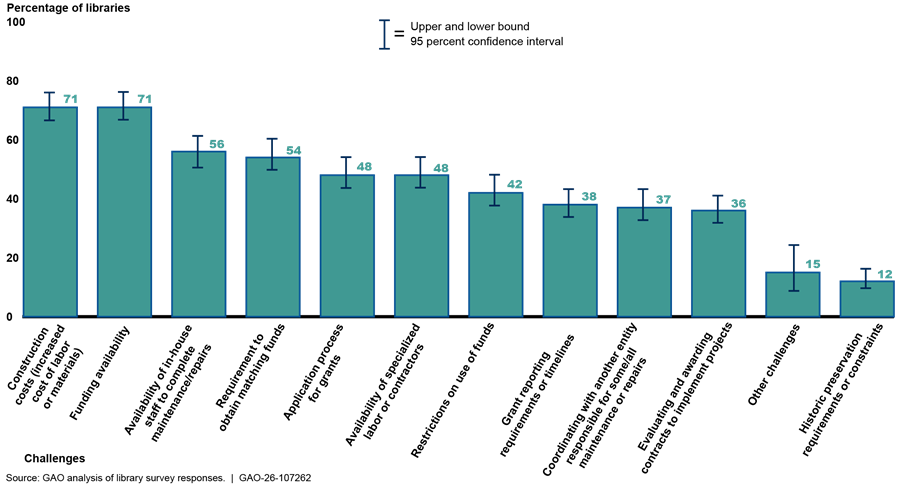
Note: Response options were “major challenge,” “moderate challenge,” “minor challenge,” “not a challenge,” “not sure,” and “not applicable.” We administered the survey from December 2024 to February 2025. The thin bars (whiskers) display the 95 percent confidence intervals for each estimate. Bars with nonoverlapping whiskers are statistically different at the 5 percent significance level.
Construction Costs
An estimated 71 percent of libraries experience construction costs, such as higher labor or material costs, as a major or moderate challenge for addressing maintenance and repairs.[94] One urban library director reported construction costs of up to $2,000 per square foot in their area. Library stakeholders also mentioned cost as a challenge for addressing accessibility barriers, particularly for libraries serving less population, which have a more limited tax base.
Officials from four libraries we visited and other stakeholders we spoke with also raised construction costs as a challenge. For example, representatives from two libraries we visited in rural areas said that construction costs are high for them because of the cost to transport materials to their relatively remote communities. Several libraries we visited also noted that original cost estimates for maintenance and repairs have increased over time, due to inflation, for example. We did not find significant associations between characteristics we examined (population density, library size, or poverty) and the percentage of libraries citing construction cost as a major challenge. We estimate that about 18 percent of libraries considered construction costs as a minor challenge, or not a challenge, to addressing repairs.[95]
Funding Availability
An estimated 71 percent of libraries also experience funding availability as a major or moderate challenge for addressing maintenance and repairs.[96] Officials from nine of the 23 libraries we visited also said that funding availability is a challenge to making needed building repairs. For example, officials from one library in Maine told us they face several water intrusions, along with other repair needs; they estimate one project alone would cost over $10,000, but the library has an annual budget of $8,000 for capital improvements. Library stakeholders told us that available funding for libraries largely supports programming, with few funding sources covering maintenance and repair needs.
Rural libraries and libraries in high-poverty areas experience funding availability challenges more acutely than other libraries.[97] Stakeholders we spoke to also said that reliance on local funding to maintain library facilities can exacerbate inequities, as economically distressed or rural communities may have less population and a more limited funding base. One stakeholder noted that tribal libraries have similar issues with limited funding bases. A representative from a national library organization said most building renovation projects include at least some private fundraising. However, one library director we spoke to in California noted that some communities may not have the resources to raise funds.
On the basis of our analysis of community characteristics, we estimate that 56 percent of rural libraries experience funding availability as a major challenge to addressing maintenance and repairs, compared with 34 percent of suburban libraries and 36 percent of urban libraries.[98] Further, we estimate that 58 percent of libraries in high-poverty areas experience funding availability as a major challenge, compared with 28 percent of libraries in low-poverty areas.[99]
We estimate that about 90 percent of libraries used local funding for maintenance and repairs from 2020 to 2024 (see fig. 21).[100] Of libraries that used local funding, about 68 percent said that it was the primary funding source they used to address maintenance in that period.[101]
Figure 21: Estimated Percentage of Each Funding Source Libraries Used for Maintenance and Repairs In 2020-2024
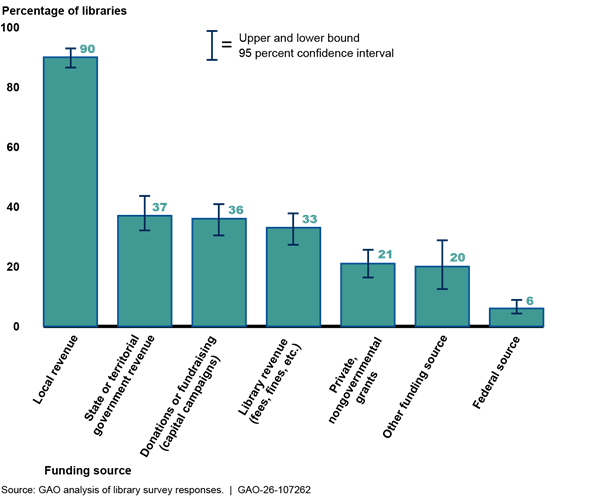
Note: Results are of libraries that made repairs from 2020 to 2024; 8 percent of libraries said they did not make any repairs in this period. We administered the survey from December 2024 to February 2025. The thin bars (whiskers) display the 95 percent confidence interval for each estimate. Bars with nonoverlapping whiskers are statistically different at the 5 percent significance level. Other responses included trusts, insurance, endowments, and other answers.
Reliance on local funding can pose challenges to addressing facility repair needs. According to stakeholders, the location and governance of a library can affect the types of local funding sources, such as local taxes or bonds. They added that libraries that are part of a county government entity may receive funding from a county for repair, including dedicated funding from tax revenues, but they may also compete with other departments for local funding, such as funding needed for public safety. Similarly, library officials in Alaska said they planned to construct a new library building using a city bond of $10 million, a $5 million grant from the state, as well as foundation funding. However, according to one state librarian, getting approval for a bond or tax increase for libraries is challenging, as it could require competing with other needs in the community, such as funding public schools.
Although some state or territorial funding sources for library maintenance and repair are available, state librarians note it may not be sufficient to cover statewide repair needs, deferred maintenance, accessibility projects, and projects building resiliency against natural disasters and extreme weather. For example, libraries in one state could apply for funding of $489 million across two fiscal years through the state’s library facilities improvement grant program, which addressed a select set of issues, such as critical maintenance needs. However, the librarian of that state said that even $200 million in state funding for capital projects is not sufficient to address the facility needs of all the libraries in their state. Another state librarian said that adding extra projects—such as addressing accessibility and building resiliency—onto regular maintenance and repairs requires more significant amounts of funding.
Several library stakeholders also mentioned five federal funding sources that have been available in past years for library facility maintenance and repairs. As previously mentioned, IMLS funds cannot be used for facility construction. Federal funding sources that stakeholders mentioned having been available for facilities issues included money from the American Rescue Plan Act, the U.S. Department of Agriculture via a program that provides rural library funding, and the National Endowment for the Humanities via funding made available for historic buildings. Four libraries we visited also mentioned applying to FEMA for repairs after natural disasters, although all four noted that the FEMA funds were not sufficient to complete repairs. Two state librarians also said their state received congressionally directed funding.[102] However, one state librarian commented that this requires communities to request funding from legislators for specific projects, which is a different process than distributing funding per the state’s needs-based project list.
In contrast, we estimate that 25 percent of libraries consider funding availability as a minor challenge, or not a challenge.[103] For example, officials from one library system in Indiana said they maintain a database of building systems and their life cycles, which allows them to accurately anticipate and budget for future repairs.
|
Tribal Libraries Face Funding Challenges and Competing Priorities
One representative said that, in their experience, tribal library facilities are severely underfunded, and funding issues affect their ability to provide library services or construct libraries. Some tribal libraries may need to complete construction in phases, with smaller amounts of money, resulting in higher costs and prolonged time frames. Without sufficient funding to address building needs, tribal library facilities may face challenges withstanding natural disasters and extreme weather. Tribal officials we spoke with in Alaska told us they no longer have a dedicated space for their library, after moving from another facility in a coastal surge zone. They face challenges identifying grant funding for constructing a larger facility. In the meantime, they hold their library materials in basement storage of a temporary building. |
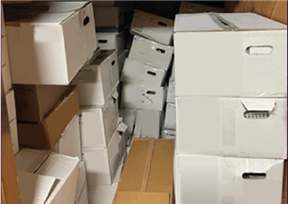
Source: GAO analysis of interviews with representatives from national tribal organizations and tribal officials and GAO (photo). | GAO‑26‑107262.
Other Challenges to Maintenance and Repair
Libraries cited several other challenges to addressing maintenance and repairs, including challenges related to grants. For example, requirements to obtain matching funds pose a major or moderate challenge for an estimated 54 percent of libraries.[104] Some representatives from national library organizations we spoke to said libraries in small and rural communities and in economically distressed areas may not be able to provide the required matching local funds for projects. Further, we estimate that 38 percent face major or moderate challenges with grant reporting requirements or timelines.[105] Stakeholders also said that small and rural libraries may not have the capacity to apply for grants and meet deadlines, particularly if they are under municipal or county control, and cannot guarantee they will meet project and spending deadlines. As we have previously reported, a lack of capacity for grant recipients can adversely affect their ability to successfully access, manage, and implement grants.[106]
An estimated 37 percent of libraries also reported that coordination with another entity responsible for maintenance and repairs poses a major or moderate challenge.[107] For example, due to complications around the division of maintenance responsibilities between the city and county, the roof in one rural library in California we visited had not been replaced for many years, despite leaks. One respondent to our survey wrote that another entity owns their library building, and safety hazards go unaddressed for months. These hazards include rotten stairs, mold from water damage, loose floor tiles, and fire safety issues. Another survey respondent noted that a library may not have the funding to take on substantial repairs themselves without support from the entity responsible for repairs.
When responsibility for maintenance and repairs falls on another entity, such as the city or municipality, that entity may defer maintenance due to competing priorities. Officials from a library we visited in Georgia told us their county had a backlog of 50 miles of roads in need of repaving, which took priority over their library system’s needs. In addition to road repairs, they explained that the county has over 300 other public facilities that also compete for county funding.
Agency Comments and Third-Party Views
We provided a draft of this report to IMLS and the Library of Congress for review and comment. In its response, IMLS provided technical comments, which we incorporated as appropriate. The Library of Congress had no comments.
We are sending copies of this report to the appropriate congressional committees, the Acting Director of IMLS, and other interested parties. In addition, the report is available at no charge on the GAO website at https://www.gao.gov.
If you or your staff have any questions about this report, please contact me at MarroniD@gao.gov. Contact points for our Offices of Congressional Relations and Public Affairs may be found on the last page of this report. GAO staff who made key contributions to this report are listed in appendix II.

David Marroni, Director
Physical Infrastructure Issues
This report examines the (1) differences in availability of public library facilities by geographic region, as well as in economically disadvantaged and underserved communities; (2) reported physical conditions of library facilities; (3) estimated cost to address facility repair needs; and (4) challenges to addressing them.[108] To address these objectives, we
· analyzed and mapped the geographic locations of library facilities to measure the availability of libraries by travel mode (driving and walking) and travel time (10 minutes one way for driving and 20 minutes one way for walking) nationwide and across states;
· developed a statistical model to assess the extent to which the availability of library facilities was associated with community characteristics and determined whether there were any differences by community demographics;
· surveyed a nationally representative sample of libraries;
· visited 23 libraries, including two in Tribal Nations and 21 in seven states and territories (Alaska, California, the District of Columbia, Georgia, Indiana, Maine, and Puerto Rico); and
· reviewed relevant federal laws, regulations, and agency documentation from the Institute of Museum and Library Services (IMLS) and library stakeholders. We also interviewed officials from IMLS; the Library of Congress; state and territorial library administrative agencies; and library stakeholders, such as the American Library Association.
Availability of Library Facilities Data Analysis
To examine the availability of libraries, including in economically disadvantaged and underserved communities, we first conducted a literature review to identify units of measurements, methods for assessing availability of library facilities, and demographic characteristics associated with determining any geographic and community differences. Based on our literature review and an initial test run of our analysis on two states, we established library availability thresholds by travel mode (driving and walking) and travel time (10 minutes one way for driving and 20 minutes one way for walking).
Next, we gathered data on library locations and community characteristics. We used data from IMLS’s fiscal year (FY) 2022 Public Libraries Survey, which includes the physical address and specific geospatial data (i.e., geographic coordinates for location) for library facilities.[109] We assessed the reliability of these data by reviewing technical documentation, interviewing agency officials, and testing the data (e.g., for missing data, outliers, and obvious errors) and determined that they were sufficiently reliable for the purposes of assessing the availability of libraries. We also used data from the U.S. Census Bureau for census tract-level data on community characteristics and the 2010 Rural-Urban Commuting Area classification codes related to population density from the U.S. Department of Agriculture’s Economic Research Service.[110]
We merged the three datasets to conduct two types of analyses:
1. We analyzed the spatial distribution of library facilities to population centers in census tracts and estimated communities’ proximity to library facilities. We defined library availability differently for different units of analysis, including at the census-tract population centroid and at the county level. For descriptive and modeling purposes, we defined library availability in walking distance as any tract population centroid that is within a 20-minute walk time polygon of a library, according to either walk time calculation or polygon tool. We defined library availability in driving distance as any tract population centroid that is within a 10-minute drive time polygon or within a 10-minute drive of a library.
We calculated walk and drive time for U.S. Census 2020 population centroids. We defined walking and driving distance as the time it takes to walk or drive to the nearest library, which we identified using nearest Euclidean distance. Additionally, using the Network Analysis Toolset in ArcGIS Pro v.3.2.2, we estimated drive and walk time to service areas for each library facility and the travel time (driving and walking) between population centroids in each census tract and its nearest library facility. We used these service areas to estimate the libraries and library square footage available to residents by using a two-stage floating catchment area methodology.
We compared tracts and counties to determine whether there are statistically different travel modes and times than the national rate. In some cases, walk and drive time, as well as walking and driving distance, could not be calculated. For instance, some tract centroids were on islands with no accessible library or in areas without publicly accessible roads that connect to the nearest libraries. We also excluded tracts that did not have data on key measures, such as population and urbanicity, that are necessary for contextualizing information on library availability. Our analysis does not account for potential traffic in communities as part of drive time. We calculated drive time for 84,403 tracts and walk time for 73,858 tracts.
2. We then developed a statistical model to assess the extent to which library availability was associated with community characteristics, using data from the American Community Survey and controlling for other community characteristics or factors we identified as affecting library availability. We used a regression analysis that allows for the assessment of association between availability (driving or walking time to the nearest library) and a variety of demographics at the same time. This analysis allows us to compare travel time for an otherwise similar community, one demographic at a time. With a regression, communities that are otherwise similar in terms of the demographics in the model can be compared on the basis of one demographic at a time, while holding other demographics in the model constant.
A regression can also assess travel times in minutes as an increasing value on a continuum, as an alternative to a 10-minute walk or 20-minute drive cutoff. For example, we assess whether communities that are otherwise similar in terms of other demographics (e.g., percent of households that have no vehicle, that are in poverty, with share of population under 5 years old, etc.) but with higher median household income are associated with longer or shorter travel times to the nearest library when compared with similar communities with lower median household income.
We used an ordinary least squares regression for walk and drive times as the outcomes, based on a log scale to temper larger values. The community characteristics we used in our model included the percentages of communities in census tracts with (1) population from historically underrepresented racial and ethnic groups, (2) median household income, (3) populations that are under 5 years and over 65 years of age, (4) no vehicle, and (5) families below the federal poverty level.[111] We also fixed effects for states to account for any state level variation and ran models with and without controls for facilities per 10,000 population and library square feet per 1,000 people.
Finally, we ran models separately within each urbanicity (urban, suburban, large town, and rural), according to the U.S. Department of Agriculture’s Economic Research Service’s 2010 Rural-Urban Commuting Area classification. If the relationship between a demographic and the travel times was inconsistent across models or across urbanicity, we considered the results mixed. Associations were assessed using statistical tests at the alpha = 0.05 level of significance.
Web-Based Survey of Libraries
To examine the reported physical conditions of library facilities and estimated costs and challenges to address facility repair needs, we designed and administered a survey to a generalizable stratified random sample of libraries. We sent the survey to library system directors or library branch managers and permitted directors to forward the survey to officials best equipped to answer questions related to the condition of library facilities. We administered the survey from December 2024 to February 2025. The survey included questions about
· library characteristics, including whether libraries provided or hosted any emergency, healthcare, and social services, as well as the year the library building was constructed;
· physical conditions of library building systems or features, including any planned repair or replacements projects in the next 5 years, sufficiency of available space, health or safety concerns with the condition or functionality of building systems, and challenges to addressing maintenance and repair needs;
· accessibility, including whether there are physical barriers to access for people with certain disabilities, such as mobility impairments;[112]
· estimated cost of deferred maintenance backlog and the funding sources that libraries use to address facility repair needs; and
· experiences with facility damages from natural disasters and extreme weather.
We used the Public Library Outlet Data File from IMLS’s FY 2022 Public Libraries Survey as our sample frame, which consisted of 17,546 libraries nationwide. The FY 2022 data were the latest available for our survey. For the purposes of our survey, we first limited the sample frame to central and branch libraries that were in the scope of our target population:
· meeting the Federal-State Cooperative System definition of a public library;
· located in the 50 U.S. states, the District of Columbia, and four territories (American Samoa, Guam, the Northern Mariana Islands, and the U.S. Virgin Islands);[113]
· not temporarily or permanently closed;
· not bookmobiles or books-by-mail; and
· not tribal libraries.[114]
We assessed the reliability of the Public Library Outlet Data File by reviewing existing documentation about the data and performing electronic testing on required data elements and determined they were sufficiently reliable for the purposes of our reporting objectives.
Although we used data fields within the Public Library Outlet Data File to identify libraries that were in the scope of our target population, we also requested state library administrative agencies to identify and confirm libraries known to have closed since 2022, or those that are tribal libraries or otherwise out of scope but not identified as such in the Public Library Outlet Data File. Because the Public Library Outlet Data File did not include contact information for every library in the database that was needed to disseminate our survey, we also obtained contact information from each state’s and territory’s library administrative agency.
Using the data available from the Public Library Outlet Data File, we developed a datafile template and instructions for the requested data variables (name, emails, and phone numbers) for the in-scope libraries within that state that were in the 2022 data file, for each of the 55 states and territories (all 50 U.S. states, the District of Columbia, and four territories). Of the 55 datafiles that we sent to state library administrative agencies, we received datafiles with contact information for either the library system or branch library directors from 51 of them.[115] From the 51 datafiles, we identified additional libraries that were not in scope (i.e., closed, bookmobiles, tribal libraries, etc.) and standardized the 51 datafiles with contact information of each library directors’ name, email, and phone numbers. We then merged this datafile with the Public Library Outlet Data File with each library’s unique identifiers.
The resulting sample frame, using information from the 55 state and territory library agencies and the records from IMLS’s FY 2022 Public Libraries Survey, included 16,441 libraries, and we selected a stratified random sample of 742 libraries from this frame. We stratified the sampling frame into 17 mutually exclusive strata based on library size in square feet, population density, and poverty classifications. After selection of the sample, we discovered an additional 50 of the 742 sampled libraries were out of scope (e.g., were closed or tribal) and were, therefore, removed from both our frame and our sample. This resulted in 16,391 in-scope libraries in our sample frame, of which 692 were in our sample (see table 6).[116] Our survey results are generalizable to this target population of 16,391 public libraries nationwide.
Table 6: Description of the Stratification and the In-Scope Sample Frame Sizes, Sample Sizes, and Numbers of Completed Surveys for the Stratified Random Sample of Libraries
|
|
Stratum |
Population
size |
Sample size |
Number of completed surveys |
|
Small library size |
||||
|
1 |
All rural-urban commuting area, all poverty, |
133 |
79 |
47 |
|
Rural (<10,000 population) |
||||
|
2 |
Lowest 25th percentile |
619 |
24 |
15 |
|
3 |
25th to 50th percentile of poverty |
1,300 |
46 |
31 |
|
4 |
50th to 75th percentile of poverty |
1,402 |
51 |
33 |
|
5 |
Top 25th percentile of poverty |
1,034 |
38 |
25 |
|
Large town (10,000--49,999 population) |
||||
|
6 |
Lowest 25th percentile of poverty |
329 |
25 |
17 |
|
7 |
25th to 50th percentile of poverty |
444 |
33 |
19 |
|
8 |
50th to 75th percentile of poverty |
572 |
42 |
29 |
|
9 |
Top 25th percentile of poverty |
632 |
49 |
32 |
|
Suburban (areas, often in metropolitan counties, with primary high commuting flows to urban areas and all other areas with secondary commuting flows of 30-49 percent of the population to urban area) |
||||
|
10 |
Lowest 25th percentile |
728 |
41 |
28 |
|
11 |
25th to 50th percentile of poverty |
774 |
43 |
26 |
|
12 |
50th to 75th percentile of poverty |
688 |
39 |
22 |
|
13 |
Top 25th percentile of poverty |
484 |
26 |
17 |
|
Urban (50,000 or more population) |
||||
|
14 |
Lowest 25th percentile |
2,478 |
54 |
34 |
|
15 |
25th to 50th percentile of poverty |
1,526 |
31 |
20 |
|
16 |
50th to 75th percentile of poverty |
1,385 |
32 |
23 |
|
17 |
Top 25th percentile of poverty |
1,863 |
39 |
18 |
|
|
Total |
16,391 |
692 |
436 |
Sources: GAO analysis of data from the Institute of Museum and Library Services’s fiscal year 2022 Public Libraries Survey, U.S. Census Bureau American Community Survey 2018–2022 5-year estimates, and U.S. Department of Agriculture’s Economic Research Service’s Rural-Urban Commuting Area classifications. | GAO‑26‑107262.
Note: We used the 2010 U.S. Department of Agriculture’s Economic Research Service’s Rural-Urban Commuting Area codes, which classify census tracts using measures of population density, urbanization, and daily commuting. Census tracts were assigned one of the following labels: urban: contiguous, built-up areas of 50,000 people or more; suburban: areas, often in metropolitan counties, with primary high commuting flows to urban and all other areas with secondary commuting flows of 30-49 percent of the population to urban areas; large town: towns with populations of 10,000-49,999 and surrounding rural areas with 10 percent or more primary commuting flows to these towns, and towns with secondary commuting flows of 10 percent or more to urban areas; rural: towns with populations below 10,000 and surrounding commuter areas with more than a 1-hour driving distance to the closest city.
With an achieved response rate of 60 percent, our sample design is expected to result in 95 percent margins of error for percentage estimates that are within +/- 5.5 percent for the full sample; within +/- 10 percent in each major strata defined by size and rural urban commuting areas; and within around +/-11 percent in each poverty classification level, as described in the next paragraphs.
To determine the appropriate sample size for the survey, we first determined the minimum sample size needed to achieve precision levels of percentage estimates within +/- 10 percentage points, at the 95 percent confidence level, within each of our five major strata determined by library size and population density. These major strata were defined as (1) small libraries (i.e., less than 500 square feet), and for all other libraries, their category of (2) urban, (3) suburban, (4) large town, or (5) rural, using the 2010 U.S. Department of Agriculture’s Economic Research Service’s Rural-Urban Commuting Area codes, which classify census tracts using measures of population density, urbanization, and daily commuting. Then, except for libraries less than 500 square feet, within each of the four population density groups, we proportionately allocated the sample across poverty groups. These poverty groups were determined by the poverty rate of the census tract within which a library was located, as follows: (1) lowest 25th percentile or missing; (2) 25th to 50th percentile; (3) 50th to 75th percentile; or (4) top 25th percentile. We then increased the sample size within each stratum, for an expected response rate of 60 percent, to achieve the necessary number of completed surveys for our desired precision level.
We took additional steps to minimize other errors in our survey results that are not due to random selection of a sample (i.e., nonsampling error). This included obtaining feedback from subject matter experts; pretesting draft instruments; and using a web-based questionnaire to aid survey navigation, perform validation, and notify respondents of potential mistakes to minimize response error.
We obtained feedback from five library associations and pretested the draft instrument from September to October 2024 with officials in five libraries in different states and with varying characteristics, such as size, central versus branch library, and population density (i.e., urban, suburban, and rural communities) of the libraries. In the pretests, we asked about the clarity and interpretation of the questions, as well as asking about its reasonableness. Based on feedback from the pretests, we revised the survey instrument.
To obtain the maximum number of responses to our survey, and to minimize nonresponse error, we sent reminder emails to nonrespondents and contacted nonrespondents over the telephone. We tailored our messaging to contacts that were responsible for more than two sampled library outlets, and we also obtained support from five library associations to encourage our target populations to respond to our survey.
We received 436 valid survey responses from the sample, resulting in unweighted and weighted response rates of around 63 percent. We took steps to minimize survey error in accordance with best practices in survey research and echoed in the Office of Management and Budget’s Standards and Guidelines for Statistical Surveys (September 2006). We analyzed the response outcomes to our survey to identify potential sources of nonresponse bias. We examined the response propensity of the sampled libraries, using both bivariate and multivariate logistic regression models, including some demographic characteristics available for respondents and nonrespondents: urban classification, poverty, region, size of library (in square feet and categorical versions of this measure), and the stratification variable that combines some of these characteristics. We detected a significant association between the size of the library and the propensity to respond to our survey.[117] We did not detect a significant association between urban classification, poverty, or strata and the response propensity.
We adjusted for the characteristic significantly associated with the likelihood that libraries in our sample will respond to our survey, also known as response propensity, using weighting adjustments. Specifically, we grouped the predicted response propensity derived from our logistic regression model that includes library size to form quintiles of the predicted response propensity distribution to form weighting adjustment groups. We applied nonresponse adjustments to the sampling weights within these groups to form nonresponse adjusted analysis weights used in our survey analyses. Based on the nonresponse bias analysis and resulting nonresponse adjusted analysis weights, we determined that estimates using these weights are generalizable to the population of eligible libraries and are sufficiently reliable for the purposes of our reporting objectives.
Finally, we carried out a nonresponse bias analysis and created analysis weights that adjusted the sampling weights for potential nonresponse bias. We compared—as appropriate—weighted survey estimates generated for libraries across the strata described above. For each subgroup, we produced percentage estimates and standard errors for each level and used these results to confirm the significance of the differences between weighted survey estimates. Survey estimates and confidence intervals were obtained using survey analysis software and accounted for the sample design and analysis weights.
The survey results of libraries can be found on the “Additional Data” link of our website for our report, GAO‑26‑107262.
Site Visits of Libraries
To supplement information from the survey on library facility conditions, estimated costs to repair, and challenges to addressing facility repair needs, we visited 23 libraries, including two in Tribal Nations and 21 in seven states and territories (Alaska, California, the District of Columbia, Georgia, Indiana, Maine, and Puerto Rico). We selected these seven states and territories because they varied in the amount of funding the state provided for library facilities, the level of information collected on library facility conditions, the number of natural disasters experienced in the last 5 years, and variation in U.S. regions. The 23 libraries we visited within the seven states and territories were selected based on variation in population density (i.e., rural, suburban, and urban communities), experience with natural disasters, reported facility repair needs, and size of library facilities, among other factors. The two tribal libraries we visited were in federally recognized Tribal Nations and were selected based on funding from IMLS and proximity to visiting other libraries and our field office location for resource consideration, among other factors. We also selected the two tribal libraries and libraries in Puerto Rico to obtain and supplement information that could not be collected from the survey.
· States. We interviewed officials from seven state and territorial library administrative agencies, who were knowledgeable about their state’s role in funding, assessing, or providing other resources for library facilities. We discussed the agency’s roles and responsibilities related to library facility condition assessments or data collection initiatives and funding sources available within the state for library facilities.
· Library observations. We toured the library facilities with local library directors and staff. During these visits, we used a data collection instrument to ask officials about library building systems and features that were particularly in need of repair or replacement, as well as new or upgraded systems. We photographed these systems and features, as appropriate.
Information we gathered from these interviews and firsthand observations provide insights into the conditions of library facilities we visited at the time of our interviews. While they are not generalizable to all libraries, they provide illustrative examples to complement findings from our survey.
Document Review and Interview Analysis
For all our objectives, we reviewed relevant laws and regulations. We also reviewed documents and interviewed officials from IMLS, state library administrative agencies, and library associations to understand the availability and conditions of library facilities and any estimated costs and challenges to addressing library facility repair needs.
To assess the availability of library facilities and identify whether any standards exist on the availability of libraries, we reviewed IMLS’s online mapping tool that provides the location of libraries nationwide and interviewed IMLS officials. We examined IMLS’s report on Understanding the Social Wellbeing Impacts of the Nation’s Libraries and Museums, which looked at the availability of libraries and the social effect of their physical proximity to the local community. We also reviewed documents that state library administrative agencies provided on library facility repair needs and estimated costs to address them.
We also interviewed IMLS officials and representatives from eight library associations and analyzed their statements for common themes on the availability and conditions of library facilities, and challenges and estimated cost to address library facility repair needs.[118]
GAO Contact
David Marroni, marronid@gao.gov
Staff Acknowledgments
In addition to the contact named above, Kyle Browning (Assistant Director), Jennifer Kim (Analyst in Charge), Sharon Dyer, Tania Uruchima, and Gregory Wong made key contributions to this report. Also contributing to this report were Breanne Cave, Emily Crofford, Melanie Diemel, Gabriel Jimenez-Barron, Michael Jones, Shannon Murphy, Carl Ramirez, Claire Saint-Rossy, Sonya Vartivarian, Erin Villareal, and Michelle Weathers.
The Government Accountability Office, the audit, evaluation, and investigative arm of Congress, exists to support Congress in meeting its constitutional responsibilities and to help improve the performance and accountability of the federal government for the American people. GAO examines the use of public funds; evaluates federal programs and policies; and provides analyses, recommendations, and other assistance to help Congress make informed oversight, policy, and funding decisions. GAO’s commitment to good government is reflected in its core values of accountability, integrity, and reliability.
Obtaining Copies of GAO Reports and Testimony
The fastest and easiest way to obtain copies of GAO documents at no cost is through our website. Each weekday afternoon, GAO posts on its website newly released reports, testimony, and correspondence. You can also subscribe to GAO’s email updates to receive notification of newly posted products.
Order by Phone
The price of each GAO publication reflects GAO’s actual cost of production and distribution and depends on the number of pages in the publication and whether the publication is printed in color or black and white. Pricing and ordering information is posted on GAO’s website, https://www.gao.gov/ordering.htm.
Place orders by calling (202) 512-6000, toll free (866) 801-7077,
or
TDD (202) 512-2537.
Orders may be paid for using American Express, Discover Card, MasterCard, Visa, check, or money order. Call for additional information.
Connect with GAO
Connect with GAO on X,
LinkedIn, Instagram, and YouTube.
Subscribe to our Email Updates. Listen to our Podcasts.
Visit GAO on the web at https://www.gao.gov.
To Report Fraud, Waste, and Abuse in Federal Programs
Contact FraudNet:
Website: https://www.gao.gov/about/what-gao-does/fraudnet
Automated answering system: (800) 424-5454
Media Relations
Sarah Kaczmarek, Managing Director, Media@gao.gov
Congressional Relations
A. Nicole Clowers, Managing Director, CongRel@gao.gov
General Inquiries
[1]For the purposes of this report, we use the Institute of Museum and Library Services’s criteria to identify a public library, which is an entity established under state enabling laws or regulations to serve a community, district, or region that has (1) an organized collection of printed or other library materials, or a combination thereof; (2) paid staff; (3) an established schedule in which services of the staff are available to the public; (4) the facilities necessary to support such a collection, staff, and schedule; and (5) is supported in whole, or in part, with public funds. Throughout this report, we refer to public libraries as “libraries.” We also use “library” to mean an individual library outlet (i.e., branch library) or central library and not an entire library system.
[2]Public Library Association, Public Library Services for Strong Communities Report: Results from the 2022 PLA Annual Survey (Chicago, IL: 2023).
[3]The American Library Association is a national organization providing resources to library and information professionals to support their communities through programs and services.
[4]We previously reported that buildings and structures and their component systems (e.g., structural, electrical, heating, and air conditioning systems, and other systems) have finite, expected useful lives. These systems should be maintained and repaired during their useful lives, after which they can be reasonably expected to need replacement. GAO, Federal Real Property: Agencies Attribute Substantial Increases in Reported Deferred Maintenance to Multiple Factors, GAO‑23‑106124 (Washington, D.C.: Oct. 28, 2022).
[5]Deferred maintenance and repairs refer to maintenance and repair activity that was not performed when it should have been or was scheduled to be and which was put off or delayed for a future period. Throughout this report, we sometimes refer to deferred maintenance and repair as deferred maintenance.
[7]The Museum and Library Services Act of 2018 authorized appropriations for the agency’s library programs through fiscal year (FY) 2025. Pub L. No. 115-410, § 9 132 Stat. 5412, 5416 (2018) (codified 20 U.S.C. § 9123). Although this authorization for appropriations ended in FY 2025, appropriations acts can still provide funding to agencies for programs and activities. IMLS is currently funded through January 30, 2026 (Pub. L. No. 119-37, div. A, §§ 101, 106 (2025)). IMLS is headed by a Director, appointed by the President, with advice and consent of the Senate, who serves for a term of 4 years. 20 U.S.C. § 9103(a). The Museum and Library Services Board advises the Director on general policies and is made up of the Director, two Deputy Directors, and 10 members each, who are specially qualified with respect to libraries and museums, respectively. Id. § 9105a(b)(1). Appointed board members generally serve a term of 5 years. Id. § 9105a(c).
[8]See Exec. Order 14238, 90 Fed. Reg. 13043 (March 2025).
[9]Memorandum and Order, Rhode Island v. Trump, No. 1:25-cv-00128 (D.R.I. Nov. 21, 2025).
[10]20 U.S.C. § 9109.
[11]The congressional directive also asked us to examine museum facilities, which will be discussed in a separate report.
[12]While there are different types of libraries, such as school or special libraries, we focused our review on public libraries, including tribal libraires that are established on federally recognized Tribal Nations. We also define economically disadvantaged and underserved communities—including federally recognized Tribes—based on the percentage of families in poverty and ethnic and racial population experiencing a disproportionate share of adverse socioeconomic and environmental conditions.
[13]The eight library associations include the (1) American Indian Library Association; (2) American Library Association; (3) Association of Rural and Small Libraries; (4) Association of Tribal Archives, Libraries, and Museums; (5) Chief Officers of State Library Agencies; (6) Public Library Association; (7) Sociedad de Bibliotecarios de Puerto Rico; and (8) Urban Libraries Council.
[14]The Public Libraries Survey provides statistics on the status of libraries in the 50 states; the District of Columbia; and the territories of American Samoa, Guam, the Northern Mariana Islands, Puerto Rico, and the U.S. Virgin Islands. IMLS annually collects these data through state library agencies to provide information that policymakers, researchers, and the public can use to make informed decisions on planning, evaluating, and managing libraries. Although the Public Libraries Survey also includes bookmobiles as library outlets, we did not include them in our analyses. We also did not include tribal libraries or libraries in the territories of American Samoa, Guam, the Northern Mariana Islands, Puerto Rico, and the U.S. Virgin Islands for our geospatial analysis. We used Public Libraries Survey data from FY 2022, since they were the latest data available during our review.
[15]“Community” refers to census tracts. To measure the availability of libraries in communities, we used the 2010 U.S. Department of Agriculture’s Economic Research Service’s Rural-Urban Commuting Area (RUCA) codes, which classify census tracts using measures of population density, urbanization, and daily commuting. Census tracts were assigned one of the following four categories: (1) urban: contiguous, built-up areas of 50,000 people or more; (2) suburban: areas, often in metropolitan counties, with primary high commuting flow to urban areas and all other areas with secondary commuting flows of 30-49 percent of the population to urban areas; (3) large town: towns with populations of 10,000-49,999 and surrounding rural areas with 10 percent or more primary commuting flows to these towns, and towns with secondary commuting flows of 10 percent or more to urban areas; (4) small town/rural: towns with populations below 10,000 and surrounding commuter areas with more than a 1 hour driving distance to the closest city. For the purposes of our report, we refer to small town/rural communities as rural communities.
[16]Community characteristics we used include (1) the percentage of families in poverty and median household income; (2) race and ethnicity by percent of the population; (3) urbanicity (i.e., urban, suburban, large town, and rural), according to the U.S. Department of Agriculture’s Economic Research Service’s 2010 RUCA codes; (4) population age; and (5) households without a vehicle.
[17]IMLS’s Public Libraries Survey data on tribal libraries or libraries in Puerto Rico are incomplete, so we did not include them in our survey’s target population. Our survey included questions about library characteristics; physical conditions of library building systems or features; physical barriers to access for people with certain disabilities, such as mobility impairments; estimated cost of deferred maintenance backlog and funding sources; and experience with facility damages from natural disasters and extreme weather. We did not include questions on other types of accessibility barriers, such as for people with visual or hearing impairments.
[18]We selected the seven states and territories based on variations in the amount of state funding provided for library facilities, level of information collected on library facility conditions, and geographic locations, among other things. We also selected libraries within the states and territories based on variation in population density, experience with natural disasters, and size of library facility, among other things.
[19]20 U.S.C. §§ 9122(4)-(5); 9134; 9141.
[20]Hawaii, the District of Columbia, and the four territories that are part of our survey have a singular library system.
[21]The 17,500 individual libraries include bookmobiles, books-by-mail service, and some tribal libraries, that were not included in our surveys.
[22]Building codes are for the design, construction, alteration, materials, maintenance, and performance of buildings.
[23]The applicable ADA standards depend on the date of construction or alteration of the library facilities. See 28 C.F.R. § 36.406 for details about the different standards that apply to different construction/alteration dates.
[24]We use building systems or building features interchangeably throughout this report.
[25]A facility condition assessment uses a standard method for recording observations about condition. See ASTM International, E2018-24, Standard Guide for Property Condition Assessments: Baseline Property Condition Assessment Process (2024).
[26]The Federal Accounting Standards Advisory Board defines deferred maintenance as maintenance that was not performed when it should have been or was scheduled to be and is put off or delayed to a future period.
[27]Museum and Library Services Act of 1996, Pub. L. No. 104-208, Div. A. Tit. VII, 110 Stat. 3009, 3009-293.
[28]See Exec. Order 14238, 90 Fed. Reg. 13043 (March 2025). On June 16, 2025, we issued a legal decision based on publicly available data concluding that IMLS had failed to comply with the Impoundment Control Act (ICA) with regard to withheld funds, including some funds that were not eligible for ICA-based withholding. See GAO, Institute of Museum and Library Services—Applicability of the Impoundment Control Act to Reduction of Agency Functions, B-337375 (Washington, D.C.: June 16, 2025).
[29]Memorandum and Order, Rhode Island v. Trump, No. 1:25-cv-00128 (D.R.I. Nov. 21, 2025).
[30]See Statement of Agency’s Reinstatement of Terminated IMLS Grants | Institute of Museum and Library Services.
[31]Under statute, the Director of IMLS “shall regularly support and conduct, as appropriate, policy research, data collection, analysis and modeling, evaluation, and dissemination of information to extend and improve the Nation’s museum, library, and information services.” 20 U.S.C. § 9108(a).
[32]H.R. Rep. 117-403, at 312 (incorporated by reference into the explanatory statement accompanying the Consolidated Appropriations Act, 2022).
[33]Museum and Library Services Act of 2003, Pub. L. No 108-81 § 104, 117 Stat. 991, 997 (codified at 20 U.S.C § 9109).
[34]20 U.S.C. § 355a (1994) (repealed by Museum and Library Services Act of 1996, Pub. L. No 104-208).
[35]As previously mentioned, we define a community as a census tract. Census tracts generally have a population size of 1,200 to 8,000 people, with an optimum size of 4,000 people. The spatial size of census tracts varies widely depending on the density of settlement. Census tract boundaries generally follow visible and identifiable features, although boundaries may also follow legal boundaries. Census tract boundaries are contained within state and county boundaries. We define urbanicity as the degree to which an area is considered urban or rural, ranging from highly urban environments (city centers) to rural settings; it measures where an area is on the urban-rural continuum.
[36]Our analysis does not account for potential traffic conditions in communities.
[37]We also found that around 11,000 people do not have a drivable or walkable library (i.e., cannot drive or walk to a library) because they are on a separate landmass (i.e., an island) from the nearest library, or because libraries are inaccessible for other reasons. Although some communities may not have a physical library available within a reasonable driving and walking distance, people in remote areas may have access to online library services and programs. For example, the Alaska Library Extension program provides residents living remotely with access to online services, including downloadable audiobooks and e-books, training and educational tools, small engine repair, and homework help, among other things.
[38]Average walk times were calculated only for communities where walking access to a library could be estimated. Communities located more than 5 miles from the nearest library were assumed to fall in the 40+-minute walk category, but no precise walk-time averages were calculated for these areas.
[39]Although some communities may not have a physical library available within a reasonable driving and walking distance, people in remote areas may have access to online library services and programs. For example, the Alaska Library Extension program provides residents living remotely with access to online services, including downloadable audiobooks and e-books, training and educational tools, small engine repair, and homework help, among other things. These communities were excluded from our analysis. See app. I for our methodology.
[40]We did not examine potential factors behind large town and rural communities having more libraries and larger size libraries than the national average.
[41]We used a regression analysis that allows for the assessment of association between availability (driving or walking time to the nearest library) and a variety of demographics at the same time. This analysis allows us to compare travel time for an otherwise similar community, one demographic at a time. With a regression, communities that are otherwise similar in terms of the demographics in the model can be compared on the basis of one demographic at a time, while holding other demographics in the model constant. A regression can also assess travel times in minutes as an increasing value on a continuum, as an alternative to a 10-minute walk or 20-minute drive cutoff. For example, we assess whether communities that are otherwise similar in terms of other demographics (e.g., percent of households that have no vehicle, that are in poverty, etc.), but with higher median household income are associated with longer or shorter travel times to the nearest library when compared with similar communities with lower median household income. If the relationship between a demographic and the travel times was inconsistent across models or across urbanicity, we considered the results mixed. See app. I for details on the regression models and results.
[42]For historically underrepresented racial and ethnic groups, we include the following racial and ethnic reporting categories: Hispanic or Latino or Not Hispanic or Not Latino and: Black or African American alone; American Indian and Alaska Native alone; Asian alone; Native Hawaiian and Other Pacific Islander alone; some other race alone; and two or more races (two races including “some other race,” two races excluding “some other race,” and three or more races).
[43]In our survey, we asked about the condition of 12 building systems (see fig. 8). Libraries self-assessed that a system is in poor condition if it needs repair or replacement beyond routine maintenance and is not functioning as required or not meeting the library’s needs. The response options were “very good,” “good,” “fair,” “poor,” “building does not have this feature but needs it,” “not sure,” and “not applicable.” Results are among those libraries with the applicable system. Each building system was applicable for most (an estimated 90 percent or more) libraries, except for security systems (79 percent of libraries) and elevators/lifts (33 percent of libraries). Our survey estimates are made to a target population of approximately 16,400 public libraries, as defined in app. I. The 95 percent confidence interval for this 38 percent estimate is (32, 43) and for the count of libraries, (5,189, 6,879).
[44]Because each of our estimates is subject to variability due to sampling, we identify statistically significant differences between estimates at the 95 percent confidence level when their confidence intervals do not overlap. The 95 percent confidence intervals for these estimates are (43, 60) and (0.7, 10).
[45]Analysis includes only the systems that each library had and rated. Each building system was applicable for 90 percent or more libraries, except for security systems (79 percent of libraries) and elevators/lifts (33 percent of libraries). The 95 percent confidence interval for this estimate is (15, 24).
[46]The 95 percent confidence intervals for these estimates are (73, 82), and (70, 79), respectively. Because these intervals overlap, the difference between these two systems is not statistically significant.
[47]An estimated 51 percent of libraries with elevators rated them in “good” or “very good” condition, with a 95 percent confidence interval of (42, 61). All other building systems had a lower bound of the 95 percent confidence interval of at least 50 percent.
[48]The 95 percent confidence intervals for these estimates are (15, 24) and (2,380, 3,786).
[49]Mold grows with moisture, which can occur with water intrusion from different building systems, such as a leaking HVAC or roof. Mold exposure can cause health problems, such as allergic reactions or asthma attacks in some.
[50]The 95 percent confidence interval for this estimate is (6, 20).
[51]The 95 percent confidence intervals for these estimates are (1,265, 2,393) and (8, 15), respectively.
[52]GAO, K‑12 Education: School Districts Frequently Identified Multiple Building Systems Needing Updates or Replacement, GAO‑20‑494 (Washington, D.C.: June 4, 2020); and National Air and Space Museum: Smithsonian’s Efforts to Improve Reliability of Its Revitalization Project’s Cost Estimate Are Ongoing, GAO‑19‑78 (Washington, D.C.: Oct. 25, 2018).
[53]Sampled libraries that responded that a building system is in poor condition is a subset of our sample. Due to smaller sample sizes for this subset, we cannot generalize to the entire population of libraries with such a system in poor condition. Instead, we report about respondents to our survey in a nongeneralizable manner.
[54]The 95 percent confidence intervals for these estimates are (1,252, 2,378) and (8, 15), respectively.
[55]The 95 percent confidence intervals for these estimates are (902, 1,931) and (6, 13), respectively.
[56]Respondents were asked to judge whether their library had these barriers. We asked libraries about physical elements of buildings that prevent movement or access for people with certain disabilities. We did not ask about other accessibility features, such as those related to visual or hearing impairments. The 95 percent confidence intervals for these estimates are (38, 48) and (6,091, 7,801).
[57]The 95 percent confidence intervals for these estimates are (17, 26) and (15, 22).
[58]GAO, K‑12 Education: School Districts Need Better Information to Help Improve Access for People with Disabilities, GAO‑20‑448 (Washington, D.C.: June 30, 2020).
[59]Our sample design assured that we could report estimates separately for small size libraries (libraries under 500 square feet), as we were concerned experiences might differ for such facilities. We define small size library based on library square footage data, although definitions of what constitutes a small library vary. The small size library category includes libraries under 500 square feet of any urbanicity. For certain estimates, we identify statistically significant differences for small size libraries compared with each urbanicity category (urban, suburban, large town, and rural), as each urbanicity category includes only libraries that are over 500 square feet. There are only around 150 small libraries in the population; therefore, we were unable to further separate our estimates of small libraries into the urbanicity categories (for example, reporting on estimates related to small libraries in rural areas).
[60]The 95 percent confidence intervals for these estimates are (45, 65) and (23, 42), respectively.
[61]The 95 percent confidence intervals for these estimates are (20, 37) (rural), (28, 51) (small), and (4, 16) (urban).
[62]The 95 percent confidence intervals for these estimates are (16, 34) (rural), (20, 43) (small), and (2, 12) (urban).
[63]The 95 percent confidence intervals for these estimates are (20, 43) (small), (2, 14) (urban), and (4, 17) (suburban).
[64]We asked respondents to identify whether a building system was a health or safety concern. To report on potential health or safety concerns, we combined two response options on our survey: “yes” and “somewhat.” Other response options were “no,” “not sure,” and “not applicable.” The 95 percent confidence intervals for these estimates are (56, 66) and (8,970, 10,693).
[65]The 95 percent confidence interval for this estimate is (29, 39).
[66]The 95 percent confidence interval for this estimate is (27, 37).
[67]The 95 percent confidence intervals for these estimates are (33, 53) and (11, 29), respectively.
[68]The 95 percent confidence intervals for these estimates are (11, 19) and (1,572, 2,737).
[69]The 95 percent confidence intervals for these estimates are (26, 36) and (4,257, 5,834).
[70]The 95 percent confidence intervals for these estimates are (13, 20) and (2,031, 3,277).
[71]The 95 percent confidence intervals for these estimates are (33, 56) (small size), (33, 52) (rural), and (14, 31) (urban).
[72]The 95 percent confidence intervals for these estimates are (31, 42) and (5,080, 6,786).
[73]Federal Emergency Management Agency, Building Codes Save: A Nationwide Study (Washington, D.C.: November 2020).
[74]An estimated 44 percent of libraries said they provided, or were ready to provide, emergency services. Emergency services include serving as a cooling or warming center, for example, or hosting emergency supply distribution. The 95 percent confidence interval for this estimate is (39, 49).
[75]The 95 percent confidence intervals for these estimates are (73, 81) and (44, 55), respectively.
[76]The 95 percent confidence interval for this estimate is (40, 51).
[77]The 95 percent confidence intervals for these estimates are (49, 60) and (7,911, 9,673).
[78]The 95 percent confidence interval for this estimate is (25, 35).
[79]The 95 percent confidence intervals for these estimates are (17, 26) and (15, 24), respectively.
[80]We identified and obtained information on these selected states during our site visits and interviews with stakeholders.
[81]The 95 percent confidence interval for this estimate is (28, 38).
[82]The 95 percent confidence intervals for these estimates are (15, 32) and (33, 53).
[83]Our survey asked respondents to self-report their estimated amount of deferred facility maintenance. The 95 percent confidence intervals for these estimates are (65, 75) and (10,406, 11,981).
[85]GAO‑23‑106124 and GAO, Federal Real Property: Government’s Fiscal Exposure from Repair and Maintenance Backlogs Is Unclear, GAO‑09‑10 (Washington, D.C.: Oct. 16, 2008); and Congressional Research Service, Deferred Maintenance and Repair at Civilian Agencies: Causes, Risks, and Policy Options, R48211 (Washington, D.C.: Oct. 4, 2024).
[86]The 95 percent confidence intervals for these estimates are (34, 44) and (5,388, 7,048).
[87]The 95 percent confidence intervals for these estimates are (9, 16) and (1,330, 2,505).
[88]The 95 percent confidence interval for this estimate is (12, 21).
[89]The 95 percent confidence interval for this estimate is (66, 76).
[90]The 95 percent confidence intervals for these estimates are (25, 35) and (36, 46), respectively.
[91]The 95 percent confidence interval for this estimate is (7, 13).
[92]The 95 percent confidence intervals for these estimates are (69, 87), (45, 66), and (42, 65), respectively.
[93]The 95 percent confidence interval for the 70 percent figure is (65, 75). The 95 percent confidence interval for the 35 percent figure is (30, 41).
[94]The 95 percent confidence interval for this estimate is (66, 76).
[95]The 95 percent confidence interval for this estimate is (14, 22).
[96]The 95 percent confidence interval for this estimate is (66, 76).
[97]A library in the low-poverty group is in a census tract with a poverty rate (i.e., percent of people in the tract that are in poverty) that is among the lowest 25 percent of tract poverty rates for libraries in our frame or is missing a poverty rate. A library in the mid-poverty group is in a tract with a poverty rate that is among the middle 25th percent to 75th percent tract poverty rates for all libraries in our frame. A library in the high-poverty group is in a tract with a poverty rate that is among highest 25 percent of tract poverty rates for libraries in our frame.
[98]The 95 percent confidence intervals for these estimates are (46, 65) (rural), (25, 44) (suburban), and (27, 47) (urban), respectively.
[99]The 95 percent confidence intervals for these estimates are (47, 69) and (19, 39), respectively.
[100]Results are of libraries that made repairs from 2020 to 2024; 8 percent of libraries said they did not make any repairs in this period. The 95 percent confidence interval for percent using local funding is (86, 93).
[101]The 95 percent confidence interval for this estimate is (63, 74).
[102]This is also known as community project funding. See Tracking the Funds—Community Project Funding and Congressionally Directed Spending | U.S. GAO
[103]The 95 percent confidence interval for this estimate is (20, 29).
[104]The 95 percent confidence interval for this estimate is (49, 60).
[105]The 95 percent confidence interval for this estimate is (33, 43).
[106]GAO, Grants Management: Observations on Challenges with Access, Use, and Oversight, GAO‑23‑106797 (Washington, D.C.: May 2, 2023).
[107]The 95 percent confidence interval for this estimate is (32, 43).
[108]While there are different types of libraries, such as school or special libraries, we focused our review on public libraries, including tribal libraries that are established in federally recognized Tribal Nations. We completed this work in response to a provision included in the Joint Explanatory Statement accompanying the Departments of Labor, Health and Human Services, and Education, and Related Agencies Appropriations Act, 2024, including examining museum facilities, which will be discussed in a separate report. For the purposes of this report, we used the Institute of Museum and Library Services’s (IMLS) criteria to identify a public library, which is an entity established under state enabling laws or regulations to serve a community, district, or region that has (1) an organized collection of printed or other library materials, or a combination thereof; (2) paid staff; (3) an established schedule in which services of the staff are available to the public; (4) the facilities necessary to support such a collection, staff, and schedule; and (5) that are supported in whole, or in part, with public funds. We define economically disadvantaged and underserved communities—including federally recognized Tribes— based on the percentage of families in poverty and ethnic and racial population experiencing a disproportionate share of adverse socioeconomic and environmental conditions.
[109]The Public Libraries Survey provides statistics on the status of all libraries in the 50 states; the District of Columbia; and the territories of American Samoa, Guam, the Northern Mariana Islands, Puerto Rico, and the U.S. Virgin Islands. IMLS annually collects these data through state library agencies to provide information that policymakers, researchers, and the public can use to make informed decisions on planning, evaluating, and managing libraries. Although the Public Libraries Survey also includes bookmobiles as library outlets, we did not include them. We also did not include tribal libraries or libraries in the territories of American Samoa, Guam, the Northern Mariana Islands, Puerto Rico, and the U.S. Virgin Islands for our geospatial analysis. We used Public Libraries Survey data from FY 2022, which were the latest data available during our review.
[110]Community” refers to census tracts. To measure library availability in communities, we used the 2010 U.S. Department of Agriculture’s Economic Research Service’s Rural-Urban Commuting Area codes, which classify census tracts using measures of population density, urbanization, and daily commuting. Census tracts were assigned one of the following labels: (1) urban: contiguous, built up areas of 50,000 people or more; (2) suburban: areas, often in metropolitan counties, with primary high commuting flows to urban and all other areas with secondary commuting flows of 30-49 percent of the population to urban areas; (3) large town: towns with populations of 10,000-49,999 and surrounding rural areas with 10 percent or more primary commuting flows to these towns, and towns with secondary commuting flows of 10 percent or more to urban areas; (4) rural: towns with populations below 10,000 and surrounding commuter areas with more than a 1-hour driving distance to the closest city. For the purposes of our report, we refer to small town/rural communities as rural communities.
[111]For historically underrepresented racial and ethnic groups, we include the following racial and ethnic reporting categories: Hispanic or Latino or Not Hispanic or Not Latino and: Black or African American alone; American Indian and Alaska Native alone; Asian alone; Native Hawaiian and Other Pacific Islander alone; some other race alone; and two or more races (two races including “some other race,” two races excluding “some other race,” and three or more races).
[112]We did not include questions on other types of barriers to access, such as for people with visual or hearing impairments.
[113]We did not include libraries in Puerto Rico due to incomplete and unreliable data in the Public Library Outlet Data File.
[114]We did not include tribal libraries due to incomplete and unreliable data in the Public Library Outlet Data File.
[115]For the four state library agencies that did not provide library contact information datafiles, we followed up with the state library agencies if libraries within their jurisdiction were selected as part of the sample.
[116]The 50 out-of-scope (closed or tribal) libraries in our sample frame are as follows: strata 1 had 21 out-of-scope libraries, and the other strata had between one and three out-of-scope libraries, except strata 6 and 16, where we did not identify any out-of-scope libraries.
[117]We assessed size in square feet and three variations of size that categorized library square footage as “<500 square feet, 501-3,000 square feet, 3,001-15,000 square feet, and >15,000 square feet or unknown;” “less than 500, 501-15,000, and greater than 15,000;” and “<= 15,000 versus >15,000.” Results were significant for all versions. We used the continuous measure to develop five response propensity class adjustment cells, since that required the least assumptions on categories of size.
[118]The eight library associations include the (1) American Library Association; (2) American Indian Library Association; (3) Association of Tribal Archives, Libraries, and Museums; (4) Association of Rural and Small Libraries; (5) Chief Officers of State Library Agencies; (6) Public Library Association; (7) Sociedad de Bibliotecarios de Puerto Rico; and (8) Urban Libraries Council.