HOMELESSNESS
Agency Actions Could Improve Data on Shelter Program Use
Report to House
Financial Services Committee and Senate
Special Committee on Aging
United States Government Accountability Office
A report to the House Financial Services Committee and Senate Special Committee on Aging.
For more information, contact: Alicia Puente Cackley at CackleyA@gao.gov.
What GAO Found
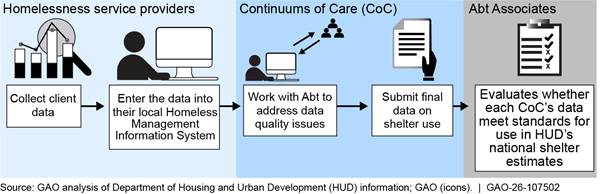
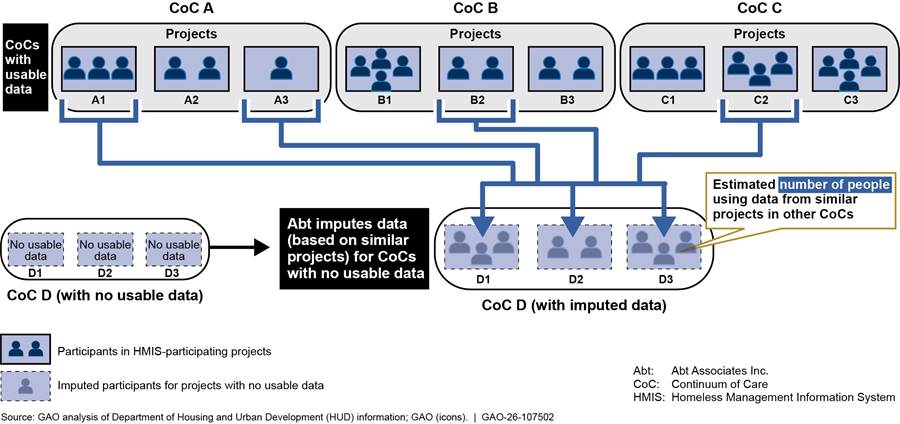
The Department of Housing and Urban Development (HUD) reports national estimates of the number and characteristics of people using homeless shelters. These estimates are based on data from about 400 Continuums of Care (CoC), which are planning bodies that coordinate homelessness services within a defined geographic area. CoCs manage shared databases that service providers in their area use to collect data on the people they serve. Each year, CoCs submit aggregated data from these databases to Abt Associates, a consulting firm that processes and analyzes the data for HUD. Abt works with CoCs to identify and resolve data quality issues and determines whether the data meet HUD’s standards (see figure). For CoCs with unusable data and shelters that do not collect data, Abt uses statistical methods to generate estimates.
HUD’s process for assessing data quality lacks transparency, making it difficult to assess the reliability of its estimates. Abt staff review each CoC’s data to determine whether they should be included in national estimates of people using shelter programs. However, HUD has not defined which specific data quality issues render a CoC’s data unusable. Instead, according to Abt staff, these decisions are based on their professional judgment. The Office of Management and Budget’s guidelines issued in response to the Information Quality Act require agencies to provide sufficient transparency about their data and methods so that published information can be substantially reproduced. GAO reviewed HUD and Abt data and documentation and was unable to replicate HUD’s data usability determinations. Greater transparency in HUD’s review process could increase confidence in the reliability of its homelessness data.
HUD has taken steps to improve the quality of aggregated CoC data by offering tools and technical assistance directly to CoCs. Staff at most of the 14 CoCs GAO interviewed said these resources were helpful and that their data quality was improving. However, when HUD determines that a CoC’s data are not usable, it does not communicate the rationale to the CoC. As a result, CoCs may be unsure about how to best improve their data and may devote limited resources to issues that may not result in better data quality.
Why GAO Did This Study
Hundreds of thousands of people experience homelessness in the U.S. each year, but developing quality data on homelessness has long been a challenge. High-quality information on homelessness can help policymakers and service providers more effectively target programs and allocate resources.
GAO was asked to review how HUD collects and analyzes data on people experiencing sheltered homelessness. This report (1) describes HUD's process for estimating the number and characteristics of people who use shelter programs, (2) examines HUD’s process for assessing data quality and creating estimates, and (3) assesses HUD’s efforts to address data quality issues that may affect those estimates.
GAO reviewed HUD data from fiscal years 2021 and 2022 (the most recent available) and documentation and interviewed agency officials. GAO also reviewed HUD guidance and interviewed staff from a nongeneralizable sample of 14 CoCs (out of about 400), selected to reflect variation in location and data quality, and conducted site visits to two of these CoCs.
What GAO Recommends
GAO is making three recommendations, including that HUD improve transparency in how data quality is assessed for national homelessness estimates and communicate the rationale for its data usability determinations to CoCs. HUD concurred with GAO’s recommendations.
|
Abbreviations |
|
|
|
|
|
Abt |
Abt Associates, Inc. |
|
AHAR |
Annual Homelessness Assessment Report |
|
CoC |
Continuum of Care |
|
HMIS |
Homeless Management Information System |
|
HUD |
Department of Housing and Urban Development |
|
LSA |
Longitudinal Systems Analysis |
This is a work of the U.S. government and is not subject to copyright protection in the United States. The published product may be reproduced and distributed in its entirety without further permission from GAO. However, because this work may contain copyrighted images or other material, permission from the copyright holder may be necessary if you wish to reproduce this material separately.
December 23, 2025
The Honorable Maxine Waters
Ranking Member
Committee on Financial Services
House of Representatives
The Honorable Kirsten Gillibrand
Ranking Member
Special Committee on Aging
United States Senate
The Department of Housing and Urban Development (HUD) reported that on a single night in 2024, 771,480 people were experiencing homelessness in the United States—a record high.[1] Congress appropriated more than $3.6 billion for homeless assistance programs in fiscal year 2024. However, despite the significant social and financial costs of homelessness, developing high-quality data on homelessness has been a longstanding challenge.[2] Having such information can help policymakers and service providers develop more targeted programs and resources. This may be especially critical for subpopulations with higher service needs, such as older adults.
You asked us to review how HUD collects and analyzes data on people who use shelter programs (sometimes referred to as “sheltered homelessness”). This report (1) describes HUD’s process for estimating the number and characteristics of people who use shelter programs, (2) examines HUD’s process for assessing data quality and creating estimates, and (3) assesses HUD’s efforts to address data quality issues that may affect its estimates.
To address our first objective, we reviewed HUD documents on the data that Continuums of Care (CoC) collect about people who use shelter programs. We also reviewed materials describing how these data—known as Longitudinal Systems Analysis (LSA) data—are submitted to HUD’s third-party research and consulting firm, Abt Associates Inc., and how Abt calculates national estimates of shelter use. We also analyzed HUD data on the quality of LSA data submissions for fiscal years 2021 and 2022 (the most recent years for which data were available). Additionally, we interviewed HUD officials, Abt staff, and officials from a sample of 14 CoCs. We selected the CoCs to reflect variation in geographic region, homelessness rates, and HUD-assessed data quality. We conducted two of the 14 CoC interviews in person based on their proximity to GAO offices.
To address our second objective, we reviewed HUD’s documentation of its methodologies. We then analyzed HUD’s data on LSA data submissions for fiscal years 2021 and 2022 to identify data quality issues that may have affected CoCs’ data usability. Next, we took steps to replicate Abt’s usability determination process to assess whether it met the agency’s Information Quality Guidelines. We also interviewed HUD officials and Abt staff about their procedures for evaluating the quality of LSA data.
To assess the accuracy of HUD’s estimates, we reviewed LSA data, evaluated HUD’s statistical code, and interviewed HUD officials and Abt staff. We assessed whether Abt’s processes for addressing missing data from unusable and nonparticipating projects, including data on the number and demographics of people served, adhered to accepted statistical practices.
To address our third objective, we reviewed HUD guidance on preparing and submitting LSA data, as well as other tools and resources the agency and Abt have developed to help CoCs improve data quality. We interviewed staff from our selected CoCs to identify HUD efforts that may have improved LSA data quality or challenges to submitting quality data that CoCs face. We assessed HUD’s efforts to improve data quality against key practices for evidence-based policymaking that GAO previously identified.[3] Appendix I provides more detail on our scope and methodology.
We conducted this performance audit from May 2024 to September 2025 in accordance with generally accepted government auditing standards. Those standards require that we plan and perform the audit to obtain sufficient, appropriate evidence to provide a reasonable basis for our findings and conclusions based on our audit objectives. We believe that the evidence obtained provides a reasonable basis for our findings and conclusions based on our audit objectives.
Background
Continuums of Care
Continuums of Care (CoC) are planning bodies that receive HUD funding to coordinate homelessness services within a defined geographic area.[4] CoCs vary in both the geographic areas and the number of people they serve. They may cover a single city, a county, multiple jurisdictions, or an entire state. As of July 2025, there were 387 CoCs, which HUD classifies as “major city,” “other urban,” “suburban,” or “rural.”[5] In addition to receiving HUD funds, CoCs are required to provide some matching funds, which they may receive from state, local, or private sources.[6]
The CoC program is administered by HUD’s Office of Special Needs Assistance Programs, which operates within HUD’s Office of Community Planning and Development. This office oversees the agency’s homelessness assistance programs and manages a broader set of community development and housing programs.
CoCs oversee multiple public and nonprofit homelessness service providers in their jurisdictions (see fig. 1).[7] These providers offer a range of housing, employment, counseling, and medical services to people experiencing or at risk of homelessness. The types of housing services (referred to as projects) include shelter programs (Emergency Shelter, Transitional Housing, and Safe Havens), Rapid Re-Housing, and Permanent Supportive Housing.[8] Some providers focus on specific populations, such as families, children, older adults, domestic violence survivors, or veterans. A single provider can implement multiple projects of one or more types.
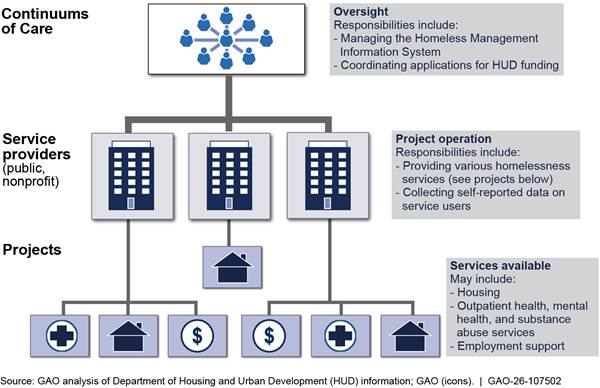
CoCs are required to maintain a Homeless Management Information System (HMIS)—a database used to collect person-level data and track the provision of housing and services to individuals and families experiencing or at risk of homelessness.[9] HMIS systems are developed by private firms to meet local CoC needs while conforming to HUD technical and data standards.[10] For projects that receive HUD funds, homelessness service providers are required to enter data into HMIS on the services they provide and the individuals using them.[11] For projects that do not receive HUD funds, providers may submit HMIS data voluntarily or to meet other requirements.[12] The data entered into HMIS include personally identifying information, such as name, date of birth, and Social Security number, as well as demographic details and history of using homelessness services.
HUD Reports on Homelessness
Each year, HUD reports to Congress an estimate of the number of people who experience homelessness in the United States in the Annual Homelessness Assessment Report (AHAR). Although not required by statute, Congress has provided funds for the report since 2001, most recently in 2025.[13] In 2002, HUD entered into a cooperative agreement with Abt Associates, Inc., a research and consulting firm, to support the development of the AHAR. Abt is responsible for collecting data from CoCs, preparing the data for analysis, creating estimates of people experiencing homelessness, and drafting the reports. HUD provides guidance on the process and reviews the reports prior to publication. HUD has published the AHAR annually since 2007.
Since 2012, HUD has published the AHAR in two parts. AHAR Part 1 uses data from the national Point-in-Time count and the Housing Inventory Count to estimate the number and characteristics of people experiencing homelessness in the United States on a single night.[14] The Point-in-Time counts are typically conducted by CoCs during one of the last 10 days of January. In 2024, all but four CoCs did so, with the others counting in February. The AHAR Part 1 estimates include both people using shelter programs and people without shelter—generally, those whose primary nighttime location is a public or private place not designated for, or ordinarily used as, a regular sleeping accommodation.
AHAR Part 2 uses aggregated HMIS data to estimate the total number of people who used shelter programs during a 1-year period from October 1st through September 30th, along with information about their demographic characteristics and shelter-use patterns.[15] Because the data are submitted at the end of the fiscal year and require significant assessments for quality prior to analysis, the AHAR Part 2 report for a given year provides estimates for 2 years earlier. The most recent AHAR Part 2 was published in May 2024 and contains estimates for fiscal year 2022.
Prior to 2018, HUD used HMIS data from selected sample sites—specific jurisdictions covered by some CoCs—but these data had limitations. For example, they only included two household types (individuals and families) and did not provide detailed information on shelter use across time.
In 2018, HUD began using more comprehensive aggregated HMIS data, referred to as Longitudinal Systems Analysis (LSA). These data include three household types—Adult Only, Adult and Child, and Child Only—and track how people use shelter programs over time. Also in 2018, HUD shifted from using data from sample sites to using data from all CoCs with usable data to produce its AHAR Part 2 estimates.
HUD Uses Data from Service Providers to Estimate Shelter Use
HUD Obtains and Reviews Administrative Data from Service Providers
HUD uses administrative data—records collected by public and nonprofit agencies on people who use their services—to estimate the number and demographic characteristics of people who use shelter programs. These data are aggregated, meaning they are combined and stripped of personally identifying information to maintain the anonymity of service users. The data are submitted to HUD by CoCs, which, as noted earlier, maintain an HMIS database to collect data from service providers in their jurisdictions. In addition to meeting HUD reporting requirements, CoCs and service providers use HMIS data for their own administrative purposes, such as evaluating project performance, planning future services, and coordinating care.
Service providers enter data for most of their projects into HMIS. HUD reported that in 2024, service providers entered data into HMIS for 77 percent of all shelter program beds.[16] Projects that submit data are referred to as “HMIS-participating.” HUD has reported that it encourages all projects to participate in HMIS. However, staff at several CoCs told us that HMIS participation can be too costly and time-consuming for some projects that do not receive HUD funding. While HMIS participation offers benefits, CoC staff noted that they are not always able to incentivize those projects to take on additional costs.
Service providers for participating projects are required to collect specific data elements from people using shelter programs. These data elements include demographic information—such as service users’ race, ethnicity, gender, age, disability status, veteran status, and employment status—as well as their history of using shelter programs and their shelter entry and exit dates.[17] People using shelter services self-report demographic data, and project staff document these data as reported, rather than based on staff observation. In some cases, data can be corroborated with a service user’s identification. Service users can decline to provide any information, and project staff can document this in HMIS. Staff of one service provider we interviewed said it was rare for people to decline to provide demographic information.
Once a year, during a 2-month period that begins in November, CoCs export aggregated data files from their HMIS, known as LSA data, and submit them to Abt through an online system. LSA data consist of 12 files, each structured to capture different aspects of the CoC’s data. For example, some files contain information on the HMIS system itself, the service providers in the CoC, or the specific projects they operate. Other files focus on households served, individuals served, or people who exited from projects (see app. II for a description of all 12 files). By aggregating the data, CoCs remove all personally identifying information before submission. This allows HUD, through Abt, to create national estimates of shelter use without maintaining personally identifiable information on individuals experiencing homelessness in a federal database.
When CoCs submit LSA data, HUD’s system automatically reviews the data and flags potential data quality issues. The system creates flags for more than 1,000 data quality issues, which fall into two categories, errors and warnings:
· Errors are impossibilities in the data. For example, a CoC might receive an error if one data field indicates that a person was not served in a project, while a different field identifies the same person as the head of a household served in that project.
· Warnings are abnormalities that are technically possible but may point to an issue in the data. A CoC might receive a warning if there is a large change in the number of chronically homeless adults from year-to-year, or if a person is enrolled in a project for longer than expected.[18]
Between 2021 and 2022, the number of errors and warnings in LSA submissions declined.[19] In 2021, 384 CoCs submitted LSA data and received a total of 29,179 flags, of which 39 percent were errors. In contrast, in 2022, 386 CoCs submitted LSA data and received 16,578 flags, of which 16 percent were errors. On average, CoCs received 30 errors and 46 warnings in 2021, compared with seven errors and 36 warnings in 2022.
Flags can indicate a range of data quality issues that can occur in different sections of the LSA data, such as at the individual project level or the CoC level. Abt’s system categorizes flags by the type of issue detected—for example, a service user staying enrolled in a project longer than is typical, discrepancies between files, or missing bed counts for an active project.
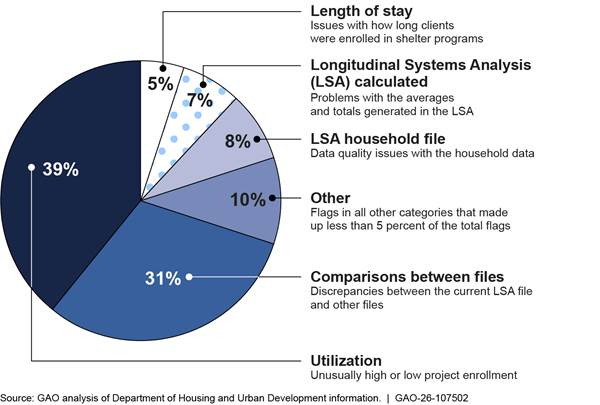
In 2022, the most common category of flag, accounting for 39 percent, was related to project utilization, which indicates unusually high or low enrollment (see fig. 2). A CoC could receive this flag if, for example, it reported no people enrolled in a shelter during the reporting period.
Other common flag categories in 2022 included discrepancies between LSA data and other measures of shelter use, issues with household data, problems with how LSA data were aggregated, and discrepancies in the number of days service users spent in shelter programs.
To address errors, CoCs must revise the underlying HMIS data and resubmit their LSA files to Abt.[20] CoCs we spoke with said that in some cases they are able to correct errors directly in HMIS. In other cases, the errors stemmed from issues with how their HMIS system was configured, requiring changes only the software vendor can make.
To address warnings, CoCs can revise the underlying data if they find inaccuracies, or they can provide a note in the online submission system if the data are accurate. For example, if a CoC receives a flag because a shelter project reported serving significantly fewer people than in previous years, and the COC determines the project’s data were entered incorrectly, it can update the data in HMIS and resubmit it. Alternatively, if the lower number is accurate, CoC staff can instead submit a note explaining the reason for the decrease. Abt staff review these notes and can resolve the warning if the CoC’s explanation is sufficient. If it is not, Abt staff can leave the warning unresolved and request additional information from the CoC.[21] In both 2021 and 2022, CoCs were able to resolve 47 percent of the data quality warnings they received.
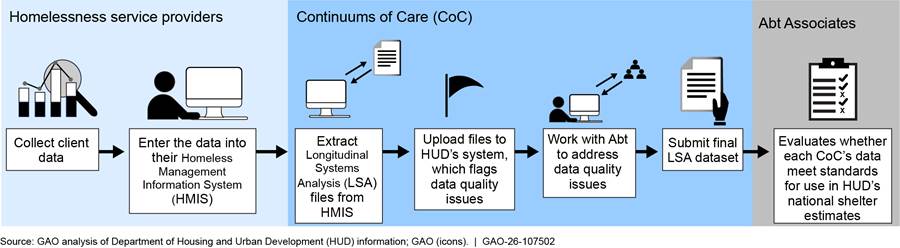
After CoCs submit their final LSA data, Abt evaluates the quality of each CoC’s data to determine whether the data can be used in the AHAR Part 2. Based on this review, Abt classifies each submission as usable, unusable, or partially usable for producing the national estimates of shelter program use. Figure 3 illustrates HUD’s process for collecting data on shelter use for national estimates.
HUD Uses Statistical Methods to Account for Data Gaps
HUD reports estimates—rather than actual counts—of the number of people who use shelter programs. This approach is needed because some CoCs’ LSA data are not usable due to data quality issues, and some shelter projects do not submit data to HMIS. The more CoCs that provide usable data and the more projects that participate in HMIS, the less HUD must rely on estimation.
Abt uses statistical techniques to impute—that is, to estimate and replace—missing or unusable data. These imputations cover both CoCs without usable LSA data and shelter projects that do not participate in HMIS. Abt first identifies comparable projects with usable data. It does so using four factors: project type, household type, geographic area (rural, suburban, or urban), and whether the project had more than the median bed count for similar projects.[22] Next, Abt calculates the average number of persons per bed across the comparable projects and multiplies that average by the bed count of each project that did not have usable data, which is taken from the Housing Inventory Count (see fig. 4).
Abt estimates the number of people in missing Longitudinal Systems Analysis (LSA) data by using information from similar Continuums of Care that report through the Homeless Management Information System.
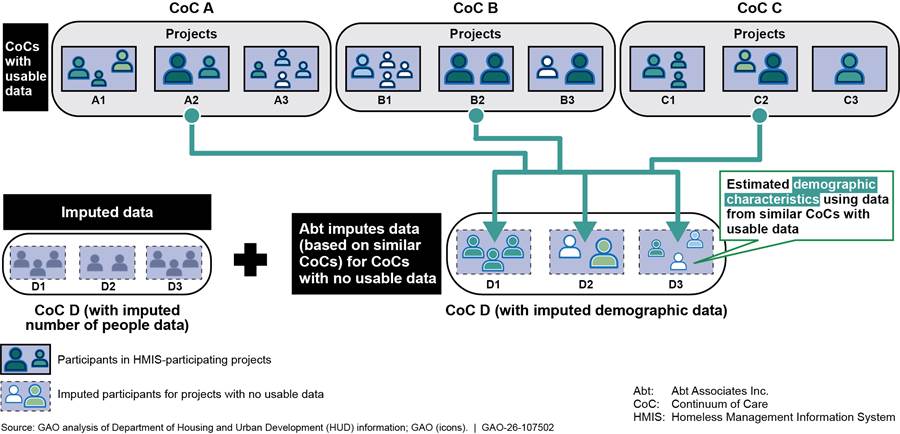
After imputing the number of people who used shelter programs at CoCs with unusable data or in nonparticipating projects, Abt creates statistical “weights” to estimate their demographic characteristics. These weights are based on the demographic characteristics of people who used shelter programs at similar CoCs with usable data (see fig. 5). Abt identifies similar CoCs on the basis of a variety of characteristics, including the percentage of people in different geographic areas and race and age categories, and the percentage who are veterans or chronically homeless.[23] For CoCs without usable LSA data, Abt staff said they use the annual Point-in-Time count and other data sources to identify these CoC characteristics.
Abt estimates demographic characteristics in missing Longitudinal Systems Analysis (LSA) data by using information from similar Continuums of Care that report through the Homeless Management Information System.
Abt also uses statistical techniques to avoid double-counting individuals who use multiple projects in a given year or who enroll under different household types (for example, once as an individual and once as part of a family). According to Abt, when someone is served by multiple projects that submit data to HMIS, the CoC’s system automatically accounts for this when generating LSA files.
However, if someone uses both HMIS-participating and nonparticipating projects, they may be counted more than once. To correct for this, Abt estimates the percentage of overlap—that is, the number of people who use multiple services within a CoC—and reduces the total count for the relevant project type. Abt uses a similar process to account for people who may appear separately as part of different household types but cannot be matched in the data.
HUD’s Process for Assessing Data Quality Is Not Transparent, and Its Estimates Are Likely Less Precise Than Reported
HUD’s Data Quality Assessments Lack Transparency and Cannot Be Reproduced
HUD has a multistage process for determining whether CoCs’ LSA data are usable for estimating the number of people who use shelter programs, but some aspects of the process are not transparent. The review process occurs after CoCs submit their final LSA data. According to HUD, LSA data are considered usable if they do not contain any “major data quality issues.”[24]
To identify these issues, Abt staff conduct two independent reviews of files that include each CoC’s unresolved flags, CoC and Abt staff comments from the submission period, and relevant LSA data. The two reviews are as follows:
· First review: Abt staff determine the usability of a CoC’s LSA data for each combination of project type and household type.[25] Staff classify the data as usable, unusable, or partially usable. A partially usable determination means that major data quality issues are limited to bed-related data. In these cases, Abt retains the person-level data but discards the bed data for that category and instead uses bed data from the Housing Inventory Count.[26]
· Second review: Senior Abt staff reassess the initial determinations, with a goal of including as many CoCs’ data in the shelter use estimates as possible, according to Abt staff. In some cases, staff may change a determination from unusable to usable if the data are judged to be close in quality to data from other CoCs deemed usable.
The number of CoCs with usable LSA data increased between 2021 and 2022 (see table 1).[27] In 2021, Abt staff determined that 77 of 387 CoCs had usable data in all categories. In 2022, this number nearly doubled to 152.
|
|
Number of Continuums of Care |
|
|||
|
LSA usability determination |
2021 |
2022 |
|
||
|
All data usable |
77 (20%) |
152 (39%) |
|||
|
Some data usable |
204 (53%) |
170 (44%) |
|||
|
No data usable |
106 (27%) |
65 (17%) |
|||
|
Total |
387 |
387 |
|||
Source: GAO analysis of Department of Housing and Urban Development (HUD) data. | GAO‑26‑107502
Both CoCs with fully usable and fully unusable data had unresolved flags in 2021 and 2022. HUD’s guidance on the LSA submission process recommends that CoCs resolve as many flags as possible by cleaning their administrative data, eliminating data errors, and addressing warnings with explanatory comments.[28] However, CoCs do not have to eliminate all flags to receive a usable determination. In 2021 and 2022, Abt often determined that CoCs with unresolved flags still had usable data. We found that 78 percent of CoCs with fully usable data in 2021, and 63 percent in 2022, had at least one unresolved flag.
While having unresolved flags was not determinative of CoCs’ data usability, CoCs with fewer flags were more likely to have all data deemed usable. In 2021, CoCs with fully usable data in all nine categories had an average of five unresolved flags, compared with 156 unresolved flags for CoCs with no usable data. In 2022, CoCs with fully usable data had an average of three unresolved flags, and CoCs with no usable data had an average of 74 unresolved flags (see table 2).
|
|
Average number of unresolved data quality flags |
||
|
Usability determination |
2021 |
2022 |
|
|
All data usable |
5 |
3 |
|
|
Some data usable |
22 |
28 |
|
|
No data usable |
156 |
75 |
|
Source: GAO analysis of Department of Housing and Urban Development data. | GAO‑26‑107502
Note: A data quality flag indicates a potential issue in a Continuum of Care’s Longitudinal Systems Analysis data. A flag is unresolved if there is a concern that the data may not be accurate.
According to Abt staff, they use their own professional judgment to determine the usability of CoCs’ data and have developed some unwritten standards for certain flags. For example, Abt staff said data would generally be considered unusable if more than 10 percent of people were missing location information, or if more than 19 percent of a CoC’s data had missing, invalid, or duplicated Social Security numbers. They also noted that some flags are considered less important for determining usability and that data that triggered these flags would be considered usable if no other issues were present. For example, differences between the current year’s data and previous year’s were not viewed as major issues.
While HUD has not documented which flags are considered lower priority (discussed in more detail below), we were able to identify flags that appeared only for CoCs with all fully usable data, which may indicate that these flags do not significantly affect usability determinations. Two flags in 2021 and nine flags in 2022 appeared only for CoCs that had all usable data. For example, one flag noted a discrepancy between the percentage of Hispanic people in the LSA data compared with the CoC’s Point-in-Time count. Another flag noted that some households were likely assigned the wrong geography type (urban, rural, or suburban).
We were also able to identify flags that only CoCs with no usable data received, which may indicate that those flags are significant in Abt’s determinations. In 2021 there were 146 such flags, 81 percent of which were data errors. In 2022, there were 66, of which half were data errors. In both years, some of these flags indicated that the count of people was not consistent across the LSA files—particularly for subpopulations such as veterans, people with disabilities, or people experiencing chronic homelessness. These types of discrepancies may indicate that a CoC’s data have a “fatal flaw” and cannot be considered usable. However, this is not always the case. For example, we identified 12 flags that appeared only in CoCs with no usable data in 2021, but that also appeared in CoCs with some usable data in 2022. This suggests that the significance of individual flags may vary depending on other aspects of the data.
While we were able to identify some flags that may be of higher or lower priority in HUD’s usability determinations, we reviewed the flags for a sample of CoCs from fiscal years 2021 and 2022 and could not reproduce HUD’s decisions.[29] Specifically, we reviewed the unresolved flags for LSA submissions from those years—the most recent for which flag data were available—as well as other HUD information to assess how Abt used professional judgement in its usability determinations.[30] We found that the available information was not sufficient to explain HUD’s decisions. For example:
· CoCs with no usable data but few flags. We identified six CoCs that had no usable LSA data and fewer than five unresolved flags. While some of these CoCs had flags associated with missing Social Security numbers, which Abt staff noted could result in unusable data, we could not identify which flags caused the unusable determination in all cases. For example, one CoC had a single unresolved flag related to its data about the number of beds available in one household category. Abt determined that all of the CoC’s data were unusable, even though two of the household categories had no unresolved flags.[31]
· CoCs with all usable data and many flags. We identified seven CoCs with all usable data despite having a high number of unresolved flags. For example, one CoC had 33 unresolved data flags for a variety of issues, including unusual shelter utilization rates, discrepancies in the bed inventory count, and missing age data. The flag descriptions and Abt staff comments in the flag data did not explain why some of these problems were not considered major quality issues.
· CoCs with all usable data and multiple data errors. We identified 15 CoCs that had all usable data despite having multiple unresolved data errors. Because errors are impossibilities in the data, unresolved errors may indicate major quality issues. However, we could not confirm why Abt decided these errors did not affect the CoCs’ data usability. For example, one CoC had seven unresolved errors that indicated that a “significant” number of people were missing their enrollment location. The flag descriptions and staff comments did not explain why Abt determined all of the CoCs’ data were usable.
· CoCs with some unusable data but no unresolved flags. We identified nine CoCs that had some unusable data despite resolving all of their flags. As discussed earlier, according to HUD, resolved flags indicate that the underlying data are accurate, so it was not clear what issues led Abt to find some of the data to be unusable.[32] For example, one CoC resolved all of its flags, but all of its Permanent Supportive Housing data were determined to be unusable. Further, this CoC did not receive any flags for one category of data, but Abt determined those data were unusable. We could not determine why Abt determined these data to have major quality issues in the absence of unresolved flags.
According to Office of Management and Budget guidelines, federal agencies must ensure and maximize the quality, objectivity, utility, and integrity of statistical information disseminated by the agency.[33] The guidelines state that for statistical information to be objective, agencies must provide sufficient transparency about their data and methods so that the information can be substantially reproduced.
However, we were not able to reproduce HUD’s data usability determinations because HUD has not developed criteria for assessing LSA flags and has not documented which flags, either alone or in combination, indicate major data quality issues. HUD officials said they have considered identifying which flags carry greater or less weight in their usability determinations, but they said they have limited resources and have prioritized other efforts to improve CoCs’ data quality during the initial years of using LSA data.
Nonetheless, the lack of transparency about how HUD determines which data are of sufficient quality to use makes it difficult to assess the reliability of its estimates. By improving transparency around its data review methods, HUD could help ensure that the public, CoCs, and Congress better understand the basis for its national estimates of shelter program use. Greater clarity could, in turn, increase confidence in the quality of the estimates published in the AHAR Part 2.
HUD’s Statistical Methods Likely Underestimate Reported Margins of Error
To produce national estimates of shelter program use, HUD uses an imputation method that may cause its estimates to appear more precise than they are. Specifically, HUD calculates the average number of people per bed among groups of shelter projects with usable data and applies that average to similar projects with unusable data or that do not participate in HMIS (see fig. 6). This approach is known as a “means-based” imputation method.
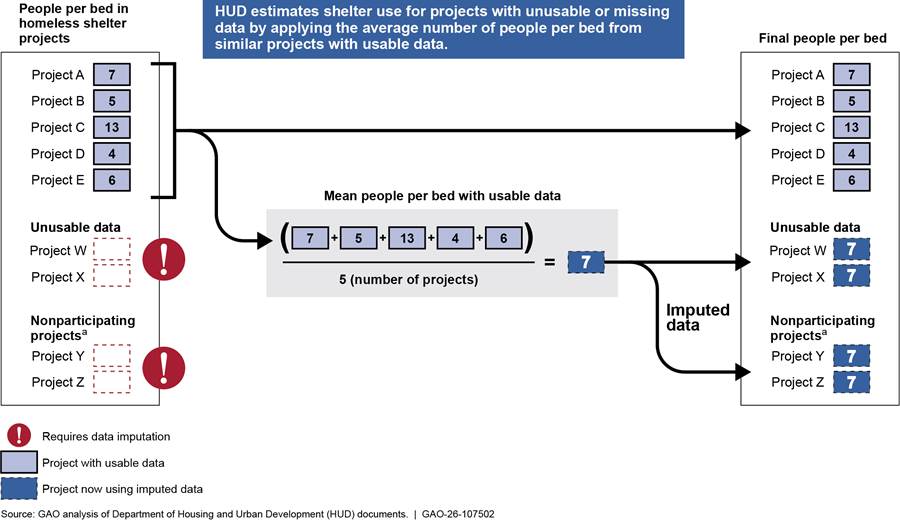
Note: HUD assesses the quality of LSA data to determine whether each project’s data are usable in the agency’s estimates of people who use shelter programs. Projects are classified has having usable, partially usable, or unusable data.
aA nonparticipating project is a shelter project that does not enter data in a Continuum of Care’s Homeless Management Information System. These include shelters that do not receive HUD funding and shelters that serve victims of domestic violence.
By using the same value for all projects that are imputed, HUD likely reduces the variation of people-per-bed values in those projects. For example, if four projects require imputation, each likely had a different number of people per bed in reality. However, by assigning all four projects the same number of people per bed, the means-based imputation process makes the data more uniform. This approach reduces variation in the people-per-bed data.[34]
This reduced variation likely causes HUD’s estimates of sheltered homelessness to appear more precise than they actually are. Margins of error show the precision of an estimate by identifying a range of possible unknown population values at a given confidence level, with smaller margins of error indicating more precise estimates. Margins of error are based in part on the variation in the data used to make the estimate, with greater variation in the data causing wider margins of error.
HUD estimated that 1,388,425 people used shelter programs in 2022, with margins of error of plus or minus 123,013 (or 9 percent) at the 95 percent confidence level.[35] This results in lower and upper bounds of HUD’s estimate of 1,265,413 and 1,511,438, respectively, meaning that the true population value likely falls somewhere between those two numbers. However, because the means-based imputation likely artificially narrowed that range, more accurate lower and upper bounds would be lower than 1,265,413 and higher than 1,511,438 (see fig. 7).
Figure 7: HUD’s Imputation Method Likely Understates the Margins of Error in 2022 Shelter Use Estimates
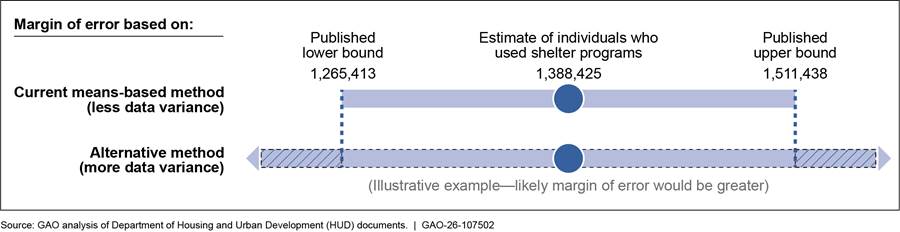
According to statistical principles, means-based imputation methods systematically underestimate data variance and should be avoided when possible.[36] HUD acknowledged in its AHAR methodology report that this approach likely results in smaller margins of error than would occur with different methods because “using a means-based imputation approach ensures that the same value will be used to impute.”[37]
Alternative imputation methods that do not impute the same number for all missing data would not reduce the variation in the people-per-bed values and could be appropriate given the LSA data’s characteristics. For example, a random selection approach would involve selecting a single usable project at random and using its value for one unusable project. Repeating this process for all unusable and nonparticipating projects would result in a final dataset with greater variation.
Abt staff told us they tested one alternative imputation method, but that method also likely narrowed the margins of error. Specifically, the method tested—”predictive means matching”—also would have imputed the same value to multiple projects. As a result, it would likely have reduced variation in the people-per-bed values and narrowed the margins of error of HUD’s estimates. HUD officials said they had not tested other imputation methods due to resource constraints. However, we tested an alternative imputation method on simulated project data, and our analysis found that testing the new method did not require substantial resource investment.
Using an alternative imputation method that does not artificially reduce the variation in the LSA data would result in more accurate margins of error for HUD’s estimates in AHAR Part 2. In turn, this could help Congress and the public better understand the potential range of over- or underestimation in the reported number of people using shelter programs. More accurate information on shelter use could help policymakers and service providers better plan and deploy appropriate resources.
HUD Offers Tools to Address Data Quality Issues but Does Not Explain Why Data Are Unusable
HUD Has Taken Steps Designed to Improve CoCs’ Data Quality
HUD offers tools and resources to help CoCs improve the quality of their HMIS data and LSA submissions. These include online guidance documents, interactive online applications, and direct technical assistance.[38]
As discussed earlier, the quality of CoCs’ LSA data improved from 2021 to 2022, as reflected in a decline in data quality flags and an increase in the share of data deemed usable. Abt staff also told us that the quality of CoCs’ LSA data has improved since HUD began collecting them in 2018. CoC representatives we interviewed attributed some of this improvement to HUD’s tools and resources, especially the Eva tool, the LSA Common Flags Library, and technical assistance from Abt.
Eva is an online tool that helps CoCs identify LSA data quality issues on an ongoing basis.[39] It allows CoCs to upload deidentified HMIS data at any time to identify many of the same data quality flags generated through LSA submission.[40] In September 2024, HUD reported that the Eva tool identifies many, but not all, of the flags generated by HUD’s submission system.[41] For example, Eva does not identify discrepancies with Housing Inventory Count data or issues caused when LSA aggregates HMIS data. HUD released Eva in 2022, and in summer 2025 HUD officials said they planned to continue updating its functionality.
Ten of the 14 CoCs we spoke with said Eva made it easier to address data quality issues. Six CoCs said using Eva before submitting their data reduced the number of flags they received. Six CoCs said addressing all of their data quality issues during the LSA data submission period was challenging because the submission window is short and falls during months with multiple holidays. Additionally, nine CoCs noted that it can take days to address some data warnings, which may involve preparing reports on the flags, identifying the source of the issues, and confirming data accuracy with a service provider. Six CoCs said Eva allowed them to spread this work out over the year and address more issues than they otherwise would have.
However, not all CoCs we spoke with said they had used the Eva tool. Staff from one CoC said their HMIS vendor had an LSA analysis tool that they used instead of Eva.
|
A CoC Uses the Eva Tool for Routine Data Cleaning Staff we spoke with at one Continuum of Care (CoC) said they use the Department of Housing and Urban Development’s Eva tool to conduct monthly data quality reviews. The CoC staff use Eva on a monthly basis to identify errors and warnings in their data, and then send the results to the relevant service providers for correction. CoC staff said this routine use of Eva has streamlined their Longitudinal Systems Analysis (LSA) submission process by making the data quality flags more manageable. During the most recent LSA submission window, the CoC’s first data submission had only 12 flags. |
Source: GAO. | GAO‑26‑107502
HUD also developed the LSA Common Flags Library as a resource to support CoCs in addressing data quality issues. The library, available as an interactive Excel spreadsheet on HUD’s website, contains plain-language summaries of common flags and suggestions for addressing them (see table 3).[42] For example, the library explains that one flag may be caused by a person aging into a new age category while staying in a shelter. If someone entered a program at age 17 and turned 18 during their stay, they could be counted in both the 6–17 and 18–21 age groups. The library advises CoCs to review the individual’s birthdate and resolve the issue with an explanatory note.
|
Flag ID |
Description |
Possible causes |
Steps needed to resolve |
|
693 |
The number of people with an active enrollment on a specific day in a given subpopulation is greater than the number of people in a related, broader population. |
This flag may be caused by people who age into different population groups during the reporting year—for example, a 21-year-old who turns 22 either during enrollment or between multiple enrollments. |
Review demographic information (specifically date of birth) and determine if a proportion of the people aged out of one population group. Small discrepancies (around five or less) can likely be attributed to individuals aging into a different group. If the date-of-birth field confirms that the data are accurate, no corrections are expected in the Continuum of Care’s (CoC) Homelessness Management Information System (HMIS). A note describing that data have been checked and confirmed as accurate is sufficient. |
|
794 |
The start and end dates on this seasonal inventory record are too far apart to be considered “seasonal.” Seasonal beds are not available year-round. |
End dates for inventory records may have been entered incorrectly. Bed availability type may have been entered incorrectly (e.g., seasonal instead of year-round or overflow). |
Review definitions of bed availability to determine if “seasonal” appropriately describes the affected inventory records. If not, make appropriate changes in HMIS. |
|
815 |
This project’s zip code does not match any zip codes within your CoC’s state. |
Project zip code may have been misentered. Project may serve more than one CoC. |
If the zip code is correct, confirm that the project operates in multiple CoCs. |
Source: GAO analysis of information from the Department of Housing and Urban Development’s LSA Common Flags Library 2024. | GAO‑26‑107502
Abt staff said they update the library annually to reflect the most common flags from the most recent LSA submissions. Four of the 14 CoCs we spoke with said they had used this resource and that it helped them address data quality issues.
Abt staff also offer technical assistance to CoCs to help improve the quality of their data. Abt staff communicate with CoCs through comment boxes in the online LSA submission system, hold office hours, and conduct individual phone calls with CoC staff. Abt staff provide individualized advice on how to understand and resolve the flags, according to CoCs we spoke with.
Almost all CoC we spoke with said they had positive experiences receiving assistance from Abt staff during the LSA submission process. For example, staff at one CoC reported that when they struggled to address a particular flag, Abt staff scheduled multiple calls to help resolve the issue. Two CoCs said Abt staff host informative conference calls with multiple CoCs that are especially useful for staff new to the LSA submission process. Most CoCs we spoke with said Abt’s technical assistance was responsive or helpful. Some CoCs said that Abt’s communication had improved since the LSA process began in 2018.
HUD’s Feedback to CoCs on Data Usability Lacks Specificity
While HUD has developed resources and tools to help CoCs improve their data quality, some CoCs we interviewed said preparing and submitting LSA data was still a challenge because HUD does not provide sufficient information about its usability determinations. Of the 14 CoCs we spoke with, eight said they continued to experience difficulties with the process despite improvements since 2018.
According to HUD officials, the agency began communicating its usability determinations to each CoC in 2023, but those communications do not explain why certain data were considered usable or not.[43] HUD officials said they emailed each CoC’s HMIS administrator with the usability results. Some CoCs we spoke with confirmed receiving this email, while others said they were not aware of it. The email did not specify which flags were significant in the decision or whether professional judgment played a role. Instead, HUD directed CoCs to review their data quality flags in the LSA submission system. However, as discussed earlier, the flag information does not explain how the flags contribute to usability determinations.
CoCs told us that having additional information about how HUD uses flags in its review process would save them time because resolving flags can be time-intensive. When CoC and program staff spend time addressing data quality flags, it may divert them from other critical functions. For example, staff from one CoC said that when submitting LSA data in 2024, they resolved all but one of their flags, which affected very few records in their data. The CoC asked if they could submit their final LSA data with that issue unresolved. Abt directed them to keep working to address the flag. Ultimately, they were not able to resolve the issue but found out later that the data were determined to be usable. They said that knowing this earlier would have saved time and allowed staff to focus on other work.
Other CoCs noted that understanding which flags contributed to their usability determinations would help them submit more useable data in the future. For example, staff of one CoC said that after learning their data were unusable, they requested clarification of the data quality issues that led to the determination. HUD did not provide specific feedback but told the CoC to use the Eva tool to identify their data quality issues. The CoC tried to improve its data quality by restructuring its LSA data submission process and providing additional explanatory notes. However, the following year its data were still unusable because it had apparently not adequately addressed the issues that led to the determination. Understanding why its data were not usable could have helped the CoC to address critical data quality issues.
One of GAO’s key practices for evidence-based policymaking is to communicate learning and results to external stakeholders.[44] By effectively communicating results and tailoring them to stakeholders’ needs, a federal agency can provide stakeholders with the information needed to assist with the agency’s goals.
HUD officials told us they have not communicated the reasons for their usability determinations to CoCs because providing individualized feedback to hundreds of CoCs would be too resource intensive. However, HUD already communicates the determination results to all CoCs, and adding more detail to that communication may not be burdensome if decisions are already well documented. Further, HUD could communicate additional information on its decision-making without providing individual feedback by, for example, publishing information on which flags are generally considered higher or lower priority in usability determinations.
Because HUD does not communicate which flags cause a CoC’s LSA data to be considered unusable, CoCs may not know the most effective way to improve their data’s usability. As a result, they may devote time and resources to changes that do not improve usability or HUD’s estimates of shelter use. In addition, CoC project staff may unnecessarily spend time resolving flags that do not improve data usability.
Conclusions
Reliable information on homelessness can help policymakers and homelessness service providers develop more effective programs. HUD has developed detailed data standards and tools to support consistent reporting and, through AHAR Parts 1 and 2, provides the only nationwide estimates of people experiencing homelessness. However, we identified three areas where HUD could improve its data practices to better support reliable and useful estimates:
· Transparency of data quality assessments. HUD publishes a nationwide estimate of the number of people and households that use homelessness shelter programs, on the basis of service-provider data it assesses to be of sufficient quality. However, we could not reproduce HUD’s data quality assessments because HUD has not identified which data quality issues affect usability. By making its process for evaluating data quality more transparent, HUD could increase confidence in the quality of its estimates.
· Accuracy of statistical methods. HUD uses a statistical method that may artificially narrow the margins of error for its estimates of shelter use, making the results appear more precise than they actually are. Alternative methods could allow HUD to more accurately reflect the uncertainty of its estimates.
· Communication with data providers. CoCs we interviewed said HUD does not provide sufficient information about its data usability determinations. HUD informs CoCs if their data are not usable but does not explain how it made its decisions. By identifying which data quality issues led to data being deemed unusable, HUD could help CoCs better allocate their limited resources and improve the usability of their data.
Recommendations for Executive Action
We are making three recommendations to HUD. Specifically:
The Secretary of HUD should increase the transparency of HUD’s usability determinations by adopting clear criteria for how data quality flags should be applied in those decisions. To the extent that subjective judgment is used, HUD should document the reasons for its decisions. (Recommendation 1)
The Secretary of HUD should reevaluate the statistical methods used to estimate shelter use to assess whether alternative imputation methods could more accurately reflect the uncertainty of its estimates. (Recommendation 2)
The Secretary of HUD should communicate the rationales for HUD’s usability determinations to Continuums of Care, such as by providing information on which data quality flags are considered higher or lower priority. (Recommendation 3)
Agency Comments
We provided a draft of this report to HUD for comment and review. In its written comments, reproduced in appendix III, HUD concurred with our recommendations and cited actions to address them, and noted that fully implementing them would require additional resources. HUD also provided technical comments and requested additional information, which we incorporated and provided as appropriate.
As agreed with your offices, unless you publicly announce the contents of this report earlier, we plan no further distribution until 30 days from the report date. At that time, we will send copies to the Secretary of HUD, the appropriate congressional committees and members, and other interested parties. In addition, the report is available at no charge on the GAO website at http://www.gao.gov.
If you or your staff have any questions about this report, please contact me at cackleya@gao.gov. Contact points for our Offices of Congressional Relations and Public Affairs may be found on the last page of this report. GAO staff who made key contributions to this report are listed in appendix IV.

Alicia Puente Cackley
Director, Financial Markets and Community Investment
The objectives of this report were to (1) describe the Department of Housing and Urban Development’s (HUD) process for estimating the number and characteristics of people who use shelter programs, (2) examines HUD’s process for assessing data quality and creating estimates, and (3) assess HUD’s efforts to address data quality issues that may affect its estimates.
To address all three objectives, we reviewed relevant laws and regulations, including the McKinney-Vento Homeless Assistance Act, Continuum of Care (CoC) program regulations, and an appropriation law for the CoC program.[45] We reviewed relevant HUD reports, such as the Annual Homeless Assessment Reports (AHAR) to Congress from 2007, 2018, 2021, and 2022, along with their supporting data from fiscal years 2021 and 2022 and the 2022 AHAR Part 2 methodology report.[46] At the time of our work, the 2022 LSA data and AHAR Part 2 report, published in May 2024, were the most recent information available.[47] We also reviewed HUD guidance on submitting Longitudinal Systems Analysis (LSA) data and resolving common data quality issues.[48] In addition, we interviewed HUD officials and staff from Abt Associates, HUD’s third-party research and consulting firm that helps collect and analyze data for the AHAR.
Describing HUD’s Process for Estimating Shelter Use
To determine how HUD and Abt collect data on people using homelessness services, we reviewed HUD documents describing Homeless Management Information System (HMIS) data and the LSA process. These included HUD’s fiscal year 2024 HMIS data standards manual, fiscal year 2023 HMIS program specifications for LSA, and the introductory guide to submitting LSA data for the AHAR.[49] To determine how the data are organized in each of the 12 LSA files, we reviewed HUD’s fiscal year 2023 HMIS programming specifications and the introductory guide to submitting LSA data. We also interviewed representatives of selected CoCs (selection method described below) about their projects’ participation in HMIS and how they submit LSA data. Additionally, we interviewed representatives of three service providers about their experience using HMIS and assisting CoCs in preparing the LSA submissions. We judgmentally selected these service providers by asking a CoC to identify providers with relevant HMIS experience.
To determine how Abt calculates the national estimates of people using shelter programs that HUD publishes in the AHAR Part 2, we reviewed the AHAR Part 2 methodology reports for 2021 and 2022. We also interviewed HUD and Abt officials on the statistical methods used to account for missing data and to correct for potential double counting of service users. In addition, we reviewed the SAS programming code that Abt used to analyze CoCs’ data and generate national estimates. We also reviewed the raw, unadjusted LSA data on shelter program use that CoCs submitted to HUD in 2021 and 2022.
In addition, we analyzed HUD data on the LSA data quality flags that CoCs received for fiscal years 2021 and 2022, the most recent years available. The data included identifying information about each flag, classifications by type and source, the aspect of the LSA data affected, explanatory notes from CoC staff, comments from Abt staff in response, and the status of the flag (such as sufficiently addressed or additional information requested).[50]
To determine the amount and types of data quality issues HUD identified in CoCs’ LSA data submissions, we calculated the total number of errors and warnings CoCs received and calculated the prevalence of different flag types based on Abt’s “Flag Category” classification. To identify trends in the quality of CoCs’ data, we calculated the average number of unresolved flags by CoC usability determination.[51] To identify patterns of issues among CoCs with all usable data or no usable data, we identified the most common flags received by CoCs in each group.[52]
To ensure we collected a variety of perspectives from CoCs, we judgmentally selected a sample of 14 CoCs for interviews. To select those CoCs, we first identified a pool of 39 CoCs based on their usability determination, geography type, and prior GAO contact:
· Usability determination. We selected at least two CoCs from seven different combinations of all usable data, some usable data, and no usable data in 2021 and 2022 to ensure representation of different experiences with the LSA data submission process. The combinations were composed of different usability determinations across the 2 years (see table 4).
|
Number of Continuums |
Usability determination in |
Usability determination in 2022 |
|
9 |
All data usable |
All data usable |
|
9 |
No data usable |
No data usable |
|
7 |
Some data usable |
All data usable |
|
5 |
Some data usable |
Some data usable |
|
4 |
No data usable |
Some data usable |
|
3 |
All data usable |
Some data usable |
|
2 |
Some data usable |
No data usable |
Source: GAO analysis of Department of Housing and Urban Development (HUD) information. | GAO‑26‑107502
Note: HUD reviews nine categories of Longitudinal Systems Analysis data submitted by CoCs and determines each to be usable, partially usable, or not usable for HUD’s purposes. For our analysis, we considered a CoC to have “all data usable” if all nine categories were determined to be usable, “some data usable” if at least one category was usable or partially usable and at least one was not usable, and “no data usable” if all nine categories were determined not to be usable.
· Geography type. We selected at least four CoCs from each of HUD’s four geography types to ensure we would obtain perspectives from areas with varying population sizes.
· GAO interaction. We excluded CoCs that GAO had interviewed or visited within the previous 2 years to minimize burden on CoC staff.
Next, we identified 14 CoCs from this pool that we would prioritize for our semistructured interviews based on census region and homelessness rate:
· Census region. We selected at least four CoCs from each census region (West, Midwest, South, and Northeast) to ensure we heard perspectives from different regions. To maintain a balanced mix, we deprioritized some CoCs from overrepresented regions.
· Rate of homelessness. We prioritized CoCs that had higher rates of people experiencing homelessness because they would have more experience collecting and analyzing shelter data. We calculated each CoC’s homelessness rate by dividing its 2021 Point-in-Time count by the CoC’s total population, using HUD’s CoC Analysis Tool: Race and Ethnicity.[53]
When CoCs had similar usability determinations, geographic characteristics, and homelessness rates, we gave priority to those that received more HUD funding per shelter bed. We calculated this by dividing each CoC’s fiscal year 2021 funding by its 2021 Housing Inventory Count.[54]
We contacted the 14 priority CoCs and were able to interview nine. We conducted two site visits with priority CoCs—Alameda County and Sacramento—in person based on their proximity to GAO offices. We also contacted alternates from the original pool of 39 until we had at least one CoC from each usability determination, geographic type, and census region. We interviewed 14 CoCs in total, nine from the priority groups and five alternates (see table 5).
|
CoC code |
CoC name |
Census region |
Geography type |
Usability 2021 |
Usability 2022 |
|
CA-501 |
San Francisco |
West |
Major city |
Some data usable |
All data usable |
|
CA-502 |
Oakland, Berkeley/Alameda County |
West |
Major city |
No data usable |
No data usable |
|
CA-503 |
Sacramento City and County |
West |
Major city |
All data usable |
Some data usable |
|
CA-520 |
Merced City and County |
West |
Suburban |
No data usable |
Some data usable |
|
IA-501 |
Iowa Balance of State |
Midwest |
Rural |
No data usable |
Some data usable |
|
LA-503 |
New Orleans/Jefferson Parish |
South |
Other urban |
Some data usable |
Some data usable |
|
MI-501 |
Detroit |
Midwest |
Major city |
All data usable |
All data usable |
|
MI-510 |
Saginaw City and County |
Midwest |
Suburban |
All data usable |
Some data usable |
|
MN-501 |
Saint Paul/Ramsey County |
Midwest |
Other urban |
Some data usable |
All data usable |
|
NM-500 |
Albuquerque |
West |
Major city |
Some data usable |
Some data usable |
|
OH-500 |
Cincinnati/Hamilton County |
Midwest |
Suburban |
All data usable |
All data usable |
|
OR-500 |
Eugene, Springfield/Lane County |
West |
Other urban |
All data usable |
All data usable |
|
PA-509 |
Eastern Pennsylvania |
Northeast |
Rural |
No data usable |
No data usable |
|
WV-501 |
Huntington/Cabell, Wayne Counties |
South |
Rural |
All data usable |
All data usable |
Source: GAO analysis. | GAO‑26‑107502
Note: We judgmentally selected a sample of 39 CoCs and
prioritized and interviewed 14 of them.
This table lists the 14 CoCs we interviewed.
Examining HUD’s Process for Assessing Data Quality and Creating Estimates
To address our second objective, we analyzed HUD data on LSA data quality flags from 2021 and 2022 and interviewed a judgmental sample of CoCs (see above for detail on these methodological steps).
In addition, to assess the reliability of HUD’s process for assessing data quality, we attempted to reproduce Abt’s data usability determinations for selected CoCs in 2021 and 2022. We reviewed HUD documents and data and interviewed HUD officials and Abt staff about how HUD identifies data of sufficient quality to use in its estimates. The documents reviewed included HUD’s AHAR methodology report and internal HUD documents describing data quality flags and usability determinations. To reproduce Abt’s usability determinations, we took the following steps:
1. We analyzed the 2021 and 2022 flag data and identified a selection of CoCs whose number of flags was atypical for their usability determination. We selected these outliers to assess if we could understand why Abt had made its usability determinations in cases where the number of data quality issues was outside the norm. We identified
· six CoCs that had no usable data but fewer flags than the average for CoCs with all usable data;
· seven CoCs that had all usable data but more flags than the average for CoCs with some unusable data;
· 15 CoCs that had all usable data but multiple data errors (i.e., logical impossibilities within the data); and
· nine CoCs that resolved all of their flags but were still determined by Abt to have unusable data.
2. An analyst reviewed each CoC’s flags and associated documentation to determine if we could confirm how the flag information affected usability determinations. The analyst reviewed the flag’s description, status (resolved or not resolved), and explanatory comments from CoC and Abt staff. The analyst then compared these flags to the nine usability determinations that Abt assigned to the selected CoCs. The analyst sought to identify how the unresolved flags led to Abt’s determination.
3. A second analyst independently reviewed the same information and either concurred or disagreed with the first analyst’s conclusion. In cases of disagreement, a third analyst reviewed the same flag information, associated documentation, and analysts’ reviews, and made the final decision about whether Abt’s usability decision could be reproduced based on the information above.
To assess the reliability of HUD’s process for determining data quality, we reviewed the transparency and reproducibility of the usability determination process and assessed the process against the Office of Management and Budget’s Guidelines for Ensuring and Maximizing the Quality, Objectivity, Utility, and Integrity of information Disseminated by Federal Agencies.[55] Our analysis found that HUD’s data review process was not reproducible, despite the guidelines stating that information should be capable of being reproduced.
To determine the extent to which HUD’s estimation process produces accurate results, we reviewed HUD’s methodology report for the AHAR Part 2 and interviewed knowledgeable Abt staff about the statistical methods used to generate the estimates. Specifically, we assessed Abt’s imputation methods for addressing missing data from unusable and nonparticipating projects, including data on the number and demographics of people served. We also reviewed Abt’s programming code used to implemented these methods.
We assessed the sufficiency of Abt’s methods by evaluating them against practices recommended in the statistical literature on imputation theory.[56] For example, we ran simulations by applying different imputation methods to assess how those methods could affect the margins of error for HUD’s estimates. We also assessed the resources involved in testing these alternative methods.
Assessing How HUD Has Addressed Data Quality
To address our third objective, we interviewed HUD officials, agency staff, and staff at judgmentally selected CoCs, described above, about HUD’s efforts to address quality issues in CoCs’ data. We used semistructured interviews to ask representatives of all 14 CoCs about their experiences submitting LSA data, using HUD tools or guidance to improve the data, and any challenges they experienced with the submission process. We then conducted a content analysis to identify common themes across the interviews. We also reviewed tools HUD designed to help CoCs improve their data quality, such as HUD’s 2024 LSA Common Flags Library.[57] We also reviewed instructional documents about the Eva and Stella P tools, which we downloaded from HUD’s website.[58] In addition, we attended informational sessions about the tools at a national data conference for CoCs.
To assess the extent to which HUD addressed data quality issues, we reviewed HUD’s communications with CoCs about LSA data quality issues and assessed them against key practices on evidence-based policymaking that GAO previously identified.[59]
We conducted this performance audit from May 2024 to September 2025 in accordance with generally accepted government auditing standards. Those standards require that we plan and perform the audit to obtain sufficient, appropriate evidence to provide a reasonable basis for our findings and conclusions based on our audit objectives. We believe that the evidence obtained provides a reasonable basis for our findings and conclusions based on our audit objectives.
Once a year, Continuums of Care download aggregated versions of person-level data from their Homeless Management Information System and submit them to the Department of Housing and Urban Development (HUD) through an online submission system. These data, known as Longitudinal Systems Analysis data, are separated into 12 files that organize the information in different ways. Table 6 presents summarized descriptions of each LSA file, based on our review of HUD documentation.
|
File name |
Description |
|
LSAReport |
Contains information about the specific Homeless Management Information System (HMIS) that generated the LSA data. |
|
LSAHousehold |
Contains counts of households served by residential homelessness projects during the reporting period.a |
|
LSAPerson |
Contains counts of the people listed in the LSAHousehold file. The counts are grouped by demographic information, household characteristics, and system use during the reporting period. |
|
LSAExit |
Contains counts of households who exited from residential homelessness projects and remained inactive for at least 2 weeks after exit. |
|
LSACalculated |
Used to upload values such as averages and totals that cannot be calculated from the aggregated data in the LSAHousehold, LSAPerson, and LSAExit files. |
|
Organization |
Contains information on organizations operating one or more projects. |
|
Project |
Contains information on Continuum of Care (CoC) residential homelessness projects and associates each project with the specific type of services provided. |
|
Funder |
Contains information on the funding sources for each project active during the LSA reporting period. |
|
ProjectCoC |
Contains information that associates each project with one or more CoCs. |
|
Inventory |
Contains bed and unit inventory information for each residential homelessness project except Rapid Rehousing: Supportive Services Only projects. |
|
HMISParticipation |
Contains information on the participation status of all projects in HMIS or a comparable database. |
|
Affiliation |
Contains records for each Rapid Rehousing: Supportive Services Only project in the project file identified as having a residential affiliation. |
Source: GAO summary of Department of Housing and Urban Development information. | GAO‑26‑107502
aResidential homelessness projects include Emergency Shelters, Safe Havens, Transitional Housing, Rapid Re-Housing, and Permanent Supportive Housing.
GAO Contact
Alicia Puente Cackley, cackleya@gao.gov
Staff Acknowledgments
In addition to the contact named above, Lisa Moore (Assistant Director), Jeremy Anthony (Analyst in Charge), Gabrielle Crossnoe, Dawn Locke, Pearl Teiko, Farrah Stone, Dae Park, Lilia Chaidez, Alberto Lopez, Jennifer Schwartz, Marc Molino, Nicole Hewitt, and Niti Tandon made key contributions to this report.
The Government Accountability Office, the audit, evaluation, and investigative arm of Congress, exists to support Congress in meeting its constitutional responsibilities and to help improve the performance and accountability of the federal government for the American people. GAO examines the use of public funds; evaluates federal programs and policies; and provides analyses, recommendations, and other assistance to help Congress make informed oversight, policy, and funding decisions. GAO’s commitment to good government is reflected in its core values of accountability, integrity, and reliability.
Obtaining Copies of GAO Reports and Testimony
The fastest and easiest way to obtain copies of GAO documents at no cost is through our website. Each weekday afternoon, GAO posts on its website newly released reports, testimony, and correspondence. You can also subscribe to GAO’s email updates to receive notification of newly posted products.
Order by Phone
The price of each GAO publication reflects GAO’s actual cost of production and distribution and depends on the number of pages in the publication and whether the publication is printed in color or black and white. Pricing and ordering information is posted on GAO’s website, https://www.gao.gov/ordering.htm.
Place orders by calling (202) 512-6000, toll free (866) 801-7077,
or
TDD (202) 512-2537.
Orders may be paid for using American Express, Discover Card, MasterCard, Visa, check, or money order. Call for additional information.
Connect with GAO
Connect with GAO on X,
LinkedIn, Instagram, and YouTube.
Subscribe to our Email Updates. Listen to our Podcasts.
Visit GAO on the web at https://www.gao.gov.
To Report Fraud, Waste, and Abuse in Federal Programs
Contact FraudNet:
Website: https://www.gao.gov/about/what-gao-does/fraudnet
Automated answering system: (800) 424-5454
Media Relations
Sarah Kaczmarek, Managing Director, Media@gao.gov
Congressional Relations
A. Nicole Clowers, Managing Director, CongRel@gao.gov
General Inquiries
[1]Department of Housing and Urban Development, 2024 Annual Homelessness Assessment Report to Congress, Part 1: Point-in-Time Estimates of Homelessness (Washington, D.C.: December 2024).
[2]For additional information, see GAO, Homelessness: HUD Should Help Communities Better Leverage Data to Estimate Homelessness, GAO‑22‑104445 (Washington, D.C.: Nov. 22, 2021).
[3]GAO, Evidence-Based Policymaking: Practices to Help Manage and Assess the Results of Federal Efforts, GAO‑23‑105460 (Washington, D.C.: July 2023), 36.
[4]CoCs can have different governance structures, but HUD requires CoCs to designate a lead agency—referred to as a collaborative applicant—to apply for funds on behalf of the CoC.
[5]HUD uses the categories “major city,” “other largely urban,” “largely suburban,” and “largely rural.” For the purposes of this report, we refer to these CoC types as major city, other urban, suburban, and rural, respectively.
[6]CoCs are generally required to match at least 25 percent of expended CoC program funds, with some exceptions. Pub. L. No. 111-22, div. B., tit. III, § 1305(3), 123 Stat. 1695 (codified at 42 U.S.C. § 11386d). See also 24 C.F.R. § 578.73.
[7]The collaborative applicant submits an application for CoC-operations funding, as well as individual applications for project funding for local service providers. Collaborative applicants also may receive project funding if they provide eligible services.
[8]An Emergency Shelter is a facility with the primary purpose of providing temporary shelter for people experiencing homelessness that does not require occupants to sign leases or occupancy agreements. Transitional Housing refers to programs that provide people experiencing homelessness a place to stay combined with supportive services for up to 24 months. Safe Havens provide private or semiprivate long-term housing for people with severe mental illness, and they are limited to serving no more than 25 people within a facility. Rapid Re-Housing is a housing model designed to provide temporary housing assistance to people experiencing homelessness, moving them quickly out of homelessness and into permanent housing. Permanent Supportive Housing is a program designed to provide long-term housing assistance and supportive services to people with a disability.
[9]24 C.F.R. § 578.7(b).
[10]Department of Housing and Urban Development, FY 2024 HMIS Data Standards Manual (Washington, D.C.: February 2024).
[11]Organizations that are victim service providers and recipients or subrecipients under the CoC program may not directly enter client data into HMIS. A victim service provider is a private nonprofit organization whose primary mission is to provide services to victims of domestic violence, dating violence, sexual assault, or stalking. 42 U.S.C. § 11360(34). To protect clients, victim service providers must enter required client-level data into a comparable database that complies with HMIS requirements. See 42 U.S.C. § 11363.
[12]Some programs for homeless veterans and homeless youth, administered by the Department of Veterans Affairs and the Department of Health and Human Services respectively, also require HMIS participation. Additionally, HUD officials noted that in some cases, other non-federal funders of homelessness services require data to be entered in HMIS.
[13]The Full-Year Continuing Appropriations and Extensions Act, 2025 provided funds for the Department of Housing and Urban Development at the fiscal year 2024 level, with some exceptions. See Pub. L. No. 119-4, div. A, tit. I, § 1101(a)(12), 139 Stat. 9, 12; also see Pub. L. No. 118-4, Div. F, tit. II, 138 Stat. 25, 363 for fiscal year 2024 appropriations. This act also contains a provision stating that “[a]ppropriations made available by section 1101 shall be available to the extent and in the manner that would be provided by the pertinent Act.” Pub. L. No. 119-4, div. A, tit. I, § 1102, 139 Stat. 9, 12.
[14]The AHAR Part 1 report for a given year is based on data collected in that year. For additional information on the Point-in-Time count and the Housing Inventory Count, see GAO, Homelessness: Better HUD Oversight of Data Collection Could Improve Estimates of Homeless Population, GAO‑20‑433 (Washington, D.C.: July 14, 2020).
[15]The AHAR Part 2 reports also include separate estimates of the use of Rapid Re-Housing and Permanent Supportive Housing, but the use of these services is not considered “sheltered homelessness” because service users have permanent housing.
[16]See Department of Housing and Urban Development, 2007–2024 Housing Inventory Count by CoC (Washington, D.C.: December 2024). HUD officials also said that most service providers enter client data in HMIS.
[17]Department of Housing and Urban Development, CoC Program HMIS Manual (Washington, D.C.: July 2023). This manual is currently unavailable on HUD Exchange pending review to ensure that its content complies with executive orders and implementing guidance.
[18]Chronically homeless refers to an individual with a disability who has experienced homelessness continuously for 1 year or more or has experienced at least four episodes of homelessness in the last 3 years where the combined length of time homeless on those occasions is at least 12 months and each break in homelessness separating the episodes lasts at least 7 consecutive nights.
[19]We analyzed the flags that CoCs received on their final submission of LSA data. CoCs may have received other errors and warnings, made changes to the underlying HMIS data, and resubmitted their LSA files.
[20]Because HUD’s data on the flags CoCs received included only those triggered in each CoC’s final LSA submission, we did not analyze the number of errors CoCs addressed throughout the 2021 and 2022 submission periods or the number of LSA data submissions they made.
[21]HUD’s data on the flags CoCs received in 2021 and 2022 included multiple categories of flag status. We considered the category “Note Sufficient – data accurately reflect community” to indicate that a CoC’s comment resolved the flag. We considered all other statuses to indicate that the flag was not resolved.
[22]Abt uses a hierarchical classification to identify similar projects for imputation. If at least 30 projects with usable persons-per-bed data match all four criteria, Abt proceeds with imputation. If fewer than 30 matches are found, Abt relaxes the matching criteria, starting by removing the “beds above median” requirement, and continuing until a sufficient match group is identified. In 2022, 98 percent of projects requiring imputation were matched using all four criteria. For additional detail on this process, see Department of Housing and Urban Development, 2022 Annual Homelessness Assessment Report to Congress: Part 2 Methodology Report (Washington, D.C.: June 2024).
[23]Abt uses propensity stratification to identify similar CoCs. This process assigns a “propensity score” to each CoC on the basis of a statistical model that incorporates the characteristics described above. CoCs with similar propensity scores are then grouped together to create statistical weights. For additional details on this process, see Department of Housing and Urban Development, Part 2 Methodology Report.
[24]Department of Housing and Urban Development, Part 2 Methodology Report, 4.
[25]As discussed earlier, the three project types are Shelter Programs, Rapid Re-Housing, and Permanent Supportive Housing, and the three household types are Adult Only, Adult and Child, Child Only. Abt staff separately assess the data for each combination—for example, Adult Only Shelter Programs—so every CoC receives nine usability determinations.
[26]For CoCs with partially usable determinations, Abt replaces the CoC’s LSA data on beds with bed data from the CoC’s Housing Inventory Count. HUD also refers to the partially usable determination as “people data usable.”
[27]For our analysis of Abt’s usability determinations, we considered a CoC to have “some data usable” if it received a usable or partially usable determination for any of the nine categories.
[28]Department of Housing and Urban Development, An Introductory Guide to Submitting Longitudinal Systems Analysis (LSA) Data for the AHAR (Washington, D.C.: October 2023), 8–9, 13, 16, 18.
[29]See app. I for information on our sample selection.
[30]As discussed earlier, flags are unresolved if the CoC did not either correct its administrative data or explain that the flagged data are accurate.
[31]In this CoC’s data, the category of Adult Only households had a single unresolved flag about the number of beds available in those projects. However, the categories of Adult with Child and Child Only household types were also determined unusable, despite having no unresolved flags.
[32]Department of Housing and Urban Development, Guide to Submitting LSA Data, 18.
[33]Office of Management and Budget Guidelines for Ensuring and Maximizing the Quality, Objectivity, Utility, and Integrity of information Disseminated by Federal Agencies; Republication, 67 Fed. Reg. 8452 (Feb. 22, 2002). The Office of Management and Budget issued its guidelines in response to The Information Quality Act, section 515 of the Treasury and General Government Appropriations Act for Fiscal Year 2001. Consolidated Appropriations – Fiscal Year 2001, Pub. L. No. 106-554, § 515, 114 Stat. 2763A-153 to 2763A-154 (2000) (codified at 44 U.S.C. § 3516 note). In 2002, HUD issued its information quality guidelines to implement these standards: Department of Housing and Urban Development Final Information Quality Guidelines, 67 Fed. Reg. 69642 (Nov. 18, 2002).
[34]The impact of this reduction in variation increases with lower rates of usable data and decreases with higher rates of usable data, as HUD includes fewer imputed values.
[35]HUD reported the 2022 AHAR data in 2024. See Department of Housing and Urban Development, Part 2 Methodology Report, 21.
[36]See, for example, Roderick J. A. Little and Donald R. Rubin, Statistical Analysis with Missing Data, 1st ed. (Hoboken, N.J.: Wiley, 1987), 44; Mortaza Jamshidian and Matthew Mata, Handbook of Latent Variable and Related Models (North Holland, 2007), 21–44; and F. Arteaga and A.J. Ferrer-Riquelme, Comprehensive Chemometrics (Elsevier, 2009), 285–314.
[37]Department of Housing and Urban Development, Part 2 Methodology Report, 11.
[38]HUD publishes guidance on the HUD Exchange website (https://www.hudexchange.info/resources/). Some guidance is intended for technical staff, such as HMIS vendors, while other guidance is intended for CoC administrative staff.
[39]Department of Housing and Urban Development, Eva – Quick Start Guide Version 2.0 (Washington. D.C.: October 2024), https://www.hudexchange.info/resource/6786/hmis‑eva/.
[40]The data that CoCs upload to Eva can only be viewed by the person using the tool and are not saved in the system. HUD officials said that HUD cannot access these client-level data.
[41]Department of Housing and Urban Development, SNAPS Office Hours (Sept. 5, 2024), https://www.hud.gov/sites/dfiles/CPD/documents/Slides‑SNAPS_Office_Hours‑9‑5‑2024.pdf.
[42]Department of Housing and Urban Development, “LSA Common Flags Library,” https://www.hudexchange.info/resource/6556/lsa‑common‑flags‑library/.
[43]Prior to 2023, HUD did not tell CoCs whether their LSA data were usable for HUD’s estimates. HUD officials said they did not communicate this information because the process was still new, and they anticipated many CoCs would submit unusable data.
[45]The Homeless Emergency Assistance and Rapid Transition to Housing Act of 2009 (HEARTH Act) amended the McKinney-Vento Homeless Assistance Act to establish the Continuum of Care program. Pub. L. No. 111-22, div. B., tit. 3, §§ 1301 – 1306, 123 Stat. 1680 (codified at 42 U.S.C. §§ 11381 – 11389). HUD’s implementing regulations are at 24 C.F.R. Part 578. Congress first appropriated funds for technical assistance and a management information system for housing and homelessness grant programs for fiscal year 2001. See Pub. L. No. 106-377, tit. II 114 Stat. 1441, 1441A-18.
[46]Department of Housing and Urban Development, Annual Homeless Assessment Report to Congress (Washington, D.C.: February 2007); 2018 Annual Homeless Assessment Report to Congress: Part 2 (Washington, D.C.: September 2020); 2021 Annual Homelessness Assessment Report to Congress: Part 2 (Washington, D.C.: July 2023); 2022 Annual Homelessness Assessment Report to Congress: Part 2 (Washington, D.C.: May 2024); and 2022 Annual Homelessness Assessment Report to Congress: Part 2 Methodology Report (Washington, D.C.: June 2024). All AHAR reports and supporting documents are available at https://www.huduser.gov/portal/datasets/ahar.html.
[47]In July 2025, HUD officials said they expected to publish the 2023 AHAR Part 2 later in 2025.
[48]Department of Housing and Urban Development, An Introductory Guide to Submitting Longitudinal Systems Analysis (LSA) Data for the AHAR (Washington, D.C.: October 2023); From AHAR to LSA: Understanding the FY18 Changes (Washington, D.C.: October 2018); and Preparing for the LSA: Guidance on Common Data Quality Issues (Washington, D.C.: November 2023).
[49]Department of Housing and Urban Development, HMIS Data Standards Manual (Washington, D.C.: February 2024); The Longitudinal System Analysis FY 2023 HMIS Programming Specifications (Washington, D.C.: August 2023); and Guide to Submitting LSA Data .
[50]We reviewed HUD LSA data quality flag data for missing values, inconsistencies, or illogical patterns, and determined the data were reliable for summarizing trends in data quality issues.
[51]Abt makes usability determinations for each CoC by reviewing the quality of the data that CoCs submit to HUD for the AHAR across nine project-household types. Abt determines each CoC’s data to be usable, partially usable, or not usable. For the purposes of this report, we considered partially usable data to be usable.
[52]For our analysis, we considered a CoC to have “all data usable” if all nine categories were determined to be usable, “some data usable” if at least one category was usable or partially usable and at least one was not usable, and “no data usable” if all nine categories were determined not to be usable.
[53]We used HUD’s CoC Analysis Tool because CoCs can vary in size and geography and are not included in measures of population published by the Census Bureau. HUD’s CoC Analysis Tool: Race and Ethnicity (version 4) summarizes population data from the American Community Survey 2017–2021 5-year estimates for all CoCs. We accessed this tool on HUD’s website in October 2024.
[54]Department of Housing and Urban Development, “FY21 CoC Program Competition,” https://www.hud.gov/program_offices/comm_planning/coc/fy21‑coc‑program‑competition, accessed Sept. 26, 2024.
[55]Office of Management and Budget’s Guidelines for Ensuring and Maximizing the Quality, Objectivity, Utility, and Integrity of information Disseminated by Federal Agencies; Republication, 67 Fed. Reg. 8452 (Feb. 22, 2002)
[56]See, for example, Roderick J. A. Little and Donald R. Rubin, Statistical Analysis with Missing Data, 1st ed. (Hoboken, N.J.: Wiley, 1987), 44; Mortaza Jamshidian and Matthew Mata, Handbook of Latent Variable and Related Models (North Holland, 2007), 21–44; and F. Arteaga and A.J. Ferrer-Riquelme, Comprehensive Chemometrics (Elsevier, 2009), 285–314.
[57]Department of Housing and Urban Development, LSA Common Flags Library (Washington, D.C.: October 2024), https://files.hudexchange.info/resources/documents/LSA‑Common‑Flags‑Library.xlsx.
[58]The Eva tool identifies potential data quality issues in CoCs’ data. The Stella P tool generates visualizations from a CoC’s data. Department of Housing and Urban Development, Eva Quick Start Guide – Overview Version 2.0 (Washington, D.C.: October 2024), https://files.hudexchange.info/resources/documents/HMIS‑Eva‑Quick‑Start‑Guide.pdf; Eva Quick Start Guide – Upload HMIS Data Version 1.0, (Washington, D.C.: February 2024) https://files.hudexchange.info/resources/documents/HMIS-Eva-Quick-Start-Guide-Upload-HMIS-Data.pdf; Eva Quick Start Guide – View Client Counts Version 1.0, (Washington, D.C.: February 2024) https://files.hudexchange.info/resources/documents/HMIS‑Eva‑Quick‑Start‑Guide‑View‑Client‑Counts.pdf; Stella P Quick Start Guide Version 3.0, (Washington, D.C.: March 2023) https://files.hudexchange.info/resources/documents/Stella‑P‑Quick‑Start‑Guide.pdf, accessed June 6, 2024; and Stella P Glossary of Terms, (Washington, D.C.: December 2023) https://files.hudexchange.info/resources/documents/Stella‑Performance‑Glossary‑2024.pdf, accessed June 6, 2024.
[59]GAO, Evidence-Based Policymaking: Practices to Help Manage and Assess the Results of Federal Efforts, GAO‑23‑105460 (Washington, D.C.: July 2023).