Report to the Chair, Subcommittee on Oversight, Committee on Ways and Means, House of Representatives
United States Government Accountability Office
A report to the Chair of the Subcommittee on Oversight, Committee on Ways and Means, House of Representatives
For more information, contact: James R. McTigue, Jr. at mctiguej@gao.gov
What GAO Found
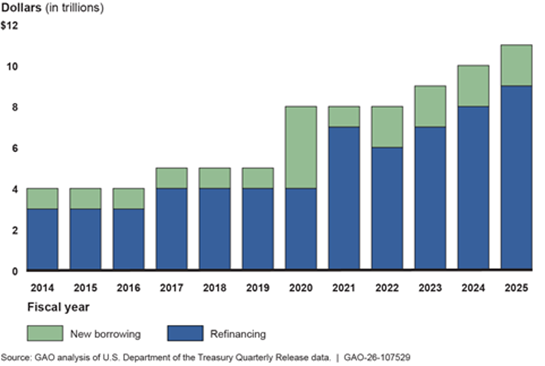
Since fiscal year 2014, the Department of the Treasury has increased the size and frequency of its debt auctions to finance persistent government deficits and refinance existing debt. In fiscal year 2025, Treasury held 444 auctions of bills, notes, and bonds to borrow $1.9 trillion for government operations and refinance $9.1 trillion of maturing debt. Treasury issues debt on a regular and predictable schedule to minimize investor uncertanity. It also uses other strategies to help keep borrowing costs lower than they might otherwise be.
Treasury auctions continue to attract sufficient demand from a variety of investors. As of September 30, 2025, domestic investment funds—such as money market funds, mutual funds, and hedge funds—were the largest buyers at auctions, followed by broker-dealers and foreign investors.
Treasury’s debt management practices alone cannot address important risks that could reduce investor demand for Treasury securities and raise government borrowing costs. In some cases, Congress would need to take action to address the underlying causes of these risks.
· Unsustainable federal debt levels could cause investors to demand higher interest rates to compensate for increased risk—adding to growing federal interest costs.
· Debt limit impasses increase the risk of a government default, which would diminish the perception of Treasury securities as safe assets.
· A potential diminished international role for the U.S. dollar would weaken demand for Treasury securities among foreign investors that hold dollars as reserves, use them for global trade, or use them for other financial transactions.
Why GAO Did This Study
As of February 2026, debt held by the public was over $31 trillion. The Congressional Budget Office projects that federal deficits will average over $2 trillion annually through 2036, further adding to U.S. debt.
To finance federal borrowing, Treasury must sell large amounts of Treasury securities at auction. The interest rates that investors are willing to accept at these auctions determines the government’s borrowing costs. Thus, Treasury’s issuance decisions and auction results are important to monitor as Treasury seeks to borrow at the lowest cost over time.
GAO was asked to review Treasury’s debt management practices. This report describes debt management challenges and assesses Treasury’s strategies to manage them, describes changes in debt composition, auctions, and investor demand from fiscal years 2014 through 2025, and describes other debt management risks facing Treasury.
GAO analyzed Treasury data, reviewed Treasury documents and market analyses, and interviewed Treasury officials and market participants.
What GAO Recommends
GAO has previously recommended that Congress (1) have a strategy to address the nation’s unsustainable fiscal path (GAO-20-561) and (2) replace the current debt limit process with an approach that clearly links decisions on debt to decisions on revenue and spending (GAO-15-476).
Addressing these risks would help ensure the continued broad-based demand for Treasury securities and support Treasury’s goal of financing the government at the lowest cost over time. As of February 2026, Congress has not yet taken the recommended actions.
|
Abbreviations |
|
|
|
|
|
|
|
Federal Reserve |
The Federal Reserve System |
|
|
FINRA |
Financial Industry Regulatory Authority, Inc. |
|
|
FRN |
floating rate note |
|
|
GDP |
gross domestic product |
|
|
IAWG |
Inter-Agency Working Group for Treasury Market Surveillance |
|
|
SOFR |
Secured Overnight Financing Rate |
|
|
TBAC |
Treasury Borrowing Advisory Committee |
|
|
TIPS |
Treasury Inflation Protected Securities |
|
This is a work of the U.S. government and is not subject to copyright protection in the United States. The published product may be reproduced and distributed in its entirety without further permission from GAO. However, because this work may contain copyrighted images or other material, permission from the copyright holder may be necessary if you wish to reproduce this material separately.
March 31, 2026
The Honorable David Schweikert
Chairman
Subcommittee on Oversight
Committee on Ways and Means
House of Representatives
Dear Mr. Chairman,
In recent years, publicly held federal debt has been growing by more than $1 trillion annually and was over $31 trillion as of February 2026. The increase in debt is a result of the government’s borrowing to finance large annual budget deficits and pay growing interest costs.
Fiscal policy as set by the President and Congress determines how much the government needs to borrow, while the Department of the Treasury is responsible for financing that borrowing. To that end, Treasury holds hundreds of auctions each year to sell Treasury securities—bills, notes, and bonds—to U.S. and foreign investors.
Treasury aims to finance the federal government’s borrowing at the lowest cost over time. The government’s borrowing costs are determined by the interest rates that investors are willing to accept to purchase Treasury securities at auction. These interest rates also influence the interest rates paid by U.S. individuals, households, and businesses on other debts like federal student loans, car loans, business loans, and mortgages.
The Congressional Budget Office projects that under current laws, federal deficits would remain large by historical standards and increase over the next decade. The agency projects a budget deficit of 1.9 trillion in fiscal year 2026 and average annual deficits of $2.4 trillion from fiscal years 2027 to 2036.[1] As a result, Treasury will need to issue substantially more debt each year to finance government operations and refinance maturing debt. Against this backdrop, Treasury’s debt management decisions and its auction results are important for policymakers to monitor as Treasury seeks to maintain strong demand for U.S. government securities from a diverse investor base and finance rising borrowing needs at the lowest cost over time.
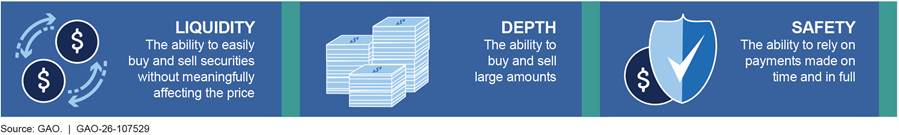
Historically, investors have accepted low interest rates on Treasury securities because they can easily and efficiently be converted into cash (liquidity), be bought and sold in large amounts (depth), and carry little risk of default (safety). These low interest rates have helped Treasury minimize borrowing costs even as debt continued to rise. However, if market conditions change or policies erode the desirability of Treasury securities, investors may require higher interest rates to buy Treasury securities. Elevated interest rates combined with large deficits would add to the government’s interest costs, which were larger than $970 billion in fiscal year 2025.[2] These annual interest costs exceeded spending for some of the largest federal programs and areas, including national defense.
You asked us to examine Treasury’s debt management practices in light of changing economic and fiscal conditions. This report describes (1) debt management challenges and assesses Treasury’s strategies to address them; (2) how the composition of federal debt outstanding has changed from fiscal years 2014 through 2025; (3) how the size, frequency, and types of securities offered at Treasury auctions have changed from fiscal years 2014 through 2025; (4) how investor demand for Treasury auctions has changed from fiscal years 2014 through 2025; and (5) existing and emerging risks that Treasury faces in managing federal debt.
To identify current debt management challenges that Treasury faces and the strategies that Treasury uses to manage these challenges, we reviewed Treasury documents such as an overview of the Office of Debt Management, which is responsible for developing policy related to government financing, and quarterly debt management policy statements. We also reviewed reports on the Treasury market by the Inter-Agency Working Group for Treasury Market Surveillance, which includes Treasury and other federal agencies. In addition, we reviewed public remarks by senior Treasury officials outlining Treasury’s current debt management practices. We also interviewed officials from Treasury’s Office of Debt Management. We assessed the extent to which Treasury’s debt management strategies and practices are consistent with World Bank and International Monetary Fund guidelines for effective sovereign debt management.[3] These guidelines aim to strengthen sovereign debt management practices and operations and are geared toward helping debt managers raise required funding at the lowest possible cost within a given risk tolerance.
To describe changes in the composition of federal debt outstanding and Treasury auctions, we analyzed Treasury statistics on the debt portfolio, including the amounts of different security types outstanding, the average length to maturity, and data on the size, frequency, and types of securities sold at auction from fiscal years 2014 through 2025. We selected this period to examine longer-range trends in Treasury issuance and auctions covering more than 10 fiscal years’ worth of data. This period also allowed us to capture a variety of economic and interest rate environments in which Treasury issued debt.
To describe how investor demand for Treasury auctions has changed, we analyzed common measures of auction performance monitored by Treasury officials and market analysts from fiscal years 2014 through 2025. These included: (1) auction bid-to-cover ratios—an indicator of market demand for an auction calculated as the amount of investor bids received divided by the amount of securities offered; (2) the share of auctions bought by primary dealers— firms designated as trading counterparties of the Federal Reserve Bank of New York that are expected to bid at all Treasury auctions; and (3) changes in the amount and share of auctions bought by certain categories of investor such as investment funds, foreign investors, banks, and pension funds. In addition to analyzing Treasury auctions, we also analyzed indicators of investor demand from the Treasury secondary market, where Treasury securities can be bought and sold after they are issued, using data from Bloomberg and the Board of Governors of the Federal Reserve System. As part of this, we analyzed changes in the holdings of Treasury securities of different investor categories (see appendix I for more details).
To further explore trends in market demand and capacity for Treasury auctions in light of persistent federal deficits, we conducted a regression analysis to identify any statistical relationship between auction sizes and bid-to-cover ratios for auctions held from fiscal years 2014 through 2025 (see appendix II for more details).
To identify existing and emerging risks to Treasury debt management activities, we used several methods.
· Reviewed analyses from the Treasury Borrowing Advisory Committee (TBAC)—a federal advisory committee comprised of various private market participants that meets quarterly with Treasury and provides recommendations on debt management issues—and research from the Federal Reserve System (Federal Reserve).[4]
· Reviewed other selected research and market analyses that addressed risks to Treasury auctions, investor demand, and market functioning. We identified these publications through keyword searches and alerts from various think tanks and research organizations that we track as part of our ongoing efforts to monitor developments in the Treasury market. We also conducted keyword searches of research databases such as ProQuest, SCOPUS, EBSCO, and Harvard Think Tank between 2020 and 2025.
· Interviewed Treasury debt management officials and representatives from four of the 26 current primary dealers. We interviewed primary dealers because they routinely provide input to Treasury on debt management issues, are expected to participate in all Treasury auctions, and are expected to maintain a certain share of trading activity in the Treasury secondary market. One of the firms we interviewed also invited representatives from its asset management affiliate to provide additional perspectives. The views expressed in these interviews are not generalizable to all market participants.
· Reviewed our prior findings and recommendations that pertain to the Treasury market and debt management, including risks to investor demand for Treasury securities and Treasury market functioning.[5]
To assess the reliability of the data used in this report, we reviewed related documentation and, where possible, corroborated the results of our analyses with other sources, such as TBAC analyses. We used data sets that are commonly used by Treasury, researchers, and market analysts, such as Treasury Securities Auctions data, Treasury’s Quarterly Release Data, Treasury Monthly Statement of the Public Debt, and Treasury Investor Class Auction Allotments. We also accessed asset prices from the Bloomberg Terminal, a computer software system provided by the financial data vendor, Bloomberg L.P., which contains real-time financial market data. Based on our assessment, we determined the data are sufficiently reliable for the purposes of describing changes in the composition of debt outstanding, Treasury auctions, and trends in auction results.
We conducted this performance audit from April 2024 to March 2026 in accordance with generally accepted government auditing standards. Those standards require that we plan and perform the audit to obtain sufficient, appropriate evidence to provide a reasonable basis for our findings and conclusions based on our audit objectives. We believe that the evidence obtained provides a reasonable basis for our findings and conclusions based on our audit objectives.
Background
Financing the U.S. Government
Treasury borrows money by issuing Treasury securities to finance the federal deficit (i.e., the difference between current spending and revenues), which includes paying interest on outstanding debt, and refinancing maturing debt. According to Treasury documents and officials, the primary objective of its debt management strategy is to finance the government’s borrowing needs at the lowest cost over time.
To this end, Treasury regularly sells securities of different types and maturities to investors at auction (see table 1 and text box).[6]
|
Security type |
Maturities |
Auction frequency |
|
Treasury bills Short-term securities that mature in 1 year or less. Bills are sold at a discount or at par (face value). When the bill matures, the investor is paid its face value. The difference between the face value and the discounted price the investor pays is the “interest.” |
4-week, 6-week, 8-week, 13-week, 17-week, 26-week |
Weekly |
|
52-week |
Every 4 weeks |
|
|
Treasury also periodically sells cash management bills of variable maturities (ranging from a few days up to 1 year) to manage short-term financing needs. |
Not auctioned according to a schedule |
|
|
Treasury notes Medium-term securities with a maturity of at least 1 year but not more than 10 years. Notes pay a fixed rate of interest every 6 months until they mature. |
2-year, 3-year, 5-year, 7-year |
Monthly |
|
10-year |
Auctioned in Feb., May, Aug., and Nov. Reopenings in the other 8 months (i.e., Mar., Apr., June, July, Sept., Oct., Dec., and Jan.) a |
|
|
Treasury bonds Longer-term securities with maturities of over 10 years. Bonds pay a fixed rate of interest every 6 months until they mature. |
20-year, 30-year |
Auctioned in Feb., May, Aug., and Nov. Reopenings in the other 8 months. |
|
Floating rate notes (FRN) Securities that pay interest quarterly at an interest rate that may rise and fall over time. The interest rate of an FRN is the sum of an index rate (the discount rate of the most recently auctioned 13-week Treasury bill), and a fixed spread that is applied to the index rate (which is set at the initial FRN auction). |
2-year |
Auctioned in Jan., Apr., July, and Oct. Reopenings in the other 8 months. |
|
Treasury Inflation Protected Securities (TIPS) Securities that repay principal adjusted for inflation at maturity or the original principal, whichever is greater. TIPS pay a fixed rate of interest every 6 months until they mature. Because Treasury pays interest on the adjusted principal, the amount of interest payment also varies. |
5-year |
Auctioned in Apr. and Oct. Reopenings in June and Dec. |
|
10-year |
Auctioned in Jan. and July. Reopenings in Mar., May, Sept., and Nov. |
|
|
30-year |
Auctioned in Feb. Reopened in Aug. |
Source: GAO analysis of Treasury information. | GAO‑26‑107529
aIn a reopening auction, Treasury sells additional amounts of a previously issued security. The reopened security has the same maturity date and interest rate or spread as the original security, but with a different issue date and usually a different purchase price.
|
Overview of the Treasury Auction Process Pre-auction 1. Each calendar quarter, Treasury provides a tentative auction schedule for the next 6 months and publishes it on its website. 2. Treasury publicly announces each auction several days before it occurs and provides information on the type and quantity of securities being auctioned, the auction date, and other items. Auction All Treasury auctions are open to the public, including to domestic, foreign, institutional, and individual investors. Investors can participate directly with Treasury or through an intermediary such as a bank, broker, or dealer. 3. At the auction, investors bid competitively or noncompetitively for the amount of securities they want. · Competitive bidders specify the interest rate (or yield) they are willing to accept on the securities. · Noncompetitive bidders agree to accept the interest rate determined at the auction (in fiscal year 2025, noncompetitive bids accounted for 2 percent of auction awards). 4. Treasury first accepts all noncompetitive bids. Then, Treasury accepts competitive bids based on their interest rate (from lowest to highest) until the entire auction offering amount has been awarded. All successful bidders get the same interest rate as the highest accepted bid. Post-auction 5. Several days after the auction, Treasury issues the securities to successful bidders and takes the money to pay for them from each buyer’s account. 6. Investors may keep the securities until they mature or sell them on the secondary market |
Source: GAO analysis of U.S. Department of the Treasury information. | GAO‑26‑107529
Treasury securities have different cost and risk features, which Treasury considers as it makes issuance decisions.
· Short-term securities (bills) are typically less costly to issue because buyers generally consider them to be low risk and are willing to accept lower interest rates to purchase them. Bills are considered low risk investments because their short maturities mean that their market value is less sensitive to changes in interest rates. However, Treasury must frequently refinance bills at prevailing market interest rates, leading to more variable interest costs.
· Medium and longer-term securities (like notes and bonds) typically cost Treasury and taxpayers more because buyers demand additional compensation—in the form of higher interest rates—for waiting longer for principal to be repaid and for accepting increased risk due to uncertainty about future market conditions and the future level of interest rates. However, for Treasury these securities offer more certainty for borrowing costs because they “lock in” interest rates for the duration of the security.
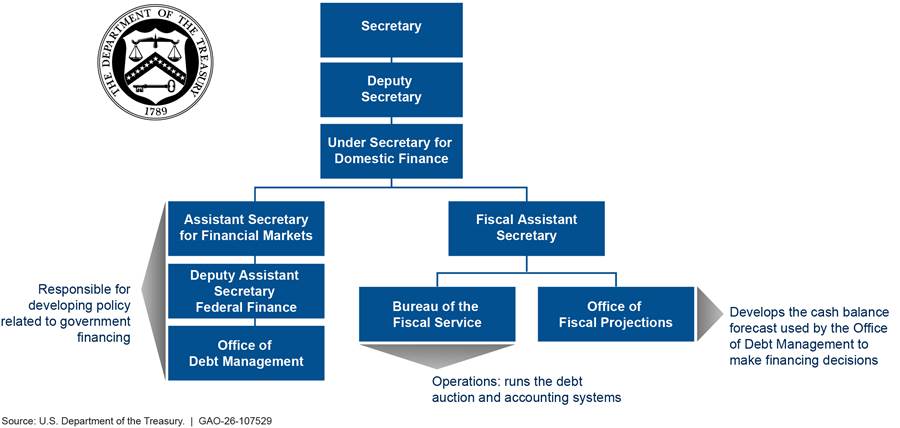
The Office of Debt Management, under Treasury’s Deputy Assistant Secretary for Federal Finance, is responsible for providing the Assistant Secretary for Financial Markets with advice and analysis on Treasury’s debt management policy, the issuance and buyback of Treasury securities, and related financial markets. The Office of Debt Management works closely with Treasury’s Office of Fiscal Projections and the Bureau of Fiscal Service to finance the federal government. Federal Reserve Banks act as Treasury’s “fiscal agent” meaning that they receive the bids in Treasury auctions. (see fig. 1).
Treasury generally announces debt management policy decisions—such as what type of Treasury security to issue and in what quantity and frequency—during the quarterly refunding process.[7] Treasury typically announces auction changes near the middle of each calendar quarter, holds a press conference, and releases policy statements that outline expected borrowing needs and planned issuance for the next quarter.
Treasury publishes a tentative calendar for the following two quarters with the proposed auction dates. Anticipated note and bond auction sizes for the upcoming quarter are published in a Treasury press release. Treasury also publishes summaries of key auction and investor measures and information from the TBAC and primary dealers.
|
Treasury Borrowing Advisory Committee A federal advisory committee that meets quarterly with Treasury to discuss economic forecasts, federal borrowing needs, debt management issues, and market dynamics. As of December 2025, the committee includes senior officials from banks, broker-dealers, asset managers, hedge funds, and insurance companies. Source: Treasury. | GAO‑26‑107529 |
|
|
Primary Dealers A primary dealer is a bank or securities firm designated as a trading counterparty of the Federal Reserve Bank of New York. Primary dealers are expected to consistently participate in any purchase or sale operations of Treasury securities conducted by the Federal Reserve Bank of New York. They are also expected to bid for their pro rata (proportional) share in all Treasury securities auctions at reasonably competitive prices. As of January 2026, there were 26 primary dealers Source: Federal Reserve Bank of New York. | GAO‑26‑107529 |
|
Key Characteristics of Treasury Securities
The Treasury securities market is considered the deepest, most liquid fixed-income market in the world and investors consider Treasury securities to be among the world’s safest assets (see fig. 2). This combination of depth, liquidity, and safety has supported reliable demand from different types of investors through changing market conditions. Many investors have historically accepted low yields, or interest rates, on Treasury securities because of these characteristics, which in turn has helped Treasury meet its goal of borrowing at the lowest cost over time.
|
Reserve Currency The U.S. dollar is the dominant reserve currency—that is, the currency used by foreign central banks in their official foreign exchange reserves. A reserve currency is widely used to conduct international trade and financial transactions, eliminating the costs of settling transactions involving different currencies. Source: GAO. | GAO‑26‑107529 |
In addition, the status of the dollar as the dominant global reserve currency has supported investor demand for Treasury securities, since they are denominated in U.S. dollars. The dollar is used for half of international trade invoicing, denominates half of international debt, and is used in nearly 90 percent of transactions in foreign exchange markets.[8]
Interest Costs on Treasury Securities and the U.S. Fiscal Outlook
The federal government is on an unsustainable long-term fiscal path because of a structural imbalance between revenue and spending.[9] The borrowing needed to finance these deficits has led to debt held by the public growing at a faster rate than the economy. It also increases interest costs. With a large amount of debt outstanding, moderate increases in interest rates can lead to significantly higher interest costs and accelerate a worsening fiscal situation.
Interest cost is a key measure of debt affordability and fiscal sustainability. Comparing interest costs to gross domestic product (GDP) helps relate these costs to the size of the economy supporting them. As of September 2025, net interest (primarily interest on debt held by the public) was over $970 billion (3.2 percent of GDP), compared to $229 billion in fiscal year 2014 (1.3 percent of GDP).[10] Our February 2025 projections estimated that the government’s interest costs will grow faster than the economy if projected growing deficits are not addressed, resulting in the accumulation of more debt. (see fig. 3).
Figure 3: Actual and Projected Net Interest Cost as a Share of Gross Domestic Product for Fiscal Years 1962 to 2053, as of February 2025
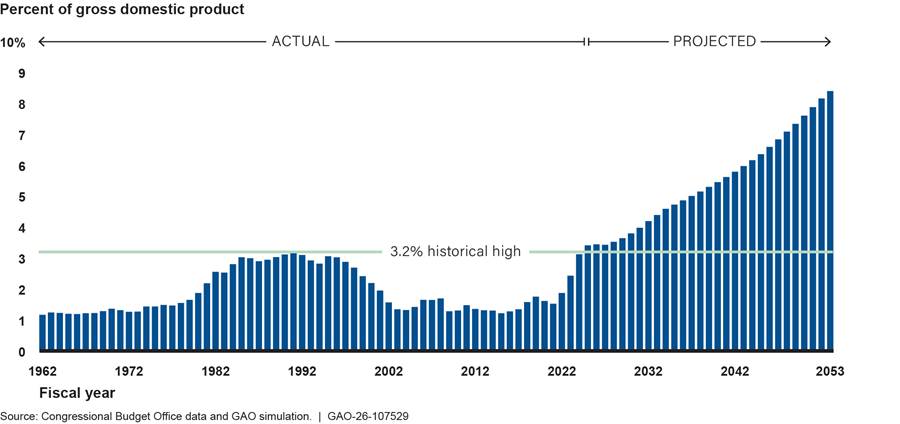
Note: This model output is based on Congressional Budget Office data released in December 2024.
Growing interest costs put U.S. fiscal sustainability at risk and could impair the government’s ability to respond effectively to a recession or fiscal shocks. For example, as an increasing share of revenue is used to pay growing interest costs, it leaves less money for the government to save or use to respond to an emergency, such as a public health crisis, military conflict, or natural disaster.
Treasury’s Debt Management Strategies Enable It to Manage Challenges Such as Uncertain Borrowing Needs
Treasury faces several challenges that could affect its debt management goal to finance borrowing at the lowest cost over time. Treasury documents and Treasury officials we interviewed identified the following challenges:
· uncertain borrowing needs,
· rising borrowing and refinancing needs,
· maintaining investor demand for Treasury securities, and
· disruptions to Treasury market liquidity
Our review of Treasury documents and interviews with Treasury officials and selected market participants found that Treasury has debt management strategies in place to address these challenges and help manage their associated risks. These strategies include analyzing a range of fiscal forecasts, issuing a variety of securities in a regular and predictable manner, and monitoring secondary market activity.
We found that Treasury’s strategies are consistent with World Bank and International Monetary Fund guidelines on good public debt management.[11] For example, the guidelines say that government debt managers should (1) be transparent and predictable in their borrowing operations, (2) strive to achieve a broad investor base, (3) promote close and continuing dialogue with investors, and (4) develop an efficient secondary market for government securities.
Treasury officials also emphasized that delays in raising the statutory debt limit are a major debt management challenge because they disrupt normal borrowing operations and pose serious risks to the Treasury market.[12] As we will discuss later in this report, Treasury has limited ability to address this risk because only Congress has the authority to set and adjust the statutory debt limit. Treasury officials said communicating with Congress to take timely action to raise or suspend the debt limit is their only available strategy to manage this risk. Treasury has typically sent letters to Congress urging action.[13]
Uncertain Borrowing Needs
According to Treasury officials, the government’s borrowing needs can be difficult to estimate ahead of time due to several factors that affect revenue and spending. These include changes in future economic conditions, changes in monetary policy, and potential legislation affecting revenue and spending. By extension, these factors make it difficult to decide how much debt Treasury must issue to finance those borrowing needs.
To address this challenge, Treasury gathers projections from a range of sources to help estimate short- and long-term borrowing needs and formulate issuance plans.
· To estimate shorter-term borrowing needs for the next several quarters, debt managers meet frequently with Treasury’s Office of Fiscal Projections to review their forecasts of fiscal flows and Treasury’s cash balance.
· To estimate longer-term borrowing needs, Treasury regularly reviews internal information and a range of external forecasts on the federal deficit, including those produced by the Congressional Budget Office, the Office of Management and Budget, and the primary dealers.
Treasury officials said they seek to maintain flexibility in their issuance plans to respond to uncertainties, like the potential need to rapidly raise cash. According to Treasury officials, borrowing in short-term Treasury bills provides more flexibility for unexpected obligations, such as funding to respond to a natural disaster or public health crisis. This is because investors can more easily adjust to significant variability in the supply of bills. In addition, Treasury has a policy to keep sufficient funds in the Treasury General Account—the government’s checking account—to meet one week’s worth of government obligations.[14]
Rising Borrowing and Refinancing Needs
Since fiscal year 2002, the government has spent more on programs and interest payments each year than it collected in revenue. These persistent budget deficits have grown larger in recent years. As a result, Treasury must finance increasingly large borrowing needs each year and refinance large amounts of maturing securities. Treasury officials described these as long-term challenges.
According to Treasury, the federal deficit in fiscal year 2025 was nearly $1.8 trillion.[15] According to Congressional Budget Office projections, annual deficits will average over $2 trillion from fiscal years 2026 through 2036, compared to averaging $1.4 trillion from fiscal years 2015 through 2024.[16] Further, in fiscal year 2026, Treasury will need to refinance $9.7 trillion of maturing securities.[17]
In recent years, rising interest rates have increased the cost of borrowing and refinancing debt. The average interest rate on marketable Treasury securities was 3.4 percent as of the end of fiscal year 2025, compared to 2 percent as of the end of fiscal year 2014. As of September 30, 2025, the market yield on the 10-year Treasury note, a widely used benchmark that signals the direction of Treasury’s longer-term financing costs, was about 4.2 percent.
Higher interest rates in combination with growing debt have led to significant increases in interest expense on debt held by the public, which were about $1 trillion in fiscal year 2025.[18]
According to Treasury officials, Treasury uses a regular and predictable issuance strategy to meet rising borrowing and refinancing needs and minimize the associated borrowing costs. Regular and predictable issuance is characterized by
· auctioning securities according to a consistent and preset schedule that is publicly announced in advance to market participants,
· making gradual adjustments to auction sizes for notes and bonds and using bills to meet rapid, seasonal, or unexpected changes in borrowing needs; and
· regularly gathering input from primary dealers, TBAC, and other market participants to aid in decision-making.
According to Treasury, these characteristics provide a framework for changing debt issuance in the least disruptive way possible, which minimizes risks to investors and translates into low borrowing costs over time.
Treasury regularly consults with primary dealers and TBAC to help inform decisions about the appropriate speed and size of any adjustments to its auctions. Treasury surveys primary dealers quarterly and meets with half of them in person on a rotating basis to obtain estimates on borrowing, issuance, and the federal deficit. Treasury also meets quarterly with TBAC to discuss economic forecasts, federal borrowing needs, debt management issues, and market dynamics.
Treasury does not alter its pre-announced issuance plans to try to take advantage of fluctuations in market interest rates or short-term shifts in demand. Treasury officials have said that drastically or suddenly changing issuance would introduce market volatility and create uncertainty for investors.[19] Investors might then demand higher interest rates to buy Treasury securities going forward, which would increase borrowing costs over the long term. Further, because Treasury publicly announces its borrowing plans in advance, any opportunities to time the market and capture savings would likely disappear as soon as Treasury announced its intentions, because market participants could react to Treasury’s announcement.
Maintaining Strong Investor Demand for Treasury Securities
Reduced demand for Treasury securities would likely raise Treasury’s borrowing costs. If investors were less interested in buying Treasury securities, auctions could attract fewer buyers and less competitive bids, which would require the securities to be sold at higher interest rates to compensate investors. We have reported that to support its goal to borrow at the lowest cost over time, Treasury must maintain strong demand from a broad group of investors for Treasury securities.[20]
Treasury takes several steps to support strong demand for its securities, such as by
· issuing different security types in a range of maturities to meet the varied financial needs of different investors;
· conducting market analysis and surveillance to assess if shifts in demand from different sectors are temporary or structural, and, if deemed structural, adjusting its issuance accordingly over time;
· issuing securities on a regular and predictable schedule, which facilitates investor planning and encourages broad auction participation; and
· promoting a well-functioning and liquid Treasury secondary market, which helps reinforce Treasury securities as an attractive option for U.S. and global investors.
Our analysis of auction results and participation by different sectors from fiscal year 2014 through 2025 indicates that the investor base for Treasury securities remains broad and diversified, as we discuss later in this report. In addition, our analysis of holdings in the secondary market shows Treasury securities are owned by a wide range of investors (see app. I). According to Treasury officials, a broad investor base promotes low borrowing costs because declines in demand from one group of investors can be offset by increases in demand from other investors. For example, as we show later in this report, investment funds have significantly increased their auction purchases as issuance of Treasury securities has grown, which has helped compensate for more moderate increases in purchases from other sectors, like foreign investors.
As part of its efforts to strengthen and broaden its investor base, Treasury may introduce new maturities of existing security types, or less frequently, add entirely new product types.[21] Treasury periodically studies potential new products that could help finance government borrowing at low cost. For example, in April 2024, Treasury asked TBAC to identify and assess potential new products that could expand the investor base in Treasury securities, minimize borrowing costs, enhance market liquidity, and better manage Treasury’s liability profile.[22] According to Treasury officials, Treasury must consider if a new product (1) could have stable long-term demand, (2) might adversely affect demand for existing products, and (3) could be issued in large enough amounts to meet the government’s borrowing needs and facilitate a liquid secondary market for the security. A potential new product that does not meet all these criteria risks raising Treasury’s borrowing costs. For example, interest rates on a new product could rise over time if there is insufficient long-term demand for the security.
Treasury Market Disruptions
Treasury’s borrowing costs can be affected by periods of disruption in the Treasury secondary market characterized by severely reduced liquidity. For example, disruptions can reduce investor demand for securities and cause buyers to demand higher interest rates when Treasury auctions securities again. Recent significant disruptions to the Treasury market occurred in 2020, 2019, and 2014. Some disruptions were caused by extreme market events, such as in March 2020 during COVID-19 when many investors rapidly sold Treasury notes and bonds for cash, whereas other disruptions occurred during calmer macroeconomic conditions.[23]
In response to these disruptions, Treasury officials highlighted several efforts to understand the drivers of market disruptions and strengthen the market against future disruptions. Many of these efforts are done in collaboration with the member agencies of the Inter-Agency Working Group for Treasury Market Surveillance (IAWG).[24]
· Starting in 2017, Treasury and other agencies gained access to more granular data on Treasury market trading activity reported to the Financial Industry Regulatory Authority, Inc. (FINRA), which improved Treasury’s ability to study and surveil the Treasury market.[25] Treasury helped coordinate enhancements to these data in 2024.[26]
· Since 2015, Treasury has co-hosted an annual Treasury market conference with the IAWG to examine ongoing developments in the U.S. Treasury market with representatives from IAWG member agencies, and the public and private sectors.[27]
· Since 2021, Treasury, along with the IAWG, has published several reports highlighting recent disruptions and potential reforms in the Treasury market, reporting on agencies’ progress in supporting certain objectives for the Treasury market and outlining policy areas where further consideration is ongoing.[28]
· In 2024, Treasury implemented a liquidity support buyback program that established regular and predictable opportunities for market participants to sell off-the-run securities (older securities that were issued before the most recent auction) back to Treasury.
TBAC has reported that Treasury and the IAWG’s actions have generally been supportive of market functioning and liquidity.
Treasury Has Increased Reliance on Short-Term Debt from Fiscal Years 2014 Through 2025
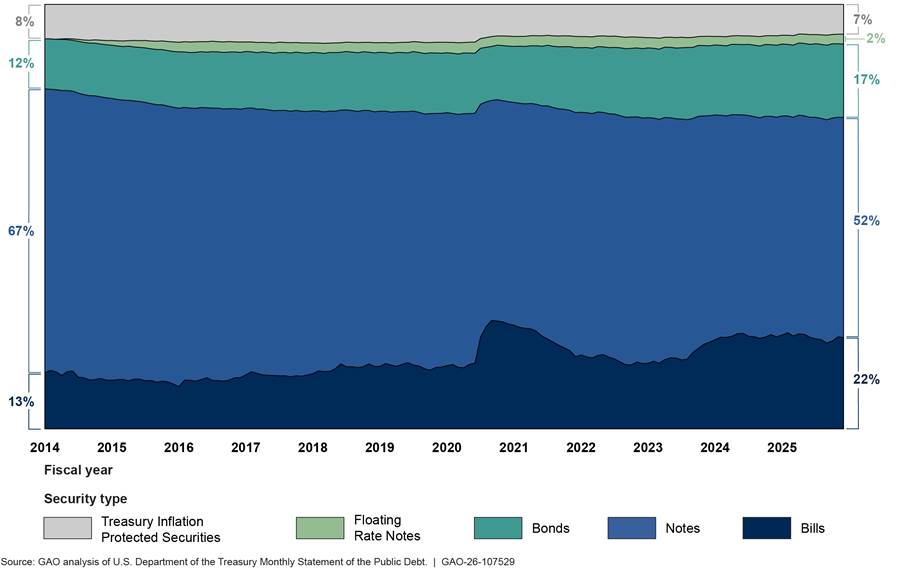
The mix of debt outstanding in short-, medium-, and long-term securities reflects Treasury’s borrowing decisions and influences the cost and risk in the federal debt portfolio. The composition of debt outstanding has shifted somewhat in response to fiscal conditions and investor demand. From fiscal years 2014 through 2025, the share of bills has increased by about 8 percentage points, while the share of bonds has increased by 5 percentage points. Analysis from TBAC suggests that this debt composition appropriately balances costs and risks—specifically, it helps keep interest costs low while minimizing rollover risk.
Changes in Fiscal Conditions and Investor Demand Have Prompted Shifts in Composition
From fiscal years 2014 through 2025, Treasury has adjusted its debt issuance mix and the composition of securities outstanding in response to changing fiscal conditions and shifts in investor demand.
As a result, the share of bills outstanding increased from 13 percent in fiscal year 2014 to about 22 percent in fiscal year 2025—compared to a long-term average of 20 percent of debt outstanding. The share of bonds increased from 12 percent to 17 percent. The share of notes declined, but notes still account for more than 50 percent of debt outstanding (see fig. 4).
Changing fiscal conditions including larger structural budget deficits and unexpected increases in borrowing needs have supported increased bill and bond financing.
· Treasury rapidly increased bill issuance during the COVID-19 pandemic to finance the government’s response to the crisis.[29] Treasury officials have said issuing bills is the most cost-effective and least disruptive way to quickly respond to large changes in borrowing needs due to their shorter maturities. For these reasons, Treasury often refers to bills as shock absorbers. We previously found that Treasury’s bill-driven financing strategy from April to June 2020 helped Treasury borrow trillions of dollars to fund the initial pandemic response quickly and at relatively low cost.[30] The share of bills subsequently declined as Treasury refinanced the maturing bills by issuing more medium and longer-term securities.
· In fiscal years 2023 and 2024, Treasury relied more on borrowing in bills while it gradually raised auction sizes of notes and bonds. According to Treasury officials, Treasury seeks to change note and bond auction sizes in a gradual and transparent manner to avoid disrupting the market, which in turn helps minimize borrowing costs. After raising note and bond auction sizes from August 2023 to April 2024, Treasury shifted more financing to these securities, and the share of bills outstanding stabilized in fiscal year 2025.
· Treasury reintroduced the 20-year bond in May 2020 as an option to help meet borrowing needs and began auctioning it to investors monthly. This contributed to an increase in bonds as a share of debt outstanding from fiscal years 2020 to 2025.
Strong demand for Treasury bills from money market funds has also supported increased bill issuance.
· Securities and Exchange Commission money market reforms that took effect in 2016 resulted in a significant increase in this sector’s holdings of Treasury securities.[31] Treasury officials described this as a structural change in investor demand.
· As of February 2026, money market fund investments were at an all-time high of $8.3 trillion.[32] Of these investments, more than 80 percent ($6.8 trillion) is invested in funds that hold only U.S. government securities or repurchase agreements (often called repo) backed by them.[33]
Rollover Risk from Short-Term Debt Is Balanced by Longer-Term Borrowing
Treasury faces more rollover risk now than in previous years because of a larger share of bills outstanding. Bills mature within a matter of weeks, so Treasury continually faces large redemptions of securities that must be rolled over by issuing new debt. Frequently needing to roll over large amounts of debt means that federal borrowing costs are more sensitive to fluctuations in market interest rates. For example, interest payments on U.S. debt may rise or fall as Treasury refinances maturing bills at the current market rates.
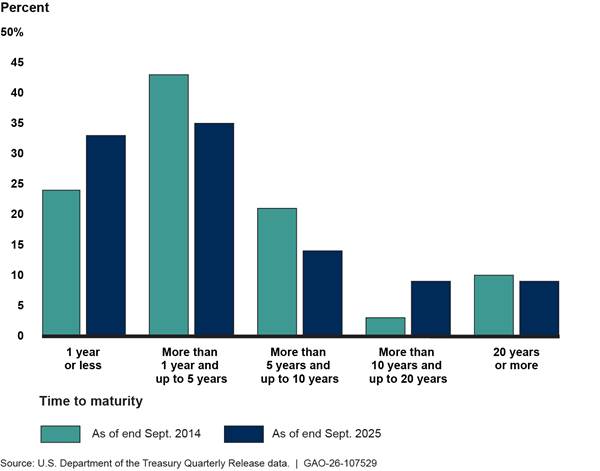
As of September 2025, about one-third of federal debt needed to be refinanced within 12 months, while another third did not need to be refinanced for at least 5 years. Specifically, 33 percent of debt outstanding was set to mature over the next 12 months, compared to 24 percent as of September 2014, largely due to changes in the share of bills outstanding. On the other hand, bonds’ share of debt outstanding has increased, and notes continue to comprise most of debt outstanding. Consequently, Treasury does not need to refinance 32 percent of federal debt at new interest rates for at least 5 years (see fig. 5).
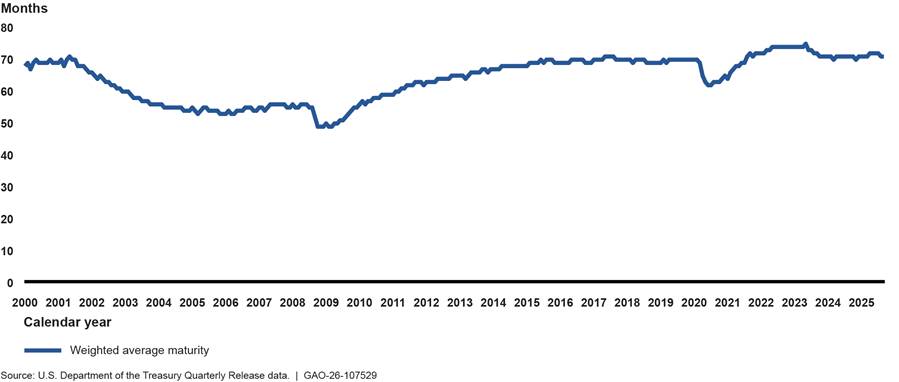
As a result of this debt composition, the weighted average maturity of marketable debt—the average maturity of all debt outstanding weighted by the current face value of that debt—is near historical highs. From October 2013 to September 2025, the weighted average maturity increased to 71 months (about 6 years) from 67 months (about 5.5 years) and is currently near its 26-year high (see fig. 6).
Recent TBAC analyses suggest that the current composition of Treasury’s debt portfolio appropriately balances cost and risk, meaning that Treasury is keeping interest costs low and managing rollover risk. However, its November 2025 analysis notes that Treasury faces a costlier debt issuance environment overall due to larger federal debt and higher interest rates demanded by investors compared to prior years.
· TBAC analysis from July 2024 concluded that a bill share averaging around 20 percent over time provides an appropriate trade-off between interest cost and rollover risk.[34] In August 2023 TBAC said it was comfortable with bills temporarily running higher than 20 percent of debt outstanding to allow Treasury to gradually increase note and bond issuance, consistent with its regular and predictable strategy.[35]
· A November 2025 TBAC analysis found that Treasury’s debt issuance mix is well positioned to balance low levels of debt service costs and volatility. Although TBAC said higher debt levels, larger deficits, and higher interest rates demanded by investors since 2019 have led to higher baseline levels of expected debt service costs and cost volatility.[36]
Treasury Has Increased Auction Size and Frequency Since Fiscal Year 2014 to Meet Larger Borrowing Needs
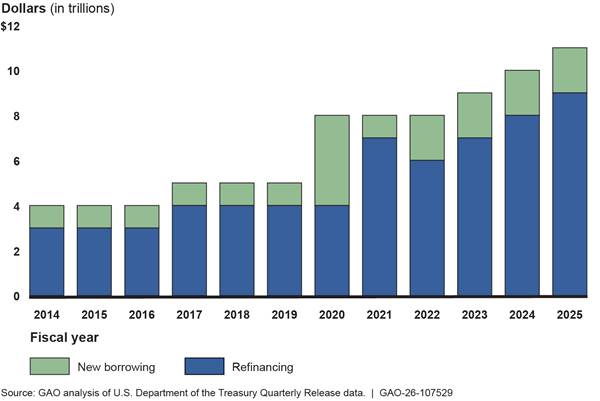
From fiscal year 2014 through 2025, persistent federal deficits have increased Treasury’s borrowing needs, requiring more issuance of Treasury securities to finance government operations. Treasury’s borrowing needs each fiscal year are determined by (1) the amount of maturing securities that need to be refinanced, (2) the size of the federal deficit, and (3) any changes in the size of Treasury’s cash balance.[37]
In fiscal year 2025, Treasury’s borrowing needs included refinancing $9.1 trillion of maturing securities and raising $1.9 trillion in new borrowing to finance the deficit and adjust its cash balance. Put in the context of U.S. gross domestic product (GDP), Treasury’s borrowing needs were equal to 36 percent of GDP in fiscal year 2025, compared to 21 percent of GDP in fiscal year 2014.[38] The growth in Treasury’s borrowing needs from fiscal year 2014 through 2025 is shown in figure 7.
During fiscal year 2025, Treasury issued a total of $30.2 trillion in marketable securities to investors through auctions. The amount of total issuance is higher than Treasury’s borrowing needs because bills mature within a matter of weeks and are refinanced multiple times during the year. For example, refinancing $1 billion of 4-week bills for a whole year (52 weeks) would result in $13 billion of total issuance, because the bills would need to be refinanced 13 times.
According to Treasury officials, Treasury responds to higher borrowing needs by
· increasing the auction sizes of existing security offerings,
· increasing the frequency of auctions, and
· introducing new maturities and product types to its offerings.
Our analysis of Treasury auctions data and agency documents found that Treasury has taken all these steps since fiscal year 2014 to respond to growing borrowing needs.
Auction sizes. From fiscal year 2014 through 2025, Treasury has increased auction sizes—the dollar amount of securities offered to investors at auction—for different security types (see fig. 8).
Figure 8: Moving Averages of Auction Sizes for Treasury Bills, Notes, and Bonds, Fiscal Years 2014–2025
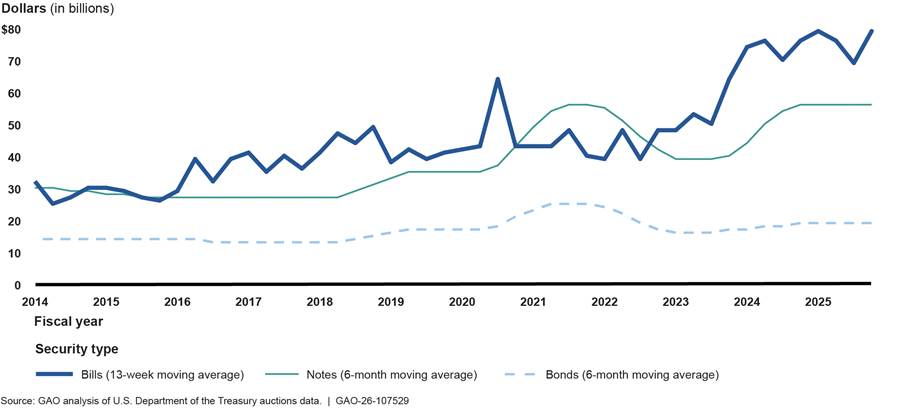
Note: Treasury bills average includes all bills that are auctioned weekly. It excludes auctions of the 52-week bill because it is auctioned on a different schedule (every 4 weeks). Cash management bills are also excluded.
· Auction sizes for bills increased the most. The average bill auction size was about $79 billion at the end of fiscal year 2025, compared to about $30 billion at the end of fiscal year 2014 (a 165 percent increase).[39]
· Auction sizes for bills have generally risen over time but vary from quarter to quarter, consistent with Treasury’s strategy to adjust bill issuance in response to seasonal or unexpected changes in borrowing needs. For example, when borrowing needs rose substantially during the April to June quarter of 2020 because of the COVID-19 pandemic and the federal response, the average bill auction size rose to about $64 billion, up from about $43 billion in the prior quarter.
· Auction sizes for notes and bonds have also risen substantially, but were implemented more gradually by Treasury, consistent with its regular and predictable framework. For example, from October 2013 to September 2025, the average note auction size increased from about $30 billion to about $56 billion (a 90 percent increase), and the average bond auction size increased from about $14 billion to about $19 billion (a 32 percent increase).[40]
Treasury adjusts auction sizes based on its assessment of investor demand for specific securities and feedback from market participants. For example, beginning in August 2023, Treasury announced relatively smaller auction size increases for the 3-year note, 7-year note, and 20-year bond to appropriately balance the supply of these maturities with market demand. Primary dealers we interviewed shared positive views of these adjustments, particularly for the 20-year bond.
In addition, starting in October 2023, Treasury began gradually increasing Treasury Inflation Protected Securities (TIPS) auction sizes due to strong investor demand, projected rising borrowing needs, and a desire to maintain TIPS as a stable share of debt outstanding.
Auction frequency. Treasury held 444 auctions in fiscal year 2025, up from 271 in fiscal year 2014. The increase in auction frequency largely reflects the addition of new bill maturities that are auctioned weekly, as discussed in more detail below (see fig. 9).
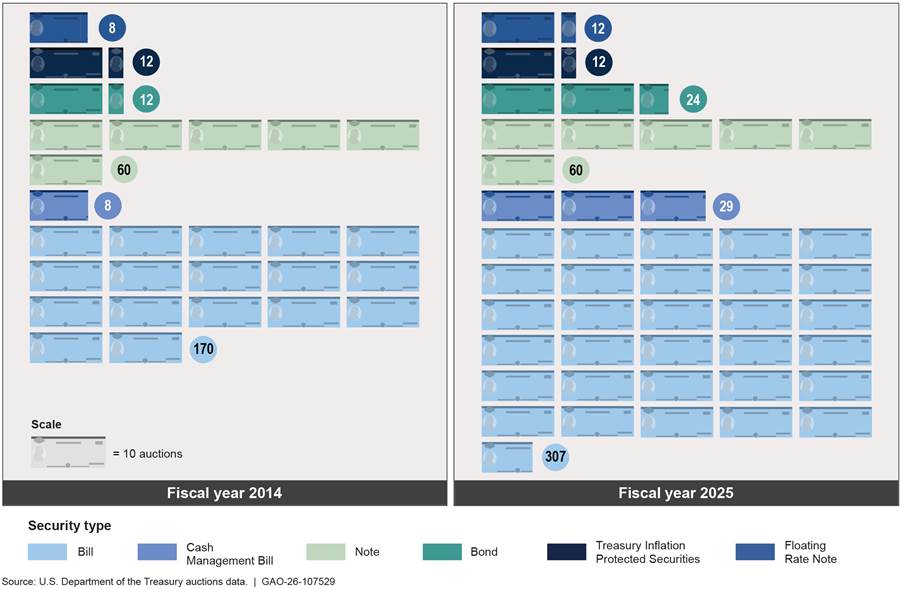
Note: Twenty of the 29 cash management bill auctions in fiscal year 2025 were of the 6-week cash management bill, which Treasury converted to the 6-week benchmark bill in February 2025 and incorporated into its regular auction schedule.
Treasury officials said that conducting more frequent and larger auctions to meet growing borrowing and refinancing needs does not pose significant risks to Treasury’s auction systems. They said that holding more auctions could require additional staff to oversee the additional debt sales, but that its auction systems can process larger auction sizes. According to Treasury officials, as of August 2025 there were 60 full-time equivalent staff between the Bureau of Fiscal Service and Federal Reserve Bank of New York who handle Treasury auctions.
New maturities and products. Since fiscal year 2014, Treasury has added three new bill maturities, one new bond maturity, and one new product for investors.
· Treasury added three new bill maturities: an 8-week bill in 2018, 17-week bill in 2022, and 6-week bill in 2025. All are currently auctioned weekly.
· In 2020, Treasury reintroduced the 20-year bond, which is currently auctioned monthly.
· In 2014, Treasury introduced the 2-year Floating Rate Note (FRN), which is currently auctioned monthly. [41]
Treasury Auctions Continue to Attract Several Types of Investors to Meet Rising Borrowing Needs
Auction Metrics Signal That Investor Demand Remains Sufficient Even as Auction Sizes Grow
According to our analysis of auction results from fiscal year 2014 through 2025, investor demand for Treasury auctions remains sufficient for Treasury to meet the government’s borrowing needs, even as persistent federal deficits have required Treasury to increase auction sizes.
However, if deficits and auction sizes continue to grow, some indicators point to potential future challenges regarding investor demand for large auctions and the interest rates that Treasury will need to pay to sell larger amounts of U.S. debt. Specifically, we found that larger auctions have historically been associated with slightly lower bid-to-cover ratios, suggesting lower demand relative to auction size and potentially higher interest rates for larger debt sales. In addition, our analyses and related research suggest that investors have become less willing to accept lower interest rates on Treasury securities as debt has grown. Even as Treasury takes steps to meet the government’s future borrowing needs, these potential challenges have negative implications for the government’s interest costs and the fiscal outlook.
We analyzed three auction metrics: (1) bid-to-cover ratio, (2) primary dealer share of auction awards, and (3) yields, or the interest rate paid on Treasury securities. Treasury officials and market participants said they analyze these metrics and others to gauge the performance of an auction. Treasury officials said they look at auction results within the context of external factors that may have affected auction results, such as market volatility and monetary policy changes. The officials also said they look at broader trends instead of reacting to any one auction’s results.
Bid-to-Cover Ratios
The bid-to-cover ratio is a measure of investor demand for an auction calculated as the total amount of investor bids received compared to the total amount of bids accepted. For example, for a $10 billion auction, a bid-to-cover ratio of 2 means that Treasury received $20 billion of investor bids, or twice the value of securities offered.[42] Higher bid-to-cover ratios would indicate that there are more bids, and likely more competition for the auctioned securities relative to the size of the auction, which could result in lower interest rates set at auction. Lower bid-to-cover ratios, on the other hand, would indicate that there are fewer bids, with potentially less competitive offers, which could result in higher interest rates set at auction. Higher interest rates set at auction would increase borrowing costs for Treasury.
Since primary dealers are expected by the Federal Reserve Bank of New York to bid for their pro rata (proportional) share of every Treasury auction, the bid-to-cover ratio should always be at least 1, meaning that Treasury should always have enough buyers to purchase the auctioned securities.[43] Thus, the risk of a failed auction (where Treasury does not receive enough bids to purchase the offered securities) is very low. However, borrowing costs may increase when there are fewer bids relative to the auction size.
Our analysis of bid-to-cover ratios for auctions from fiscal years 2014 through 2025 shows that, on this measure, investor demand for Treasury auctions has been relatively strong and stable. Average bid-to-cover ratios have generally been above 2, and often closer to 3, for all Treasury security types, meaning that there were two to three times more investor bids than there were securities offered at auction.[44] We found the bid-to-cover ratio varied by security type over this period, with some having declined over time and others remaining more consistent (see fig. 10):
· Ratios for bills declined from about 4 to 3, but they continue to exhibit higher average ratios compared to other security types, suggesting stronger demand.
· Ratios for notes declined from about 3 to 2.5, while ratios for bonds remained steady at around 2.4.
· Ratios for TIPS have remained around 2.4, while ratios for FRNs have been around 3, having declined from higher bid-to-cover ratios when the product was first introduced in 2014.
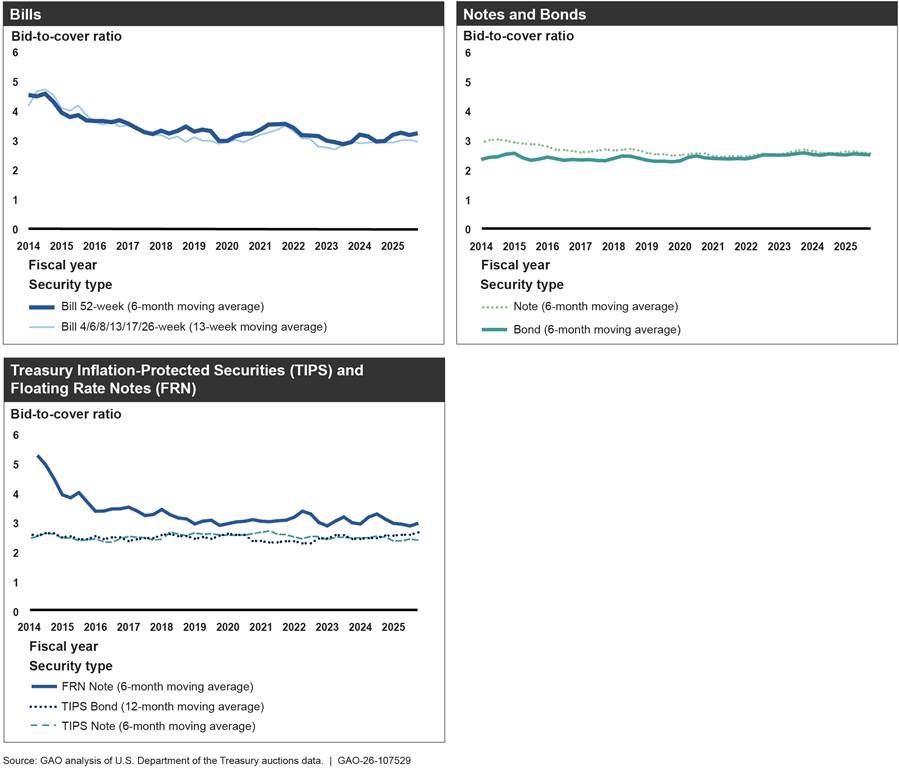
Note: Bid-to-cover ratios exclude any add-on amounts purchased by the Federal Reserve to exchange maturing holdings of Treasury securities for newly issued securities. Average bid-to-cover ratios are weighted by auction offering amount.
However, our related analysis of Treasury auctions found that larger auction sizes generally coincide with slightly lower bid-to-cover ratios. This suggests weaker investor bidding and potentially higher interest rates for larger debt sales. This relationship is consistent with what researchers have previously found. As deficits grow larger, investors are likely to require higher interest rates on Treasury securities.[45]
We analyzed historical relationships between auction sizes and bid-to-cover ratios from fiscal years 2014 through 2025 and found that auctions that were above-average size during this period were associated with slightly below-average bid-to-cover ratios (see appendix II for more details on our methodology).
Bill auctions that were $1 billion larger than average tended to have bid-to-cover ratios that were 0.018 points lower than average. Note and bond auctions that were $1 billion larger than average tended to have bid-to-cover ratios that were 0.009 points lower than average.
The average note and bond auction size over this period was about $34 billion and the average bid-to-cover ratio was 2.55. Given our results, we would expect that an auction that was $10 billion larger than this average ($44 billion) to have a 0.09 point drop in the bid-to-cover ratio to 2.46.[46] This would translate into about $4 billion fewer investor bids than if the bid-to-cover ratio remained constant.
While our analysis is not necessarily predictive of future auction results or borrowing costs, the past association between larger auction sizes and lower bid-to-cover ratios highlights future risks. Large projected future deficits would necessitate further increases in Treasury auction sizes.
Market participants we interviewed said that while current auction metrics are not concerning, larger auctions due to rising federal debt pose future risks to the market’s capacity to absorb auctions, which could push interest rates higher.
Primary Dealer Share
Primary dealer share measures the percent of an auction that was purchased by primary dealers. Each primary dealer is expected to bid at a competitive price for a pro-rata (proportional) share of the securities at every auction. Higher shares of auctions bought by primary dealers signals that other investors (such as investment funds, foreign investors, and pension and insurance companies) either did not participate in the auction or submitted bids that were less competitive (i.e., at higher interest rates) than the primary dealers.[47] Thus, primary dealers buying an increasing share of Treasury securities at auctions could indicate weakening demand from other investors and potentially higher costs for Treasury.
Our analysis shows that other investors have purchased increasing shares of Treasury auctions over time, with primary dealers’ share declining, indicating strong demand for Treasury securities from other investors. For example, in fiscal year 2025, other investors bought a total of 86 percent of notes, bonds, FRNs, and TIPS at auction compared to 58 percent in 2014 (see fig. 11). Other investors have steadily purchased larger shares of auctions over the fiscal year 2014 to 2025 period that we analyzed, while the primary dealer share has steadily declined.
Figure 11: Percent of Coupon Securities Bought at Auction by Primary Dealers and Other Investors, Fiscal Years 2014 and 2025
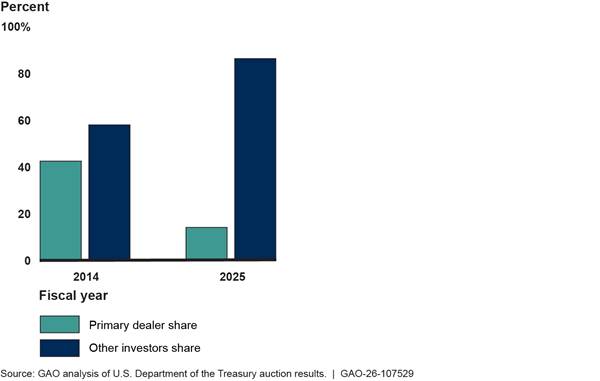
Note: Coupon securities include Treasury notes, bonds, floating rate notes, and Treasury Inflation Protected Securities.
Yield (interest rate)
Yield is the interest rate that Treasury pays to investors whose bids are accepted at an auction. Treasury accepts bids during the auction from lowest to highest yield until the offering is filled. All successful bidders receive the same interest rate (the highest accepted yield). In this sense, the final investor whose bid is accepted determines the interest rate that Treasury pays to all successful bidders. Investors typically demand similar yields at auction to those observed in secondary market trading.
Although yields can be influenced by many factors, such as Federal Reserve policy and investor expectations for economic growth, inflation, interest rates, and liquidity conditions, yield can also be an indicator of demand.[48] When yields rise on Treasury securities, the government incurs higher interest costs for the same amount of debt. Persistently higher yields may indicate lower investor demand.
Our analyses and related research of the Treasury secondary market suggest that investors have become less willing to accept lower yields to hold Treasury securities compared to similar assets as debt has grown in the last decade. Such trends in the convenience yield—the additional yield investors are willing to forgo to hold Treasury securities—could also increase auction yields and Treasury’s borrowing costs. Typically, investors have accepted lower yields on Treasury securities for the liquidity, depth, and safety of the U.S. Treasury security market.
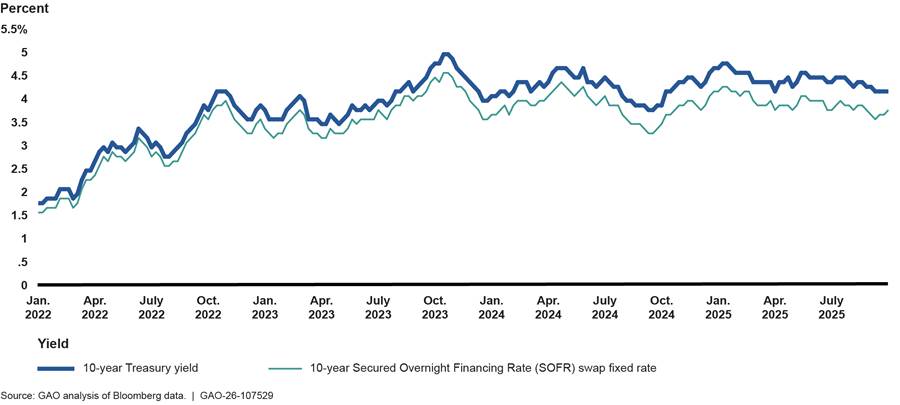
We looked at how yields on Treasury securities compare to alternative financial assets. Specifically, we analyzed the difference between the yield on the 10-year Treasury note and the yield on a fixed-rate 10-year Secured Overnight Financing Rate (SOFR) swap contract—contracts which share certain key features with Treasury securities.[49] Although the difference between these yields can be influenced by other factors, such as regulatory changes, the difference provides insights into investors’ relative demand for Treasury securities.
The difference between these yields (or the SOFR-Treasury spread) has been negative in recent years—meaning that investors have demanded higher yields to hold a 10-year Treasury note than to enter into a 10-year SOFR contract.[50] In addition, the difference between these yields has widened gradually from around -20 basis points (-0.2 percentage points) in January 2022 to around -50 basis points (-0.5 percentage points) in September 2025. This shows that investors have required even higher returns to hold a 10-year Treasury than to enter a comparable SOFR contract in 2025 compared to 3 years ago (see fig. 12).
Figure 12: Comparison of Yield on 10-Year Treasury Note and Fixed Rate 10-Year Secured Overnight Financing Rate (SOFR) Swap Contract, Weekly Average, Jan. 1, 2022–Sept. 30, 2025
In addition, a June 2025 working paper by economists from academia and the Federal Reserve found that the convenience yield has declined as the supply of Treasuries securities has increased since 2008.[51] A declining convenience yield indicates investors are not willing to pay as large a premium for Treasury securities as they once were. These researchers also found that the convenience yield on 7- to 20-year securities has turned negative multiple times since 2014. A negative convenience yield means investors are no longer willing to pay a premium and require extra yield to hold Treasury securities as compared to other assets. However, these researchers found a small convenience yield remains for 2- and 3-year securities, meaning investors continued to be willing to pay a small premium for securities with shorter maturities.
Investment Funds Are Now the Largest Buyer at Auctions
Treasury auctions continue to attract several types of investors including investment funds, foreign investors, dealers and brokers, banks, pension and insurance companies, and individuals.[52]
In fiscal year 2025, investment funds were the largest buyers at Treasury auctions, followed by dealers and brokers and foreign investors. Investment funds increased their auction purchases since fiscal year 2014. As of September 2025, they were the largest purchasers at auction for all Treasury security types (see fig. 13).
Figure 13: Average Shares of Treasury Securities Auction Awards by Investor Class, Fiscal Years 2014–2025
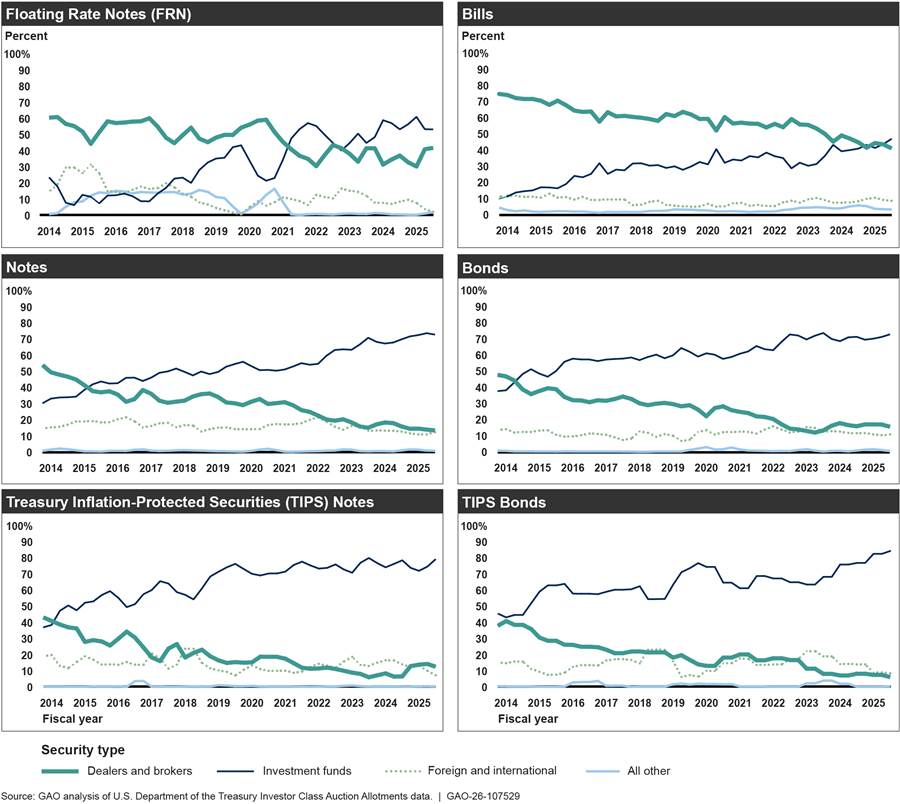
Notes: All other investors include depository institutions, pension funds and insurance companies, individuals, and all other investors not specified elsewhere. The analysis excludes any add-on amounts purchased by the Federal Reserve to exchange maturing holdings of Treasury securities for newly issued securities. Cash management bills are excluded from the bills analysis. Shares for bill auctions are calculated using a 13-week moving average. Shares for note, bond, FRN, and TIPS note auctions are calculated using a 6-month moving average. Shares for TIPS bond auctions are calculated using a 12-month moving average.
Investment funds are important buyers in helping to meet the government’s rising borrowing needs. At the same time, Treasury officials, TBAC, and others have said that some investment funds may be more price sensitive than other buyers of Treasury securities, meaning that they pay close attention to the yield of Treasury securities and may only want to purchase them at interest rates that are attractive for their investment objectives.[53] In contrast, less price sensitive investors may prioritize other objectives (such as obtaining liquidity and safety) when deciding to purchase Treasury securities.
As price-sensitive investors make up an increasing share of Treasury security buyers, their bids increasingly determine the yield set at auction. Because price-sensitive buyers may require higher yields to enter the Treasury market, government borrowing costs may rise if the yields bid by price-sensitive investors at auction are higher than those of more price-insensitive buyers. Auction yields may also be more volatile to the extent they are frequently determined by price-sensitive investors responding to changing investment opportunities. Such volatility could increase borrowing costs on longer-term securities if investors require a premium for the increased exposure to changing interest rates.
Investors can also purchase Treasury securities in the secondary market where securities are traded after they are auctioned. Treasury officials said they also monitor the secondary market when assessing demand, as some investors may be less active at auctions but make significant purchases of securities in the secondary market from broker-dealers. For example, pension funds and insurance companies do not account for large shares of auction purchases but are some of the largest holders of Treasury securities on the secondary market. Appendix I describes recent trends in holdings in the Treasury secondary market.
Investment Funds
Investment funds include domestic money market funds, mutual funds, hedge funds, money managers, and investment advisors. As of September 2025, investment funds are the largest buyer at Treasury auctions. For example, they account for an average of 47 percent of bill auctions, 53 percent of FRN auctions, and over 70 percent of note, bond, and TIPS auctions.[54] Investment fund purchases have grown significantly for all security types since 2014. For example, their shares of bill and note auctions have more than doubled.
Investment funds also own a substantial share of Treasury securities holdings on the secondary market. As of September 2025, money market funds, mutual funds, exchange-traded funds, and closed-end funds collectively accounted for nearly 20 percent of all holdings of Treasury securities outstanding. Hedge funds are also estimated to own large amounts of Treasury securities (see app. I).
Dealers and Brokers
Dealers and brokers, which includes primary dealers, purchase securities at auction to hold as inventory on their balance sheets and later sell them to their customers such as foreign central banks, mutual funds, hedge funds, pension funds, and insurance companies on the secondary market. Our analysis from fiscal years 2014 through 2025 shows that while dealer and broker auction purchases have increased in dollar terms, their share of auction awards has declined as investment fund purchases have increased.
Dealers and brokers’ share of auctions purchases has declined markedly for notes, bonds, and TIPS. For example, from fiscal years 2014 through 2025, dealers and brokers’ share of note auctions declined from 54 percent to 14 percent. Dealers and brokers remain large buyers of bills and FRNs, purchasing 41 percent of bill auctions and 42 percent of FRN auctions.
We have previously reported that the growth in Treasury securities outstanding and post-financial crisis regulations on dealer balance sheets may challenge dealers and brokers’ capacity or willingness to hold large amounts of Treasury securities in inventory.[55] This may influence how aggressively they bid for securities at auction and, in turn, how much they are awarded.
Foreign Investors
Foreign investors include foreign official investors (such as foreign governments, central banks, and government-owned investment funds) and foreign private investors. Foreign investors hold significant amounts of securities in the Treasury secondary market, and account for about 33 percent of all Treasury securities outstanding (see app. I).
Foreign official investors may buy Treasury securities to help manage their foreign exchange reserves, among other things. Foreign private investors may be interested in earning yield, hedging, or finding arbitrage opportunities. According to TBAC, foreign official investors are considered less price sensitive investors while foreign private investors may be more price sensitive. While Treasury data do not distinguish between foreign official and foreign private investors in auction awards, our analysis of holdings in the secondary market shows that foreign private holdings surpassed those of foreign official investors in 2023 (see app. I).
Foreign investors account for meaningful shares of auction purchases. Their auction awards grew in dollar terms from fiscal years 2014 through 2025 and their total shares have generally stayed within consistent ranges. Foreign investors are most active at note auctions and generally took between 11 percent and 22 percent of note auctions as of September 2025. Their share of bond auctions has ranged between 7 percent and 16 percent. They tend to take smaller shares of bill auctions (between 5 percent and 12 percent).
Other Investors
Other investors include banks, pension funds, insurance companies, individual investors, and all other types of investors not categorized elsewhere in the Treasury investor class data. These investors do not purchase large shares of auctions. On a relative basis, this group tends to buy more bills than any other security type each year. In fiscal year 2025, other investors purchased 4 percent of bill auctions compared to about 1 percent for other security types.
The Treasury Market Faces Risks That Treasury Debt Management Practices Cannot Address
Although Treasury has practices in place to address certain debt management challenges, and investor demand for Treasury securities remains sufficient to finance government borrowing, our work has identified broader challenges that pose serious risks to the Treasury market that could reduce investor demand, raise future borrowing costs, and accelerate the worsening fiscal outlook. These are
· the unsustainable fiscal outlook,
· possible default due to delays in raising the statutory debt limit, and
· a potential decline in the U.S. dollar’s international role.
Treasury debt management practices alone cannot address these risks. In some cases, Congress would need to take action to address the risks.
Unsustainable Fiscal Outlook
The federal government’s unsustainable fiscal path poses serious economic, security, and social challenges if not addressed. We projected that under current revenue and spending policies as of June 2024, the debt-to-GDP ratio will reach its historical high of 106 percent in 2027 and reach 200 percent of GDP by 2047.[56]
Perpetually rising debt as a share of GDP creates additional risks and challenges for federal debt management, such as Treasury’s ability to borrow and refinance debt at affordable interest rates. If market participants perceive that the deteriorating fiscal outlook of the federal government could undermine the credit quality of Treasury securities, some investors could seek out alternative investments or demand higher interest rates. Further increases in interest rates on Treasury securities would accelerate the worsening trend of higher interest payments, larger deficits, and growing debt. Market participants we interviewed commented that growing federal debt could pose future risks to auctions and introduce volatility as auction sizes grow.
Treasury does not control the size of its borrowing needs and must sell enough securities to finance the gap between revenue and spending regardless of market interest rates. To meet these needs, Treasury uses its regular and predictable issuance framework to finance government borrowing at the lowest cost over time.[57]
Since 2017, we have emphasized the need for Congress to have a strategy to put the government on a sustainable fiscal path.[58] In 2020, we recommended that Congress consider establishing a fiscal plan that includes fiscal rules and targets.[59]
Statutory Debt Limit
Delays in raising the statutory debt limit (also called debt limit impasses) disrupt normal debt management operations, impose avoidable costs on taxpayers, and increase the risk of a government default—which could intensify the negative effects of the growing federal debt and lead to long-term consequences for government borrowing costs.
We have previously reported that if the U.S. were to default on its legal obligations because of a debt limit impasse, investors may demand higher interest rates on Treasury securities even after the default is resolved.[60] The longer-term consequences would likely be higher interest rates on Treasury securities due to a diminished perception of Treasury securities as safe assets.
We have reported numerous times that the full faith and credit of the United States must be preserved. In 2015, we identified policy alternatives and recommended that Congress replace the current debt limit to avoid seriously disrupting the Treasury market and increasing borrowing costs.[61] Congress has not yet taken that action. In 2024, we again recommended that Congress replace the current debt limit process with an approach that links decisions on debt to decisions on revenue and spending at the time they are made.[62]
International Role of the U.S. Dollar
The U.S. dollar is the dominant global currency. It is widely held by foreign central banks in their official foreign exchange reserves—often in the form of Treasury securities. It is also heavily used to conduct global trade and international financial transactions. The dollar’s status is tied closely to the safety and liquidity of Treasury securities, which has historically contributed to dollar dominance. In turn, the dollar’s global role supports demand for Treasury securities and helps keep borrowing costs low.
While still dominant, the dollar’s use as a reserve currency has gradually declined as foreign central banks have added to their portfolios a wide range of currencies from smaller economies. In 2024, the dollar comprised 58 percent of foreign exchange reserves, down from a peak of 72 percent in 2001.[63] The share of Treasury securities outstanding held by foreign investors has also declined as the Treasury market has grown, although foreign investors have continued to add to their holdings (see app. I). As of September 2025, foreign investors held about 33 percent of Treasury securities outstanding, down from 49 percent as of September 2013.
The dollar’s global role received increased attention in 2025. We previously reported that circumstances such as concerns about fiscal sustainability, debt limit impasses, or reduced openness of the U.S. economy to global trade or financial markets could weaken the dollar’s global role and reduce foreign demand for Treasury securities.[64] Such circumstances would undermine the liquidity or safety of Treasury securities or reduce the advantages of using U.S. dollars to conduct global trade or financial transactions.
While near-term challenges to the dollar’s status appear limited, the dollar does not need to be fully displaced as the dominant global currency for risks from foreign demand to materialize. Even gradual or partial erosion of the dollar’s status could reduce demand for Treasury securities as investors shifted to other assets. All else being equal, this would raise borrowing costs for the U.S. government and taxpayers.
Congress and Debt Management Risks
Treasury’s Office of Debt Management has limited ability to manage these broader risks to the Treasury market through its debt management actions. For example, Congress makes revenue and spending decisions that determine the financing gap that Treasury needs to borrow. Congress also separately sets the statutory limit of debt outstanding. Regarding the U.S. dollar’s international role, Office of Debt Management officials said that their current practices support the U.S. dollar’s role by promoting investor demand for Treasury securities and maintaining a liquid and deep Treasury market. Beyond this, the Office of Debt Management does not make policy decisions in areas such as U.S. involvement in global trade or financial markets that can influence the dollar’s attractiveness globally.
Congress has a critical role to play in addressing risks to the Treasury market stemming from the unsustainable fiscal path and the debt limit. We continue to emphasize our recommendations that Congress (1) develop a fiscal strategy to manage the structural imbalance between spending and revenue and (2) replace the current debt limit process with an approach that links decisions on debt to decisions on revenue and spending at the time those decisions are made.[65] Taking action to address these risks would help ensure the continued broad-based demand for Treasury securities, reinforce the global role of the U.S. dollar, and support Treasury’s efforts to finance government borrowing at the lowest cost over time
Agency Comments
We provided a draft of this report to Treasury for review and comment. Treasury provided technical comments, which we incorporated as appropriate.
We are sending copies of this report to the appropriate congressional committees, the Secretary of the Treasury, and other interested parties. In addition, this report is available at no charge on the GAO website at https://www.gao.gov.
If you or your staff have any questions about this report. please contact me at mctiguej@gao.gov. Contact points for our Offices of Congressional Relations and Media Relations may be found on the last page of this report. GAO staff who made key contributions to this report are listed in appendix III.
Sincerely,

James R. McTigue, Jr.
Director, Strategic Issues
Investors can buy marketable Treasury securities at Treasury auctions or on the secondary market, where securities are traded after they are issued. Investor demand dynamics in the secondary market ultimately affect Treasury’s borrowing costs, as investors generally demand similar rates at auction to those in the secondary market.
As of September 2025, Treasury securities are held by a wide range of investors, including domestic investors, foreign investors, and the Federal Reserve System (Federal Reserve).[66] Domestic investors (including investment funds, households, banking institutions, insurance companies and pension funds, and state and local governments) are the largest holders of Treasury securities with $14.9 trillion in holdings, or 53 percent of all holdings.[67] Domestic investors overtook foreign investors as the largest holders in 2018. The Federal Reserve, the U.S. central bank, also holds significant amounts of Treasury securities (see fig. 14).[68]
Figure 14: Treasury Securities Holdings of Domestic Investors, Foreign Investors, and the Federal Reserve, September 2013–September 2025
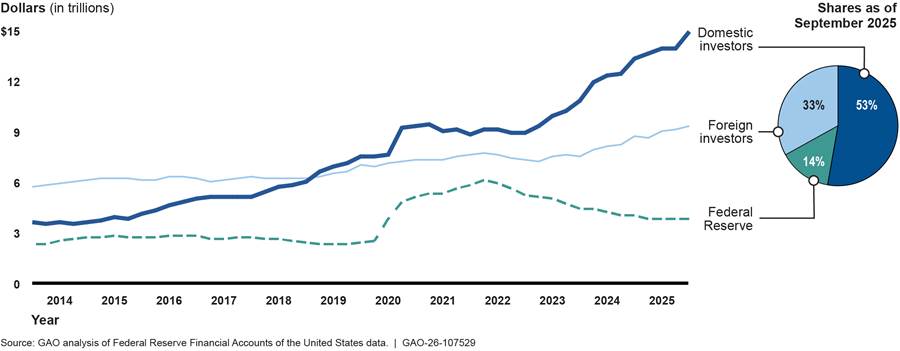
Federal Reserve
The Federal Reserve is the largest individual holder of Treasury securities. As of September 2025, the Federal Reserve held approximately $3.8 trillion in Treasury securities, accounting for about 14 percent of all holdings. In 2020, the Federal Reserve purchased over $2 trillion of Treasury securities to support Treasury market functioning following a severe market disruption triggered by investor uncertainty related to the COVID-19 pandemic.
In June 2022, the Federal Reserve began reducing the size of its balance sheet, including its holdings of Treasury securities through a process commonly called quantitative tightening, or QT.[69] This involved letting a certain amount of maturing Treasury securities to roll off its balance sheet each month. From June 2022 through November 2025, the Federal Reserve reported that its holdings of Treasury securities declined by about $1.6 trillion. The growth in Treasury securities outstanding during this time meant that the decline in the Federal Reserve’s holdings needed to be offset by increases in the holdings of other investors. Specifically, the decline in Federal Reserve holdings coincided with strong growth in domestic investor holdings and more moderate growth in foreign investor holdings. In October 2025, the Federal Reserve decided to conclude the reduction of its holdings on December 1, 2025.[70]
Foreign Investors
As of September 2025, foreign investors held $9.3 trillion, or about 33 percent of all holdings of Treasury securities. Foreign investors include foreign private investors ($5.4 trillion in holdings) and foreign official institutions such as foreign governments, central banks, and government-owned investment funds ($3.9 trillion in holdings). In 2023, foreign private holdings surpassed foreign official holdings.
Foreign official demand for Treasury securities can fluctuate based on economic conditions. For example, foreign central banks often invest their U.S. dollar reserves into Treasury securities. When those central banks manage their currencies or exchange rates by buying or selling U.S. dollar reserves, such transactions may increase or decrease their investment in Treasury securities.[71] Foreign private investors may purchase Treasury securities for other investment objectives such as earning yield, hedging, or for arbitrage opportunities.
Foreign demand for Treasury securities comes from investors in a broad range of countries. Treasury data as of January 2026 show that there are at least 20 countries where over $100 billion of Treasury securities are held.[72] The top three countries where the most Treasury securities are held are Japan, the United Kingdom, and China. The sum of holdings in these countries totals $2.8 trillion, or about 30 percent of the more than $9.3 trillion in foreign holdings (see table 2).
|
Country |
Holdings ($ in billions) |
|
Japan |
1,225 |
|
United Kingdom |
895 |
|
China |
694 |
Source: Treasury International Capital system data. | GAO‑26‑107529
Note: These data are collected primarily from U.S.-based custodians and broker-dealers. Since U.S. securities held in overseas custody accounts may not be attributed to the actual owners, the data may not provide a precise accounting of individual country ownership of Treasury securities.
Domestic Investors
As of September 2025, the largest domestic investors in Treasury securities included
· investment funds (e.g., money market funds, mutual funds, and exchange-traded funds);
· households (a residual category that reflects holdings of private investors, including hedge funds, whose holdings are not captured in other domestic or foreign sectors,);
· banking institutions;
· insurance companies and pension funds; and
· state and local governments.
Investment Funds
As of September 2025, investment funds such as money market funds, mutual funds, and exchange-traded funds held a combined $5.5 trillion of Treasury securities, or about 37 percent of the domestic total.[73]
Money market funds alone hold $3.2 trillion of Treasury securities.[74] Money market funds typically purchase shorter-dated Treasury securities like bills, due to regulations on the average maturity of investments in their portfolios.
Households (Including Hedge Funds)
As of September 2025, the household sector held almost $3 trillion of Treasury securities. The household sector is a residual category that reflects holdings of private investors not captured elsewhere in the data. This includes households, nonprofit organizations, hedge funds, private equity funds, and personal trusts.
Some market analyses mention hedge funds as an important driver of changes in household holdings. The household sector includes domestic hedge fund holdings of Treasury securities. However, it may also unintentionally include a large amount of foreign hedge fund holdings.[75] According to Federal Reserve research, this is due to the persistent mismeasurement of the holdings of hedge funds domiciled in the Cayman Islands.[76] This mismeasurement, in turn, affects multiple measures in the Financial Accounts of the United States data. This would mean that hedge funds could account for a substantial share of total household holdings of Treasury securities, even if a large portion is attributable to foreign hedge funds.
Supplemental data from the Federal Reserve estimates that domestic and foreign hedge funds combined held a total of about $2.6 trillion of Treasury securities as of June 2025.[77] According to the Financial Stability Oversight Council, hedge funds engaged in certain trades in the Treasury market have become an important source of demand for Treasury securities, but one that is relatively sensitive to interest rate volatility and other changes in market conditions. This could pose risks if surges in volatility and other market factors led hedge funds to quickly sell Treasury securities to limit their losses or obtain cash to meet financial obligations, which would further exacerbate market volatility.[78]
Banking Institutions
As of September 2025, banking institutions held about $1.9 trillion of Treasury securities. Bank demand for Treasury securities can be influenced by the growth rates of deposits and loans. For example, if customer deposits grow faster than loans, banks may invest those additional funds in Treasury securities. Conversely, higher loan growth would reduce the funds available to purchase Treasury securities. We previously reported that regulatory requirements have also influenced the amount of high-quality liquid assets, including Treasury securities, held by banks.[79]
Insurance Companies and Pension Funds
As of September 2025, insurance companies and pension funds held almost $1.8 trillion of Treasury securities. These investors have long investment horizons and may purchase longer-term Treasury securities to help meet their financial obligations.
State and Local Governments
As of September 2025, state and local governments held almost $1.6 trillion of Treasury securities. State and local governments may invest excess tax revenues in Treasury securities until they are needed.
To understand the relationship between U.S. Treasury auction offering amounts and bid-to-cover ratios, we developed an econometric model to predict the bid-to-cover ratio from a given auction offering amount. We devised separate models for (1) bills, and (2) notes and bonds. We used Treasury auction data between October 1, 2013, and September 30, 2025, to estimate this relationship.[80] We find that:
· Above-average offering amounts are associated with below-average bid-to-cover ratios.
· For bills, a $1 billion increase in auction offering amount relative to security-term average is associated with a 0.018 decrease in the bid-to-cover ratio relative to security-term average.
· For notes and bonds, a $1 billion increase in auction offering amount relative to security-term average is associated with a 0.009 decrease in the bid-to-cover ratio relative to security-term average.
· This negative relationship is consistent when comparing to either just security-term averages or both security-term and fiscal-year averages.
Methods
To account for average differences in both offering amounts and bid-to-cover ratios across different fiscal years and maturity lengths, we use a fixed effects regression that includes auction-fiscal-year fixed effects and security-term fixed effects to remove constant differences in offering amounts and bid-to-cover ratios between different fiscal years and between different maturity lengths.
In particular, we create
scatter plots of residual bid-to-cover ratios and residual offering amounts,
where the residuals,  and
and  , are created from the following
regressions:
, are created from the following
regressions:


Where  indexes an individual
auction,
indexes an individual
auction,  indexes auction fiscal year,
  indexes
security term,
indexes
security term,  is the bid-to-cover ratio for a
given auction in auction fiscal year and
security term ,
is the bid-to-cover ratio for a
given auction in auction fiscal year and
security term ,  is the offering amount for a
given auction in auction fiscal year and
security term ,
is the offering amount for a
given auction in auction fiscal year and
security term ,  are auction-fiscal-year fixed
effects, and
are auction-fiscal-year fixed
effects, and  are security-term fixed effects.
The residuals, and , represent deviations from the
average bid-to-cover ratio and offering amount, respectively, in a given fiscal
year and with a given security term.[81]
The line-of-best fit (regression line) for the residuals is estimated as follows
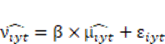
and is equivalent to the following regression

by the Frisch-Waugh-Lovell Theorem. Therefore, the
coefficient on the line-of-best-fit for the residual scatter plot is equivalent
to the coefficient  , which is interpreted as how
much we would expect the bid-to-cover ratio to increase relative to average for
a $1 billion increase in offering amount relative to average.
, which is interpreted as how
much we would expect the bid-to-cover ratio to increase relative to average for
a $1 billion increase in offering amount relative to average.
We estimate regressions and present results both including
and excluding fiscal-year fixed effects to determine if the results are robust
to both specifications. For the regressions that exclude fiscal-year fixed
effects, the equations above would drop the subscript and
the term from all equations. We
consider the results that exclude fiscal-year fixed effects our main results
because they utilize the variation in offering amounts that has resulted from
increasingly large deficits over time.
Each figure below presents:
· The
residuals,  and
and 
· The
estimate of the coefficient, 
· The
standard error of
· The
linear fit of the data, 
· The
quadratic fit of the data,  , because the relationship is
nonlinear in some figures
, because the relationship is
nonlinear in some figures
· The
correlation between and , which shows the strength of the
linear relationship between offering amount and bid-to-cover ratio independent
of the magnitude of the relationship
· The 90th percentile and above offering amounts highlighted in red
Limitations
Our models are not designed to estimate the causal effect of U.S. Treasury auction offering amounts on bid-to-cover ratios. They instead estimate the association between offering amounts and bid-to-cover ratios after accounting for fixed differences in those values between auctions of different security terms and fiscal years.
Any variable that is correlated with both offering amount and bid-to-cover ratio that varies across auctions for a given security-term or across auctions for a given fiscal year would affect our estimate of the relationship between offering amounts and bid-to-cover ratios. In particular, any variable that simultaneously increases or decreases the supply of (offering amounts) and demand for (bids) Treasury securities would make our estimate less negative than the true relationship. Similarly, any variable that affects the supply and demand for Treasury securities in opposite directions would make our estimate more negative than the true relationship. Examples include macroeconomic shocks or changes in Federal Reserve policy that do not align with fiscal years, the U.S. Treasury deciding offering amounts by estimating security demand, or investors changing their demand for U.S. Treasury securities in response to budget deficits or surpluses that affect the amount of debt Treasury needs to issue.
In regressions that exclude fiscal-year fixed effects, macroeconomic conditions or Federal Reserve policy could also affect our estimate of the relationship relative to the true relationship.
Additionally, the association we estimate in our sample may not extend to time periods out of our sample or to securities other than those that we studied (bills, notes, and bonds).
Findings
For both bills and notes and bonds, we find that within a given security term auctions with larger-than-average offering amounts tend to have lower-than-average bid-to-cover ratios.
Figure 15 plots the residuals for bills when only including security-term fixed effects. We find that a $1 billion increase in offering amount relative to the security-term average is associated with a 0.018 decrease in bid-to-cover ratio relative to average. This correlation is statistically significant at the 1 percent level.
The top 10 percent of absolute offering amounts are shown in red. Relative to security-term averages these auctions are primarily below the security-term average for bid-to-cover ratio and above the security-term average for offering amount, as seen by the fact that the red points are concentrated in the bottom-right quadrant.
Figure 15: Treasury Bill Auctions Fiscal Years 2014–2025, Deviations from Security-Term Average Offering Amount and Bid-to-Cover Ratio (Controlling for Security-Term Fixed Effects)
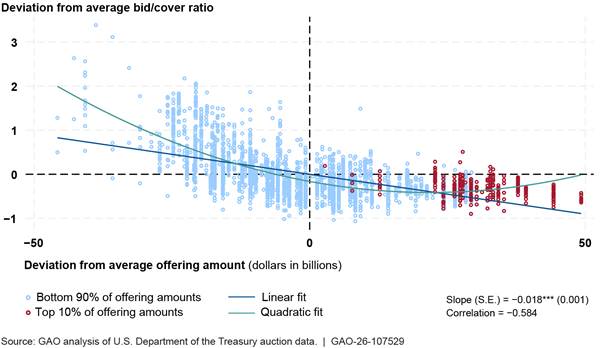
Figure 16 plots the residuals for notes and bonds when only including security-term fixed effects. We find that a $1 billion increase in offering amount relative to the security-term average is associated with a 0.009 decrease in bid-to-cover ratio relative to average. This correlation is statistically significant at the 1 percent level.
The top 10 percent of absolute offering amounts are shown in red, and these auctions tend to have both larger-than-average offering amounts and lower-than-average bid-to-cover ratios compared to the security-term average.
Figure 16: Treasury Note and Bond Auctions Fiscal Years 2014–2025, Deviations from Security-Term Average Offering Amount and Bid-to-Cover Ratio (Controlling for Security-Term Fixed Effects)
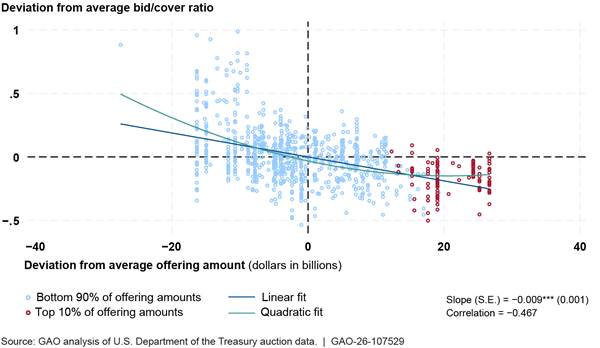
Sensitivity Analysis
To address concerns that macroeconomic conditions may be driving the relationship between offering amounts and bid-to-cover ratios, we repeat our above analyses adding fiscal-year fixed effects. We find that the inclusion or exclusion of fiscal-year fixed effects does not meaningfully change the estimated relationship between offering amounts and bid-to-cover ratios.
Figure 17 plots the residuals for bills when including security-term fixed effects and fiscal-year fixed effects. We find that a $1 billion increase in offering amount relative to the security-term and fiscal-year average is associated with a 0.015 decrease in bid-to-cover ratio relative to average, which is slightly smaller in magnitude than when including only security-term fixed effects. This correlation is statistically significant at the 1 percent level.
The top 10 percent of absolute offering amounts are shown in red. Relative to security-term and fiscal-year averages, these auctions are not particularly concentrated above or below average in either bid-to-cover ratio or offering amount, as seen by the fact that the red points span all four quadrants, although they are somewhat concentrated above the average offering amount.
Figure 17: Treasury Bill Auctions Fiscal Years 2014–2025, Deviations from Security-Term and Fiscal-Year Average Offering Amount and Bid-to-Cover Ratio (Controlling for Security-Term and Fiscal-Year Fixed Effects)
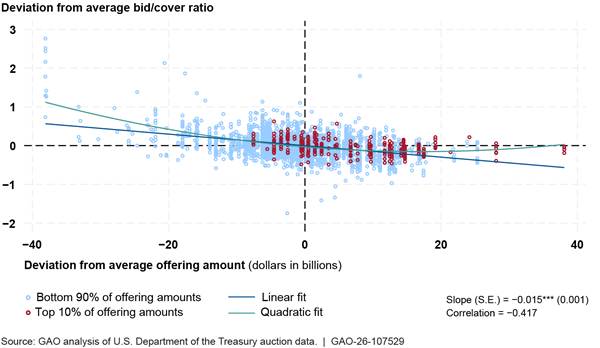
Figure 18 plots the residuals for notes and bonds when including security-term fixed effects and fiscal-year fixed effects. We find that a $1 billion increase in offering amount relative to the security-term and fiscal-year average is associated with a 0.014 decrease in bid-to-cover ratio relative to average, which is slightly larger in magnitude than when including only security-term fixed effects. This correlation is statistically significant at the 1 percent level.
The top 10 percent of absolute offering amounts are shown in red, and these auctions tend to have both larger-than-average offering amounts and lower-than-average bid-to-cover ratios compared to the security-term and fiscal-year average.
Figure 18: Treasury Note and Bond Auctions Fiscal Years 2014–2025, Deviations from Security-Term and Fiscal-Year Average Offering Amount and Bid-to-Cover Ratio (Controlling for Security-Term and Fiscal-Year Fixed Effects)
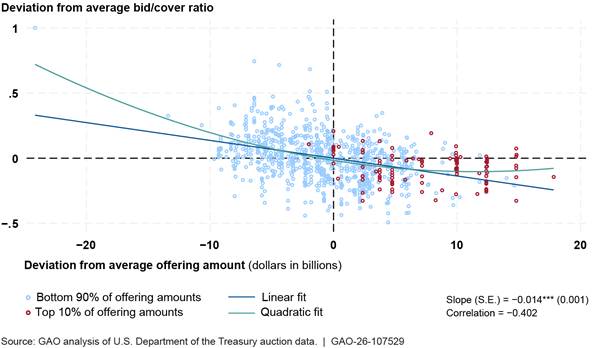
GAO Contact
James R. McTigue, Jr. at McTigueJ@gao.gov
Staff Acknowledgements
In addition to the contact named above, Margaret McKenna Adams (Assistant Director), Bryan Sakakeeny (Analyst-in-Charge), Pin-En Annie Chou, Mikayla Ferg, Rob Gebhart, Alice Lin, Matthew Naven, Dylan Stagner, Alicia White, and Mercedes Wilson-Barthes made key contributions to this report.
The Government Accountability Office, the audit, evaluation, and investigative arm of Congress, exists to support Congress in meeting its constitutional responsibilities and to help improve the performance and accountability of the federal government for the American people. GAO examines the use of public funds; evaluates federal programs and policies; and provides analyses, recommendations, and other assistance to help Congress make informed oversight, policy, and funding decisions. GAO’s commitment to good government is reflected in its core values of accountability, integrity, and reliability.
Obtaining Copies of GAO Reports and Testimony
The fastest and easiest way to obtain copies of GAO documents at no cost is through our website. Each weekday afternoon, GAO posts on its website newly released reports, testimony, and correspondence. You can also subscribe to GAO’s email updates to receive notification of newly posted products.
Order by Phone
The price of each GAO publication reflects GAO’s actual cost of production and distribution and depends on the number of pages in the publication and whether the publication is printed in color or black and white. Pricing and ordering information is posted on GAO’s website, https://www.gao.gov/ordering.htm.
Place orders by calling (202) 512-6000, toll free (866) 801-7077,
or
TDD (202) 512-2537.
Orders may be paid for using American Express, Discover Card, MasterCard, Visa, check, or money order. Call for additional information.
Connect with GAO
Connect with GAO on X,
LinkedIn, Instagram, and YouTube.
Subscribe to our Email Updates. Listen to our Podcasts.
Visit GAO on the web at https://www.gao.gov.
To Report Fraud, Waste, and Abuse in Federal Programs
Contact FraudNet:
Website: https://www.gao.gov/about/what-gao-does/fraudnet
Automated answering system: (800) 424-5454
Media Relations
Sarah Kaczmarek, Managing Director, Media@gao.gov
Congressional Relations
David A. Powner, Acting Managing Director, CongRel@gao.gov
General Inquiries
[1]Congressional Budget Office, The Budget and Economic Outlook 2026 to 2036 (February 2026).
[2]This amount is net interest spending, which largely reflects the interest paid to the holders of debt that Treasury issues to the public, minus certain income from government loans and other sources.
[3]World Bank-International Monetary Fund, Revised Guidelines for Public Debt Management (April 2014).
[4]The Federal Reserve System consists of the Board of Governors of the Federal Reserve System, 12 regional Federal Reserve Banks, and the Federal Open Market Committee.
[5]See GAO, The Nation’s Fiscal Health: Strategy Needed as Debt Levels Accelerate, GAO‑25‑107714 (Washington, D.C.: Feb. 5, 2025); Debt Limit: Statutory Changes Could Avert the Risk of a Government Default and Its Potentially Severe Consequences, GAO‑25‑107089 (Washington, D.C.: Dec. 11, 2024); Federal Debt Management: Treasury Quickly Financed Historic Government Response to the Pandemic and is assessing Risks to Market Functioning, GAO‑21‑606 (Washington, D.C.: Aug. 17, 2021); and Federal Debt Management: Treasury Should Strengthen Policies for Market Outreach and Analysis to Maintain Broad-Based Demand for Securities, GAO‑20‑131 (Washington, D.C.: Dec. 5, 2019).
[6]This report focuses on marketable Treasury securities. Marketable Treasury securities can be resold or transferred to other investors and can be sold before they mature. Treasury also issues nonmarketable Treasury securities, which cannot be resold or transferred. As of September 30, 2025, marketable Treasury securities comprised about 98 percent of debt held by the public.
[7]“Quarterly Refunding,” Financing the Government, Treasury, accessed July 31, 2025, https://home.treasury.gov/policy‑issues/financing‑the‑government/quarterly‑refunding.
[8]Carol Bertaut, Bastian von Beschwitz, and Stephanie Curcuru, “The International Role of the U.S. Dollar – 2025 Edition,” Board of Governors of the Federal Reserve System, (July 18, 2025), https://doi.org/10.17016/2380-7172.3856.
[9]See GAO, America’s Fiscal Future, https://www.gao.gov/americas‑fiscal‑future.
[10]In the budget, spending on net interest largely reflects the interest paid to holders of the debt that Treasury issues to the public. It is the government’s cost of financing the debt held by the public minus certain income from loans and other sources.
[11]World Bank-International Monetary Fund, Revised Guidelines on Public Debt Management (April 2014).
[12]The debt limit is a legal limit on the total amount of federal debt that can be outstanding at one time. The debt limit is codified at 31 U.S.C. § 3101(b), as amended, and primarily applies to federal debt issued pursuant to authority under 31 U.S.C. chapter 31. A small amount of total federal debt is not subject to the debt limit.
[13]For example, see Scott Bessent to the Honorable Mike Johnson (June 25, 2025) at https://home.treasury.gov/system/files/136/Debt-Limit-Letter-to-Congress-06-25-2025.pdf.
[14]The Treasury General Account is used to deposit government receipts, including tax payments, and to pay government obligations. Treasury’s cash balance policy during normal conditions is to hold enough money to meet one week’s worth of government obligations, subject to a minimum balance of roughly $150 billion. Government obligations are specifically measured as net fiscal outflows and the gross volume of maturing marketable debt.
[15]U.S. Department of the Treasury, Final Monthly Treasury Statement for Fiscal Year 2025 Through September 30, 2025 (October 2025).
[16]Congressional Budget Office, The Budget and Economic Outlook 2026 to 2036 (February 2026). Average deficits from fiscal years 2015 through 2024 include previously record-high deficits in fiscal years 2020 and 2021 during the COVID-19 pandemic.
[17]Treasury Quarterly Release Data, accessed November 21, 2025, https://home.treasury.gov/policy‑issues/financing‑the‑government/quarterly‑refunding/most‑recent‑quarterly‑refunding‑documents.
[18]GAO, Financial Audit: Bureau of the Fiscal Service’s FY 2025 and FY 2024 Schedules of Federal Debt, GAO‑26‑107908 (Washington, D.C.: Jan. 20, 2026). Interest expense on debt held by the public includes interest paid on marketable and nonmarketable Treasury securities.
[19]Treasury, Remarks by Assistant Secretary for Financial Markets Joshua Frost on Principles of U.S. Debt Management Policy (July 11, 2024).
[21]For example, the last new product types were the Floating Rate Note in 2014 and Treasury Inflation Protected Securities in 1997. Since fiscal year 2020, Treasury added 6-week bills,17-week bills and the 20-year bond as new maturities to its existing security types. In April 2024, TBAC reported to Treasury on potential market demand for adding a 1-year floating rate note and 3-year Treasury Inflation Protected Securities to the existing maturity offerings of those products. See Treasury Borrowing Advisory Committee, TBAC Charge (April 2024).
[22]Treasury Borrowing Advisory Committee, TBAC Charge (April 2024). TBAC assessed potential new security types, including callable bonds (bonds that the issuer can decide to redeem before their contractual maturity date) and green bonds (bonds issued to fund projects with environmental benefits).
[23]Inter-Agency Working Group for Treasury Market Surveillance, Recent Disruptions and Potential Reforms in the U.S. Treasury Market: A Staff Progress Report (Nov. 8, 2021).
[24]The IAWG is made up of staff from Treasury, the Board of Governors of the Federal Reserve System, the Federal Reserve Bank of New York, the Securities Exchange Commission, and the Commodity Futures Trading Commission.
[25]FINRA is a privately funded nongovernmental entity, referred to as a self-regulatory organization. FINRA is the largest independent regulator of securities firms doing business with the public in the United States. The Securities and Exchange Commission oversees FINRA’s operations and programs. In 2017, Treasury gained access to data on secondary market transactions as reported to FINRA by its broker-dealer members through the Trade Reporting and Compliance Engine.
[26]In 2024, FINRA implemented enhancements to Trade Reporting and Compliance Engine data, including publishing end-of-day transaction data that includes information on the security traded, price, and counterparty type, among other things.
[27]The October 2014 Treasury market disruption (referred to as the flash rally) led to a Joint Staff Report produced by IAWG member agencies. Among other things, the report recommended member agencies host a public-private sector conference addressing changes to the U.S. Treasury market and the effects on liquidity provision, risk management, and market participation. See Joint Staff Report: The U.S. Treasury Market on October 15, 2014 (July 13, 2015).
[28]See Inter-Agency Working Group for Treasury Market Surveillance, Enhancing the Resilience of the U.S. Treasury Market: 2024 Staff Progress Report (Sept. 20, 2024); Enhancing the Resilience of the U.S. Treasury Market: 2023 Staff Progress Report (Nov. 6, 2023); Enhancing the Resilience of the U.S. Treasury Market: 2022 Staff Progress Report (Nov. 10, 2022); Recent Disruptions and Potential Reforms in the U.S. Treasury Market: A Staff Progress Report (Nov. 8, 2021).
[29]Treasury followed a similar issuance strategy during the 2007-2009 financial crisis. See GAO, Debt Management: Treasury Was Able to Fund Economic Stabilization and Recovery Expenditures in a Short Period of Time, but Debt Management Challenges Remain GAO-10-498 (Washington, D.C.: May 18, 2010).
[31]Specifically, the regulations exempted government money market funds—which invest only in cash and U.S. government securities, including Treasury securities—from certain requirements because these assets are less risky and more liquid than other investments. 17 C.F.R. § 270.2a-7(c). These exemptions made government funds particularly attractive compared to other types of money market funds that were subject to additional requirements. As a result, many investors moved their investments from other types of money market funds into government money market funds.
[32]Office of Financial Research, Money Market Fund Monitor, accessed March 19, 2026, https://www.financialresearch.gov/money-market-funds/.
[33]A repurchase agreement is a financial transaction in which an institution borrows funds from an investor using a security as collateral and agrees to repurchase the security later for a higher price. The difference between the initial sale price and the repurchase price represents the interest paid on the loan. Repurchase agreements rely heavily on Treasury securities as collateral.
[34]See Treasury Borrowing Advisory Committee, TBAC Charge (July 2024).
[35]Treasury Borrowing Advisory Committee, Report to the Secretary of the Treasury from the Treasury Borrowing Advisory Committee (Aug. 1, 2023). TBAC generally recommends bills stay within a range of 15 to 20 percent of debt outstanding, with Treasury maintaining flexibility in the exact share as financing conditions change.
[36]See Treasury Borrowing Advisory Committee, TBAC Charge (Nov. 2025) TBAC used the Optimal Debt Model, which it first published in 2018, to assess Treasury’s current issuance strategy against a range of potential future economic scenarios. The Optimal Debt Model has certain limitations for debt managers to consider when assessing the model’s output and is one of many tools that Treasury can use to inform its issuance decisions.
[37]When federal spending equals or exceeds revenues, increasing the cash balance in the Treasury General Account typically requires borrowing from the public, and therefore increases Treasury’s borrowing need. Conversely, a reduction in the cash balance would decrease Treasury’s borrowing need.
[38]Borrowing needs were 40 percent of GDP in fiscal year 2020, the highest during the period we analyzed. This was due to a combination of large borrowing to finance the federal government’s response to the COVID-19 pandemic and offset lower revenues, and lower GDP growth as the pandemic temporarily slowed economic activity.
[39]We calculate average bill auction sizes as a 13-week moving average of auction sizes for all bill maturities that are auctioned weekly. We exclude the 52-week bill from this calculation because it is auctioned on a different schedule (every 4 weeks). Cash management bills are also excluded.
[40]We calculate average note and bond auction sizes as a 6-month moving average of auction sizes. The change in average bond auction sizes is obscured by the reintroduction of the 20-year bond in 2020 because it has lower auction sizes than the 30-year bond. Looking at the change in average 30-year bond auction sizes alone, they increased from $14 billion to $23 billion during this period (a 64 percent increase).
[41]For our prior work on Treasury’s introduction of floating rate notes, see Debt Management: Floating Rate Notes Can Help Treasury Meet Borrowing Goals, but Additional Actions Are Needed to Help Manage Risk, GAO‑14‑535 (Washington, D.C.: June 16, 2014).
[42]The bid-to-cover ratio excludes any auction purchases made by the Federal Reserve to roll over maturing holdings of Treasury securities by replacing maturing securities with securities issued at auction. Such purchases are treated as add-ons to announced auction sizes.
[43]For example, since there are 26 primary dealers as of January 2026, each primary dealer must bid for at least 1/26th of the auction offering amount.
[44]We calculate average bid-to-cover ratios as moving averages for each security type, weighted by offering amount.
[45]See Edward Gamber and John Seliski, “The Effect of Government Debt on Interest Rates,” Congressional Budget Office Working Paper Series, Working Paper 2019-01 (March 2019), and Arvind Krishnamurthy and Annette Vissing-Jorgensen, “The Aggregate Demand for Treasury Debt,” Journal of Political Economy (2012).
[46]The average note and bond auction size for fiscal year 2025 was over $45 billion, or about $12 billion larger than the average for the entire fiscal year 2014-2025 period. The actual average bid-to-cover ratio for note and bond auctions in fiscal year 2025 was 2.54, largely unchanged from the fiscal year 2014-2025 average.
[47]According to the Federal Reserve Bank of New York’s expectations for primary dealers, primary dealers’ bid prices should be reasonably competitive when compared to the range of rates trading in the when-issued market (where market participants can contract for the purchase and sale of a new security before it has been auctioned), taking into account market volatility and other risk factors.
[48]Treasury updates its yield curve rates daily, available at https://home.treasury.gov/policy‑issues/financing‑the‑government/interest‑rate‑statistics.
[49]A SOFR swap contract is a derivative used to acquire fixed interest payments that can be on a similar payment schedule as Treasury securities and with little risk of default. Because both SOFR swap rates and Treasury rates are influenced by investor expectations of future short-term interest rates, changes in the spread between the two rates can reflect changes in the demand for Treasury securities relative to other options. As such, SOFR swap rates make an informative comparison for interest rates on Treasury securities. The 10-year SOFR swap rate is the fixed interest rate a counterparty is willing to pay in exchange for receiving SOFR daily for 10 years. SOFR is the cost of borrowing cash overnight collateralized by Treasury securities. As of January 1, 2022, SOFR became adopted by the market as the benchmark interest rate for lending in U.S. dollars.
[50]Further, our August 2021 analysis of 5-year Treasury note yields compared to yields on another similar financial instrument—an overnight indexed swap —showed that the spread between these yields has been positive since 2010. See GAO‑21‑606.
[51]Zhengyang Jiang, Robert J. Richmond, and Tony Zhang, “Convenience Lost,” NBER Working Paper, No. 33940 (June 2025).
[52]We analyzed Treasury’s investor class data. Treasury’s Investor Class Auction Allotments data are available at https://home.treasury.gov/data/investor‑class‑auction‑allotments. Our analysis excludes any amounts awarded to the Federal Reserve. The Federal Reserve may purchase Treasury securities at auction to roll over maturing holdings of Treasury securities by replacing maturing securities with securities issued at auction. Any Federal Reserve purchases are in addition to what Treasury offers to private investors.
[53]For fixed income securities, prices and yields move inversely to each other. A lower price for a security means a higher yield, and vice versa.
[54]The average shares of auction awards for each investor class described in this section are moving averages. For bills, the average auction share is the percent of auction awards taken at bill auctions (excluding cash management bills) for the preceding 13 weeks. For notes, FRNs, TIPS notes, and TIPS bonds, it is the percent of auction awards taken at auctions of these security types for the preceding 6 months. For TIPS bonds, it is the percent of auction awards taken at TIPS bond auctions for the preceding 12 months.
[57]Department of the Treasury, Remarks by Assistant Secretary for Financial Markets Joshua Frost on Principles of U.S. Debt Management Policy (July 11, 2024).
[59]GAO, The Nation’s Fiscal Health: Effective Use of Fiscal Rules and Targets, GAO‑20‑561 (Washington, D.C.: Sept. 23, 2020).
[61]GAO, Debt Limit: Market Response to Recent Impasses Underscores Need to Consider Alternative Approaches, GAO‑15‑476 (Washington, D.C.: July 9, 2015).
[63]Carol Bertaut, Bastian von Beschwitz, and Stephanie Curcuru, “The International Role of the U.S. Dollar – 2025 Edition,” Board of Governors of the Federal Reserve System, (July 18, 2025), https://doi.org/10.17016/2380‑7172.3856.
[66]The Federal Reserve System consists of the Board of Governors of the Federal Reserve System, 12 regional Federal Reserve Banks, and the Federal Open Market Committee. All data in this appendix on Treasury securities holdings are from the Financial Accounts of the United States (Z.1) data published by the Board of Governors of the Federal Reserve System, unless otherwise noted.
[67]Holdings of Treasury securities are shown as market value for most sectors in the data, while other sectors are shown at book value (including total outstanding marketable Treasury securities issued by the federal government). As a result, there is a discrepancy in the data between total marketable Treasury securities outstanding and total holdings of investors, due to valuation differences. As of September 2025, the sum of all holdings of Treasury securities (with some showing market value others showing book value) was about $28 trillion, while total marketable Treasury securities outstanding was about $29.6 trillion. In this appendix, shares of different sectors’ holdings are calculated as a percent of total holdings, unless otherwise noted.
[68]The Federal Reserve conducts monetary policy to promote maximum employment, stable prices, and moderate long-term interest rates. As part of this, the Federal Reserve may buy and sell Treasury securities in the secondary market and roll over its holding of Treasury securities at auction as a noncompetitive bidder (meaning it agrees to accept the rate, yield, or discount margin determined at auction). To roll over its holdings of Treasury securities, the Federal Reserve places noncompetitive bids at Treasury auctions equal to the value of its maturing holdings. These bids are treated as add-ons to announced auction sizes. On the auction settlement date, the maturing Treasury securities are exchange for newly issued Treasury securities.
[69]In January 2022, the Federal Reserve announced plans to reduce the size of its balance sheet. The Federal Reserve said it intended to reduce its securities holdings (including Treasury securities) over time in a predictable manner, while, over time, maintaining securities holdings in amounts needed to implement monetary policy efficiently and effectively. Federal Open Market Committee, Principles for Reducing the Size of the Federal Reserve’s Balance Sheet (Jan. 26, 2022).
[70]Federal Reserve, Federal Open Market Committee Statement (Oct. 29, 2025).
[71]Countries that are members of the International Monetary Fund are obligated to promote a stable system of exchange rates. Foreign central banks often act to limit the impact of exchange rate fluctuations and maintain the stability of their currency. For example, a fall in U.S. interest rates tends to reduce the demand for dollars as private investors seek higher-yielding assets abroad. In response to their currency appreciating in value relative to the dollar, foreign central banks buy dollars—often investing those dollars in Treasury securities—and sell their own currency on foreign exchange markets, which reduces the demand for—and hence the value of—their own currency relative to the dollar. Conversely, when U.S. interest rates increase, dollar-denominated assets become more attractive to private investors seeking higher yields, which increases the value of the dollar relative to other currencies. In response, foreign central banks may sell Treasury securities to help stabilize their exchange rates. See GAO‑20‑131.
[72]U.S. Department of the Treasury, “Major Foreign Holders of Treasury Securities,” accessed March 20, 2026, ticdata.treasury.gov/resource‑center/data‑chart‑center/tic/Documents/slt_table5.html.
[73]We also included closed-end fund holdings in our analysis of investment funds.
[74]Money market fund holdings of Treasury securities are shown at book value.
[75]Foreign hedge fund holdings are usually included in the foreign investor sector.
[76]Daniel Barth, Daniel Beltran, Matthew Hoops, Jay Kahn, Emily Liu, and Maria Perozek, “The Cross-Border Trail of the Treasury Basis Trade,” Board of Governors of the Federal Reserve System, (Oct. 15, 2025), https://doi.org/10.17016/2380-7172.3939. Specifically, if the Treasury securities holdings of hedge funds domiciled in the Cayman Islands are not captured in the foreign sector, they will end up residually in the household sector. This data gap is being actively investigated, according to the research note.
[77]The hedge funds sector has not been fully incorporated in the regular Financial Accounts of the United States publication.
[78]Financial Stability Oversight Council, 2025 Annual Report (Dec. 11, 2025).
[79]GAO‑20‑131. Reforms following the financial crisis increased demand from large banking institutions for Treasury securities. For example, the Liquidity Coverage Ratio requires large banking institutions to hold a certain amount of high-quality liquid assets (including Treasury securities) to ensure they can cover short-term cash needs.
[80]For bills, we drop the 4-week bill auctions on September 22nd, 2015, September 29th, 2015, October 6th, 2015, and October 14th, 2015, due to abnormally high bid-to-cover ratios. These auctions occurred during a debt limit impasse very close to the x-date and Treasury dramatically cut auction sizes to preserve headroom under the debt limit.
[81]Note that this is subtly different than the deviation from the average for a given fiscal-year-by-security term. We remove the average in a given fiscal year and remove the average for a given security term (after accounting for any overlap to avoid double counting), but we do not remove the average for a given security term in a given fiscal year.