Report to Congressional Requesters
United States Government Accountability Office
A report to congressional requesters
For more information, contact: Andrew Von Ah at vonaha@gao.gov.
What GAO Found
Telework rates spiked during the pandemic and remain, on average, about twice 2019 levels across large, medium, and small communities (i.e., more than 50,000 people). GAO found that increases in telework—which were, on average, highest in large communities with populations of 1 million or more—contributed to changes in transit, vehicle use, and real estate, primarily in large communities. Changes included decreased transit ridership and fare revenue; new vehicle travel patterns, such as when and where people traveled; and a shift in demand for commercial real estate and housing away from some central business districts, according to 352 Metropolitan Planning Organizations (MPO) that responded to GAO’s survey and studies GAO reviewed.
Most MPOs reported that they or others in their communities, such as transit providers, took actions related to transit, vehicle use, and housing to respond to these changes. For example, over half of MPOs reported that transit providers in their communities improved or increased service to attract riders. However, across the 26 largest transit cities, one had ridership levels in 2024 that surpassed 2019 levels.
Many MPOs reported taking steps to understand new transportation trends that can help them accurately forecast travel demand to support transportation plans. For example, a majority of MPOs reported surveying transit riders to understand transit needs in their communities. Yet, about one-third of MPOs reported they do not intend, or know how, to incorporate information on telework into their planning. More than 90 percent of MPOs expressed a desire for more guidance on this from the Department of Transportation (DOT). Federal law directed DOT to conduct a travel demand study by November 2023 and develop guidance to help MPOs forecast travel demand and prioritize transportation investments. DOT cited resource constraints and noted the complex and continuous nature of this effort. It has started addressing the requirements, such as contracting with private firms to help develop best practices. However, DOT did not have a plan or timeline for completion. Doing so could help provide a basis for DOT to monitor its progress and adjust efforts as needed. Fully addressing the required study and guidance would also help MPOs navigate changes related to telework and improve forecasts for prioritizing communities’ transportation investments.
Why GAO Did This Study
MPOs are responsible for short- and long-term transportation planning in urbanized areas with populations of over 50,000—a process that DOT oversees.
GAO was asked to review the effects of telework on public transit, vehicle use, and real estate. GAO focused its review on communities within the boundaries of all 410 MPOs from 2019 through March 2025. This report addresses, among other things, how changes in telework affected public transit, vehicle use, and real estate; actions communities have taken in response; and the extent to which communities and DOT incorporated changing travel trends into forecasting and planning.
GAO analyzed telework and transportation data from 2019 through 2024 (the latest available data); surveyed 410 MPOs (with an 86 percent response rate); reviewed relevant federal laws and agency documents; conducted a literature review; and conducted interviews, including some in-person interviews, of agency officials and nine MPOs—selected based on size, location, and transit offerings.
What GAO Recommends
GAO recommends that DOT establish and implement a detailed plan—that contains clear steps and timelines—to complete the required travel demand data and modeling study, and guidance based on information in the study. DOT concurred with GAO’s recommendation.
Abbreviations
ACS American Community Survey
Bureau Census Bureau
Commerce Department of Commerce
DOT Department of Transportation
FHWA Federal Highway Administration
FTA Federal Transit Administration
IIJA Infrastructure Investment and Jobs Act
MPO Metropolitan Planning Organization
NTD National Transit Database
PUMA Public Use Microdata Area
PUMS Public Use Microdata Sample
This is a work of the U.S. government and is not subject to copyright protection in the United States. The published product may be reproduced and distributed in its entirety without further permission from GAO. However, because this work may contain copyrighted images or other material, permission from the copyright holder may be necessary if you wish to reproduce this material separately.
March 11, 2026
Congressional Requesters
The COVID-19 pandemic brought about sudden and substantial changes to the lives of millions living and working in communities across the U.S. Starting in early 2020, many offices and businesses allowed employees to telework, which helped their employees stay safe and ensured the continuity of business operations. In response, rates of workers who primarily teleworked more than tripled from an estimated 5.7 percent in 2019 to 17.9 percent in 2021, according to data from the American Community Survey (ACS).[1] Increases in telework rates early in the pandemic also coincided with other changes in communities that were widely reported. These changes included decreased vehicle traffic, nearly empty transit vehicles, and an exodus of workers from some city centers to communities that offered more space or were more affordable.
Metropolitan Planning Organizations (MPO) are responsible for conducting short- and long-term transportation planning in communities with populations above 50,000.[2] Within the Department of Transportation (DOT), the Federal Highway Administration (FHWA) and Federal Transit Administration (FTA) oversee the metropolitan transportation planning process.
You asked us to examine various issues related to increased telework and its effects. We issued the first in a series of three reports in July 2023 on changes in telework before and during the pandemic, as well as telework’s impact on worker productivity and employer performance.[3] In May 2025, we issued a second report examining the views of private sector employers and employees on the benefits and challenges of telework.[4] This third and final report examines the effects of telework on communities from 2019 through 2024, including on public transit, vehicle use, and real estate (i.e., housing and commercial real estate).
This report addresses (1) changes in telework rates across communities from 2019 through 2024; (2) how changes in telework affected public transit, vehicle use, and real estate within those communities; (3) actions communities have taken in response to changes in their community and continued challenges; and (4) the extent to which communities and DOT have taken steps to incorporate changing travel trends into forecasting and planning.[5]
For all objectives, we interviewed DOT officials, including from FHWA and FTA, and 23 stakeholders, including MPOs (nine), transit agencies (seven), industry associations (five), and state and local governments (two).[6] We selected MPOs and transit agencies to obtain a range based on size, location, and types of transit offered (e.g., rail and bus). We selected industry associations that could speak to our topics and based on inclusion in prior GAO work, among other things. In this report, we refer to a “few” stakeholders if representatives from two to three entities expressed the view, “some” if representatives from four to five entities expressed the view, and “many” if representatives from six or more entities expressed the view. While the results of our interviews are non-generalizable, the information obtained from these stakeholders provided illustrative examples in our report.
To address the first objective, we accessed ACS data on the number of people who primarily worked from home for calendar years 2019, and 2021 through 2024, the most recent data available when we completed our analysis in December 2025.[7] From this dataset, we defined teleworkers who primarily worked from home as those who indicated they “worked from home” in response to the question “how did you usually get to work in the last week?” (i.e., at least 3 days that week).[8] To calculate telework rates for each community, we estimated the proportion of each Public Use Microdata Area (PUMA) that fell within the geographic boundary of that community. All margins of error on our ACS estimates in this report are presented at the 95 percent confidence level. We assessed the reliability of the ACS data by reviewing documentation and interviewing Bureau officials, among other things. We determined the data were sufficiently reliable to estimate telework rates.
For the remaining objectives, we conducted a population survey of all 410 MPOs from March through May 2025. In the survey, we asked MPOs about (1) planning activities; (2) changes to public transit and vehicle use; (3) actions taken with respect to public transit, vehicle use, and housing; (4) the extent to which telework was a contributing factor to any changes or actions; (5) federal assistance; and (6) anticipated changes, from 2019 through March 2025.[9] We received responses from 352 MPOs for an 86 percent response rate.[10] Because MPOs responded on behalf of their respective communities, we attribute the survey results to the MPOs. We also analyzed federal data from (1) FTA’s National Transit Database (NTD) on public transit ridership, service, and funding from fiscal years 2019 through 2024; (2) FHWA’s Traffic Volume Trends on vehicle miles traveled from calendar years 2019 through 2024; and (3) ACS data on the number of drivers by hour of the day and on average driver commute times for calendar years 2019, and 2021 through 2024.[11] These were the most recent data available when we completed our analyses in December 2025. To assess the reliability of the three data sources, we reviewed documentation, among other things. We determined the data were reliable for describing high-level transportation trends from 2019 through 2024.
We also reviewed relevant peer-reviewed empirical research studies published from January 2019 through August 2024 to understand the effects of telework on public transit, vehicle use, and real estate. Of the 18 studies that met our standards for inclusion, nine examined the effects of telework on public transit, six on vehicle use or emissions, and five on housing.
To assess the extent to which communities and DOT took steps to incorporate changing travel trends into forecasting and planning, we reviewed federal laws, regulations, and DOT documentation and guidance for MPOs on developing travel demand models and forecasts, and reviewed industry publications. We also assessed FHWA’s progress on a relevant study required by the Infrastructure Investment and Jobs Act (IIJA). See appendix I for additional information on our objectives, scope, and methodology.
We conducted this performance audit from April 2024 to March 2026 in accordance with generally accepted government auditing standards. Those standards require that we plan and perform the audit to obtain sufficient, appropriate evidence to provide a reasonable basis for our findings and conclusions based on our audit objectives. We believe that the evidence obtained provides a reasonable basis for our findings and conclusions based on our audit objectives.
Background
Characteristics of MPOs
The nation’s 410 MPOs provide a forum for local governments, transit agencies, and the public to participate in a collaborative planning process to address local transportation needs. MPOs, which are federally mandated, work with local governments, state DOTs, transportation providers, and others to carry out the transportation planning process in urbanized areas with populations of more than 50,000.[12]
MPO planning areas can vary greatly with respect to size, governance structure and responsibilities, and type and number of public transit providers within their boundaries. About 47 percent of all 410 MPOs represent “small” communities with populations of 50,001 to 200,000; 40 percent of MPOs represent “medium” communities with populations of 200,001 to 999,999; and 13 percent of MPOs represent “large” communities with populations of 1 million or more (see fig. 1). Large MPOs represent about two-thirds of the population across all MPOs; medium MPOs represent about a quarter of the MPO population; and small MPOs represent less than 10 percent of the MPO population. The largest MPO represents almost 19 million residents across almost 39,000 square miles in Southern California. By contrast, one small MPO encompassing Enid, Oklahoma has a population of about 50,000 and covers less than 100 square miles. With respect to structure, some MPOs are independent organizations, whereas others are part of a state, county, or city government.
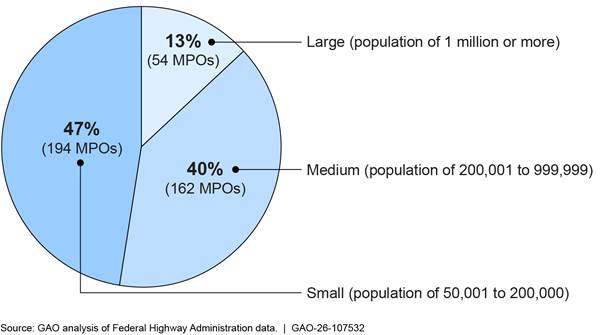
Note: One MPO in our analysis serves a population below 50,001, which we categorized as small. It is one of two MPOs serving a single urbanized area extending into three states, in agreement between the relevant Governors and local officials.
MPO Responsibilities
All MPOs have the same basic planning requirements set forth in statute, including to produce long-range (20-year) Metropolitan Transportation Plans and short-range (4-year) Transportation Improvement Programs.[13] Generally, only projects that are included in an MPO’s Transportation Improvement Program are eligible to receive certain federal transportation funding.[14] When developing these transportation plans, MPOs must consider, among other factors, whether proposed transportation projects:
· support the economic vitality of the metropolitan area, especially by enabling global competitiveness, productivity, and efficiency;
· increase the safety of the transportation system for motorized and nonmotorized users;
· protect and enhance the environment, promote energy conservation, improve the quality of life, and promote consistency between transportation improvements and state and local planned growth and economic development patterns; and
· increase the accessibility and mobility of people and freight.[15]
To create these transportation plans, MPOs may use a variety of models, forecasts, or other analyses. For example, some MPOs use travel demand models to forecast future travel demand. The models may provide information on things like how population growth and operational investments will affect the transportation system. These models can be complex and require extensive and current information on roadway and transit system characteristics and operations, as well as current and forecasted demographic information.
Some MPOs also have additional planning requirements. For example, MPOs serving medium or large communities are responsible for helping to identify actions and strategies to reduce traffic congestion through the congestion management process.[16] While not necessarily specific to population size, some MPOs are also designated recipients of certain federal transit funds, meaning they have the authority to receive and dispense funds to eligible projects and recipients in their communities.[17]
Starting in fiscal year 2022, the IIJA also required MPOs to include housing considerations in the transportation planning process.[18] For example, MPOs are now required to promote consistency across state and local planned growth, housing, and economic development patterns. In doing so, MPOs are encouraged to consult with housing planning officials as part of the metropolitan planning process.
Federal Oversight of MPOs
Within DOT, FHWA and FTA oversee the metropolitan transportation planning process. For example, FHWA and FTA are responsible for working together to perform federal reviews certifying that each MPO serving a transportation management area has planned according to the applicable federal statutes.[19] Additionally, federal law requires both FHWA and FTA to apportion funds (i.e., distribute using formulas in statute) to support MPOs’ transportation planning efforts. For example, in fiscal year 2024, FHWA and FTA apportioned $615 million to support MPOs’ planning efforts (see fig. 2).[20]
Figure 2: Federal Highway Administration (FHWA) and Federal Transit Administration (FTA) Planning Funds for Metropolitan Planning Programs, Fiscal Years 2019–2024
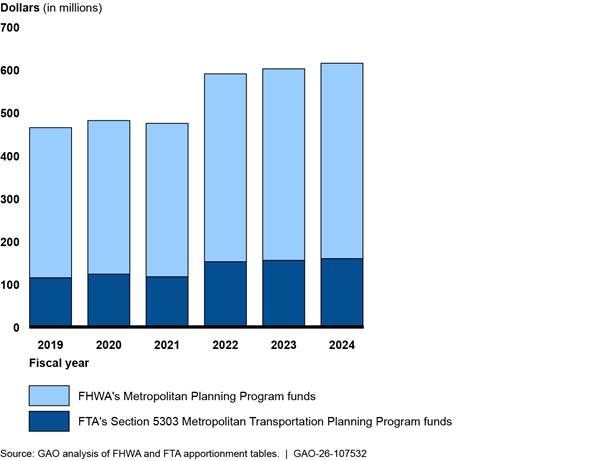
Note: FHWA and FTA apportion (i.e., distribute using formulas in statute) Metropolitan Planning Funds to states, which are generally required by statute to make the grant funding available to metropolitan planning organizations within their state. 23 U.S.C §§ 104(d)(1), 134(p) (FHWA); 49 U.S.C. §§ 5303(p); 5305(d)(1) (FTA).
National Telework Trends
The percentage of workers who telework was increasing steadily in the years prior to the pandemic, before spiking in 2021, and declining somewhat in later years. Specifically, according to ACS data, the percentage of workers who reported they primarily teleworked during the prior week more than tripled, from an estimated 5.7 percent in 2019 to 17.9 percent in 2021, before declining to 13.3 percent in 2024 (see fig. 3).
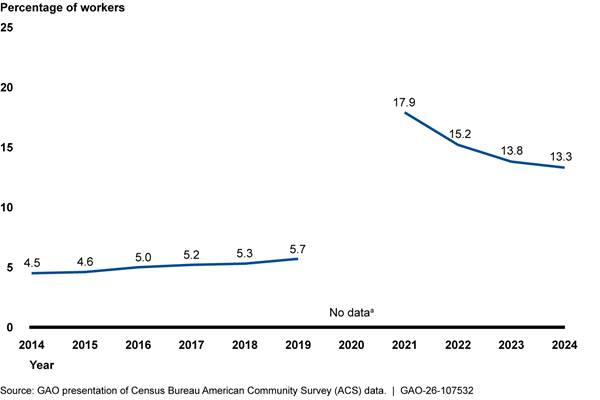
Note: Data come from the Census Bureau’s ACS 1-year estimates, Table S0801. Margins of error are within +/- 0.1, which the Census Bureau calculates at the 90 percent confidence level.
The Census Bureau estimated the percentages of workers who primarily worked from home based on their response to a question about their primary means of transportation to work over the past week. We defined teleworkers who primarily worked from home as those who selected “worked from home” in response to the question “how did you usually get to work in the last week?”.
aNo ACS data are shown for 2020 because the Census Bureau did not release 2020 ACS 1-year estimates due to the effect of the COVID-19 pandemic on data collection.
Increases in Telework Rates in Large Communities Were Significantly Higher Than in Small and Medium Communities
On average, the percentage of workers who teleworked during the pandemic and in subsequent years was significantly greater in large communities, compared to medium- and small-sized communities. For example, we estimated that, on average, telework rates in large communities increased from 6.2 percent in 2019 to 20.5 percent in 2021, before declining to 15.0 percent in 2024.[21] Estimated changes for medium and small communities were, on average, significantly smaller (see fig. 4). Even with the decreases since 2021, average estimated telework rates across all community sizes remained about twice pre-pandemic rates.[22]
Figure 4: Estimated Average Percentage of Workers Who Primarily Teleworked by Community Size, 2019–2024
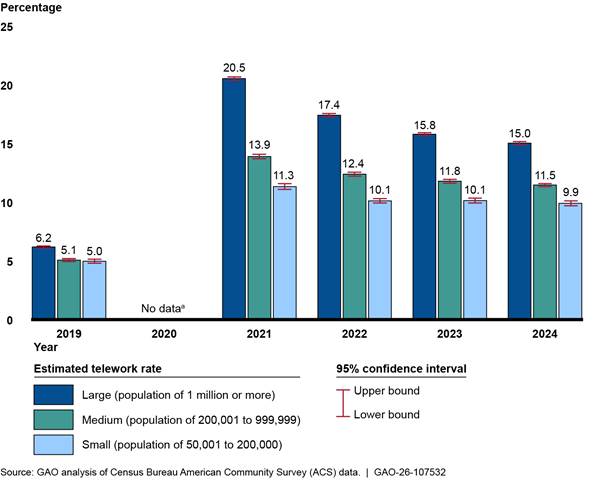
Note: We estimated the percentages of workers teleworking based on their response to a question about their primary means of transportation to work over the past week. We classified respondents who replied “worked from home” as teleworkers.
One MPO in our analysis serves a population below 50,001, which we categorized as small. It is one of two MPOs serving a single urbanized area extending into three states, in agreement between the relevant Governors and local officials.
All estimates presented in this figure have a margin of error within +/- 0.3 percentage points at the 95 percent confidence level.
aNo ACS data are shown for 2020 because the Census Bureau did not release 2020 ACS 1-year estimates due to the effect of the COVID-19 pandemic on data collection.
Within similar-sized communities, changes in telework rates also varied significantly across our review period (see fig. 5). For example, the estimated telework rate for the MPO encompassing Denver, Colorado, a large community, increased an estimated 13.6 percentage points from 2019 through 2024.[23] By contrast, the telework rate for the MPO encompassing another large community, New Orleans, increased an estimated 4.7 percentage points over the same period.[24] We also found significant variation within medium and small communities.
Figure 5: Changes in Estimated Percentage of People Who Primarily Teleworked in 2024, Compared to 2019, Across Large, Medium, and Small Communities
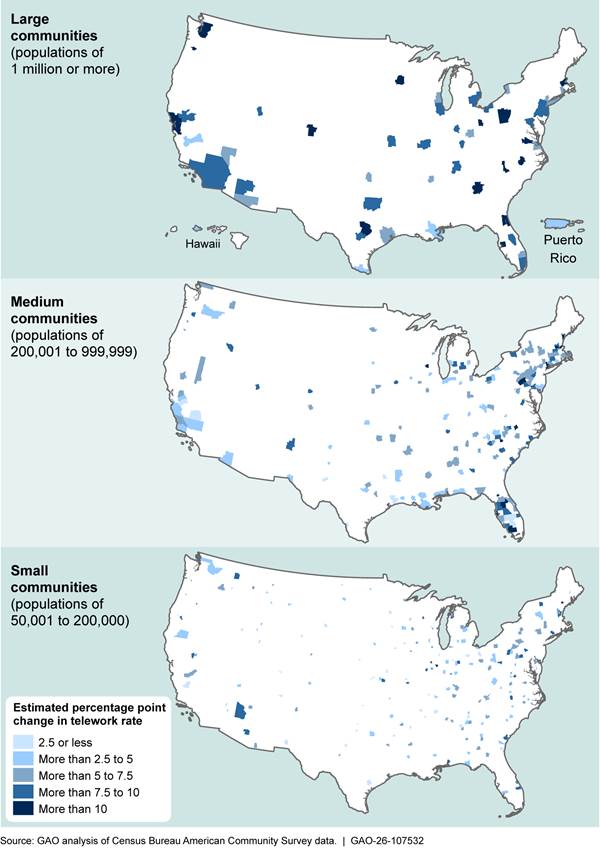
Note: Estimates reflect percentage-point changes in the share of workers who primarily teleworked between 2019 and 2024. Of the 410 communities analyzed, estimated changes were positive for 404. For six small communities, estimated changes were negative but not statistically significantly different from zero.
Respondents are identified as teleworking based on their response to a question about their primary means of transportation to work over the past week. Respondents who replied “worked from home” are classified as teleworkers.
One MPO in our analysis serves a population below 50,001, which we categorized as small. It is one of two MPOs serving a single urbanized area extending into three states, in agreement between the relevant Governors and local officials. Our figure does not include three MPOs (one medium, two small) in Alaska. Specifically, in 2024 relative to 2019, telework rates increased an estimated 6.0 percentage points in Anchorage, a medium MPO; 4.4 percentage points in MatSu Valley, a small MPO; and 4.3 percentage points in Fairbanks, a small MPO.
All estimates presented in this figure have margins of error that ranged from +/- 0.4 percentage points to +/-5.9 percentage points at the 95 percent confidence level.
In our prior report, we found that the percentage of workers who teleworked were concentrated among workers with higher earnings, more education, and in certain industries.[25] For example, we estimated that the percentage of workers in the lowest quartile of earnings who teleworked grew by about 6 percentage points from 2019 through 2021, compared to an estimated 25 percentage point growth for workers in the highest earnings quartile over that period. We also found that certain industries experienced much greater growth in telework rates from 2019 through 2021. For example, we estimated that telework rates in the information, finance, insurance, and real estate and rental and leasing industries increased about 30 percentage points from 2019 through 2021. This was compared to other industries, like construction and retail, that saw telework rates increase about 5 percentage points over this period.
In our current review, we found that in 2024, large communities, on average, had statistically significantly more workers with the characteristics associated with higher levels of telework. For example, we estimated that about 43 percent of workers in large communities had at least a bachelor’s degree compared to about 35 percent of workers in medium-sized communities and 32 percent of workers in small communities.[26] As illustrated in table 1 below, large communities also had, on average, a significantly higher percentage of workers with higher earnings and in industries with higher telework rates.
|
Community size |
Estimated percentage of workers with at least a bachelor’s degree |
Estimated percentage of workers in top earnings quartile |
Estimated percentage of workers in information, finance, or professional service industries |
|
Large |
43.3% |
25.7% |
23.3% |
|
Medium |
35.4% |
20.3% |
18.5% |
|
Small |
31.8% |
17.4% |
15.5% |
Source: GAO analysis of Census Bureau’s American Community Survey (ACS) data. | GAO‑26‑107532
Note: Large communities, medium communities, and small communities are represented by metropolitan planning organizations (MPO) and have populations of 1 million or more; 200,001 through 999,999; and 50,001 to 200,000, respectively. One MPO in our analysis serves a population below 50,001, which we categorized as small. It is one of two MPOs serving a single urbanized area extending into three states, in agreement between the relevant Governors and local officials.
ACS earnings estimates represent a person’s total income during the past 12 months. All earnings are reported in nominal dollars. Top earnings represent the percentage of workers that have earnings above $85,000, which is roughly the top earnings quartile at the national level. Reported earnings in ACS are capped between -$10,000 and $1,999,998.
Finance refers to the finance, insurance, and real estate and rental and leasing industry. Professional services refer to the professional, scientific, and management services industries.
All estimates presented in this table have a margin of error within +/- 0.5 percentage points at the 95 percent confidence level.
Increased Telework Contributed to Decreased Transit Ridership and New Patterns in Vehicle Use and Real Estate Demand
Increased Telework Contributed to Decreased Transit Ridership and Fare Revenue, Primarily in Large Communities
Transit ridership and fare revenue have declined from 2019 through 2024 in about half of the MPOs that responded to our survey. A greater percentage of large communities experienced this decline than medium- and small-sized ones (see table 2). For example, according to our survey, most MPOs in large communities (79 percent of 47) reported ridership declined. By contrast, about half or fewer MPOs in medium- and small-sized communities reported the same trend.[27] Regardless of size, MPOs more frequently reported commute transit trips declined (40 percent) compared to non-commute trips (28 percent).
Table 2: Percentage of Metropolitan Planning Organizations (MPO) That Reported Ridership or Fare Revenue Declined in 2024 Compared to 2019, by Community Size
|
Community size (number) |
Reported decline in ridership |
Reported decline in fare revenue |
|
Large (47) |
78.7% |
78.7% |
|
Medium (140) |
55.0% |
46.4% |
|
Small (165) |
41.2% |
37.0% |
Source: GAO survey of MPOs. | GAO‑26‑107532
Note: Our survey of 410 MPOs had an 86 percent response rate. Large communities, medium communities, and small communities are represented by MPOs and have populations of 1 million or more; 200,001 through 999,999; and 50,001 to 200,000, respectively.
One MPO in our analysis serves a population below 50,001, which we categorized as small. It is one of two MPOs serving a single urbanized area extending into three states, in agreement between the relevant Governors and local officials.
Transit data—which is available by urbanized area rather than MPO—quantify these ridership and fare revenue decreases by size of the urbanized area (see table 3).[28] Our analysis of NTD data shows that while transit agencies across urbanized areas of all sizes have, in aggregate, faced similar rates of decline in ridership, decreases in fare revenue from fiscal years 2019 through 2024 were at least 3 times greater in large, urbanized areas compared to medium- and small-sized ones.
Table 3: Total Decrease in Ridership and Fare Revenue by Size of Urbanized Area, Fiscal Years 2019–2024
|
|
Transit ridership |
Fare revenue |
||
|
Size of urbanized area |
Percentage change |
Change in ridership |
Percentage change |
Change in fare revenue |
|
Large |
-22.7% |
-2,013,781,615 |
-31.7% |
-$4,730,675,957 |
|
Medium |
-20.7% |
-131,633,727 |
-5.7% |
-$43,206,444 |
|
Small |
-21.0% |
-49,624,804 |
-9.3% |
-$24,596,521 |
Source: GAO analysis of National Transit Database data. | GAO‑26‑107532
Note: An urbanized area is a Census-designated area with a population of 50,000 or more. Large urbanized areas are represented by populations of 1 million or more, medium urbanized areas have populations of 200,001 through 999,999, and small urbanized areas have populations of 50,001 through 200,000.
Responses from our survey and review of empirical studies suggest that telework has contributed to decreased transit ridership and fare revenue in large communities, and to a lesser extent in medium and small communities.[29] For example, of the 37 MPOs in large communities that reported decreased ridership, 70 percent reported that telework was a contributing factor. A much smaller percentage of MPOs in medium and small communities reported that telework contributed to decreases in transit ridership (see table 4). Based on our review of nine empirical studies published between 2021 and 2024, we also found that increased telework rates were correlated with decreased transit ridership.[30] One of those studies also found a relationship between increased telework rates and decreased transit fare revenue across 217 metropolitan statistical areas.[31]
Table 4: Percentage (and Number) of Metropolitan Planning Organizations (MPO) That Identified Telework as a Factor Contributing to Decreased Ridership or Fare Revenue in 2024 Compared to 2019, by Community Size
|
Size of community |
Ridership |
Fare revenue |
|
Large |
70.3% (26) |
64.9% (24) |
|
Medium |
28.6% (22) |
33.9% (22) |
|
Small |
14.7% (10) |
18.0% (11) |
Source: GAO survey of MPOs. | GAO‑26‑107532
Note: Our survey of 410 MPOs had an 86 percent response rate. Large communities, medium communities, and small communities are represented by MPOs and have populations of 1 million or more; 200,001 through 999,999; and 50,001 to 200,000, respectively.
One MPO in our analysis serves a population below 50,001, which we categorized as small. It is one of two MPOs serving a single urbanized area extending into three states, in agreement between the relevant Governors and local officials.
While telework is likely one factor, it is not the only factor affecting transit ridership and fare revenue. Many of the stakeholders we interviewed, including MPOs, transit agencies, and others, cited additional factors that have affected transit ridership and fare revenue, including transit workforce issues and some workers’ commuting preferences to drive their personal vehicles because of concerns over their personal safety on public transit. For example, representatives from one transit agency in Denver said they have faced challenges hiring and retaining a sufficient number of bus drivers during the pandemic and through 2024. As a result, the agency had struggled to maintain on-time performance, a factor they said had likely contributed to reduced ridership.
Vehicle Traffic Returned to or Exceeded 2019 Levels in Many Communities, with Telework Contributing to New Vehicle Travel Patterns
About two-thirds of MPOs we surveyed reported that vehicle miles traveled in their communities had returned to or surpassed 2019 levels in 2024. These results are consistent with nationwide trends. Data from FHWA confirm that after a decline in 2020, total vehicle miles traveled have increased each year (see fig. 6). Vehicles miles traveled surpassed 2019 levels (3.26 trillion) for the first time in 2024 (3.28 trillion).
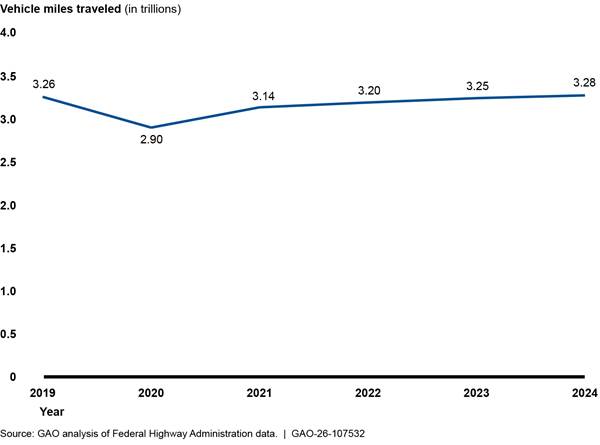
While the number of vehicle trips in 2024 also returned to or surpassed pre-pandemic levels, we found that trip characteristics had changed. In particular, we found that while some vehicle commute trips decreased, non-commute vehicle trips increased, indicating a shift in trip purpose.
· Commute trips. Almost half of MPOs in large communities (49 percent) reported that the number of commutes decreased in 2024, compared to 2019. A smaller percentage of MPOs in medium (30 percent) and small (24 percent) communities also reported this. ACS data also suggest that the total number of people driving to work in 2024 decreased during the morning rush hours, compared to 2019.[32] In our interviews, many stakeholders told us that commuting times had changed, and ACS data suggest more people drove to work in the late morning.[33]
· Non-commute trips. The number of non-commute trips increased or stayed the same across most communities (62 percent), according to our survey. More MPOs in large communities (62 percent) reported an increase in non-commute trips, compared to medium (39 percent) and small (30 percent) communities.
According to our survey and review of empirical studies, telework is likely a contributing factor to the shift from commute to non-commute trips, as well as the change in commute times. Of the 103 MPOs that reported that commute trips decreased, 91 percent identified telework as a contributing factor. Further, of the 133 MPOs that reported that non-commute trips increased, 41 percent identified telework as a contributing factor. Representatives we interviewed from an MPO industry association told us that many non-commute trips previously occurred in tandem with workers’ commutes. For example, someone may have previously taken their children to school on their way to work. With telework, that worker may no longer be going to an office every day, but they still travel for school drop-off.
Many stakeholders we interviewed, including MPOs, also told us that the flexibility that generally accompanies telework extends to when workers commute to and from the office. With that flexibility, those stakeholders explained, some workers commute later in the morning to avoid peak congestion times or work from home on busier commuting days. Four recently published empirical studies we reviewed also found that increased telework was correlated with fewer commuters during rush hour.[34]
These changes in travel patterns, such as having fewer people driving to work during rush hours in 2024 compared to 2019, may have contributed to small reductions in transportation-related greenhouse gas emissions, particularly in large communities. For example, our analysis of ACS data found that large communities had, on average, a 3.7 percent drop in the number of drivers during the morning rush hours in 2024, compared to 2019.[35] This decrease could contribute to a reduction in greenhouse gas emissions. Further, 38 percent of surveyed large MPOs reported that telework supported their region’s goals for reducing transportation-related greenhouse gas emissions.
Telework Has Shifted Demand for Commercial Real Estate and Housing Away from Some Central Business Districts
Prior GAO reports and interviews with stakeholders for this review suggest that increased telework since 2019 contributed to a shift in demand for commercial real estate and residential housing away from some central business districts.[36]
· Commercial Real Estate. In 2024, we reported that from August 2022 through January 2024, prices dropped for all commercial property types—i.e., office, multi-family, retail, and lodging—except industrial properties.[37] Those decreases were primarily driven by the pandemic-spurred shift to remote work and a rapid increase in interest rates. Office properties in central business districts, which have been disproportionately affected by remote work, saw the largest declines in prices. We also reported that, in September 2023, prices of office properties outside six metropolitan central business districts surpassed prices within those districts.[38] Some MPOs we interviewed confirmed that commercial real estate demand was highest in the suburbs and in mixed-use downtown neighborhoods outside of central business districts with both business and residential properties.
On the other hand, representatives from one MPO we interviewed that includes San Francisco, California, reported that high office vacancy rates in central business districts have created new opportunities for small businesses and non-profit organizations. According to that MPO, in 2019, it would have been inconceivable for small businesses and nonprofits to afford downtown real estate, but the pandemic and increased telework—and the subsequent decline in prices—reset real estate prices for new market entrants.
· Housing. Telework has contributed to rising rental and home prices outside of central business districts since 2019, according to our review of empirical studies and interviews with stakeholders. Four empirical studies found that increases in telework were correlated with increases in home prices outside of central business districts.[39] These findings were consistent with statements from many stakeholders we interviewed, including MPOs, a state DOT, and an industry association representing real estate agents. Moreover, according to some of these stakeholders, the higher home prices were due, in part to, more people—such as those migrating from other areas—seeking housing further from central business districts.
Some stakeholders we spoke with also said that workers who can telework have more flexibility in where they choose to live. As a result, these teleworkers are using this flexibility to move further from their employers. For example, representatives from one MPO told us that their community experienced a “boom” in new residents moving from a larger, nearby metropolitan area due to telework. According to these representatives, teleworkers are willing to commute longer distances if they only commute once or twice per week. Additionally, a recent survey conducted by an industry association representing real estate agents found that peoples’ willingness to commute longer distances and the distances they moved from their previous home increased during the pandemic, when telework rates spiked.[40]
Communities Took Many Actions to Respond to Changes, but Some Transit Agencies Continue to Face Reduced Ridership and Revenue
MPOs and Others Responded to Changes in Public Transit, Vehicle Use, and Housing, Especially in Large Communities, with Varying Success
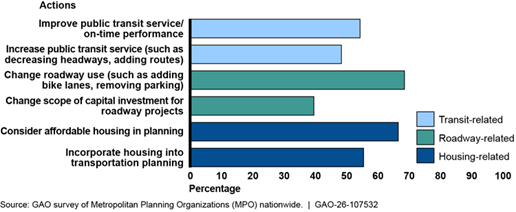
Most MPOs that responded to our survey reported that they or others in their communities, such as a transit provider, took action to respond to changes in public transit, vehicle use, and housing. Specifically, at least 80 percent of MPOs that responded to our survey reported one or more actions in each of these three areas. While MPOs and other stakeholders we interviewed indicated that some of these actions were already planned or underway before the pandemic, others were taken in response to changes in their communities, such as increases in telework rates, population migrations, or new travel patterns.
Public Transit
Eighty-six percent of survey respondents reported that they or transit providers in their communities took at least one action related to public transit since 2019, and another 9 percent reported that at least one of those actions was being considered. These actions included altering service or fares and identifying new funding sources (see fig. 7). Many of these actions were designed to bring back or attract new riders, whereas other actions were taken to avoid budget shortfalls or to respond to changing travel demand. According to NTD data, these actions had varying levels of success increasing ridership or revenue towards 2019 levels.
Figure 7: Percentage of Metropolitan Planning Organizations (MPO) That Reported Select Public Transit Actions Taken or Considered in Their Communities Since 2019
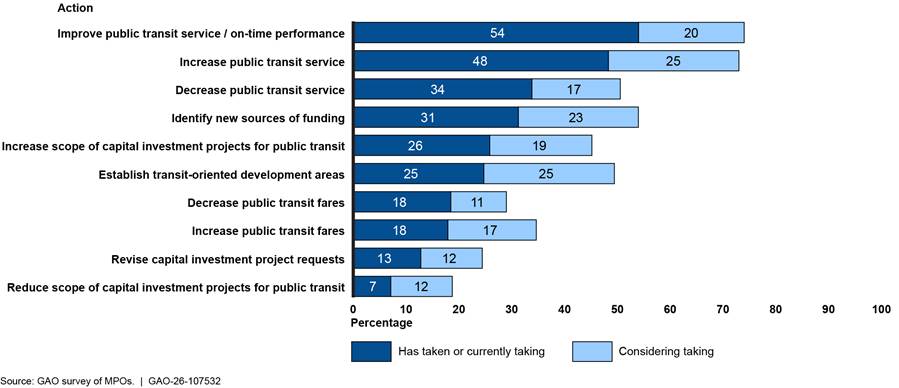
Note: Our survey of 410 MPOs, open from March–May 2025, had an 86 percent response rate. MPOs were asked to respond to each action and responses were not mutually exclusive.
Adjusted transit service: Roughly 80 percent of survey respondents reported that transit providers in their communities had taken at least one action to adjust service since 2019.
· Increased or improved service. Almost half of MPOs reported that transit providers in their communities had increased service since 2019 by, for example, increasing the frequency of service on existing routes or adding new transit routes. Of the nine MPOs we interviewed, two described making significant investments to improve the operating hours or frequency of their bus service. Based on NTD, bus service at a transit agency in one of those two MPOs saw rebounds in ridership that surpassed 2019 levels in 2024. Specifically, Cincinnati Metro re-designed its bus system to increase weekend and evening service and provide more cross-town service routes. NTD data suggest that, as of fiscal year 2024, bus ridership for Cincinnati Metro had surpassed 2019 levels.
More than half of respondents also reported actions taken to improve service. Examples included transit agencies taking steps to improve on-time performance, enhance safety and cleanliness, update trip planning apps, and improve fare collection. For instance, Denver’s Regional Transit District, a local transit agency, upgraded its trip planner to make it more user-friendly for riders. The app allowed users to search event terms like “Swift” or “Broncos” to find various public transit options to get to the events. Updating the planner was one of multiple actions the agency took intending to, in part, increase ridership. NTD data show that while ridership on the system has increased since 2021, 2024 ridership had only recovered to 61 percent of 2019 levels.
· Decreased service. Over one-third of MPOs reported that transit providers in their communities decreased service levels. This included decreasing the frequency of routes or removing routes altogether. Transit providers may decrease service due to reduced ridership or fare revenue. For example, in 2022, one transit agency in Fairfield, California, cut three of its eight bus routes due to declining ridership and budget shortfalls, among other things. MPOs in large communities (68 percent) more frequently reported decreasing service, compared to medium (34 percent) or small (24 percent) communities.
Adjusted fares: A third of survey respondents reported that transit providers in their communities had adjusted fares since 2019.
· Decreased fares. Nearly 20 percent of MPOs reported that transit providers in their communities decreased transit fares since 2019. For example, the Greater Richmond Transit Company, a transit agency in Richmond, Virginia, eliminated fares in March 2020 to help maintain transit ridership during the pandemic. Representatives from the transit agency told us that eliminating fares removed cost barriers, expanded access to economic and social opportunities, and supported their mission to provide equitable and reliable transit. According to NTD data, the agency surpassed 2019 ridership levels in 2023. Two additional transit agencies we interviewed also said that they had decreased or simplified fares, in part, to increase ridership. While representatives from these transit agencies told us that lowering fares helped increase ridership, neither of these agencies has seen ridership recover to 2019 levels.
· Increased fares. Nearly 20 percent of MPOs reported that transit providers in their communities increased fares. For example, Southeastern Pennsylvania Transportation Authority, a transit agency in Philadelphia, increased fares 21.5 percent in calendar year 2025 to help maintain service amid a budget deficit. Other transit agencies invested in reducing fare evasion, such as by installing new fare gates, to increase fare revenue. Despite increased fares and other related actions, revenue had not fully recovered to 2019 levels in many of these communities.
Identified new funding sources: Over 30 percent of survey respondents reported that transit providers in their communities had identified a new funding source since 2019. In some cases, these new funding sources came from state or local governments. For example, one industry association that represents transit agencies reported that, in 2024, 51 communities received additional funding from state or local governments through ballot initiatives. This included Nashville, Tennessee, where its residents approved a half-cent sales tax to help fund a $2.3 billion, 15-year plan to, among other things, improve bus service. Our analysis of NTD data found that about 50 percent of urbanized areas received a greater proportion of total operating funds from state and local sources in 2024 than in 2019.
Vehicle Use
Nearly 80 percent of survey respondents reported that they or others in their communities took one or more actions related to vehicle use since 2019, and another 11 percent reported that one or more actions were being considered. Some of the actions were designed to meet changing travel demands, such as where, when, and how people are traveling, whereas others may have, for example, addressed residents’ changing travel preferences. These actions also help MPOs meet certain planning goals, such as to reduce vehicle miles traveled during peak commuting hours or to help reduce greenhouse gas emissions.
· Changing roadway use. Nearly 70 percent of MPOs reported changing roadway use, such as adding bike lanes or removing parking. For example, residents in San Francisco voted to permanently close two roads to car traffic that were temporarily closed during the pandemic. The closures have created new public spaces, such as walking and biking paths, and increased safety. Other communities also changed roadway use to improve access for pedestrians and cyclists, which could encourage residents to walk or bike rather than drive. For instance, a representative from the Cincinnati MPO told us that since the pandemic, residents are increasingly looking for projects that have active transportation components, such as walking and biking paths. The representative noted that these types of projects were not a priority pre-pandemic, whereas since 2020, the number of pedestrian and cyclist projects or projects with a pedestrian or cyclist element has increased substantially. According to the region’s long-range plan, these investments help reduce fuel consumption, congestion, and vehicle emissions, and are especially valuable for replacing short-distance auto trips, which have the highest rate of emissions.
· Changing scope of projects. Forty percent of MPOs reported changing the scope of capital investment for roadway projects. For example, the state of Colorado had been planning a highway expansion project through Denver that has since been replaced with a bus rapid transit project. Officials told us they made this change to improve highway safety by reducing the number of cars on the road.
Housing
Eighty-five percent of survey respondents reported that they or others took one or more actions related to housing in their communities since 2019, and another 7 percent reported that one or more actions were being considered. Examples of actions included considering affordable housing in planning, improving broadband infrastructure or service, and incentivizing adaptive reuse of unused or underutilized commercial buildings (see fig. 8).
Figure 8: Percentage of Metropolitan Planning Organizations (MPO) That Reported Select Housing Actions Taken or Considered in Their Communities Since 2019
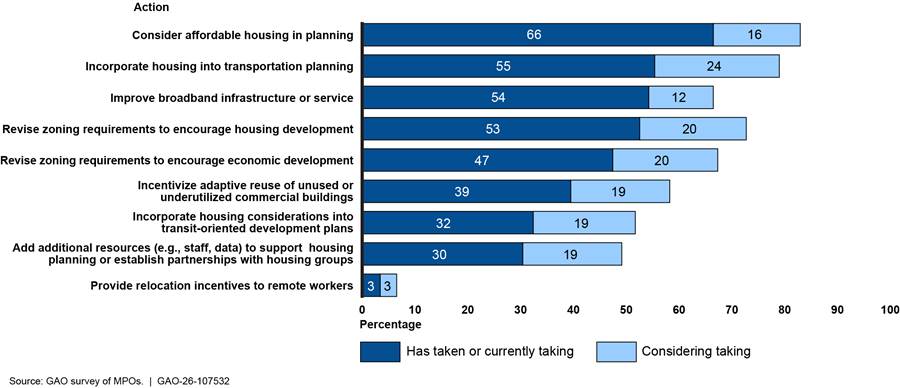
Note: Our survey of 410 MPOs, open from March–May 2025, had an 86 percent response rate. MPOs were asked to respond to each action, and responses were not mutually exclusive.
Our interviews with selected stakeholders provided additional insight into some of these actions. According to those stakeholders, some of the actions taken or considered were intended to remove barriers to office redevelopment or increase supply for housing in specific communities. For example, representatives from the Denver region MPO told us one community started a pilot program to help developers convert vacant office space into multi-use residential apartments or condos.[41] As part of the pilot program, the city provided a dedicated project coordinator to help expedite applicants through the review and permitting process. MPOs in three other communities told us that they or others, like their local governments, were exploring changes to land use policies to increase the supply of housing in high-demand neighborhoods, such as those with a lot of amenities. For example, one MPO told us that their local government was encouraging mixed-use development (e.g., having buildings with a mix of retail space and housing units) or converting single-family homes into townhouses to increase access to housing and to provide the type of housing residents sought. These changes could help the localities keep and attract residents.
Other actions specifically targeted teleworkers, such as improving broadband infrastructure or offering relocation incentives. For example, representatives from an association representing non-metropolitan areas told us that some communities have taken steps to enhance their broadband infrastructure to help attract or retain remote workers. Those representatives and others also told us that communities had more success attracting teleworkers if they could offer community amenities, such as bike or pedestrian paths; outdoor recreation; or mixed-use neighborhoods with grocery stores, daycares, or other necessities. Communities without these types of amenities have often struggled to attract or retain teleworkers, according to representatives.
Across public transit, vehicle use, and housing, MPOs in large communities more frequently reported that they or others had taken or were considering taking the actions we asked about in our survey, compared to smaller communities. For instance, about 92 percent of MPOs in large communities reported changing their roadway use compared to about 78 percent of medium communities and about 54 percent of small communities. Similarly, 81 percent of MPOs in large communities reported that their communities were considering affordable housing in planning, compared to 67 percent of MPOs in medium and 62 percent in small communities. Representatives from an association of MPOs told us that MPOs in large communities have generally been more responsive to changes in their communities because they have been more affected.
While some of these actions—such as increasing midday transit service or improving broadband service—may have been taken in response to changing telework rates and its related effects, many were taken for other reasons, and some were planned prior to 2020. Specifically, 26 percent of the 301 MPOs that reported that they or others in their communities had taken one or more actions related to public transit also reported that telework contributed to those actions. For example, Hamilton County, Ohio, residents voted in May 2020 to establish a sales tax to fund their transit agency for the next 25 years. According to officials, this was the region’s fourth attempt over the last 40 years to establish a transit-dedicated tax.
Many Transit Systems Have Not Recovered Pandemic-Related Ridership Losses, and Some Face Significant Revenue Challenges
Despite the actions we identified, most transit agencies have struggled to return to 2019 ridership levels. As of fiscal year 2024, one of the 26 cities designated by FTA as “top transit cities” had ridership levels that had returned to or surpassed 2019 levels. The remaining transit cities’ recoveries varied widely (see fig. 9).[42] For example, while ridership in the Miami and Fort Lauderdale, Florida, area was at 104 percent of 2019 levels in 2024, transit ridership in Atlanta, Georgia, and St. Louis, Missouri, was at 56 percent of 2019 levels. The remaining 23 top transit cities’ ridership levels ranged from 59 percent (Pittsburgh, Pennsylvania) to 91 percent (Salt Lake City, Utah) of 2019 levels.
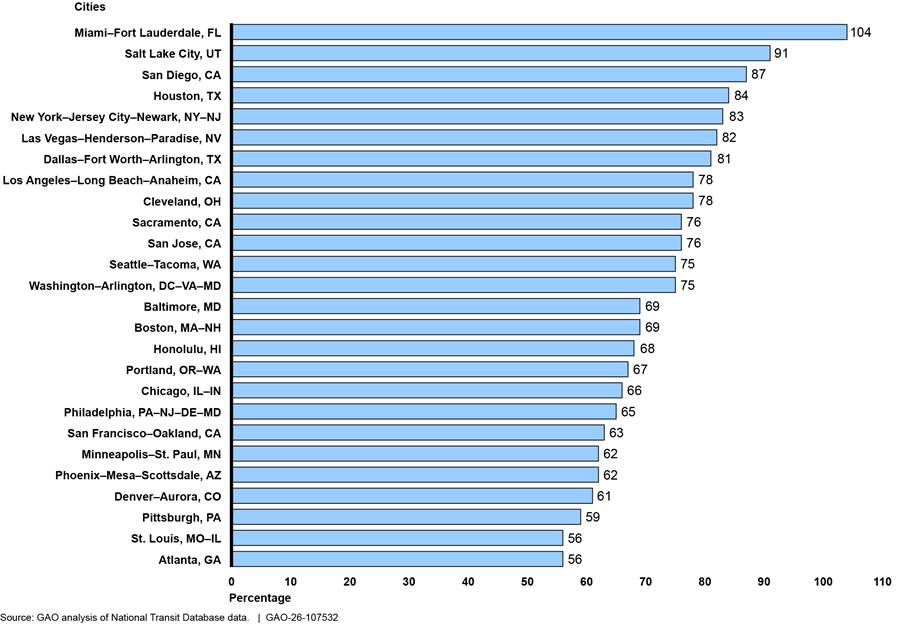
Note: Top transit cities are designated by the Federal Transit Administration and include 26 urbanized areas with either at least 50 million annual passenger trips or at least 50 miles of investment in heavy or light rail.
Transit systems in these top transit cities are generally more dependent on revenue they generate—which for all transit agencies predominantly comes from fares—than transit systems in other cities (see fig. 10). However, similar to ridership, available data suggest fare revenue has not yet returned to pre-pandemic levels in these cities. As a result, transit systems in top transit cities face a greater likelihood of experiencing a budget shortfall if they are unable to increase ridership or fare revenue. For example, San Francisco’s Bay Area Rapid Transit system historically relied heavily on fare revenue to fund its operating expenses. As ridership and return to office trends have not yet fully recovered to pre-pandemic levels, Bay Area Rapid Transit officials told us the system is currently facing an operating budget shortfall ranging from $350 to $400 million per year beginning in fiscal year 2027.
Figure 10: Top Transit Agencies’ Directly Generated Revenue as a Percentage of Operating Expenses Compared to Remaining Transit Cities, Fiscal Years 2019–2024
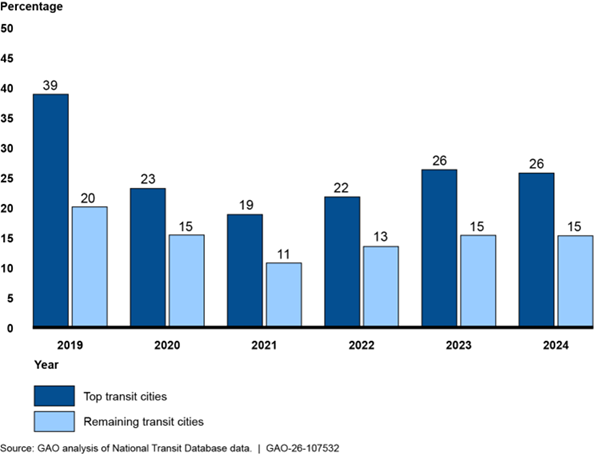
Note: Top transit cities are designated by the Federal Transit Administration and include 26 urbanized areas with either at least 50 million annual passenger trips or at least 50 miles of investment in heavy or light rail. The remaining transit cities are in urbanized areas with a population of 50,000 or more that do not meet the designation of a top transit city.
These challenges are compounded by the exhaustion of one-time funding provided to transit agencies during the pandemic. Recognizing the effect of the pandemic, starting in 2020, Congress authorized approximately $70 billion in COVID funds for public transportation to support transit operations.[43] According to our analysis of NTD data, this represented a significant change from historical trends in uses of federal funding, which had been more heavily used for capital improvements rather than operations, particularly in medium and large communities.[44] The funding allowed transit providers to maintain existing levels of service throughout communities, despite fewer riders and lost fare revenue. Our analysis of NTD data shows that while transit ridership and fare revenue dropped 55 percent and 61 percent from fiscal years 2019 through 2021, respectively, transit service provided dropped 17 percent.[45] While federal funding helped transit agencies close their funding gaps, as of September 2025, over 97 percent of the COVID transit funds had been expended, according to DOT officials.
As this federal financial support for operations ends, transit agencies in top transit cities may face additional difficulties adapting to changing ridership patterns and recovering their operating costs. In addition to being more fare reliant, these agencies’ systems are more likely to have fixed rail, which makes it more difficult to adapt to changing ridership patterns and recover their operating costs. According to NTD data, 81 transit agencies across 57 primarily large communities have operated fixed rail since fiscal year 2019. This includes the transit systems in almost all the top transit cities.
We recently reported on challenges facing commuter rail systems, including limitations on their ability to easily adapt to changing travel demand.[46] For instance, we reported that because commuter rail operates on a fixed track designed to transport people from outer areas to city centers for work, transit agencies that operate them are less able to modify operations, such as by changing station locations or cutting costs. Commuter rail also has high fixed and capital costs compared to other modes, like bus service, and it is not as easy to reduce costs by scaling down rail service. For example, the cost of keeping a rail station open and staffed remains the same each day no matter how many trains stop there.
Lastly, transit systems in communities that do not or cannot prioritize transit may receive less support from state or local government to offset lost fare revenue. For example, representatives from one MPO encompassing Chattanooga, Tennessee, told us that their community maintains moderately low tax rates, and there is no local sales tax dedicated to transportation funding. As a result, any decreases in fare revenue could lead to reductions in transit or other transportation services, as well as delays in the delivery of new transportation projects.
Looking ahead, transit agencies that are unable to recover operating costs, increase ridership or fares, or secure additional state and local funds may have to make difficult choices. Operating expenses account for about two-thirds of all transit expenses. To bring revenues and expenses into balance, these decisions could include cuts to service, increased fares, or cancelling or postponing planned expansions. For instance, according to its transit officials, Philadelphia’s public transit agency—Southeastern Pennsylvania Transportation Authority—faces an over $200 million budget deficit in fiscal year 2026. While the agency received one-time permission in September 2025 to use its state capital funding to help fund operations over the next 2 years, transit agency officials told us that they may have to consider service cuts in the future if the state government does not enact a long-term solution. If transit agencies in Philadelphia and other top transit cities find themselves in need of taking major action, such as extensive service cuts or fare increases, millions of Americans who rely on public transportation to get to their jobs, schools, or essential services, such as medical care and grocery shopping, could be negatively affected.
MPOs Have Taken Steps to Forecast Travel Trends, but DOT Has Not Completed a Required Study or Related Guidance to Assist Them
MPOs Have Collected New Data and Tried New Methods, but Face Continued Challenges Incorporating New Travel Trends Related to Telework
Many MPOs that responded to our survey reported that they or others in their communities have sought to better understand current and future transportation trends. Actions included conducting on-board public transit passenger surveys (56 percent) and updating household travel surveys (36 percent), in addition to other transit-related data collection efforts (57 percent).[47] These actions support MPOs’ requirements to forecast travel demand and develop short- and long-range plans that prioritize transportation needs. For example, officials from one MPO told us that they, in partnership with their state DOT, were in the process of surveying about 20,000 households to obtain information on travel trends, patterns, telework, and demographics. According to officials, the survey results will provide key information to help update the region’s travel model, which will then inform travel demand forecasts and transportation investment priorities. A different MPO worked with its local transit agencies to survey 8,000 households to collect travel and demographic information, such as how, when, where, and why people travel in and around the area. This information is intended to help the MPO make transportation planning decisions, such as prioritizing the transportation improvements that best fit regional needs.
MPOs have also changed how they have conducted planning activities since 2019. For example, almost 40 percent of survey respondents reported that they changed their planning activities, such as the data or other information they use, or their resulting long-range transportation plans. Officials from one MPO told us they use scenario planning to develop their travel demand forecasts, which helps minimize uncertainty around current trends. The scenarios they used are based on (1) current conditions, (2) 2017 conditions, and (3) pandemic conditions. A larger percentage of MPOs (61 percent) reported that they had changed how they conduct planning activities. For example, more than 70 MPOs reported conducting public outreach virtually, as opposed to in-person. According to one MPO, doing this has helped them reach more people and better understand shifting transportation trends.
Even with these actions, survey respondents reported challenges incorporating how telework can be factored into transportation planning and forecasting travel demand for future transportation investments.
· A quarter of MPOs reported that it has become more difficult to accurately forecast trends in vehicle use or transit in 2024, compared to 2019. For example, representatives we interviewed from one MPO told us that workers’ telework schedules can range from 1 day per week to working from home all week. In their community, for example, Monday and Friday have higher telework rates than Tuesday through Thursday. As a result, they told us that traffic trends vary greatly by the day. On Tuesday through Thursday, traffic volumes, as well as delays or bottlenecks, are highest during commuting hours. But, on lighter commuting days, representatives told us that bottlenecks occur at different times and in other parts of their community (e.g., for school pick-ups). As a result, the MPO faces challenges determining where and when to prioritize transportation capacity enhancements.
· Thirty percent of MPOs reported that they do not know how to incorporate information on telework into transportation planning, such as into travel demand models that inform travel forecasting, or that they do not plan to incorporate that information.[48] Survey respondents cited limited data, tools, or expertise as an explanation for not incorporating information on telework into their transportation plans. For example, one MPO reported that it would like to incorporate trends in telework but indicated it does not know how to do so because current telework rates are variable. Most MPOs we interviewed described challenges updating their plans and forecasts and a few of those MPOs also wanted additional guidance from DOT on how to incorporate telework into their planning efforts. For example, one MPO we interviewed told us that they would like standardized guidance for incorporating telework into its models and plans, as well as reliable data to incorporate into its models. Without additional assistance, this MPO told us it has limited resources and expertise to incorporate teleworking patterns into its plans.
DOT Has Not Completed a Required Study or Related Guidance Due in 2023 That Could Help MPOs Improve the Quality of Transportation Plans
To help support MPOs’ planning efforts, FHWA and FTA provide information sharing opportunities, technical assistance, and guidance. However, existing efforts have not targeted travel demand forecasting and planning related to telework and recent changes in travel patterns. FHWA and FTA jointly administer the Transportation Planning Capacity Building Peer Program, which provides information sharing opportunities for transportation planning agencies, such as workshops, roundtables, and webinars. The most recent sessions covered managing federal grants, scenario planning, and effective stakeholder management. FHWA also administers the Travel Model Improvement Program, which aims to help state and local planning agencies, including MPOs, with travel demand modeling. The program publishes research related to travel modeling and analysis and provides a voluntary email distribution list for MPOs and others to ask questions and share best practices. For instance, in 2022, FHWA published a decision-making guide directed to MPOs for transportation planning for uncertain times.[49] FHWA and FTA officials also told us they informally provide technical assistance to specific MPOs when requested. However, officials said they have not received any requests related to incorporating telework or other trends into forecasts and plans. Yet, more than 90 percent of MPOs that responded to our survey indicated a desire for additional resources, such as specific tools or data to help measure telework rates or changes from telework, additional technical assistance specific to helping address the changes from telework, and guidance or training related to helping address changes from telework.
In 2021, the Infrastructure Investment and Jobs Act (IIJA) directed DOT to take additional actions to support MPO planning activities, including using data to support more accurate travel demand forecasting.[50] Among other requirements, it directed DOT to conduct a travel demand data and forecasting study by November 2023 and at least once every 5 subsequent years. As part of this study, DOT is required to use the information it gathers to (1) develop best practices or guidance for states and MPOs to use in forecasting travel demand for future investments in transportation improvements, (2) support more accurate travel demand forecasting, and (3) enhance the capacity of states and MPOs to forecast travel demand.
DOT has taken some steps to complete these requirements. FHWA officials—who told us they are responsible for these requirements—said they had taken some steps to complete the travel demand data and modeling study. For example, according to officials, FHWA identified a National Cooperative Highway Research Program study on traffic forecasting accuracy that the agency is using as a starting point to help identify leading practices.[51] FHWA officials also told us that they have contracted with four private firms to support development of best practices. For instance, officials told us work to be carried out under one contract will support FHWA’s efforts to host five listening sessions with MPOs between December 2025 and March 2026 to better understand the needs of travel demand modelers and transportation planners. Work to be carried out under another contract will examine ways to improve travel models using artificial intelligence, according to the same officials.
Nevertheless, DOT has not fully met the requirements outlined in the IIJA or developed a plan for doing so. According to FHWA officials, it has been challenging to complete these requirements because the IIJA did not dedicate funding for these efforts. Moreover, officials told us that meeting the requirements, such as helping MPOs improve their modeling and planning capacities, is a substantial and continuous effort. As of September 2025, FHWA had not defined specific actions or timelines for fully meeting the IIJA requirements. According to Standards for Internal Control, documenting and defining project objectives, such as by developing clear steps, timelines, and roles, can help support successful agency outcomes.[52]
While we recognize the requirements are complex and challenging, completing the overdue actions in the IIJA could help improve the quality of MPOs’ plans, models, and forecasts, including for the more than 90 percent of MPOs that indicated a desire for additional resources. Moreover, by developing and executing a plan for completing the IIJA requirements, DOT could be better positioned to monitor its progress, align its available resources with the IIJA requirements, and more clearly communicate its goals and progress to stakeholders and Congress.
Conclusions
The COVID-19 pandemic changed the lives of millions of people in communities across the U.S. overnight. As telework rates skyrocketed in response to the pandemic, long-standing trends and assumptions about how and where people traveled, worked, and lived were upended. MPOs, transit providers, and others have taken an array of actions to better align their transportation infrastructure with new travel patterns and preferences. However, significant challenges remain. In particular, many transit providers continue to struggle with reduced ridership and fare revenue that may force them to make tough decisions that could limit transit access for some Americans.
These difficulties underscore the need for high-quality transportation planning to help direct resources and prioritize future transportation investments. However, MPOs have faced challenges incorporating telework trends and other changing travel behaviors into their transportation plans and forecasts. While FHWA has provided information sharing opportunities and technical assistance, it has not completed a study required by law and due in 2023 to establish guidance and best practices for transportation planning. FHWA has taken some steps to complete the study, such as by identifying existing relevant work and contracting some activities to private firms, but it has not developed a clear plan or timeline for completion. Establishing a plan and timelines will help DOT successfully complete this requirement. The resulting study and guidance, in turn, could help MPOs navigate the changes and uncertainty that arose during and in the aftermath of the pandemic and better ensure the accuracy of such forecasts used to make new transportation infrastructure investments.
Recommendation for Executive Action
We are making the following recommendation to DOT:
The Administrator of FHWA should establish and implement a detailed plan—that contains clear steps and timelines—to complete the required travel demand data and modeling study, and guidance based on information in the study. (Recommendation 1)
Agency Comments
We provided a draft of this report to DOT and the Department of Commerce (Commerce) for review and comment. In its comments, reproduced in appendix II, DOT concurred with our recommendation. DOT and Commerce also provided technical comments, which were incorporated throughout the report as appropriate.
As agreed with your offices, unless you publicly announce the contents of this report earlier, we plan no further distribution until 30 days from the report date. At that time, we will send copies to the Secretary of Transportation, the Secretary of Commerce, and other interested parties. In addition, the report will be available at no charge on the GAO website at https://www.gao.gov.
If you or your staff have any questions about this report, please contact me at Vonaha@gao.gov. Contact points for our Offices of Congressional Relations and Media Relations may be found on the last page of this report. GAO staff who made key contributions to this report are listed in appendix III.

Andrew Von Ah
Director, Physical Infrastructure
List of Requesters
The Honorable Robert C. “Bobby” Scott
Ranking Member
Committee on Education and Workforce
House of Representatives
The Honorable Robert Garcia
Ranking Member
Committee on Oversight and Government Reform
House of Representatives
The Honorable Mark DeSaulnier
Ranking Member
Subcommittee on Health, Employment, Labor, and Pensions
Committee on Education and Workforce
House of Representatives
The Honorable Jamie Raskin
House of Representatives
The scope of this report focused on the effects of changes in telework rates on public transit, vehicle use, and real estate (i.e., housing and commercial real estate) from 2019 through 2024.[53] We limited our scope to “communities” within the boundaries of all 410 metropolitan planning organizations (MPO).[54] This report addresses: (1) changes in telework rates across communities from 2019 through 2024; (2) how changes in telework affected public transit, vehicle use, and real estate within those communities; (3) actions communities have taken in response to changes in their community and continued challenges; and (4) the extent to which communities and the Department of Transportation (DOT) have taken steps to incorporate changing travel trends into forecasting and planning.[55]
For all objectives, we interviewed DOT officials from the Federal Transit Administration (FTA) and Federal Highway Administration (FHWA), in addition to representatives from 23 stakeholders—MPOs (nine), transit agencies (seven), industry associations (five), and local and state governments (two). We selected MPOs and transit agencies to interview to obtain a range based on size, location, and number and types of transit offered (e.g., rail and bus). We selected industry associations who could speak to our topics and based on inclusion in prior GAO work, our literature search results (discussed below), and recommendations from stakeholders we interviewed.[56] We conducted 10 of the 23 interviews in-person in Denver, Colorado; Los Angeles, California; San Francisco, California; and Washington, D.C.[57] In this report, we refer to a “few” stakeholders if representatives from two to three entities expressed the view, “some” if representatives from four to five entities expressed the view, and “many” if representatives from six or more entities expressed the view. While the results of our interviews are non-generalizable, the information obtained from the interviews provides illustrative examples for our report.
To describe telework rates across communities, we analyzed the Census Bureau’s (Bureau) American Community Survey (ACS) data for calendar years 2019, and 2021 through 2024, the most recent data available when we completed our analyses in December 2025.[58] ACS is a national survey that annually collects population, housing, and travel information, among other things, from a random sample of about 3.5 million households. For example, the ACS survey asks a series of questions about how and when people commute to work. According to the Bureau, this information provides communities with important statistics to help in their transportation and infrastructure planning. We defined teleworkers who primarily worked from home as those who indicated they “worked from home” in response to the question “how did this person usually get to work last week?” (i.e., at least 3 days that week).[59] Because the ACS is based on a probability sample, estimates produced from these data are subject to sampling error. We express our confidence in the precision of our results as 95 percent confidence intervals. This is the interval that would contain the actual population value for 95 percent of the samples that could have been drawn.
To estimate the use of telework at the community (MPO) level, we accessed the Bureau’s ACS 1-Year Estimates Public Use Microdata Sample (PUMS) files for 2019, and 2021 through 2024 using the Census Bureau’s Application Programming Interface.[60] Next, we calculated the overlap between Public Use Microdata Areas (PUMAs), the geographic area identified in the ACS PUMS files, and communities defined by MPO boundaries. Specifically, we identified the fraction of each PUMA’s population living in census block groups whose centers of population (i.e., geographic centroids weighted by population) fell within each MPO boundary. Finally, we made estimates for each community by weighting ACS values by their associated PUMA’s coverage fractions, and then summing or averaging the weighted values across observations contained in PUMAs that overlapped each community.[61] We assessed the reliability of the data using several methods, including reviewing ACS documentation, interviewing Bureau officials, and conducting several data checks. We determined that these data were sufficiently reliable for our purpose of estimating telework rates and other statistics at the MPO level.
For the remaining objectives, we conducted a population survey of all 410 MPOs from March through May 2025.[62] In the survey we asked MPOs about (1) planning activities; (2) changes to vehicle use and public transit since 2019; (3) actions taken related to vehicle use, public transit, and housing; (4) the extent to which telework was a contributing factor to any changes or actions; (5) federal assistance to address any effects; and (6) additional changes they anticipated in the future. Because MPOs responded on behalf of their respective communities, we attribute the survey results to the MPOs and not the communities.
To develop the survey, we reviewed our literature search results (discussed below); interviewed more than 23 stakeholders (discussed above), including representatives from industry associations, MPOs, and other community organizations; and reviewed prior GAO reports.[63] After we drafted and reviewed the initial survey instrument, we pre-tested the instrument via videoconference calls with nine MPOs to help ensure terminology was consistent, questions were clear, answer choices were appropriate, and the survey was not burdensome. We revised the survey as appropriate following the pre-tests. We selected MPOs for pre-testing to reflect a variety of characteristics, including population size (e.g., small, medium, and large communities); types of transit available in the region (e.g., those with rail, bus, on-demand transit, or a combination of these transit types); and geographic location (i.e., communities across different states and regions).
Following the distribution of the survey on March 12, 2025, we emailed contacts at the MPOs multiple reminders about completing the survey and called all non-respondents. Recognizing that data may not be available for all questions, in our instructions to respondents, we asked them to rely on their professional judgment, anecdotal experiences, or any information or data they had available when responding to questions. We also instructed MPOs to coordinate completion of the survey with any individuals or organizations (e.g., transit agencies or state/local offices) that have relevant subject matter knowledge, as needed. We closed the survey on May 14, 2025. We received responses from officials from 352 MPOs for an 86 percent response rate. We compared respondents to the entire MPO population on population size and geographic area and found them to be similar.
To quantify or further describe the public transit and vehicle use trends identified by survey respondents, such as the extent to which public transit ridership increased or decreased, we reviewed publicly available data from the federal government from 2019 through 2024.[64] These were the most recent data available when we completed our analyses in December 2025.
· National Transit Database: We analyzed service, ridership, and funding data for all transit agencies that received federal funds and were required to report data to DOT.[65] We analyzed data from fiscal year 2019 through fiscal year 2024. Among other things, we compared changes based on the transit mode (e.g., rail, bus, or on-demand transit) and community size of the transit system.[66] We assessed the reliability of the data using several methods, including reviewing NTD documentation, interviewing DOT officials, and conducting several data checks. We determined that these data were reliable for our purpose of providing trends in public transit at the national, community, and transit agency level.
· FHWA’s Traffic Volume Trends: We also summarized FHWA’s Traffic Volume Trends data, which capture monthly data on vehicle miles traveled reported by each state from calendar years 2019 through 2024. These data are collected at approximately 5,000 continuous traffic counting locations nationwide and are used to estimate the percent change in traffic trends. We assessed the reliability by reviewing agency documentation. We determined that these data were reliable for our purpose of providing national trends in vehicle miles.
· ACS Data: We analyzed ACS data on commuting characteristics (e.g., average commute time and time of departure) from calendar years 2019, and 2021 through 2024 to describe trends.[67] We assessed the reliability by reviewing agency documentation, interviewing Bureau officials, and conducting several data checks. We determined that these data were reliable for our purpose of providing national and MPO-level trends on vehicle commuting.
To understand the effects of telework on transit, vehicle use, and real estate, we also conducted a literature review. We conducted a search of studies that were published from January 2019 through August 2024—including peer reviewed materials, working papers, conference papers, dissertations, government reports, and think tank publications. We included empirical studies that used data focused on the United States. We conducted searches in various bibliographic databases, such as ProQuest, EBSCO, Scopus, and Dialog. The search terms used to locate relevant citations included “telework,” “transit,” “road,” “travel pattern,” and “housing.”
Two GAO economists independently reviewed each abstract we identified to preliminarily assess if the study is relevant to the effects of telework on transit, vehicle use, or real estate. We then requested full-text articles, focusing on papers that used U.S. data, had empirical results, and met our requirements for methodological rigor. We included 18 studies in our review: nine analyzed the effect of telework on public transportation; six analyzed the effect of telework on vehicle use or emissions; and five analyzed the effect of telework on housing.
To assess the extent to which communities and DOT took steps to incorporate changing travel trends into forecasting and planning, we reviewed federal statutes, regulations, and DOT documentation and guidance for MPOs on developing travel demand models and forecasts to inform short- and long-range plans; interviewed stakeholders; and reviewed industry publications. For example, we reviewed the following programs that are administered by FTA or FHWA: the Transportation Planning Capacity Building Program and the Travel Model Improvement Program. We also reviewed materials from the Association of Metropolitan Planning Organizations’ Institute. We assessed FHWA’s efforts to conduct a study as required by the Infrastructure Investment and Jobs Act. We also discussed the assistance DOT has provided communities in responding to changes, particularly in transit.
We conducted this performance audit from April 2024 to March 2026 in accordance with generally accepted government auditing standards. Those standards require that we plan and perform the audit to obtain sufficient, appropriate evidence to provide a reasonable basis for our findings and conclusions based on our audit objectives. We believe that the evidence obtained provides a reasonable basis for our findings and conclusions based on our audit objectives.
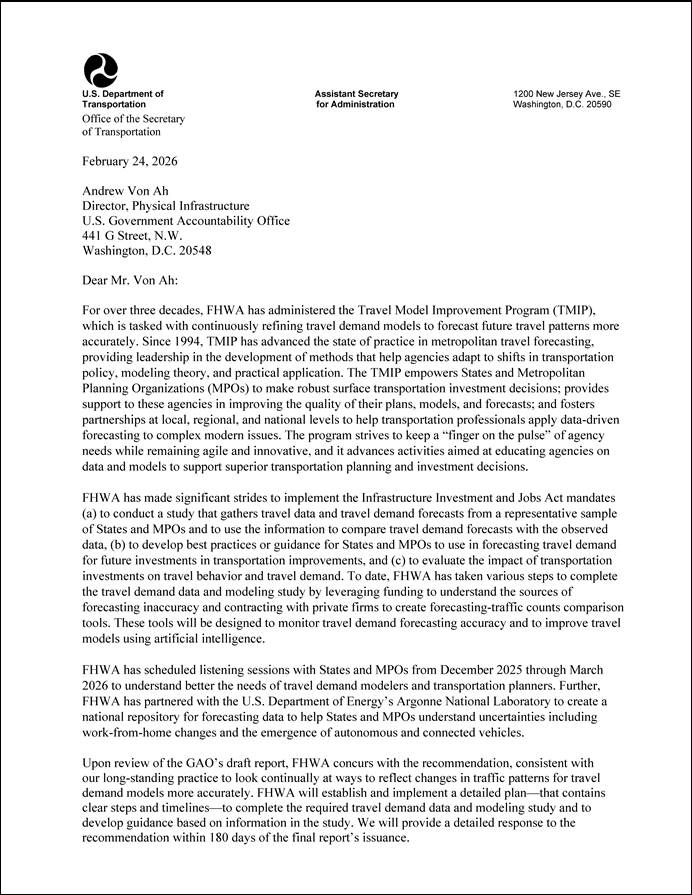

GAO Contact
Andrew Von Ah at vonaha@gao.gov
Staff Acknowledgments
In addition to the contact above, Brandon Haller (Assistant Director); Melissa Swearingen (Analyst-in-Charge); Emily Crofford; Huy Ho; Gina Hoover; Delwen Jones; Daniel Kannell; Jocelyn Kuo; Terence Lam; Joseph Maher; Jill Naamane; Natasha Oliver; Joshua Ormond; Emilee Pugh Bell; Pamela Snedden; Jack Wang; Steven Westley; and John Yee made key contributions to this report.
The Government Accountability Office, the audit, evaluation, and investigative arm of Congress, exists to support Congress in meeting its constitutional responsibilities and to help improve the performance and accountability of the federal government for the American people. GAO examines the use of public funds; evaluates federal programs and policies; and provides analyses, recommendations, and other assistance to help Congress make informed oversight, policy, and funding decisions. GAO’s commitment to good government is reflected in its core values of accountability, integrity, and reliability.
Obtaining Copies of GAO Reports and Testimony
The fastest and easiest way to obtain copies of GAO documents at no cost is through our website. Each weekday afternoon, GAO posts on its website newly released reports, testimony, and correspondence. You can also subscribe to GAO’s email updates to receive notification of newly posted products.
Order by Phone
The price of each GAO publication reflects GAO’s actual cost of production and distribution and depends on the number of pages in the publication and whether the publication is printed in color or black and white. Pricing and ordering information is posted on GAO’s website, https://www.gao.gov/ordering.htm.
Place orders by calling (202) 512-6000, toll free (866) 801-7077,
or
TDD (202) 512-2537.
Orders may be paid for using American Express, Discover Card, MasterCard, Visa, check, or money order. Call for additional information.
Connect with GAO
Connect with GAO on X,
LinkedIn, Instagram, and YouTube.
Subscribe to our Email Updates. Listen to our Podcasts.
Visit GAO on the web at https://www.gao.gov.
To Report Fraud, Waste, and Abuse in Federal Programs
Contact FraudNet:
Website: https://www.gao.gov/about/what-gao-does/fraudnet
Automated answering system: (800) 424-5454
Media Relations
Sarah Kaczmarek, Managing Director, Media@gao.gov
Congressional Relations
David A. Powner, Acting Managing Director, CongRel@gao.gov
General Inquiries
[1]ACS is a national annual survey of about 3.5 million households conducted by the Census Bureau (Bureau). Margins of error are within +/- 0.1, which the Bureau calculates at the 90 percent confidence level. No ACS data are reported for 2020 because the Bureau did not release 2020 ACS 1-year estimates due to the effect of the COVID-19 pandemic on data collection.
[2]An MPO is the policy board of an organization created and designated to carry out the metropolitan transportation planning process in urbanized areas. See 49 U.S.C. § 5303; 23 U.S.C. § 134.
[3]GAO, Telework: Growth Supported Economic Activity During the Pandemic, but Future Impacts Are Uncertain, GAO‑23‑105999 (Washington, D.C.: July 26, 2023).
[4]GAO, Telework: Private Sector Stakeholder and Expert Views, GAO‑25‑107078 (Washington, D.C.: May 8, 2025).
[5]For this report, we use the term “community” to describe the people living, working, and using the transportation infrastructure within an MPO’s planning area.
[6]We conducted 10 interviews in person in Denver, CO; Los Angeles and San Francisco, CA; and Washington, DC. In-person interviews included four MPOs, five transit agencies, and one state DOT.
[7]While ACS uses the term “worked from home” to describe the data, we use the term “telework” in this report.
[8]According to the Bureau, this and other survey questions about commuting to work (such as those discussed later about number of commuters and hour of the day people commute) provide communities with important statistics to help in their transportation and infrastructure planning.
[9]For our survey and in our remaining objectives, we use the term telework broadly to refer to flexible work arrangements under which employees can perform their duties at an alternative worksite, often at home, on a recurring, regular, part-time, or full-time basis. This definition is broader than that of the ACS data, which only includes people who primarily teleworked (i.e., those who worked from home at least 3 days per week).
[10]We compared MPO respondents to the entire MPO population based on population size and geographic area and found them to be similar.
[11]NTD data are reported by transit agencies at the end of that agency’s own fiscal year, which may vary across agencies.
[12]An urbanized area is a Census-designated area with a population of more than 50,000. One MPO in our analysis serves a population below 50,001, which as discussed later, we categorized as small. It is one of two MPOs serving a single urbanized area extending into three states, in agreement between the relevant Governors and local officials.
[13]Metropolitan Transportation Plans address at least the next 20 years of multimodal transportation for their respective metropolitan areas. Transportation Improvement Programs are a prioritized list of transportation projects covering the next 4 years, consistent with their 20-year Metropolitan Transportation Plans. See 49 U.S.C. § 5301(c)(1); 23 C.F.R. § 450.104.
[14]See e.g., 23 C.F.R. § 450.332(d).
[15]49 U.S.C. § 5303(h)(1).
[16]This requirement applies to MPOs conducting planning for a “Transportation Management Area,” which includes any urbanized area with a population over 200,000, which aligns with our definitions for “medium” and “large” communities. However, the governor and MPO of a particular area can also request that an area with a smaller population be designated as a Transportation Management Area, in which case that smaller community would also be subject to this requirement and others. See generally 49 U.S.C. 5303(k). As of June 2023, FTA recognized at least two Transportation Management Areas that had been designated on request. 88 Fed. Reg. 36,637 (June 5, 2023).
[17]For instance, FTA’s Urbanized Area Formula Grants require that designated recipients must be government authorities with the legal authority to receive and dispense federal funds. According to FTA, about 8 percent of MPOs are designated recipients for transit funds.
[18]Pub. L. 117-58, div. C, § 30002, 135 Stat. 492, 890-92 (2021) (amending 49 U.S.C. § 5303).
[19]As part of the certification review process, FTA and FHWA jointly determine at least every 4 years whether medium and large MPOs are meeting, substantially meeting, or not meeting legal requirements for planning. Failing to be certified as meeting requirements may impact MPO funding. 49 U.S.C. § 5303(k)(6); 23 C.F.R. § 450.336.
[20]Funding and budget figures in this report are in nominal dollars, unless otherwise indicated. These federal funds are distributed to states based on population. Generally, states then provide each of their MPOs with baseline funding and distribute any remaining balance according to a formula. While the states can use a range of factors in their formulas, such as attainment of air quality standards, they are required to take population into account. See 23 U.S.C. § 104(d); 49 U.S.C. § 5305(d).
[21]Margins of error are within +/- 0.2 percentage points.
[22]Margins of error are within +/- 0.2 percentage points.
[23]Margins of error are within +/- 1.1 percentage points.
[24]Margins of error are within +/- 1.4 percentage points.
[26]Margins of error associated with education estimates are within +/- 0.5 percentage points.
[27]MPOs from the remaining large, medium, and small communities reported that transit ridership increased, stayed the same, or that they were unsure of trends.
[28]NTD data are not reported at the MPO level. Instead, the NTD data are reported at the urbanized area level. While these areas are similar and overlap, they do not match. We used the same size population groupings for our analysis of MPOs in urbanized areas.
[29]Twelve of the 89 MPOs that reported that transit ridership increased from 2019 through 2024 also reported telework was a contributing factor.
[30]Of these nine studies, six looked at specific communities and three examined changes more broadly across metropolitan regions in the U.S. Of the six studies that looked at trends in specific communities, five included large communities with populations of 1 million or more, and the remaining city had a population over 500,000. These studies generally controlled for a number of other characteristics that would explain declining transit ridership and fare revenue, including, for example, income, education, and vehicle ownership (i.e., transit dependency).
[31]This study, published in 2024, found a relationship between increases in telework and decreases in fare revenue across 217 metropolitan statistical areas, while controlling for other factors. Metropolitan statistical areas—a geographic entity delineated by the Office of Management and Budget—consist of the core of a county or counties containing an urban area with a population of 50,000 or more people, plus adjacent counties having a high degree of social and economic integration, as measured through commuting.
[32]We define the morning rush hours as 7:00 a.m. to 9:59 a.m. The reduction in commute trips was greatest during the early commute hour. Specifically, there was a 5.0 percent drop for commuters who departed from 7:00 a.m. to 7:59 a.m. Margins of error are within +/- 1.3 percentage points.
[33]While the number of workers who drove to work from 7:00 a.m. to 9:59 a.m. decreased, 1.3 percent more people drove to work during the late morning, which we define as 10:00 a.m. to 11:59 a.m., in 2024 relative to 2019. Margins of error are within +/- 1.2 percentage points.
[34]These four empirical studies were all published in 2023 and 2024. Three studies were national, and one encompassed the Los Angeles, CA region.
[35]While we found a significant difference in the number of people commuting during the morning rush hours in large communities, ACS data did not show a significant difference in the average number of minutes drivers commuted in large communities. Medium communities saw a statistically significant small decrease (0.9 percent) in drivers during rush hours, whereas small communities saw a statistically significant increase (2.7 percent) in drivers. All margins of error for changes in the number of drivers are within +/- 1.4 percentage points.
[36]Commercial real estate and housing issues generally fall outside MPOs’ planning responsibilities, so this was not a central topic in our survey.
[37]See GAO, Commercial Real Estate: Trends, Risks, and Federal Monitoring Efforts, GAO‑24‑107282 (Washington, D.C.: Sept. 24, 2024).
[38]These central business districts were in Boston, MA; Chicago, IL; Los Angeles, CA; New York City, NY; San Francisco, CA; and Washington, DC.
[39]These four studies were published from 2022 through 2024. One study used national data, two used data encompassing about 30 communities, and one study was limited to California. One of the studies found the same relationship for rental prices. These studies controlled for other factors that could affect home prices, including population migration trends, income, and pre-pandemic housing prices.
[40]The National Association of Realtors, “2024 Profile of Home Buyers and Sellers,” (Washington, D.C.: 2024).
[41]This is generally referred to as “adaptive reuse.”
[42]FTA’s “top transit cities” include 26 urbanized areas with either at least 50 million annual passenger trips or at least 50 miles of investment in heavy or light rail. They include Atlanta, GA; Baltimore, MD; Boston, MA; Chicago, IL; Cleveland, OH; Dallas, TX; Denver, CO; Honolulu, HI; Houston, TX; Las Vegas, NV; Los Angeles, CA; Miami, FL; Minneapolis, MN; New York, NY; Philadelphia, PA; Phoenix, AZ; Pittsburgh, PA; Portland, OR; Sacramento, CA; Salt Lake City, UT; San Diego, CA; San Francisco, CA; San Jose, CA; Seattle, WA; St. Louis, MO; and Washington, DC. Collectively, these transit cities have accounted for an average of 85 percent of all transit ridership in the U.S. from 2019 through 2024.
[43]The COVID relief laws that provided these funds gave recipients flexibilities to use the funding for a wide array of payroll and operating expenses, and some of the funding was required to be used for these purposes to the maximum extent possible.
[44]In 1991, 75 percent of federal transit funding went toward capital expenses, compared to 37 percent in 2020. Transit systems in large and medium communities generally have less flexibility to use federal funds for operating expenses. For instance, the Urbanized Area Formula Funding program, the largest source of formula funds for transit agencies, can only be used on operating assistance in urbanized areas with populations less than 200,000. Otherwise, eligible activities are typically related to capital expenses and preventative maintenance. 49 U.S.C. § 5307. However, some FTA programs do support operating expenses. For example, Formula Grants for Rural Areas, Tribal Transit Formula Grants, and the Enhanced Mobility of Seniors and Individual with Disabilities can also be used for operating costs. Id. §§ 5310-11.
[45]We use NTD’s vehicle revenue hours as a measure of service provided. Vehicle revenue hours measure the hours that vehicles are scheduled to or actually travel while in revenue service.
[46]GAO, Commuter Rail: Most Systems Struggling to Recover Ridership Following the COVID-19 Pandemic, GAO‑25‑107511 (Washington, D.C.: May 7, 2025).
[47]An on-board public transit passenger survey is a study that collects data on public transit users, including origins and destinations, demographics, travel purposes, time of travel, and travel preferences. Data collected can be used to improve service and inform transportation planning and decision-making, among other things. A household travel survey is a study that collects data on how people travel, including origins and destinations, trip purposes, and travel mode. This data can be used in various ways by MPOs, including to understand travel behavior, forecast future travel demand, and make informed decisions about transportation infrastructure and services.
[48]MPOs may have had a number of different reasons for reporting that they do not plan to incorporate information on telework into their forecasts. For example, representatives from one MPO we surveyed reported that they did not plan to include data on telework in their forecast because they did not know what data to use. Representatives from another MPO reported they did not include data on telework because the rate was low and did not affect their forecasts.
[49]While the report provided a new theoretical framework for predicting uncertainty in transportation plans, it did not provide guidance around specific uncertainties like telework or changing travel patterns. See Department of Transportation, Transportation Planning for Uncertain Times: A Practical Guide to Decision Making Under Deep Uncertainty for MPOs, FHWA-HEP-22-031 (Washington, D.C.: July 31, 2022).
[50]Pub. L. No. 117-58 § 11205, 135 Stat. 429, 523-24 (2021).
[51]The National Cooperative Highway Research Program, which is part of the National Academies of Sciences, is an applied research program. The program—which is funded through contributions from state departments of transportation—conducts research to improve the planning, design, construction, operation, and maintenance of the nation’s highways. Contributors of this specific study included officials from DOT, academia, and state departments of transportation. See National Academies of Sciences, Engineering, and Medicine, Traffic Forecasting Accuracy Assessment Research (Washington, DC: The National Academies Press, 2020).
[52]GAO, Standards for Internal Control in the Federal Government, GAO‑25‑107721 (Washington, D.C.: May 15, 2025).
[53]This is the third and final report in a series of reports on telework. We issued the first report in July 2023 on changes in telework before and during the pandemic, as well as telework’s impact on worker productivity and employer performance. In May 2025, we issued a second report examining the views of private sector employers and employees on the benefits and challenges of telework. See GAO, Telework: Private Sector Stakeholder and Expert Views, GAO‑25‑107078 (Washington, D.C.: May 8, 2025) and Telework: Growth Supported Economic Activity During the Pandemic, but Future Impacts Are Uncertain, GAO‑23‑105999 (Washington, D.C.: July 26, 2023).
[54]An MPO is the policy board of an organization created and designated to carry out the metropolitan transportation planning process. MPOs are required to represent localities in all urbanized areas with populations over 50,000, as determined by the census. One MPO in our analysis serves a population below 50,001, which we categorized as small. It is one of two MPOs serving a single urbanized area extending into three states, in agreement between the relevant Governors and local officials.
[55]We define the term “community” broadly to describe the people living, working, and relying upon the transportation infrastructure within an MPO’s entire geographic planning area. These “communities” vary substantially with respect to population and geographic size and can include multiple neighborhoods, cities, and counties. We also refer to communities by the MPO’s population. Large communities are represented by MPOs with populations of 1 million or more, medium communities have populations of 200,001 to 999,999, and small communities have populations of 50,001 to 200,000.
[56]One industry association that represents highways declined our request for an interview.
[57]These interviews included four MPOs, five transit agencies, and one state DOT. Where possible, we tried to minimize resources in our site visits by selecting locations that were near GAO offices.
[58]No ACS data are reported for 2020 because the Bureau did not release 2020 ACS 1-year estimates due to the effect of the COVID-19 pandemic on data collection.
[59]The ACS question on the method of transportation usually used to get to work was asked of respondents ages 16 and over who were employed and at work in the previous week. As we previously reported, the ACS measure provides a conservative estimate of the number of teleworkers because it only captures information about people who primarily work at home (i.e., at least 3 days that week), not those who do so on an occasional basis. See GAO‑23‑105999.
[60]https://api.census.gov/data/, accessed on January 9, 2026.
[61]The ACS also included questions about the respondent’s employment, education attainment, and income. In our prior work, we found that certain characteristics, such as higher levels of education, were more prevalent among people who could telework. See GAO‑23‑105999. In our report, we estimated those characteristics by MPO size.
[62]For our survey and in our remaining objectives, we use the term telework broadly to refer to flexible work arrangements under which employees can perform their duties at an alternative worksite, often at home, on a recurring, regular, part-time, or full-time basis. This definition is broader than that of the ACS data, which only includes people who primarily teleworked (i.e., those who worked from home at least 3 days per week). While our survey initially included questions about changes and effects on commercial real estate, we removed these questions during pre-testing to shorten the survey and reduce the burden on MPO officials. Further, we discovered during pre-testing that MPO officials were less comfortable speaking about commercial real estate issues, as they do not fall under their direct planning responsibilities.
[63]We reviewed the literature search results to see how the authors discussed changes to vehicle use, transit, or real estate in their results. For example, many authors identified changes to transit services or fares, so we included those effects as options in our survey. We also used a prior report that surveyed officials at MPOs in 2009 to help frame survey questions. See GAO, Metropolitan Planning Organizations: Options Exist to Enhance Transportation Planning Capacity and Federal Oversight, GAO‑09‑868, (Washington, D.C.: Sept. 9, 2009).
[64]In reviewing a draft of this report, DOT noted that we could also use ACS data on the number of transit trips to commute to work. However, we used NTD data because it allows us to show changes in all transit trips, including commute and non-commute trips. The ACS data that DOT referenced show that from calendar year 2019 to 2024, the number of workers commuting to work by transit decreased by 22.0 percent nationally. The margin of error for this estimate is within +/- 1.0 percentage point at the 95 percent confidence level.
[65]Federal law requires transit agencies to report to NTD if they receive or benefit from Urbanized Area Formula Grants (§5307) or Formula Grants for Rural Areas (§5311). 49 U.S.C § 5335. Transit agencies report ridership, funding, and service metrics at the end of that agency’s own fiscal year, which may vary across agencies. Ridership is measured by unlinked passenger trip, which is the number of times a passenger boards a transit vehicle. Service is measured by vehicle revenue hours, which are the hours that vehicles are scheduled to or actually travel while in revenue service.
[66]Large urbanized areas are those with populations of 1 million or more, medium urbanized areas have populations between 200,001 and 999,999, and small urbanized areas have populations between 50,001 and 200,000.
[67]In ACS data, drivers are calculated based on carpool size, up to five people. If a vehicle has 5 or 6 people, ACS counts the number of carpoolers as 5, and any vehicles with 7 or more carpoolers are counted as 7.