Report to the
Ranking Member Committee on Ways and Means
House of Representatives
United States Government Accountability Office
A report to the Ranking Member of the Committee on Ways and Means, House of Representatives
Contact: Leslie V. Gordon at GordonLV@gao.gov
What GAO Found
The routine home care that makes up the bulk of Medicare hospice care for its beneficiaries is primarily delivered through visits made by nurses, aides and social workers. GAO found that in 2024 for selected beneficiaries and hospices, low-visit hospices—the 20 percent of hospices that delivered the fewest visits per week per beneficiary—averaged about half as many visits per week as high-visit hospices—the 20 percent that delivered the most visits per week. Low-visit hospices delivered a total of 2.5 visits per week on average, compared to a total of 5.5 visits per week on average for high-visit hospices.
Because Medicare’s hospice daily payment rates are the same regardless of the number of visits delivered, Medicare effectively paid low-visit hospices twice as much per visit as high-visit hospices, on average. Also, Medicare effectively paid more per visit under hospice payment rates than it would have under rates for comparable home health visits. (See figure.) (GAO adjusted home health rates to account for, among other things, differences between services covered under the payment rates for each program.) Hospice routine home care visits and home health visits are comparable because they involve similar services provided by the same types of health care professionals. GAO’s analysis of claims from 2022 through 2024 showed that Medicare paid about $16.7 billion for the hospice routine home care but estimated Medicare would have paid about $9.1 billion if the care had been reimbursed under the home health per-visit payment rates for comparable services—a $7.6 billion difference.
Average Per-Visit Hospice Payment and Home Health Per-Visit Rates for Low- and High-Visit Hospices for Selected Beneficiaries Discharged from Hospice in 2024
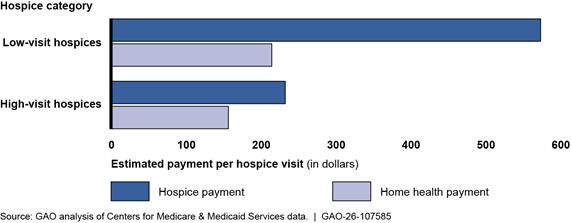
Note: GAO made several adjustments to account for differences between hospice payment rates and home health per-visit payment rates, including services that are covered by hospice, but not home health.
Though GAO found Medicare spending for routine home care is higher than what it would be under home health per-visit rates, Centers for Medicare & Medicaid Services (CMS) officials said the statute requires daily hospice payment rates and does not provide flexibility for further refinements to the payment structure beyond those made in 2016 and 2020. Officials also said CMS will continue to monitor hospice utilization to determine if there is a need for further refinements consistent with their statutory authority. Any excess hospice spending may have negative implications for the sustainability of the Medicare program and is inconsistent with Medicare’s responsibility to be an efficient purchaser of health care services.
Medicare beneficiaries who are terminally ill may be able to enroll in Medicare’s hospice benefit, and the number who have done so has increased. Medicare’s spending on hospice care nearly doubled from $15.5 billion in fiscal year 2015 to $27.5 billion in fiscal year 2024.
For routine home care provided through its hospice benefit, Medicare generally pays a set amount per day regardless of the number and type of visits delivered. A daily rate may create financial incentives for hospices to provide a limited number of visits, which could affect the quality of hospice care.
GAO was asked to review Medicare hospice services and payments for those services. In this report, GAO (1) describes the frequency of hospice routine home care visits provided by selected hospices; and (2) examines how estimated per-visit payment rates for hospice routine home care compare across selected hospices as well as to home health per-visit payment rates.
GAO analyzed Medicare claims for routine home care from 2022 through 2024 for a selection of 1,225,049 beneficiaries discharged from hospice in 2024 and a selection of 4,340 hospices that served more than 30 beneficiaries. GAO also reviewed documents and interviewed researchers and national organizations and CMS officials on hospice payment reform.
What GAO Recommends
GAO recommends that Congress consider directing the Secretary of the Department of Health and Human Services (HHS) to revise the hospice payment system for routine home care services to better promote payment efficiency and realize savings for the Medicare program. HHS provided technical comments, which we incorporated as appropriate.
|
Abbreviations |
|
|
|
|
|
CMS |
Centers for Medicare & Medicaid Services |
|
HHS-OIG |
Department of Health and Human Services’ Office of Inspector General |
|
MedPAC |
Medicare Payment Advisory Commission |
This is a work of the U.S. government and is not subject to copyright protection in the United States. The published product may be reproduced and distributed in its entirety without further permission from GAO. However, because this work may contain copyrighted images or other material, permission from the copyright holder may be necessary if you wish to reproduce this material separately.
June 9, 2026
The Honorable Richard E. Neal
Ranking Member
Committee on Ways and Means
House of Representatives
Dear Ranking Member:
The number of Medicare beneficiaries enrolled in the hospice benefit and the number of hospices in the United States have increased in recent years with spending nearly doubling from $15.5 billion in fiscal year 2015 to $27.5 billion in fiscal year 2024, according to the Centers for Medicare & Medicaid Services (CMS).[1] The number of Medicare beneficiaries enrolled in the hospice benefit per year grew at a slower rate, 32 percent, from 1.4 million in 2015 to 1.8 million in 2024, according to the Medicare Payment Advisory Commission (MedPAC).[2] During this time, the number of for-profit hospices also doubled while the number of nonprofit hospices declined 17 percent, according to MedPAC.
Medicare established the hospice benefit in 1983 to care for terminally ill beneficiaries. Initially, hospice care primarily served beneficiaries with cancer but now serves beneficiaries with a range of terminal illnesses including cancer, cardiac, and neurological illnesses. Medicare beneficiaries with a life expectancy of 6 months or less can enroll in the hospice benefit to receive palliative care, or pain and symptom management. Hospice care primarily consists of visits that nurses, aides, and social workers deliver to beneficiaries in their homes or primary place of residence similar to visits that are provided in Medicare home health care. These health care professionals generally monitor and manage symptoms of the beneficiaries’ terminal illness. As such, labor costs represent a substantial portion of hospice costs like Medicare home health care, which also is primarily provided by health care professionals in beneficiaries’ homes.[3]
Medicare pays a daily rate for hospice care based on the number of days a beneficiary is enrolled in the hospice benefit and the level of care provided. Routine home care is the most common level of care, accounting for nearly all of the Medicare hospice care in fiscal year 2024.[4] With certain exceptions, the daily rates for routine home care do not depend on the number of visits or the type of health care professional delivering visits.[5] For example, a hospice provides one visit to a beneficiary one day and not the next, and Medicare typically would pay the hospice the same amount for each of these days.
As hospice spending has grown, there are questions about the extent to which Medicare’s daily payment may create financial incentives for hospices to minimize the provision of care.[6] In addition, CMS and law enforcement agencies have reported taking steps to address likely fraudulent behavior in hospice. For example, in January 2026, CMS reported enhanced reviews of new hospices in six states and nationwide site visits of high-risk hospices.[7] Law enforcement agencies have reported actions in recent years to address hospice fraud schemes, some of which were alleged to have caused over $100 million in fraud.[8]
You asked us to review hospice services, spending, and payment incentives. In this report, we
1. describe the frequency of hospice routine home care visits among selected hospices and Medicare beneficiaries; and
2. compare estimated per-visit Medicare payment rates for hospice routine home care across selected hospices and to home health per-visit rates.
To answer our reporting objectives, we analyzed CMS claims data for a cohort of 1,225,049 hospice beneficiaries who were discharged deceased or alive from 4,340 hospice providers in 2024, and who had not reenrolled in hospice as of June 30, 2025.[9] Our analysis includes hospice routine home care days for these beneficiaries dating back to January 1, 2022. We excluded hospices with claims for fewer than 30 cohort beneficiaries or fewer than 30 visits for these beneficiaries. As a result, we excluded 2,099 hospices, or 33 percent, and 26,922 beneficiaries discharged from hospice in 2024, or 2 percent. The selected hospices and beneficiaries are not generalizable to all hospice providers and beneficiaries.
To describe the visits delivered across our selected hospices, we first ranked hospices based on the average number of visits per week they delivered to selected beneficiaries.[10] We then divided the hospices into five groups of equal size, or quintiles. We refer to the quintile with the lowest number of visits as “low-visit hospices” and the quintile with the highest number of visits as “high-visit hospices.” We then compared the average number of visits per week for all five quintiles, including by type of health care professional, such as a nurse or aide. We also interviewed and reviewed reports from five researchers and six national organizations—including a consumer advocacy group and five provider groups—to obtain their perspectives on hospice patterns of care.[11] We selected these researchers and organizations based on involvement in or knowledge of hospice care, such as published reports or research articles on hospice care, public comments on hospice rulemaking, or their work advocating for hospice beneficiaries and their families or caregivers. The views of these researchers and stakeholder groups we selected are not generalizable to all such groups, but they provided valuable insights on hospice patterns of care and factors that affect hospice payment, among other things.
To compare estimated per-visit payment rates for hospice routine home care across selected hospices and to payments under home health per-visit rates, we first estimated the average hospice payment per visit for low- and high-visit hospices. Specifically, we calculated the average payment per visit for each hospice, then took the average of all hospices in each quintile. To compare hospice and home health payments per visit, we used 2024 home health per-visit rates published in CMS regulations as well as data from fiscal year 2023 hospice and home health Medicare cost reports (the most recent available at the time of our analysis) and guidance from CMS on home health payment rates and policies.[12] We made several adjustments to home health payments including for services that are covered by hospice but not home health, and for geographic wage differences.[13] (See appendix I for additional details on the scope and methodology of this data analysis.)
To assess the reliability of claims data, we examined relevant documentation, interviewed knowledgeable agency officials, and conducted data checks. To assess the reliability of cost report data, we examined relevant documentation and compared results with a published analysis. We determined that these data were sufficiently reliable for the purpose of our objectives. We reviewed relevant CMS documentation, including proposed and final rules related to hospice payment provisions; the Medicare hospice regulations regarding conditions of participation; and related hospice guidance documents.[14] We also interviewed CMS officials to obtain information on past and any planned hospice payment reform efforts.
Our report provides information in appendix II on hospice and non-hospice spending that beneficiaries incurred while receiving hospice care as well as information in appendix III on the number and type of hospice visits that Medicare beneficiaries with different terminal illnesses received.
We conducted this performance audit from May 2024 to June 2026 in accordance with generally accepted government auditing standards. Those standards require that we plan and perform the audit to obtain sufficient, appropriate evidence to provide a reasonable basis for our findings and conclusions based on our audit objectives. We believe that the evidence obtained provides a reasonable basis for our findings and conclusions based on our audit objectives.
Background
Hospice Eligibility, Coverage, and Requirements
To be eligible for the Medicare hospice benefit, an individual must be medically certified as having a terminal illness with a life expectancy of 6 months or less if the illness runs its normal course and be enrolled in Medicare Part A, which covers inpatient care.[15] For Medicare beneficiaries to receive care from a hospice, they must enroll in the hospice benefit by signing a statement indicating they are waiving their rights to Medicare payment for services related to curing their terminal illness. The time a beneficiary spends continuously enrolled in hospice care is referred to as a hospice stay.
After enrolling in hospice, beneficiaries can receive a variety of services in various settings with the goal of making the beneficiaries as physically and emotionally comfortable as possible. The Medicare hospice benefit is designed for the palliation and management of terminal illnesses and includes physician and nursing services; hospice aide services; physical, occupational, and speech therapy; spiritual, grief, and loss counseling; and medical equipment and supplies, including drugs and biologics for pain and symptom management. Services that are unrelated to a terminal illness and related conditions may be covered by Medicare separately outside of hospice. However, according to CMS, hospice care should include virtually all care necessary for the beneficiary’s terminal illness, and services unrelated to that illness should be exceptional and unusual.
Most hospice care is provided in a beneficiary’s own home, but can also be provided in other settings, such as a nursing home, assisted living facility, hospice facility, or hospital. The hospice must make all services under the Medicare hospice benefit available to beneficiaries as needed, 24 hours a day, 7 days a week.
The Medicare hospice benefit requires each enrolled beneficiary to have a plan of care. Hospices must use an interdisciplinary team of hospice physicians, nurses, and social workers (in collaboration with the beneficiary’s attending physician, if any) to develop a comprehensive plan of care that addresses the physical, psychosocial, spiritual, and emotional needs of the beneficiary, family, and caregivers.[16] Hospice plans of care must specify the frequency of services needed, including visits, and hospices must update plans of care at least every 15 days; however, there are no minimum requirements for the number of visits delivered to a Medicare beneficiary during a hospice stay.[17]
In a 2019 report, the Department of Health and Human Services’ Office of Inspector General (HHS-OIG) found that these plans of care are not regularly reviewed to determine if the frequency of visits is appropriate for the beneficiaries’ needs or if the plans of care are being followed. Specifically, HHS-OIG found that almost 60 percent of hospices inspected from 2012 through 2016 failed to meet all care planning requirements, and many of these hospices failed to ensure that they provide the services specified in care plans.[18] The HHS-OIG noted that these requirements are essential to delivering quality care to beneficiaries, and failure to meet them poses risks to beneficiaries.
Trends in Hospice
Medicare Hospice and Non-Hospice Spending
Since 2015, Medicare spending for hospice beneficiaries has nearly doubled. This spending includes both spending on hospice services and non-hospice services. (See fig. 1.) Non-hospice spending is for services provided to beneficiaries enrolled in hospice and must be unrelated to a beneficiary’s terminal illness and related conditions. Medicare’s non-hospice spending for Parts A and B of the program—which cover inpatient and outpatient care—increased from $0.6 billion in fiscal year 2015 to $2.0 billion in 2024, according to CMS.[19] This represents about a 157 percent increase in non-hospice spending per beneficiary for Parts A and B, which is more than triple the 43 percent increase in total spending per beneficiary for Medicare Parts A and B from 2015 to 2024 for all beneficiaries. For additional analysis of Medicare hospice and non-hospice spending, see appendix II.
Figure 1: Medicare Spending for Hospice Beneficiaries Under Parts A and B, Fiscal Years 2015 Through 2024
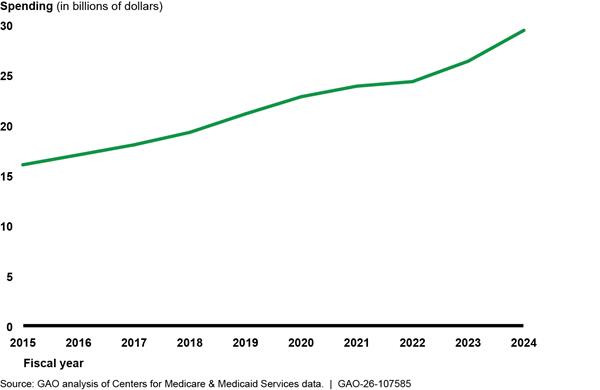
Several factors have contributed to growth in hospice spending. From 2015 through 2024, the number of beneficiaries receiving hospice per year grew 32 percent from 1.38 million to 1.82 million. In addition, the average amount of time beneficiaries spent in hospice increased, as described in the following section.
Length of Hospice Stays
The length of hospice stays—the periods of time beneficiaries continuously receive care from a hospice—affects Medicare spending. Although beneficiaries enrolled in the hospice benefit must be medically certified as having a terminal illness with a life expectancy of 6 months or less, beneficiaries may remain enrolled in the hospice benefit for more than 6 months. To remain enrolled, beneficiaries’ terminal illness must be recertified by a hospice every 60 to 90 days.[20]
When the Medicare hospice benefit was introduced in 1983, the average lifetime length of stay for beneficiaries enrolled in the hospice benefit was between 55 and 75 days.
The average length of hospice stays grew 15 percent from 2015 through 2024, according to MedPAC. Beneficiaries spent 100 days receiving hospice care in 2024, on average, which was up from 87 days in 2015. (See fig. 2.)
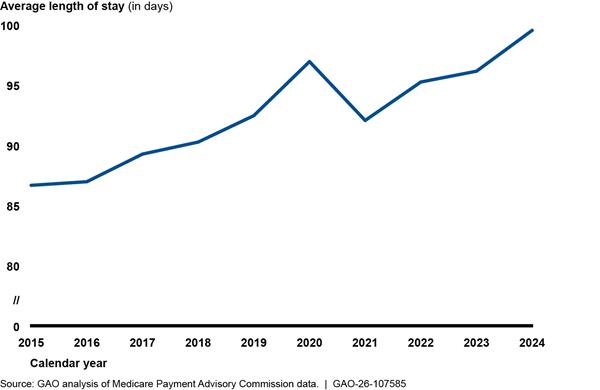
Note: The average length of hospice stays represents the average number of all days of hospice care for a Medicare beneficiary who is now deceased. A contributing factor to the decrease in average lengths of stay in 2021 is likely the COVID-19 pandemic. The Medicare Payment Advisory Commission found that the 27,000 hospice beneficiaries who died in 2020 with COVID-19 as a primary diagnosis had shorter length of stay—that is, a median length of stay of 3 days and an average length of stay of 26 days.
According to MedPAC, long stays over 180 days accounted for about 60 percent of hospice spending in 2024, and about 40 percent of that spending was for beneficiaries who had already received at least 1 year of hospice services. One year is at least double the 6-month life expectancy required to be eligible for hospice. This increase is due to an increasing proportion of, and longer hospice stays for, beneficiaries with cardiac or neurological illnesses, according to MedPAC. The length of hospice stays for beneficiaries with terminal cardiac illnesses—such as congestive heart failure—grew 16 percent and for beneficiaries with a neurological illness—such as dementia—increased 12 percent on average from 2015 through 2023. In contrast, the length of stay for beneficiaries with cancer declined from 2015 to 2023 while the percentage of hospice beneficiaries with cancer also declined. See figure 3 and, for additional analysis of hospice visit utilization segmented by beneficiaries’ terminal illness category, see appendix IV.
Figure 3: Percentage Change in Length of Medicare Hospice Stay on Average, by Terminal Illness Category, 2015 Through 2023
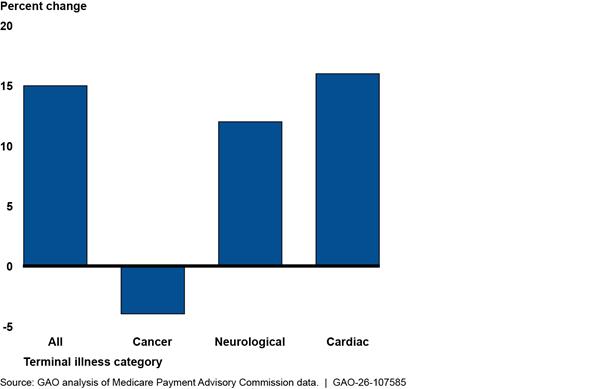
Note: The average length of hospice stays represents the average number of all days of hospice care for a Medicare beneficiary who is now deceased.
Hospice Payment System
Medicare pays hospices from a Medicare Trust Fund, and payment is based on the level of hospice care delivered to beneficiaries on a given day.[21] There are four levels of hospice care—continuous home care, respite care, general inpatient care, and routine home care.[22] Routine home care accounted for about 99 percent of all Medicare hospice days in fiscal year 2024 and is paid on a daily rate for any day in which the beneficiary is enrolled in hospice and does not receive any of the other three levels of care.
Medicare’s payment rates for routine home care are higher in the first 60 days of a hospice stay. In addition to the daily payment rate, Medicare makes an additional payment—called a service intensity add-on payment—for visits by registered nurses or social workers during the last 7 days of a beneficiary’s life. (See table 1.)
|
Level of care |
Description |
Fiscal year 2026 payment rate |
|
|
Routine home care |
Provided on a routine day in which none of the other levels of care are provided. |
Days 1 – 60 |
$230.83 |
|
Days 61+ |
$181.94 |
||
|
Service intensity add-on payment for direct care furnished by a registered nurse or social worker during the last 7 days of a beneficiary’s life. This is paid in addition to the routine home care daily rate. |
$69.76 per hour for a minimum of 15 minutes per day up to a maximum of four hours per day. |
||
Sources: GAO analysis of Centers for Medicare & Medicaid Services (CMS) information. I GAO‑26‑107585
Note: CMS adjusts the payment rates shown in this table for geographic differences in wages when making payments to hospices. Hospices that failed to report required quality data to CMS in fiscal year 2026 received a 4-percentage-point reduction to their annual payment updates.
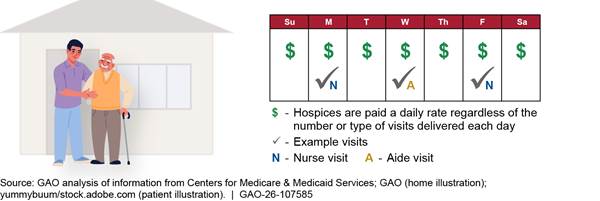
The daily rate remains the same regardless of the number of visits delivered each day, or by the type of health care professional (nurse, aide, or social worker) delivering these visits. (See fig. 4.) This daily payment structure allows hospices to develop individualized plans of care that tailor the visits delivered to the specific needs of the beneficiary. According to some researchers, it also could incentivize hospices to provide less care—that is, fewer total visits or fewer nurse visits—or selectively enroll beneficiaries likely to have longer lengths of stay to capitalize financially.[23]
To ensure that hospice care does not exceed the cost of conventional medical care at the end of life, CMS imposes two payment limitations for hospices (referred to as caps) on Medicare payment for hospice services.[24] The first cap, the aggregate cap, limits a hospice’s total Medicare payments in a given year. The second cap limits the number of hospice inpatient days. The aggregate cap is determined by multiplying the number of beneficiaries in a hospice by an annual payment cap amount. For fiscal year 2026, the aggregate cap was $35,361.44. The inpatient cap limits the number of inpatient hospice days to 20 percent of a hospice’s total Medicare beneficiary care days each year.
Hospice Payment Reform
CMS implemented a single hospice daily payment rate when the Medicare benefit began in 1983 which, until 2016, the agency had primarily been adjusting to account for inflation.[25] Research in the 2000s—such as from MedPAC—showed that a single hospice daily rate did not reflect actual patterns of care—that is, a “U-shaped curve” where visits were the most frequent at the start and end of a hospice stay and least frequent in the middle between these two periods.[26]
In 2010, the Patient Protection and Affordable Care Act required CMS to collect data to inform hospice payment revisions for routine home care, including by adjusting daily payment rates to account for changes in resource intensity throughout hospice stays.[27] In 2014, CMS began collecting and analyzing data annually to determine what, if any, refinements should be made in the hospice payment system. In 2016, CMS implemented the 2-tiered daily rates and service intensity add-on payments to mitigate incentives for hospices to selectively enroll beneficiaries likely to have long stays and to better reflect the actual pattern of hospice visits over the course of a hospice stay based on Medicare claims data.[28]
CMS also later revised the rates for fiscal year 2020 based on its analysis of cost report data that showed fiscal year 2019 rates for the three higher levels of care were below costs while the routine home care rates were above costs.[29] Specifically, CMS rebased fiscal year 2019 daily payment rates for three higher levels of care to align with costs and reduced rates for routine home care by 2.7 percent. (See table 2.) CMS then set final fiscal year 2020 daily rates based on adjustments to the fiscal year 2019 rebased rates to account for inflation and other factors.
|
Level of care |
Fiscal year 2020 percentage of Medicare hospice days |
Fiscal year 2019 daily rate |
Fiscal year 2019 rebased daily rate |
Percent change from rebasing |
Fiscal year 2020 daily rate |
|||
|
Routine home care |
98.6 |
Days 1 – 60 |
$196.25 |
Days 1 – 60 |
$190.91 |
-2.7 |
Days 1 – 60 |
$194.50 |
|
Days 61+ |
$154.21 |
Days 61+ |
$150.02 |
-2.7 |
Days 61+ |
$153.72 |
||
|
$41.56 per hour up to a maximum of 4 hours per day for visits by registered nurses or social workers in the last 7 days of a beneficiary’s life. |
$56.80 per hour up to a maximum of 4 hours per day for visits by registered nurses or social workers in the last 7 days of a beneficiary’s life. |
+36.7 |
$58.15 per hour up to a maximum of 4 hours per day for visits by registered nurses or social workers in the last 7 days of a beneficiary’s life. |
|||||
|
Continuous home care |
0.2 |
$41.56 per hour |
$56.80 per hour |
+36.7 |
$58.15 per hour |
|||
|
Inpatient respite care |
0.2 |
$176.01 |
$437.86 |
+148.8 |
$450.10 |
|||
|
General inpatient care |
1.0 |
$758.07 |
$992.99 |
+31.0 |
$1,021.25 |
|||
Source: GAO analysis of Centers for Medicare & Medicaid Services (CMS) information. I GAO‑26‑107585
Note: CMS adjusts the payment rates shown in this table for geographic differences in wages when making payments to hospices. The 2020 daily rate accounts for inflation.
Low-Visit Hospices Delivered Half as Many Visits to Medicare Beneficiaries on Average as High-Visit Hospices
Low-visit hospices—the 20 percent of hospices with the fewest visits per week—delivered about half the visits compared to high-visit hospices—the 20 percent of hospices with the highest visits per week on average.[30] Specifically, low-visit hospices delivered a total of 2.5 visits per beneficiary per week on average, compared to a total of 5.5 visits per week on average for high-visit hospices.[31] (See fig. 5.)
Figure 5: Average Number of Routine Home Care Hospice Visits for Selected Medicare Beneficiaries Discharged in 2024, by Low- to High-Visit Hospices
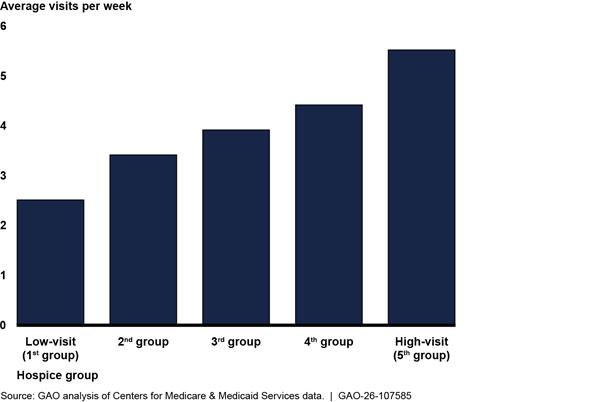
Note: GAO analyzed hospice visits for routine home care for 1,225,049 beneficiaries who were discharged deceased or alive from hospice in 2024, had been in hospice since 2022, and did not have hospice claims from January through June 2025. GAO divided 4,340 hospices into five groups of equal size, or quintiles, from the lowest to highest number of average visits per week. GAO excluded small hospices with fewer than 30 selected beneficiaries or 30 visits.
Nurses and aides deliver most hospice visits, and we also found that low-visit hospices delivered fewer nurse and aide visits to beneficiaries than high-visit hospices, on average. Low-visit hospices delivered 1.4 nurse visits per week (more than half of their total visits) compared to 2.2 for high-visit hospices (less than half of their total visits) on average. Low-visit hospices also delivered 0.8 aide visits per week (one-third of their total visits) compared to 2.9 for high-visit hospices (over half of their total visits).
Hospice representatives we spoke with said that the number of visits can vary across hospices for several reasons. They explained that beneficiaries’ needs can affect the number of visits that hospices deliver. These representatives also said that visits can vary based on beneficiary preferences for care as well as available caregiver support. They further noted that visits can vary because of differences in the types of beneficiary terminal illnesses that hospices treated. For example, beneficiaries with cancer typically receive fewer visits but a higher proportion of nurse visits than beneficiaries with other types of terminal illnesses who may receive more visits but a higher proportion of aide visits.
We analyzed low- and high-visit hospices’ beneficiary populations and characteristics, including the type of beneficiary terminal illness. On average, we found that low- and high-visit hospices treated about the same proportion of beneficiaries with cancer, but the proportions of cardiac and neurological illnesses differed.[32] However, regardless of the type of terminal illness, low-visit hospices averaged about half the number of visits delivered to a beneficiary per week. See appendix IV for further details.
Over half of the low-visit hospices were concentrated in seven states. This includes California, which had 303 (or 35 percent) of the 868 total low-visit hospices. Four of the states with 20 or more low-visit hospices have been selected by CMS for enhanced oversight of new hospices (consisting of medical reviews before any payments are made) due to rapid growth in hospices in these states.[33] See figure 6 and appendix IV for further details.
Figure 6: Number of Low-Visit Hospices by State for Selected Medicare Beneficiaries Discharged in 2024
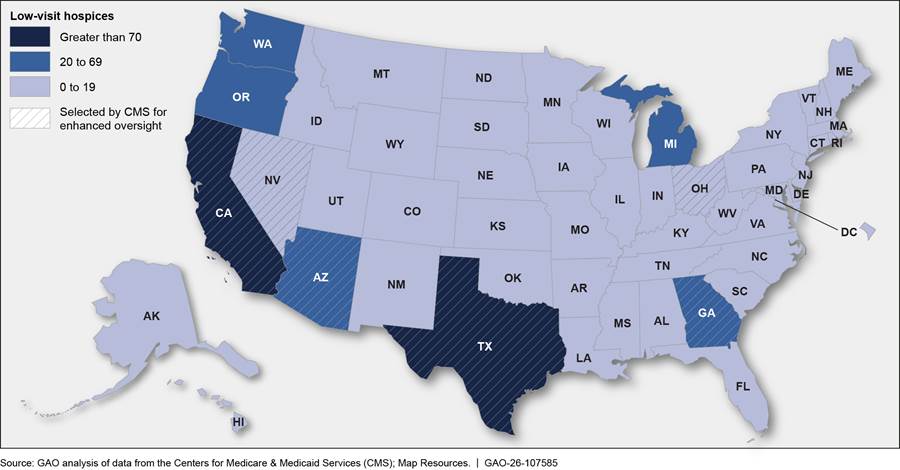
Note: GAO analyzed hospice visits for routine home care for 1,225,049 beneficiaries who were discharged deceased or alive from hospice in 2024, had been in hospice since 2022, and did not have hospice claims from January through June 2025. Low-visit hospices include 20 percent of hospices that conducted the fewest visits for a beneficiary per week, on average. GAO analyzed visits for 4,340 hospices and excluded small hospices with fewer than 30 selected beneficiaries or 30 visits. CMS selected Arizona, California, Nevada, and Texas in 2023 for enhanced oversight of new hospices due to rapid growth in hospices in these states and selected Georgia and Ohio for this oversight in 2025.
Hospice Routine Home Care Payments Exceeded What Would Be Paid Using Home Health Per-Visit Payment Rates
Medicare Effectively Paid Low-Visit Hospices More Than Double Per Visit Compared to High-Visit Hospices and to Home Health Per-Visit Rates
The estimated average per-visit payment for low-visit hospices was more than double that of high-visit hospices—$573 compared to $232.[34] This is because low-visit hospices received the same daily payment rate for each day a beneficiary is enrolled in hospice regardless of whether the hospice delivers any visits to the beneficiary.[35] These daily rates result in higher estimated per visit payments to hospices that deliver the fewest visits. For example, a hypothetical hospice that delivered two visits to a beneficiary in a week for $1,000 in Medicare payment would effectively receive $500 per visit while another hypothetical hospice that delivered five visits to a beneficiary in a week for the same payment would effectively receive $200 per visit. (See fig. 7.)
Figure 7: Hypothetical Examples of Weekly Routine Home Care Visits and Estimated Payments per Visit for Low- and High-Visit Hospices
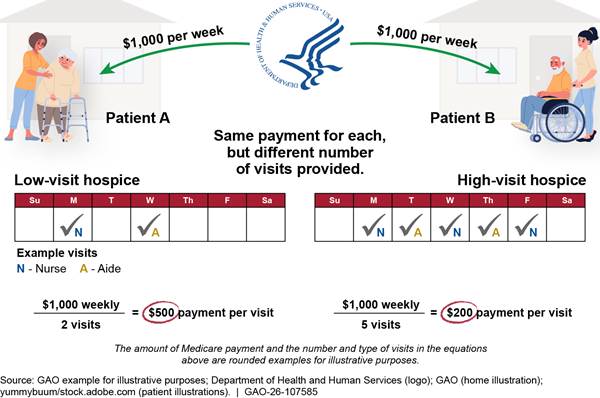
Note: Medicare pays a hospice for each day a beneficiary is enrolled in hospice regardless of whether the hospice provides any visits to the beneficiary.
We also found that effective hospice per-visit payments were much higher than Medicare home health per-visit rates.[36] Hospice and home health visits are comparable because they involve similar services provided by the same types of health care professionals (see text box). The effective $573 average per-visit payment for low-visit hospices is more than double the $214 average payment these hospices would have received under home health per-visit rates for the same mix of health care professionals.[37]
|
Comparison of Medicare Hospice and Home Health Visits The same types of health care professionals provide similar services through Medicare’s hospice and home health benefits. For example, during hospice and home health visits, nurses assess patients, administer medications, and provide patient and caregiver education; aides provide personal care such as bathing, dressing, and grooming; and social workers provide counseling services, according to the Centers for Medicare & Medicaid Services (CMS). Hospice staff must meet the same licensing and certification requirements as those providing home health services, according to CMS officials. Moreover, selected hospice and home health industry representatives from one national organization told GAO that hospices and home health agencies draw from the same labor pool, and there are no differences in wages for staff in hospices and home health agencies. Wage studies from 2021 to 2022, conducted by the Hospital and Healthcare Compensation Service, found that registered nurses were paid average wages of $35 per hour across settings. CMS has calculated a different proportion of labor costs for hospice compared to home health care. In the aggregate, the labor portion of hospice routine home care costs was 66 percent, and the labor portion of home health costs was about 75 percent in 2024. There are other differences between the hospice and home health benefits. Certain items and services—such as drugs, durable medical equipment, and spiritual counseling—are covered under the hospice, but not home health, payment rates. In GAO’s analyses comparing hospice and home health payments per visit, GAO adjusted home health payments to help account for these differences. |
Source: GAO analysis of information from the Centers for Medicare & Medicaid Services, selected hospice and home health industry representatives, and the Hospital and Healthcare Compensation Service. | GAO‑26‑107585
For high-visit hospices, estimated hospice per-visit payments were also higher than Medicare home health per-visit rates, but to a lesser degree than for low-visit hospices. In our analysis, high-visit hospices’ estimated average hospice per-visit payment is $232, which is higher than the $156 rate the hospices would have received for comparable visits under home health using the same mix of health care professionals.
Low- and high-visit hospices would have received different average home health rates per visit—$214 and $156 respectively—because of differences in the type of health care professionals used to deliver hospice care. Specifically, low-visit hospices had a higher share of more expensive nurse visits than high-visit hospices—57 percent compared to 40 percent. Since home health per-visit rates are based on the type of health care professional delivering the visits, they are a more precise estimate of resources hospices expend to deliver visits than the hospice daily rates. (See fig. 8.)
Figure 8: Average Estimated Per-Visit Hospice Payment Compared to Home Health Per-Visit Rates for Low- and High-Visit Hospices for Selected Beneficiaries Discharged from Hospice in 2024
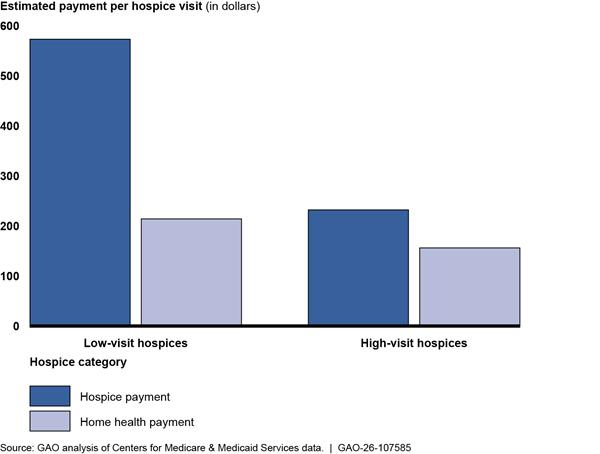
Notes: Home health per-visit rates apply when a beneficiary receives fewer than a set number of visits (typically two to five) within a 30-day period. GAO analyzed hospice visits for routine home care for 1,225,049 beneficiaries who were discharged deceased or alive from hospice in 2024, had been in hospice since 2022, and did not have hospice claims from January through June 2025. GAO divided 4,340 hospices into five groups of equal size, or quintiles, from the lowest to highest number of average visits per week. Low-visit hospices—the bottom quintile, or 20 percent, of hospices—delivered 2.5 visits per week on average compared to 5.5 visits for high-visit hospices—the top quintile or 20 percent. GAO excluded small hospices with fewer than 30 selected beneficiaries or 30 visits.
GAO made several adjustments to account for differences between hospice payments and estimated home health per-visit payments. Specifically, GAO increased aggregate home health payments to account for services that are covered by hospice, but not home health, payment rates (e.g., drugs, durable medical equipment, and spiritual counseling). GAO also adjusted home health payments to account for differences in the average length of visits; for geographic wage differences; and for a higher payment that is made for the first home health visit.
We estimate that Medicare’s total adjusted payments for routine home care for the selected beneficiaries discharged in 2024 in our cohort were about $7.6 billion higher than they would have been under the home health per-visit payment rates for comparable services. Specifically, Medicare paid about $16.7 billion for hospice routine home care for our selected beneficiaries but would have paid about an estimated $9.1 billion if the care had been reimbursed under the home health payment per-visit rates for comparable services. (See table 3.)
Table 3: Medicare Payments for Hospice Using Hospice Payment Rates and Estimated Home Health Per-Visit Rates for Selected Beneficiaries Discharged in 2024
|
Medicare payments under hospice and home health payment rates |
$ billions |
|
Payments using hospice ratesa |
16.7 |
|
Payments under home health per-visit ratesa |
9.1 |
|
Difference between payments using hospice payment rates and home health per-visit rates |
7.6 |
Source: GAO analysis of data from the Centers for Medicare & Medicaid Services. | GAO‑26‑107585
Note: Home health per-visit rates apply when a beneficiary receives fewer than a set number of visits (typically two to five) within a 30-day period. GAO analyzed hospice visits for routine home care for 1,225,049 beneficiaries who were discharged deceased or alive from hospice in 2024, had been in hospice since 2022, and did not have hospice claims from January through June 2025. GAO analyzed visits for 4,340 hospices and excluded small hospices with fewer than 30 selected beneficiaries or 30 visits.
aGAO made several adjustments to account for differences between hospice payments and home health per-visit payments. For example, GAO increased aggregate home health payments to account for services that are covered by hospice, but not home health, payment rates (e.g., drugs and durable medical equipment) and for geographic wage differences between the two programs.
Medicare’s Daily Hospice Payment Structure and Rates Resulted in Higher Spending Compared to Home Health Per-Visit Rates
Our analysis shows that the hospice daily payment rate structure leads to higher spending compared to what Medicare would have paid for comparable services under the home health benefit. Also, our analysis shows that hospices’ daily payment rate—in contrast to a per-visit payment rate—likely creates an incentive for longer lengths of stay, fewer visits, or less expensive aide visits because the daily payment rate does not change regardless of the number and type of hospice visit provided.[38]
However, CMS officials stated that the current daily hospice payment structure and rates fulfill the agency’s statutory authority. In March 2026, CMS officials told us that the agency fulfilled its statutory obligation to rebase hospice payment rates in 2019 and subsequently continues to implement annual updates according to the law.[39] Officials stated that the statute does not provide the agency with explicit or implicit authority for further refinements to hospice payment. It also does not provide flexibility for CMS to modify or change the per day payment structure. Officials also stated that they routinely collect data on the utilization of the hospice benefit, but these data cannot be used to restructure the hospice payment as the statute specifies that the payment is made on a per-day basis. The agency stated it will continue to monitor hospice utilization to determine if there is a need to further change the payment rates and if the statute provides the authority to do so.
The misaligned incentives we have identified in the hospice program may lead to excess spending and have adverse effects on the sustainability of the Medicare program. Such incentives and potential excess spending also may attract fraudsters to enroll as hospices. We have previously identified instances in which payment rates were inconsistent with Medicare’s aim of being an efficient purchaser of health care services.[40] Without revisions to the hospice payment system to address the issues we have identified, CMS is likely unable to ensure that the Medicare program is an efficient purchaser of health care services.
Conclusions
CMS has a responsibility to ensure Medicare is an efficient purchaser of health care services. Paying a daily rate for routine home care visits allows hospices to tailor the frequency of visits to the specific needs of each beneficiary as outlined in individualized plans of care. On the other hand, this payment system can also incentivize longer lengths of stay in hospice, the delivery of fewer visits, or less expensive aide visits because the payment rate does not change regardless of the number or type of visits. Our analysis shows that, while CMS made refinements in 2016 and 2020, hospice payment rates are substantially higher than the rates Medicare would likely have paid for comparable home health visits paid on a per-visit basis.
CMS told us that they do not have the statutory authority to make additional refinements beyond those that were required in statute. Until Congress directs CMS to revise its payment system for hospice routine home care, CMS is likely unable to take steps to better ensure Medicare is fulfilling its role as an efficient purchaser of routine home care services. Further, the hospice program cannot realize any potential savings for the Medicare Trust Fund.
Matter for Congressional Consideration
Congress should consider directing the Secretary of the Department of Health and Human Services to revise the hospice payment system for routine home care services to better promote payment efficiency and realize savings for the Medicare program. (Matter for Consideration 1)
Agency Comments
We provided a draft of this report to the Department of Health and Human Services for review and comment. The agency provided technical comments, which we incorporated as appropriate.
We are sending copies of this report to the appropriate congressional committee, the Secretary of Health and Human Services, the Administrator of the Centers for Medicare & Medicaid, and other interested parties. In addition, the report is available at no charge on the GAO website at https://www.gao.gov.
If you or your staff have any questions about this report, please contact me at gordonlv@gao.gov. Contact points for our Offices of Congressional Relations and Media Relations may be found on the last page of this report. GAO staff who made key contributions to this report are listed in appendix V.

Leslie V. Gordon
Director, Health Care
This appendix provides details on our scope and methodology to address our first and second reporting objectives, which
· describe the frequency of hospice routine home care visits among selected hospices and Medicare beneficiaries; and
· compare estimated per-visit payment rates for hospice routine home care across selected hospices and to home health per-visit rates.
To address these two objectives, we analyzed Medicare hospice claims data from the Integrated Data Repository and resources from the Centers for Medicare & Medicaid Services (CMS).[41] Our analysis included hospice routine home care days for a cohort of beneficiaries.[42] Our cohort included Medicare beneficiaries discharged deceased or alive from hospice care in 2024 who had not reenrolled in the hospice benefit by June 30, 2025. We reviewed claims for these beneficiaries dating back to January 1, 2022. We selected this longitudinal approach to capture beneficiaries’ hospice experiences and patterns of care over time that may span across years (e.g., from 2022 to 2024). A longitudinal study allows detection of changes in the characteristics of the cohort at both the hospice and the beneficiary level, thus establishing sequences of events.
We then constructed a hospice-level cohort for this population of beneficiaries. We included only hospices that had at least 30 beneficiaries who met the above criteria and had delivered at least 30 visits to these beneficiaries during the study period. These thresholds were intended to ensure adequate sample sizes for reliable estimates and to improve the robustness of comparisons across hospices to allow sufficiently meaningful detection of differences, if any. In addition, we excluded 64 hospices that were terminated from Medicare in 2024 and 2025. Of the total 6,439 hospices that provided hospice care to our beneficiary cohort, 4,340 hospices (67 percent) met these criteria, and a total of 1,225,049 beneficiaries in our cohort (98 percent) were included in the final analysis. The selected hospices and beneficiaries are not generalizable to all hospice providers and beneficiaries but allowed us to compare hospices and analyze care for beneficiaries whose hospice stays were complete.
To describe the visits delivered across our selected hospices, we first calculated the average number of visits per week for each hospice. We did this by dividing the total number of visits by total routine home care days and then multiplying by seven.[43] We then divided hospices into five groups of equal size, or quintiles, ranked from the lowest to highest number of average visits per week. We calculated average number of visits per week for each quintile by taking the average of all hospices in the quintile.
To compare estimated hospice per-visit payments for routine home care visits across hospices, we calculated an average payment per visit for each hospice by dividing total routine home care payments by the total number of routine home care visits.[44] We then took the average of this payment per visit for all hospices in each quintile. To compare estimated hospice per-visit payments for routine home care visits to payments under home health per-visit rates, we reviewed CMS guidance on home health payment rates and policies and used 2024 home health per-visit rates published in a CMS final rule.[45] See table 4.
|
Occupation |
Payment rate (in dollars) |
|
Home health aide |
76.23 |
|
Nurse |
168.37 |
|
Physical therapist |
184.03 |
|
Occupational therapist |
185.29 |
|
Speech language pathologist |
200.04 |
|
Social worker |
269.87 |
Source: Centers for Medicare & Medicaid Services information. | GAO‑26‑107585
We consider Medicare’s home health per-visit rates a reasonable benchmark for the estimated per-visit rates for routine home care visits for several reasons.
1. Hospice level cost data for individual beneficiary visits are not readily available. (Medicare hospices are not reimbursed on a cost basis, and their routine home care payments are not directly linked to their underlying costs.) Home health per-visit rates are calculated using standardized national home health agency cost report data, wage adjustments, and resource use for each type of health care professional, which makes them a rough benchmark for the labor, travel, and overhead associated with a single nursing, aide, therapist, or social worker visit.
2. In addition to serving as a proxy for underlying direct patient service costs, home health per-visit rates represent established, nationally standardized visit-level payment amounts for home health service visits and allow a simulation of what Medicare might have paid if hospice services were reimbursed under a per-visit methodology rather than daily payment rates. Applying home health per-visit rates to hospice visits also offers a framework for modeling an alternative payment approach.
3. Home health per-visit rates vary depending on the type of health care professional delivering the visit (nurse, aide, and social worker) unlike the daily hospice payment rates. The average home health per-visit payment rates account for differences in the types of health care professionals delivering visits across hospices and more accurately reflect the resources hospices expend to deliver visits than hospice daily payment rates.
4. Visits under both programs are delivered in the beneficiary’s home by the same types of health care professionals performing the same types of activities, and there are no wage differences for staff in both programs.
5. Finally, as with hospice payment rates, the home health per-visit rates are not adjusted for the beneficiary’s medical diagnosis.
To improve comparability between hospice and home health estimated payments, we applied statistical adjustments to home health per-visit rates to account for key differences in the types of services covered, the amount of staff time required to deliver visits, regional wage differences, and the higher costs associated with initiating home health services. Using Medicare cost report data, claims information, and CMS payment guidance, we developed adjustment factors that standardized estimates so that hospice and home health costs could be compared. For each visit, we estimated the home health payment rate by:
1. starting with the nationally standardized home health per-visit rate for each occupation,
2. increasing the rate to account for services that are covered under the hospice daily rates but not home health rates,
3. adjusting for occupation-specific visit time,
4. multiplying by the number of visits by occupation, and
5. applying the geographic wage adjustment.
We also applied a first-visit add-on payment to home health rates for the first visit in each hospice stay to capture the additional resources required for initial assessment and care planning. We then summed the per-visit payments to generate total estimated payments for each hospice. The net effect of these adjustments was an increase of 25 percent in home health payments.
· Increases to account for services or items covered under hospice daily rates but not home health rates. The hospice daily rates cover certain items and services—such as drugs, durable medical equipment, and spiritual counseling—that are not covered under home health rates. To adjust for differences between the hospice and home health benefits, we first compared the categories of services covered under each benefit from their respective fiscal year 2023 Medicare Cost Report Worksheets A and O (cost reports). We estimated the average percentage of hospice costs for services not covered under home health rates using information from cost reports. We then increased the home health per-visit rates by this percentage. The hospice cost reports we reviewed represented about 93 percent of hospices in 2023, according to the Medicare Payment Advisory Commission.
· Occupation-specific visit time. Visit durations vary slightly across occupations between hospice and home health. For example, hospice aide visits average 59 minutes, compared to 63 minutes for home health aide visits. To account for these differences, we calculated occupation-specific adjustment factors. We computed average minutes per visit for four occupational groups—nurses, aides, therapists, and social workers—in hospice and compared them to home health averages obtained from CMS guidance.[46] We defined each adjustment factor as the ratio of hospice to home health visit time and applied it to the corresponding per-visit rate to standardize estimates across settings. See table 5. For example, we decreased the home health per-visit rate for aide visits by 6 percent because home health aides had longer visits than hospice aides. Similarly, we increased the home health per-visit rate for nurses by 18 percent because hospice nurses had longer visits than home health nurses.[47]
Table 5: Average Minutes Per Visit for Home Health and Hospice for Selected Medicare Beneficiaries Discharged from Hospice in 2024
|
Occupation |
Hospice average |
Home health average |
Adjustment factor |
|
Aide |
59.45 |
63.00 |
0.94 |
|
Nurse |
52.82 |
44.80 |
1.18 |
|
Physical therapist |
46.92 |
46.60 |
1.01 |
|
Occupational therapist |
46.12 |
47.10 |
0.98 |
|
Speech language pathologist |
51.33 |
48.10 |
1.07 |
|
Social worker |
45.79 |
56.50 |
0.81 |
Source: GAO analysis of data from the Centers for Medicare & Medicaid Services. | GAO‑26‑107585
Note: Average minutes per visit data for home health were published by the Centers for Medicare & Medicaid Services. GAO analyzed hospice visits for routine home care for 1,225,049 beneficiaries who were discharged deceased or alive from hospice in 2024, had been in hospice since 2022, and did not have hospice claims from January through June 2025.
· Geographic wage adjustment. We applied a geographic wage factor to home health per-visit payments to reflect regional variation in labor costs, using Core Based Statistical Area wage index values from CMS for both rural and urban areas. This adjustment ensured that home health per-visit payments aligned with the wage-adjusted nature of actual hospice payments.
· First-Visit Add-on Factor. Home health per-visit rates include an enhanced first-visit payment to reflect additional time and resources required for assessment and care planning. To align hospice estimates, we applied the nursing first-visit add-on amount, calculated from national per-visit rates as the difference between the enhanced and standard nursing visit rate ($121.79 per hospice stay). We applied this adjustment to each beneficiary stay.
To assess the reliability of claims data, we examined relevant documentation, interviewed knowledgeable agency officials, and conducted data checks such as confirming claims had appropriate type of bill and discharge codes. To assess the reliability of cost report data, we examined relevant documentation and compared results to a published analysis on direct patient costs for hospice. We determined that these data were sufficiently reliable for the purpose of our objectives.
We also interviewed and reviewed reports from five researchers and six national organizations—including a consumer advocacy group and five provider groups—to obtain their perspectives on hospice patterns of care.[48] We selected these researchers and organizations based on involvement in or knowledge of hospice care, such as published reports or research articles on hospice care, public comments on hospice rulemaking, or their work advocating for hospice beneficiaries and their families or caregivers. The views of these researchers and stakeholder groups we selected are not generalizable to all such groups, but they provided valuable insights on hospice patterns of care and factors that affect hospice payment, among other things.
This appendix provides additional information about Medicare spending for hospice care and spending on services for hospice beneficiaries outside of the hospice benefit, known as non-hospice spending. Medicare providers can deliver non-hospice services under Medicare Parts A and B that are required to be unrelated to a beneficiary’s terminal illness and related conditions.[49]
Medicare Part A and B non-hospice spending in our analysis represents the sum of estimated payments per hospice service day for the beneficiaries in our cohort.[50] We apportioned Medicare Part A and B paid amounts equally across the length of each non-hospice claim and counted only the days that overlapped a hospice stay—not including hospice admission or live discharge days. Payments include Medicare paid amounts for hospice and non-hospice claims and exclude any additional payments made by beneficiaries or other entities. We also analyzed this spending for hospices with varying average weekly routine home care visits for a beneficiary. We grouped hospices into five groups of equal size, or quintiles, ranked from the lowest to highest visits per week. We refer to the 20 percent of hospices with the lowest number of visits as low-visit hospices and the 20 percent with the highest number of visits as high-visit hospices.
We found that total hospice spending for routine home care was $16.7 billion, and non-hospice spending was $1.3 billion for selected beneficiaries discharged from hospice in 2024. Hospice spending per week for low-visit hospices was 6 percent higher than high-visit hospices ($1,313 compared to $1,241), but non-hospice spending was 11 percent higher ($129 compared to $116). See table 6. The percentage of weekly spending that was for non-hospice services was 9 percent for both low- and high-visit hospices.
Table 6: Medicare Hospice and Non-Hospice (Part A and B) Spending per Week of Routine Home Care for Selected Beneficiaries Discharged from Hospice in 2024, by Low- to High-Visit Hospices
|
|
Spending per week on routine home care (dollars) |
|
||
|
Hospice group |
Hospice |
Non-hospice |
Percentage of spending per week that is non-hospice |
|
|
1 (low-visit) |
1,313 |
129 |
9% |
|
|
5 (high-visit) |
1,241 |
116 |
9% |
|
Source: GAO analysis of data from the Centers for Medicare & Medicaid Services. | GAO‑26‑107585
Note: GAO analyzed hospice visits for routine home care for 1,225,049 beneficiaries who were discharged deceased or alive from hospice in 2024, had been in hospice since 2022, and did not have hospice claims from January through June 2025. GAO divided hospices into five groups of equal size, or quintiles, from the lowest to highest number of average visits per week. Low-visit hospices—the bottom quintile, or 20 percent, of hospices—delivered 2.5 visits per week on average compared to 5.5 visits for high-visit hospices—the top quintile or 20 percent. GAO excluded small hospices with fewer than 30 selected beneficiaries or 30 visits.
This appendix provides additional information about Medicare hospice visits and care for beneficiaries with different types of terminal illnesses, including cancer, cardiac diseases such as heart failure, and neurological illnesses such as Alzheimer’s disease.
We analyzed selected beneficiaries’ primary diagnoses for terminal illnesses and patterns of care using hospice claims from the Integrated Data Repository and a crosswalk from the Centers for Medicare & Medicaid Services (CMS).[51] We assigned primary diagnosis categories to selected beneficiaries using a crosswalk between primary diagnosis codes and diagnosis categories that CMS uses for its hospice monitoring report.[52] We focused on the top three primary diagnosis categories, which collectively accounted for about 60 percent of selected beneficiaries.
We found that the number and type of hospice nurse and aide visits for routine home care differed across beneficiaries with different types of terminal illnesses. (See table 7.)
Table 7: Average Number and Type of Hospice Visits per Week for Routine Home Care, by Terminal Illness for Selected Medicare Beneficiaries Discharged in 2024
|
|
Number of visits per week |
|||
|
Type of terminal illness |
Nurse |
Aide |
Social worker |
Total |
|
Cancer |
2.1 |
1.3 |
0.4 |
3.7 |
|
Cardiac |
1.8 |
1.7 |
0.3 |
3.8 |
|
Neurological |
1.7 |
2.2 |
0.3 |
4.2 |
|
All |
1.8 |
1.8 |
0.3 |
3.9 |
Source: GAO analysis of data from the Centers for Medicare & Medicaid Services. | GAO‑26‑107585
Note: GAO analyzed hospice visits for routine home care for 1,225,049 beneficiaries who were discharged deceased or alive from hospice in 2024, had been in hospice since 2022, and did not have hospice claims from January through June 2025. GAO excluded small hospices with fewer than 30 selected beneficiaries or 30 visits.
Beneficiaries with cancer typically received routine home care for about half as many days as beneficiaries with cardiac illnesses and about one-third as many days as beneficiaries with neurological illnesses. (See table 8.)
Table 8: Average Number of Hospice Days in Routine Home Care by Type of Terminal Illness for Selected Medicare Beneficiaries Discharged in 2024
|
Type of terminal illness |
Average number of days |
|
Cancer |
47 |
|
Cardiac |
90 |
|
Neurological |
131 |
|
All |
80 |
Source: GAO analysis of data from the Centers for Medicare & Medicaid Services. | GAO‑26‑107585
Note: GAO analyzed hospice visits for routine home care for 1,225,049 beneficiaries who were discharged deceased or alive from hospice in 2024, had been in hospice since 2022, and did not have hospice claims from January through June 2025. GAO excluded small hospices with fewer than 30 selected beneficiaries or 30 visits.
This appendix provides additional information about Medicare hospice visits across low-visit hospices (20 percent of selected hospices with the lowest number of visits) and high-visit hospices (20 percent of selected hospices with the highest number of visits).[53] We analyzed hospice visits across these groups by beneficiary characteristics (types of terminal illness), patterns of hospice care (rate of live discharges and number of days receiving routine home care), and hospice characteristics (ownership status and geographic location).
Types of Beneficiary Terminal Illness
Low- and high-visit hospices served about the same proportion of beneficiaries with cancer, and the proportions of cardiac and neurological illnesses differed. Low-visit hospices served a higher percentage of beneficiaries with cardiac illnesses and a lower percentage of those with neurological illnesses compared to high-visit hospices. Regardless of the type of terminal illness, low-visit hospices averaged about half the number of visits delivered to a beneficiary per week. (See table 9.)
Table 9: Proportion of Beneficiaries Treated and Average Visits per Week for Routine Home Care Days in Low-Visit and High-Visit Hospices for Selected Beneficiaries Discharged in 2024
|
|
Proportion of beneficiaries treated |
Average visits per week |
||
|
Type of terminal illness |
Low-visit hospices |
High-visit hospices |
Low-visit hospices |
High-visit hospices |
|
Cancer |
16% |
14% |
2.8 |
5.3 |
|
Cardiac |
28% |
20% |
2.5 |
5.5 |
|
Neurological |
25% |
36% |
2.7 |
5.7 |
Source: GAO analysis of data from the Centers for Medicare & Medicaid Services. | GAO‑26‑107585
Note: GAO analyzed hospice visits for routine home care for 1,225,049 beneficiaries who were discharged deceased or alive from hospice in 2024, had been in hospice since 2022, and did not have hospice claims from January through June 2025. GAO divided hospices into five groups of equal size, or quintiles, from the lowest to highest number of average visits per week. Low-visit hospices—the bottom quintile, or 20 percent, of hospices—delivered 2.5 visits per week on average compared to 5.5 visits for high-visit hospices—the top quintile or 20 percent. GAO excluded small hospices with fewer than 30 selected beneficiaries or 30 visits.
Live Discharges
Low-visit hospices had higher rates of live discharges from hospice in comparison to high-visit hospices. Specifically, 31 percent of selected beneficiaries served by low-visit hospices were discharged alive, while the rate for high-visit hospices was 14 percent. (See table 10.) A beneficiary may be discharged alive from hospice for different reasons that may or may not be related to the care hospices provide. For example, a beneficiary may reconsider the decision to start palliative treatment and therefore leave hospice care to restart curative treatment. A live discharge may also occur for other reasons—for example, if beneficiaries are dissatisfied with hospice care and revoke the benefit; if it is determined that they are no longer terminally ill; if they move out of the service area; or if delivery of care to the patient or the ability of the hospice to operate effectively is seriously impaired.[54] Given the various reasons for live discharges, most hospices will have some live discharges, but a high rate of live discharges may suggest lower quality of care or a hospice admitting patients who do not meet the eligibility criteria.[55]
Table 10: Average Percentage of Medicare Hospice Live Discharges for Selected Beneficiaries Discharged in 2024, by Low- to High-Visit Hospices
|
|
Hospice group |
|
|
1 (low-visit) |
5 (high-visit) |
|
|
Average percentage of live discharges |
31 |
14 |
Source: GAO analysis of data from the Centers for Medicare & Medicaid Services. | GAO‑26‑107585
Note: GAO analyzed hospice visits for routine home care for 1,225,049 beneficiaries who were discharged deceased or alive from hospice in 2024, had been enrolled in hospice since 2022, and did not have hospice claims from January through June 2025. GAO divided hospices into five groups of equal size, or quintiles, from the lowest to highest number of average visits per week. Low-visit hospices—the bottom quintile, or 20 percent, of hospices—delivered 2.5 visits per week on average compared to 5.5 visits for high-visit hospices—the top quintile or 20 percent. GAO excluded small hospices with fewer than 30 selected beneficiaries or 30 visits.
Average Days per Hospice Stay
The average number of routine home care days per hospice stay varied across hospices with different rates of visits per week. Low-visit hospices averaged more days of routine home care than other hospices. (See table 11.) Longer hospice stays are associated with greater profitability, according to the Medicare Payment Advisory Commission.[56]
Table 11: Average Number of Days in Routine Home Care per Medicare Hospice Stay for Selected Beneficiaries Discharged in 2024, by Low- to High-Visit Hospices
|
Hospice group |
||
|
1 (low-visit) |
5 (high-visit) |
|
|
Mean |
97 |
85 |
Source: GAO analysis of data from the Centers for Medicare & Medicaid Services. | GAO‑26‑107585
Note: GAO analyzed hospice visits for routine home care for 1,225,049 beneficiaries who were discharged deceased or alive from hospice in 2024, had been in hospice since 2022, and did not have hospice claims from January through June 2025. GAO divided hospices into five groups of equal size, or quintiles, from the lowest to highest number of average visits per week. Low-visit hospices—the bottom quintile, or 20 percent, of hospices—delivered 2.5 visits per week on average compared to 5.5 visits for high-visit hospices—the top quintile or 20 percent. GAO excluded small hospices with fewer than 30 selected beneficiaries or 30 visits.
For-Profit and Nonprofit Ownership
Hospice ownership varied across low- and high-visit hospices. A greater percentage of low-visit hospices were non-profit. (See table 12.)
Table 12: Average Percentage of Medicare Hospice Beneficiaries Served for Selected Beneficiaries Discharged in 2024 by Hospice Ownership, Size, and Low- to High-Visit Hospices
|
Hospice characteristics |
Hospice group |
|
|
Hospice ownership |
1 (low-visit) |
5 (high-visit) |
|
Nonprofit |
29% |
16% |
|
For-profit |
67% |
78% |
Source: GAO analysis of data from the Centers for Medicare & Medicaid Services. | GAO‑26‑107585
Note: GAO analyzed hospice visits for routine home care for 1,225,049 beneficiaries who were discharged deceased or alive from hospice in 2024, had been in hospice since 2022, and did not have hospice claims from January through June 2025. GAO divided hospices into five groups of equal size, or quintiles, from the lowest to highest number of average visits per week. Low-visit hospices—the bottom quintile, or 20 percent, of hospices—delivered 2.5 visits per week on average compared to 5.5 visits for high-visit hospices—the top quintile or 20 percent. GAO excluded small hospices with fewer than 30 selected beneficiaries or 30 visits.
Geographic Location of Low-Visit Hospices
We found little difference in the average number of visits per week by rural and urban hospices. Rural hospices delivered 4.0 visits per week, on average, and urban hospices averaged 3.9 visits per week.
We also found that 61 percent of low-visit hospices were concentrated in seven states with 20 or more low-visit hospices—California, Texas, Arizona, Oregon, Michigan, Washington, and Georgia. (See table 13.) Many of the low-visit hospices in the top three states were concentrated in a single county. Specifically, 213 of California’s low-visit hospices (70 percent) were in Los Angeles County; 18 of the low-visit hospices in Texas (23 percent) were in Harris County; and 20 of the low-visit hospices in Arizona (57 percent) were in Maricopa County. The Centers for Medicare & Medicaid Services (CMS) selected four of these states—California, Texas, Arizona, and Georgia—for enhanced oversight due to rapid growth in new hospices.[57] This enhanced oversight includes medical reviews of new hospices before any payments are made.
Table 13: Distribution of Low-Visit Hospices (20 Percent of Hospices with the Fewest Average Routine Home Care Visits per Week) by State, 2024
|
State |
Total number of hospices |
Number of low-visit hospices |
|
California |
732 |
303 |
|
Texas |
568 |
77 |
|
Arizona |
151 |
35 |
|
Oregon |
58 |
35 |
|
Michigan |
141 |
33 |
|
Washington |
44 |
26 |
|
Georgia |
187 |
20 |
|
North Carolina |
72 |
18 |
|
Minnesota |
65 |
17 |
|
Wisconsin |
82 |
15 |
|
Colorado |
62 |
15 |
|
Florida |
55 |
15 |
|
Montana |
28 |
15 |
|
Illinois |
114 |
14 |
|
Virginia |
97 |
14 |
|
Kansas |
69 |
14 |
|
Nevada |
75 |
13 |
|
Indiana |
90 |
12 |
|
Tennessee |
58 |
12 |
|
New York |
39 |
12 |
|
Missouri |
122 |
11 |
|
New Mexico |
42 |
11 |
|
Puerto Rico |
34 |
11 |
|
Maryland |
24 |
10 |
|
Ohio |
142 |
9 |
|
Pennsylvania |
166 |
8 |
|
Oklahoma |
114 |
8 |
|
Hawaii |
10 |
8 |
|
Iowa |
66 |
7 |
|
Idaho |
47 |
7 |
|
Kentucky |
23 |
7 |
|
Massachusetts |
70 |
5 |
|
West Virginia |
18 |
5 |
|
Wyoming |
16 |
5 |
|
South Carolina |
76 |
4 |
|
North Dakota |
11 |
4 |
|
Alaska |
4 |
4 |
|
Alabama |
80 |
3 |
|
Arkansas |
41 |
3 |
|
Connecticut |
24 |
3 |
|
Vermont |
9 |
3 |
|
District of Columbia |
4 |
3 |
|
Louisiana |
104 |
2 |
|
Mississippi |
72 |
2 |
|
New Hampshire |
21 |
2 |
|
New Jersey |
59 |
1 |
|
Nebraska |
38 |
1 |
|
Maine |
16 |
1 |
|
South Dakota |
16 |
1 |
|
Delaware |
10 |
1 |
|
Rhode Island |
10 |
1 |
|
Guam |
2 |
1 |
|
Virgin Islands |
2 |
1 |
|
Utah |
60 |
0 |
|
Total |
4340 |
868 |
Source: GAO analysis of data from the Centers for Medicare & Medicaid Services. | GAO‑26‑107585
Note: GAO analyzed hospice visits for routine home care for 1,225,049 beneficiaries who were discharged deceased or alive from hospice in 2024, had been in hospice since 2022, and did not have hospice claims from January through June 2025. GAO divided hospices into five groups of equal size, or quintiles, from the lowest to highest number of average visits per week. Low-visit hospices—the bottom quintile, or 20 percent, of hospices—delivered 2.5 visits per week on average compared to 5.5 visits for high-visit hospices—the top quintile or 20 percent. GAO excluded small hospices with fewer than 30 selected beneficiaries or 30 visits.
We also analyzed visits per week for the group of 2,099 small hospices (those with fewer than 30 selected beneficiaries) that we had excluded from our cohort. We analyzed how many of these small hospices had fewer than 2.5 visits per week (the average number of visits for the low-visit quintile of the larger hospices in our cohort). We found that 1,276 of these small hospices (61 percent) were in California and 783 (61 percent) of them delivered fewer than 2.5 visits per week compared to 22 percent for all other states combined. (See table 14.) Many of the small hospices that delivered fewer than 2.5 visits per week were concentrated in a single county in the three states with the greatest number of these hospices. Specifically, 664 of these hospices in California (85 percent) were in Los Angeles County; 37 of these hospices in Texas (38 percent) were in Harris County; and 24 of these hospices in Arizona (89 percent) were in Maricopa County.
Table 14: Distribution of Small Hospices (with Fewer Than 30 Selected Beneficiaries) That Delivered Fewer Than 2.5 Average Routine Home Care Visits per Week) by State, 2024
|
State |
Number of small hospices |
Number of small hospices with fewer than 2.5 visits per week |
|
California |
1276 |
783 |
|
Texas |
318 |
98 |
|
Arizona |
80 |
27 |
|
Georgia |
60 |
12 |
|
Nevada |
53 |
6 |
|
Illinois |
23 |
6 |
|
Michigan |
22 |
3 |
|
Utah |
21 |
0 |
|
Colorado |
18 |
5 |
|
Ohio |
16 |
2 |
|
Kansas |
15 |
1 |
|
Minnesota |
14 |
1 |
|
Pennsylvania |
14 |
1 |
|
Oklahoma |
14 |
0 |
|
Missouri |
13 |
1 |
|
Louisiana |
12 |
2 |
|
South Carolina |
12 |
1 |
|
Virginia |
11 |
3 |
|
Mississippi |
11 |
1 |
|
Indiana |
9 |
0 |
|
New Mexico |
8 |
3 |
|
Oregon |
7 |
1 |
|
Iowa |
7 |
0 |
|
Alabama |
6 |
0 |
|
Puerto Rico |
6 |
0 |
|
Idaho |
5 |
0 |
|
Wisconsin |
5 |
0 |
|
Massachusetts |
4 |
1 |
|
Arkansas |
4 |
0 |
|
Nebraska |
3 |
0 |
|
New Hampshire |
3 |
0 |
|
North Carolina |
3 |
0 |
|
Washington |
3 |
0 |
|
Wyoming |
3 |
0 |
|
Alaska |
2 |
1 |
|
Montana |
2 |
1 |
|
Maryland |
2 |
0 |
|
New Jersey |
2 |
0 |
|
North Dakota |
2 |
0 |
|
Northern Mariana Islands |
1 |
1 |
|
Connecticut |
1 |
0 |
|
District of Columbia |
1 |
0 |
|
Florida |
1 |
0 |
|
Maine |
1 |
0 |
|
Rhode Island |
1 |
0 |
|
South Dakota |
1 |
0 |
|
Tennessee |
1 |
0 |
|
Vermont |
1 |
0 |
|
Virgin Islands |
1 |
0 |
|
Total |
2099 |
961 |
Source: GAO analysis of data from the Centers for Medicare & Medicaid Services. | GAO‑26‑107585
Note: GAO analyzed hospice visits for routine home care for 1,225,049 beneficiaries who were discharged deceased or alive from hospice in 2024, had been enrolled in hospice since 2022, and did not have hospice claims from January through June 2025. GAO only included small hospices with fewer than 30 selected beneficiaries. GAO defined low-visit hospices as those that delivered fewer than 2.5 visits per week, on average.
GAO Contact
Leslie V. Gordon, GordonLV@gao.gov
Staff acknowledgments
In addition to the contact named above, Iola D’Souza (Assistant Director), Russell Voth (Analyst-in-Charge), Todd Anderson, Myra Bowling, Raghavendra Chegireddy, Toni Harrison, Ying Hu, David Jones, Ariel Landa-Seiersen, Rich Lipinski, Ravi Sharma, Emily Wilson Schwark, Cathleen Whitmore, and Jennifer Whitworth made key contributions to this report.
The Government Accountability Office, the audit, evaluation, and investigative arm of Congress, exists to support Congress in meeting its constitutional responsibilities and to help improve the performance and accountability of the federal government for the American people. GAO examines the use of public funds; evaluates federal programs and policies; and provides analyses, recommendations, and other assistance to help Congress make informed oversight, policy, and funding decisions. GAO’s commitment to good government is reflected in its core values of accountability, integrity, and reliability.
Obtaining Copies of GAO Reports and Testimony
The fastest and easiest way to obtain copies of GAO documents at no cost is through our website. Each weekday afternoon, GAO posts on its website newly released reports, testimony, and correspondence. You can also subscribe to GAO’s email updates to receive notification of newly posted products.
Order by Phone
The price of each GAO publication reflects GAO’s actual cost of production and distribution and depends on the number of pages in the publication and whether the publication is printed in color or black and white. Pricing and ordering information is posted on GAO’s website, https://www.gao.gov/ordering.htm.
Place orders by calling (202) 512-6000, toll free (866) 801-7077,
or
TDD (202) 512-2537.
Orders may be paid for using American Express, Discover Card, MasterCard, Visa, check, or money order. Call for additional information.
Connect with GAO
Connect with GAO on X,
LinkedIn, Instagram, and YouTube.
Subscribe to our Email Updates. Listen to our Podcasts.
Visit GAO on the web at https://www.gao.gov.
To Report Fraud, Waste, and Abuse in Federal Programs
Contact FraudNet:
Website: https://www.gao.gov/about/what-gao-does/fraudnet
Automated answering system: (800) 424-5454
Media Relations
Sarah Kaczmarek, Managing Director, Media@gao.gov
Congressional Relations
David A. Powner, Acting Managing Director, CongRel@gao.gov
General Inquiries
[1]For the purposes of this report, we use the term “hospice” to refer to a hospice provider.
[2]MedPAC is an independent congressional agency established by the Balanced Budget Act of 1997 to advise the U.S. Congress on issues affecting the Medicare program.
[3]For fiscal year 2026, CMS calculated the aggregate labor portion of hospice routine home care costs and home health costs to be 66 percent and 74.9 percent respectively. See 90 Fed. Reg. 37,404, 37,411 (Aug. 5, 2025); 90 Fed. Reg. 55,342, 55,399 (Dec. 2, 2025).
[4]Centers for Medicare & Medicaid Services, Hospice Monitoring Report (April 2025).
[5]In addition to daily rates, Medicare pays a service intensity add-on payment for each hour of care provided by a registered nurse or social worker for up to 4 hours per day during the last 7 days of life. Daily rates decrease after 60 days of hospice care because CMS found that longer hospice stays are associated with fewer visit minutes per day.
[6]Department of Health and Human Services, Office of Inspector General, Vulnerabilities in the Medicare Hospice Program Affect Quality Care and Program Integrity: An OIG Portfolio, OEI-02-16-00570 (July 2018).
[7]Centers for Medicare & Medicaid Services, HOSPICE: Fast Facts, CMS.GOV/FRAUD (January 2026).
[8]See, for example, Department of Justice, Four More Charged in $110 Million Hospice Fraud Scheme, (Houston, TX.: October 2025) and State of California Department of Justice, Attorney General Bonta Dismantles Los Angeles Hospice Fraud Ring Responsible for $267 Million in Fraud, 21 Charged (Sacramento, CA.: April 2026).
[9]Some beneficiaries received hospice care during the time period we analyzed but were not discharged in 2024 and so may not have yet received a full episode of care. Our analysis of 1,225,049 beneficiaries discharged in 2024 represents 67 percent of the 1,840,874 unique beneficiaries who received hospice care in fiscal year 2024, according to CMS.
[10]For example, if a hospice served 100 beneficiaries for a total of 35,000 days (5,000 weeks) of routine home care and delivered 10,000 visits during that time, the hospice averaged two visits per week.
[11]We interviewed researchers from the following institutions or organizations: The Providence Institute for Human Caring, Brown University, Cornell University, Vanderbilt University, and the Medicare Payment Advisory Commission. We interviewed the following national organizations: National Alliance for Care at Home, Hospice and Palliative Nurses Association, Center for Medicare Advocacy, American Academy of Hospice and Palliative Medicine, National Partnership for Healthcare and Hospice Innovation, and LeadingAge.
[12]In 2024, Medicare’s home health per-visit rates were about $168 for a nurse, $76 for an aide, and $270 for a social worker. These rates apply when a beneficiary receives fewer than a set number of visits (typically two to five) within a 30-day period. We estimate that about 2.3 million visits were paid under the per-visit rates in 2024, the most recent year for which data are available.
We considered the home health per-visit rates a reasonable benchmark for Medicare’s estimated per-visit rates for routine home care visits for several reasons, including: (1) They vary based on the type of health care professional delivering the visit (nurse, aide, and social worker) unlike visits paid under the prospective payment system. Thus, our average home health per-visit payment rates account for differences in the types of health care professionals delivering visits across hospices. (2) In both programs, visits are delivered in the beneficiary’s home by the same types of health care professionals performing the same types of activities, and there are no wage differences for staff. (3) As with hospice payment rates, the home health per-visit rates are not adjusted for the beneficiary’s medical diagnosis.
[13]We used the Medicare hospice and home health cost report forms to identify services that were covered under the hospice daily rates but not the home health rates (e.g., drugs and durable medical equipment). We then used fiscal year 2023 hospice cost reports to determine the percentage of total hospice costs that these services represented, and increased home health payments by that percentage. The hospice cost reports we reviewed represented about 93 percent of hospices in 2023, according to MedPAC data. See appendix I for further details on our methodology.
[14]42 C.F.R. § 418.
[15]Medicare beneficiaries enrolled in a Medicare Advantage plan are also eligible for the hospice benefit. The Medicare hospice benefit covers services related to the beneficiary’s terminal illness, and the Medicare Advantage plan covers all other services unrelated to that condition.
[16]In place of social workers, hospices may instead include a marriage and family therapist or mental health counselor on the interdisciplinary team.
[17]Medicare hospice conditions of participation require that nurses conduct in-person supervisory visits to beneficiaries’ homes at least once every 14 days to assess the quality of care and services provided by hospice aides, but the nurse is not required to also provide any care to the beneficiary during these visits. Further, CMS’s Hospice Outcomes Patient and Evaluation Tool, implemented in October 2025, requires hospice staff to conduct in-person hospice update visits by the 15th day and 30th day of a hospice beneficiary’s stay to collect data on the beneficiary. A nurse is required to conduct an in-person symptom follow-up visit within 2 calendar days if the beneficiary complains of symptoms during a hospice update visit.
[18]Hospices are subject to inspections every 3 years, which typically include reviews of a sample of beneficiary records. See Department of Health and Human Services, Office of Inspector General, Hospice Deficiencies Pose Risks to Medicare Beneficiaries, OEI-02-17-00020 (Washington D.C.: July 2019). CMS implemented the HHS-OIG’s recommendation in this report to educate hospices about common deficiencies and those that pose particular risks to beneficiaries. As of March 2026, CMS had not implemented the HHS-OIG’s recommendation to increase oversight of hospices with a history of serious deficiencies.
[19]It is not clear what share of this spending was unrelated to beneficiaries’ terminal illnesses. In 2022, the HHS-OIG reported that most non-hospice spending (about 58 percent) was unrelated to the terminal illness. Forty-two percent of non-hospice spending was related to the terminal illness, and Medicare should not have paid separately for this. See Department of Health and Human Services, Office of Inspector General, Medicare Payments of $6.6 Billion to Nonhospice Providers Over 10 Years for Items and Services Provided to Hospice Beneficiaries Suggest the Need for Increased Oversight, A-09-20-03015 (Washington, D.C.: February 2022).
[20]42 C.F.R. §§ 418.21-22.
[21]The Medicare hospice benefit is funded through the Medicare Hospital Insurance Trust Fund, which is comprised mostly of payroll taxes paid by employees, employers, and the self-employed.
[22]84 Fed. Reg. 38,484, 38,491 (Aug. 6, 2019). The three higher levels of care are:
1. Continuous home care provided during a period of beneficiary crisis to manage the beneficiary at home. A minimum of 8 hours and as much as 24 hours of nursing care or nursing and aide care must be provided on a given day to qualify for this payment level.
2. Inpatient respite care, which is limited, short-term, intermittent inpatient care to allow the beneficiary’s caregiver to rest and be relieved from caregiving.
3. General inpatient care or short-term inpatient care to treat a beneficiary’s symptoms that cannot be managed in another setting.
Each care level has a payment rate that is adjusted for geographic differences in wages, and CMS updates these payment rates annually.
[23]See Melissa D. Aldridge, Andrew J. Epstein, Abraham A. Brody, Eric J. Lee, Sean R. Morrison, and Elizabeth H. Bradley, “Association Between Hospice Spending on Patient Care and Rates of Hospitalization and Medicare Expenditures of Hospice Enrollees,” Journal of Palliative Medicine, vol. 21, no. 1 (2018) and Joan Teno, “Hospice—The Time Is Now for Additional Integrity Oversight,” Journal of the American Medical Association Health Forum, vol. 4, no. 5 (2023).
[24]Medicare Administrative Contractors are responsible for identifying hospices that exceed the payment caps. These hospices must remit overpayments back to CMS.
[25]48 Fed. Reg. 56,008 (Dec. 16, 1983). CMS based the daily hospice payment structure on costs of a nationwide study of cancer beneficiaries at 26 hospices conducted in the early 1980s. CMS considered a per visit hospice payment system but thought it could incentivize hospices to provide more services and was more complex than a daily rate approach.
[26]We reported in 2004 that the single hospice daily rate in place at the time of the report may not reflect patterns of care. See GAO, Medicare Hospice Care: Modifications to Payment Methodology May Be Warranted, GAO‑05‑42 (Washington, D.C.: October 15, 2004). CMS agreed with, and subsequently implemented, the report’s recommendations that CMS collect comprehensive, patient-specific utilization and cost data on hospice visits and services and use these data to determine whether modifications to the payment methodology are needed.
Also see Abt Associates, Medicare Hospice Payment Reform: Hospice Study Technical Report, a report prepared at the request of the Centers for Medicare & Medicaid Services, April 24, 2013.
[27]Specifically, the act required CMS collect additional data and information such as: 1) charges and payments; 2) the number of days of hospice care received by a beneficiary; 3) for each type of service included in hospice care; 4) charitable contributions and other revenue from the hospice; 5) the number of hospice visits; 6) the type of practitioner delivering the visit; and 7) the length of the visit among other information. Pub. L. No. 111-148, § 3132, 124 Stat. 119, 430 (2010) (codified as amended at 42 U.S.C. § 1395f(i)).
[28]80 Fed. Reg. 47,142 (Aug. 6, 2015).
[29]84 Fed. Reg. 38,484, 38,491 (Aug. 6, 2019).
[30]We analyzed Medicare claims data from 2022 through 2024 for selected beneficiaries and hospices. Selected beneficiaries include 1,225,049 beneficiaries who were discharged deceased or alive from hospice in 2024, had been in hospice since 2022, and did not have hospice claims from January through June 2025. Selected hospices include 4,340 hospices that served 30 or more selected beneficiaries with 30 or more visits. The 1,225,049 beneficiaries represented 67 percent of the beneficiaries who received hospice care in fiscal year 2024, according to CMS.
[31]For individual hospices, the average number of visits per beneficiary per week ranged from a low of 0.1 to a high of 22.8, with a median of 3.9 visits.
[32]Specifically, beneficiaries with cancer made up 16 percent of selected beneficiaries served by low-visit hospices and 14 percent of those served by high-visit hospices. Beneficiaries with cardiac and neurological illnesses made up 28 percent and 25 percent of selected beneficiaries served by low-visit hospices, respectively, and 20 percent and 36 percent of those served by high-visit hospices, respectively.
[33]These states are Arizona, California, Georgia, and Texas. In addition, CMS has selected Nevada and Ohio for enhanced oversight. Law enforcement agencies also have reported actions in several of these states to address hospice fraud schemes. See, for example, Department of Justice, Four More Charged and State of California Department of Justice, Attorney General Bonta Dismantles Los Angeles Hospice Fraud Ring.
[34]We analyzed Medicare claims data from 2022 through 2024 for selected beneficiaries and hospices. Selected beneficiaries include 1,225,049 beneficiaries who were discharged deceased or alive from hospice in 2024, had been in hospice since 2022, and did not have hospice claims from January through June 2025. Selected hospices include 4,340 hospices that served 30 or more selected beneficiaries with 30 or more visits. The 1,225,049 beneficiaries represented 67 percent of the beneficiaries who received hospice care in fiscal year 2024, according to CMS. We estimated the average per-visit payment by first calculating average per-visit payment for each hospice (total hospice payments divided by total visits), then taking the average across all hospices in the low- and high-visit groups respectively.
[35]In fiscal year 2026, Medicare paid hospices $230.83 per day for the first 60 days of routine home care and $181.94 per additional day, as well as $69.76 per hour up to a maximum of 4 hours per day for visits by registered nurses or social workers in the last 7 days of a beneficiary’s life.
[36]Home health per-visit rates apply when a beneficiary receives fewer than a set number of visits (typically two to five) within a 30-day period. In 2024, Medicare’s per-visit rates were about $168 for a nurse, $76 for an aide, and $270 for a social worker. We estimate that about 2.3 million visits were paid under these rates in 2024, the most recent year for which data are available.
[37]We adjusted home health payments to account for differences between the hospice and home health benefit. For example, we increased home health payments to account for services that are covered under the hospice daily rates but not home health rates (e.g., drugs and durable medical equipment), and for geographic wage differences between the two programs. See appendix I for further details on our methodology.
[38]Low-visit hospices averaged 1.4 nurse visits out of 2.5 total visits per beneficiary per week, and high-visit hospices averaged 2.2 nurse visits out of 5.5 total visits per beneficiary per week.
[39]See 42 U.S.C. § 1395f(i)(1)(C)(iii).
[40]GAO, Medicare: Increasing Hospital-Physician Consolidation Highlights Need for Payment Reform, GAO‑16‑189 (Washington, D.C.: Dec 18, 2015). Congress has partially implemented the matter raised for consideration in this report by limiting certain providers from billing Medicare at higher hospital outpatient department payment rates.
[41]Specifically, we used CMS’s Integrated Data Repository, a comprehensive data warehouse containing information key to operating CMS programs. From this repository, we analyzed Medicare enrollment and claims data, excluding any claims that were duplicate or overlapping, not final action claims, or had zero or negative Medicare payment amounts.
[42]We included routine home care days that occurred during the course of complete hospice stays. Selected beneficiaries could have more than one complete hospice stay between 2022 and 2024. We included medical social services phone calls among the visits we analyzed and did not include other forms of telehealth visits, for which data are not available. We did not include routine home care days and visits for beneficiaries in hospice inpatient sites of care, which may follow different patterns of care because they occur at a hospice facility.
[43]For example, if a hospice served 100 beneficiaries for a total of 35,000 days (5,000 weeks) of routine home care and delivered 10,000 visits during that time, the hospice averaged two visits per week.
[44]According to the Medicare Payment Advisory Commission, about 2.9 percent of total hospice payments exceeded the hospice aggregate cap in 2023 (the most recent year for which data were available when we conducted our analysis). We adjusted each hospice’s total payments by this percentage. Our estimate is conservative because not all overpayments are collectible. According to the Department of Health and Human Services’ Office of Inspector General reports, the share of cap overpayments that was classified as uncollectible ranged from 4 to 20 to 27 percent across three contractors. Department of Health and Human Services, Office of Inspector General, CGS Administrators, LLC, Did Not Reopen and Recalculate Most Selected Hospices’ Caps for Years Prior to 2020, A–06–23–09003 (Washington, D.C.: November 2024); National Government Services, Inc., Accurately Calculated Hospice Cap Amounts but Did Not Collect All Cap Overpayments, A–06–21–08004 (Washington, D.C.: November 2022); and Palmetto GBA, LLC, Accurately Calculated Hospice Cap Amounts but Did Not Collect All Cap Overpayments, A–06–19–08003 (Washington, D.C.: July 2021).
[45]See 88 Fed. Reg. 77,676, 77,747 (Nov. 13, 2023). Home health per-visit rates apply when a beneficiary receives fewer than a set number of visits (typically two to five) within a 30-day period. We estimate that about 2.3 million visits on average were paid under the per-visit rates in 2024 (the most recent year for which data are available). (Medicare originally paid on a per-visit basis for all home health visits until October 1, 2000, when it transitioned to paying for most visits under a prospectively determined rate. The rate applied for each 30-day period as of January 1, 2020. The rate is adjusted for beneficiaries’ medical diagnoses and geographic wage differences.)
[46]See Centers for Medicare & Medicaid Services, CMS Manual System Pub. 100-04 Medicare Claims Processing, Transmittal 12298 Change Request 13411 (October 12, 2023).
[47]Hospices can also vary in the duration of the visits they deliver to beneficiaries. We therefore compared average minutes per visit for hospices in each quintile to the average visit duration for our cohort to determine if there were differences across the quintiles. We found that visit duration was roughly similar across the quintiles—within 3 minutes of the average visit duration of about 55 minutes for our cohort.
[48]We interviewed researchers from the following institutions or organizations: The Providence Institute for Human Caring, Brown University, Cornell University, Vanderbilt University, and the Medicare Payment Advisory Commission. We interviewed the following national organizations: National Alliance for Care at Home, Hospice and Palliative Nurses Association, Center for Medicare Advocacy, American Academy of Hospice and Palliative Medicine, National Partnership for Healthcare and Hospice Innovation, and LeadingAge.
[49]We did not assess whether non-hospice services were related to beneficiaries’ terminal illness and related conditions.
[50]We analyzed hospice spending and non-hospice spending for 1,225,049 beneficiaries who were discharged deceased or alive from hospice in 2024, had been in hospice since 2022, and did not have hospice claims from January through June 2025. We analyzed visits for 4,340 hospices and excluded small hospices with fewer than 30 selected beneficiaries or 30 visits.
[51]We analyzed hospice visits for routine home care for 1,225,049 beneficiaries who were discharged deceased or alive from hospice in 2024, had been in hospice since 2022, and did not have hospice claims from January through June 2025. We excluded small hospices with fewer than 30 selected beneficiaries or 30 visits.
[52]Specifically, we used the primary diagnosis codes in the final claim that a selected beneficiary had during 2022 through 2024 to determine the beneficiary’s primary diagnosis category. According to CMS, the crosswalk between ICD-10-CM diagnosis codes and these categories it uses is based on the Agency for Healthcare Research and Quality’s Clinical Classifications Software Refined v2023.1.
[53]We analyzed hospice visits for routine home care for 1,225,049 beneficiaries who were discharged deceased or alive from hospice in 2024, had been in hospice since 2022, and did not have hospice claims from January through June 2025. We excluded small hospices with fewer than 30 selected beneficiaries or 30 visits.
[54]A hospice must obtain a written physician's discharge order from the hospice medical director for all live discharges.
[55]Medicare Payment Advisory Commission, Report to the Congress: Medicare Payment Policy, (Washington, D.C.: March 2025), 285 and GAO, Medicare Hospice Care: Opportunities Exist to Strengthen CMS Oversight of Hospice Providers, GAO‑20‑10 (Washington, D.C.: Oct. 18, 2019), 18.
[56]Medicare Payment Advisory Commission, Report to the Congress: Medicare Payment Policy (Washington, D.C.: March 2026), 312.
[57]Additional states selected by CMS for this enhanced oversight include Nevada and Ohio.