Report to Congressional Committees
United States Government Accountability Office
A report to congressional committees
For more information, contact: Danielle T. Giese at GieseD@gao.gov or Michael Hoffman at HoffmanME@gao.gov
What GAO Found
Empirical studies assessing the effects of domestic airline mergers generally found that, in the short run, consumers faced higher fares and lower service quality (e.g., on-time performance) on routes where the merger resulted in fewer competitors. For example, based on three studies that used particularly strong methodologies, fares increased between 1 and 8 percent following the merger. Other studies found mergers sometimes led to some improvements in airlines’ efficiencies (e.g., cost reductions), but challenges, such as combining workforces, sometimes reduced or eliminated anticipated gains.
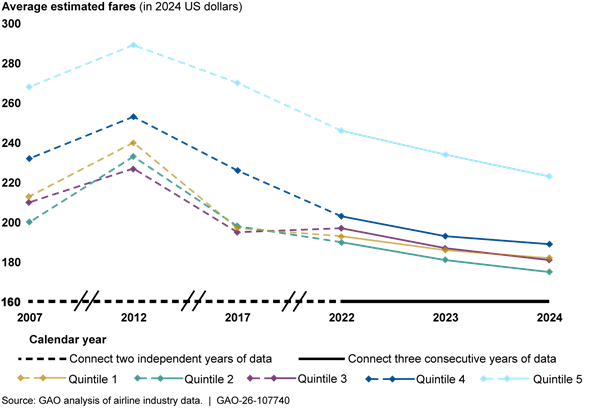
GAO’s analyses of airline competition metrics provide a longer-term perspective than the studies and suggest that there has been increased competition in the past two decades. For example, estimated domestic fares that incorporated available airline ancillary fees were lower in 2024 as compared to 2007—even after they were higher in 2012, around the time of a wave of domestic airline mergers. In addition, market share and other key market structure indicators show increased presence of ultra-low-cost airlines in 2022 compared to 2007. These indicators remained largely unchanged from 2022 through 2024.
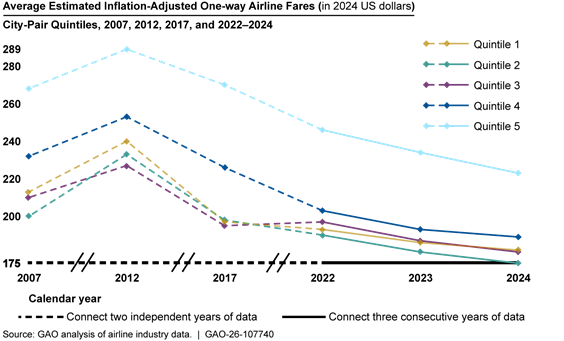
Note: GAO divided domestic routes into five “quintiles” (based on number of passengers), where the first quintile generally includes the most-travelled routes, and the fifth generally includes the least.
Stakeholders identified five key factors that affect airline competition, including airport access and introduction of basic economy fares by network airlines. Most stakeholders GAO interviewed described intense competition in an uneven environment, posing challenges for lower-cost airlines going forward. They also pointed to a relatively recent development: the increasing importance of airline credit card revenue. This helps airlines weather industry volatility, while also bolstering passenger loyalty by providing rewards (e.g., seat upgrades). Some stakeholders said these cards provide competitive advantages for larger airlines because consumers are less attracted to cards offered by lower-cost airlines, which generally have smaller operations and reward programs.
Why GAO Did This Study
Domestic airlines carried nearly 850 million passengers throughout the U.S. in 2025, according to Department of Transportation (DOT) data. Robust competition in the air transportation industry can promote lower fares and provide consumers with more travel options and destinations. Some observers, however, have raised questions about the effects of mergers, suggesting that consumers may ultimately face higher airfares and reduced service.
The FAA Reauthorization Act of 2024 includes a provision for GAO to review competition and consolidation in the U.S. airline industry. This report examines (1) findings from empirical studies since 2005 on the effects of U.S. airline mergers on consumers and on airlines’ efficiency, (2) the current state (2022-2024) of airline competition in the U.S. compared to 5, 10, and 15 years prior, and (3) stakeholders’ views on the factors affecting the evolution of competition in the U.S. airline industry.
GAO summarized the findings of 40 empirical studies with sufficiently rigorous methodologies that assessed the effects of U.S. airline mergers. Of those, GAO found 13 studies particularly robust and reported quantitative effects that are statistically significant. GAO also analyzed airline data collected by DOT to examine U.S. airline competition over time.
GAO interviewed or obtained written responses from all 12 major U.S. airlines and 19 other knowledgeable stakeholders, including academic researchers, consumer advocacy groups, and equity analysts. GAO selected stakeholders based on its prior work, recommendations from others, and the stakeholders’ knowledge of the U.S. airline industry. GAO also interviewed officials from DOT and the Department of Justice.
|
Abbreviations |
|
DB1B Department of Transportation Origin and Destination Survey |
|
DOJ Department of Justice |
|
DOT Department of Transportation |
|
EDIFACT Electronic Data Interchange for Administration, Commerce and Transport |
|
FAA Federal Aviation Administration |
|
HHI Herfindahl-Hirschman Index |
|
NDC New Distribution Capability |
|
QSI Quality of Service Index |
This is a work of the U.S. government and is not subject to copyright protection in the United States. The published product may be reproduced and distributed in its entirety without further permission from GAO. However, because this work may contain copyrighted images or other material, permission from the copyright holder may be necessary if you wish to reproduce this material separately.
June 25, 2026
The Honorable Ted Cruz
Chairman
The Honorable Maria Cantwell
Ranking Member
Committee on Commerce, Science, and Transportation
United States Senate
The Honorable Sam Graves
Chairman
The Honorable Rick Larsen
Ranking Member
Committee on Transportation and Infrastructure
House of Representatives
In 2025, U.S. airlines carried nearly 850 million passengers domestically and generated over $250 billion in operating revenues from those flights, according to Department of Transportation (DOT) data.[1] Nearly 90 percent of Americans reported having flown in their lifetime, while more than 50 percent reported flying in 2024, according to Airlines for America, an airline industry association. Airlines compete for those passengers through fares as well as non-price strategies, such as reliability, loyalty programs, and other service offerings, like airport lounges.
The current U.S. airline industry reflects a significant transformation in response to numerous challenges and shocks experienced over several decades. For example, in the aftermath of the September 11, 2001, terrorist attacks and the financial crisis and economic recession of 2007 to 2009, the industry experienced heavy financial losses that contributed to a wave of bankruptcies and drove consolidation through several major airline mergers. From 2008 through 2013, eight airlines consolidated to become four airlines. As a result, there are fewer major U.S. airlines today than at any time since deregulation in 1978. Following the wave of mergers and acquisitions, lower-cost airlines (i.e., “low-cost” and “ultra-low-cost” airlines) contributed to growth, and the industry experienced several years of profitability. Following the COVID-19 pandemic, however, domestic airlines have faced increased labor and other costs. Lower-cost airlines, which rely on lower operating costs to charge lower fares, have been particularly hard hit.
Some observers have raised questions about the effects of mergers and acquisitions (hereafter referred to simply as “mergers”) on airline competition, suggesting that consumers may ultimately face higher airfares and reduced service. Others, including representatives from several airlines that have merged, argue that airlines and consumers can benefit from consolidation, as merging airlines expand their networks and gain efficiencies through workforce integration, information technology system integration, and other synergies. The Department of Justice (DOJ) and DOT have stated that robust competition in the air transportation industry promotes lower fares; improves working conditions; and enhances the ability of Americans to travel, whether for business or leisure.
We last reported on competition in the airline industry in 2014, shortly after the last wave of mergers.[2] The FAA Reauthorization Act of 2024 includes a provision for us to study competition and consolidation in the U.S. airline industry.[3] While the regional airline industry sector has also experienced consolidation over the last two decades, this report focuses on consolidation among the major airlines. This report examines (1) findings from empirical studies since 2005 on the effects of U.S. airline mergers on consumers and on airlines’ efficiency, (2) the current state (2022 through 2024) of airline competition in the U.S. compared to 5, 10, and 15 years prior, and (3) stakeholders’ views on the factors affecting the evolution of competition in the U.S. airline industry.
To examine studies’ findings on the effects of U.S. airline mergers, we identified and reviewed empirical economic studies that assessed the effects of one or more of the six domestic airline mergers completed from 2005 through 2016. We identified and reviewed 143 economic studies relevant to our review. Of those, we selected 40 empirical studies that assessed merger effects and had sufficiently rigorous methodologies. We determined that 13 of those 40 studies had particularly robust methodologies (hereafter referred to as “particularly strong studies”).[4] We reported quantitative effects that are statistically significant from these particularly strong studies and qualitatively described the results from the other studies.
To examine airline competition in the U.S. over time, we used several metrics, such as airfares and market concentration, to compare the current state of the domestic airline industry (2022 through 2024) to prior selected years (2007, 2012, and 2017).[5] Analyzing metrics for 2007 and 2012 provides information before and after several large mergers in our review, while 2017 provides a data point prior to the COVID-19 pandemic. We calculated these metrics using data collected by DOT from airlines and processed by a private data vendor, including air traffic, fares, and origin and destination ticket data. To assess the reliability of the data, we reviewed the quality control procedures that DOT and the private data vendor used. We also conducted electronic data testing for missing data and outliers. We determined the data were sufficiently reliable for the purpose of comparing the state of the airline industry in various years.
To examine stakeholders’ views on the factors affecting the evolution of competition in the U.S. airline industry, we reviewed the more than 100 comments submitted by stakeholders in response to DOJ and DOT’s October 2024 request for information on competition in the airline industry and in other segments of the air transportation industry.[6]
In addition, to address all three objectives, we reviewed relevant federal laws, regulations, and agency documentation related to airline competition and consolidation in the U.S. aviation industry. We also identified and reviewed studies that assessed topics related to the current state of airline competition or airline competition in general. We interviewed DOT and DOJ officials and representatives from all 12 major U.S. airlines.[7] We also interviewed 19 other relevant stakeholders, including representatives from industry trade associations, consumer advocacy groups, and a technology firm; equity analysts from financial services firms; and academic researchers. We identified and selected these stakeholders based on our prior work, a literature review of relevant academic research, and the stakeholders’ knowledge in their field. The interviews were conducted from October 2024 to January 2026. Their views are not generalizable to the views of all industry stakeholders but provide a range of perspectives on competition in the industry. See appendix I for more details on our scope and methodology.
We conducted this performance audit from August 2024 to June 2026 in accordance with generally accepted government auditing standards. Those standards require that we plan and perform the audit to obtain sufficient, appropriate evidence to provide a reasonable basis for our findings and conclusions based on our audit objectives. We believe that the evidence obtained provides a reasonable basis for our findings and conclusions based on our audit objectives.
Background
U.S. Airlines and Other Key Stakeholders
The domestic passenger airline industry is generally composed of four types of airlines. However, given the dynamic nature of the industry and airlines’ individual business models, an airline may not perfectly fall into a single category across all years and for all purposes.[8] For the purposes of this report, we use the following four categories that are reflective of their different business models, service levels, fare structures, and target markets.
· Network airlines were in operation before the Airline Deregulation Act of 1978 and support large, complex hub-and-spoke operations with thousands of employees and hundreds of aircraft.[9] These airlines provide service at various fare levels to a wide variety of domestic and international destinations.
· Low-cost airlines generally entered the market after deregulation and tend to operate less costly point-to-point service using fewer types of aircraft than network airlines.[10] While low-cost airlines serve international markets, they focus more heavily on domestic markets than do network airlines.
· Ultra low-cost airlines provide service often to leisure destinations at discount fares, but with ancillary fees, such as for carry-on and checked baggage.[11]
· Regional airlines generally operate smaller aircraft (up to 76 seats) and provide service to smaller communities through arrangements with network airlines. Some regional airlines are owned by a network airline, while others are independent.
Although not considered part of the airline industry, other key aviation stakeholders support how consumers purchase airline tickets. Specifically, consumers can purchase airline tickets for airline travel directly from the airline (i.e., from the airline’s website, by calling the airline’s call center, or from the airline’s ticket counter at the airport) or from third parties, such as online travel agents (e.g., Priceline or Expedia) and traditional or corporate travel agents. Prior to purchase, consumers may obtain some information about flight schedules, fares, and some optional services—including checked baggage, seat selection, and reservation changes or cancellations fees—from metasearch companies (e.g., Kayak or Skyscanner). Generally, online travel agents, traditional or corporate travel agents, and metasearch companies obtain fare and some optional service fee information from global distribution systems, which are companies that package airline information so that travel agents can query and “book” (i.e., reserve and purchase) flights for airline customers.
Financial Performance of the U.S. Airline Industry
The airline industry has historically operated with volatile earnings and is also highly susceptible to business cycles and other external shocks that reduce demand. As discussed above, the September 11, 2001, terrorist attacks and the financial crisis and economic recession of 2007 to 2009 were among the external shocks that impacted the U.S. airline industry and contributed to the wave of airline consolidations.
Since we last reported on competition in the U.S. airline industry in 2014, the industry experienced a period of unprecedented stability and profitability through 2019, according to DOT’s Federal Aviation Administration (FAA). According to DOT officials, during this time, lower-cost airlines had cost advantages over other airlines. These officials further explained that this created a cycle of growth that enabled lower fares, which stimulated air travel demand, leading to high aircraft utilization and profitability, and further reduced costs.
This period of sustained strong financial performance was disrupted in early 2020 by the COVID-19 pandemic. Collectively, the U.S. airline industry lost billions in 2020 and 2021, as air passenger demand plummeted to historic lows.[12] Domestic passenger traffic was 96 percent lower in April 2020 than in April 2019, with traffic in 2021 remaining 25 percent below traffic in 2019, according to DOT data.
From 2022 through 2024, the industry rebounded from the losses incurred during the pandemic, with total operating revenue exceeding pre-pandemic levels. However, the recovery has been uneven, with several airlines posting annual net losses, according to financial filings by the airlines.[13]
The airline industry also is facing significant cost and operational challenges. For example, according to Bureau of Labor Statistics data, the real annual median wage for airline pilots, copilots, and flight engineers was 31 percent higher in 2023, compared to 2017.[14] Our 2024 and 2025 reports discussed other challenges affecting the U.S. airline industry, including air traffic controller shortages, airspace congestion, and difficulty obtaining new aircraft and parts. We reported that these challenges could lead to delayed or cancelled flights or airlines reducing their numbers of scheduled flights.[15]
Merger Activity in the U.S. Airline Industry
From 2005 through 2016, the U.S. airline industry experienced considerable merger activity. By 2013, six network and three low-cost airlines had consolidated, forming what is now commonly referred to as the “Big Four” airlines, while another major merger between Alaska Airlines and Virgin America closed in 2016 (fig. 1).
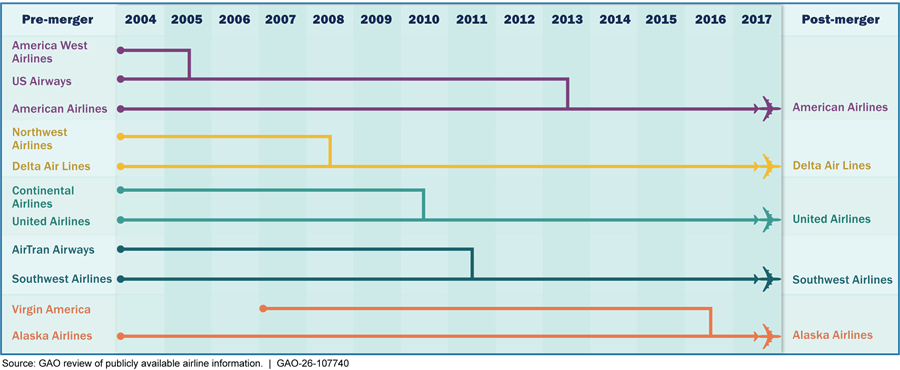
Note: For the purposes of this report, the year of each merger reflects the publicly announced date the merger or acquisition closed.
Several airlines have also pursued mergers in recent years. In 2024, a federal judge blocked a proposed acquisition of Spirit Airlines by JetBlue Airways, finding that it would likely result in less competition, impacting prices and innovation, and likely hurt consumers. Later in 2024, Alaska Airlines acquired Hawaiian Airlines.[16] And, on May 13, 2026, Allegiant Air completed its acquisition of Sun Country Airlines.[17]
Airlines may seek to merge to improve their strategic position by, for example, expanding route networks and combining fleets and loyalty programs. Airlines often anticipate benefits from a merger, such as increased revenues from expanding their networks and increased market shares, and cost savings, such as from combining complementary assets and reducing or eliminating duplicative activities, such as management and administrative functions. Several airlines involved in mergers in the 2000s and 2010s publicly reported that the proposed merger could provide benefits, with estimates in revenue synergies ranging from $175 million annually to $2 billion annually.[18] To the extent a merged airline realizes these benefits, they could benefit not only the airline, but also consumers if the airline passes cost savings to consumers through lower fares or improved service.
How Mergers Can Change the Structure of Competition Among Airlines
To evaluate the extent of competition among airlines, researchers and DOJ typically measure competition at the market level (i.e., travel between two cities, or “city-pair” route), instead of the national or global network level.[19] Mergers can affect fares and service quality on different routes when a merger results in the elimination or entry of a competing airline.
When a merger eliminates a competitor on a route, the merged airline could have more market power to raise fares and service quality may decline. In addition, consumers have fewer choices. A direct competitor is eliminated on a route when, before the merger, both merging airlines provided service on the same route (referred to as an “overlap” route), and, after the merger, only the merged airline provided service. A potential competitor is eliminated when one of the merging airlines operated a route pre-merger, and the other merging airline had a presence in at least one of the two airports on that route, which would have made it easier for that airline (the potential competitor) to have entered the route.
In contrast, when an airline enters a route, competition may increase on that route and spur lower fares and improved service quality. The entry airline can be the merged airline, which enters a route following a merger when it begins operating on a route that neither of the merging airlines operated prior to the merger.
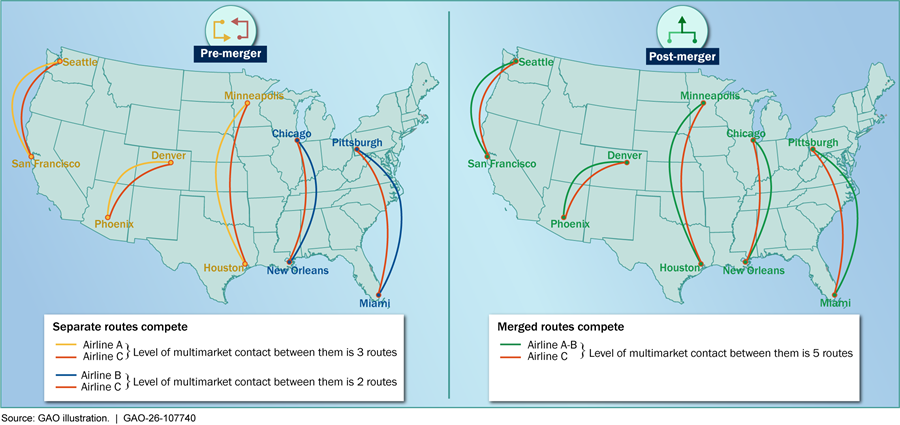
Mergers can also increase the level of multimarket contact between airlines. Multimarket contact describes conditions when airlines compete with the same rival airlines on multiple routes. Multimarket contact may increase following a merger, especially if the merging airlines had few overlap routes prior to the merger (see fig. 2). This occurs because, instead of a rival airline competing separately on a set of routes with each of the pre-merger airlines, the rival airline may now compete with the merged airline on many more routes served by the merged airlines. Multimarket contact can influence incentives to compete aggressively on certain routes if a rival airline has more opportunities to retaliate on other routes. Further, increased multimarket contact can increase the risk of airlines coordinating on fares and capacity, according to DOJ officials, which could lead to higher fares and lower capacity.
On the other hand, as discussed above, mergers may result in increased efficiency and cost reductions for the airline, which could lead to lower fares and better service quality. The net effect of mergers in practice will depend on a number of factors, including any changes in airlines’ market power and the extent of efficiency gains, if any.
Federal Agencies’ Roles
Two federal agencies—DOJ and DOT—play key roles in promoting and evaluating competition in the U.S. airline industry, including DOJ’s role in allowing mergers to proceed or suing to block them, and DOT’s role in ensuring safe and efficient access across the air transportation system.
DOJ has the lead role in reviewing proposed mergers and acquisitions in the airline industry, given its statutory authorities to enforce U.S. antitrust laws. In carrying out its antitrust responsibilities, DOJ examines whether the effect of any consolidation of two airlines “may be substantially to lessen competition or tend to create a monopoly” in violation of the Clayton Act, as amended.[20] If so, DOJ may sue to block a merger.[21]
DOJ principally uses the analytical framework established in the Merger Guidelines to analyze whether a proposed merger or acquisition involving actual or potential competitors raises antitrust concerns.[22] As part of its analysis, DOJ considers several potential effects of a proposed merger, including effects on market concentration, barriers to entry, and merger-specific airline efficiencies.[23] For example, DOJ typically uses the Herfindahl-Hirschman Index (HHI) to assess whether a merger is likely to significantly increase concentration and raise anti-competitive concerns in the relevant markets.[24] Depending on the airlines involved, the relevant markets are often considered origin and destination (also referred to in the industry as “city-pair”) routes operated by the merging airlines.[25]
DOT also conducts analyses of the merits of any airline merger and acquisition and submits its views and provides its subject matter expertise in advising DOJ. DOJ and DOT may seek certain concessions from the merging airlines to ensure the competitiveness of the market for the benefit of the consumer.[26] Concessions may include divesting (i.e., giving up) gates or takeoff and landing slots at certain airports, as well as maintaining service on routes serving small communities.
When seeking to merge, airlines typically provide estimates of anticipated benefits of the proposed merger to DOJ and DOT. According to the 2023 Merger Guidelines, agencies conducting merger reviews examine whether the evidence presented by the merging parties shows the merger will produce substantial competitive benefits that could not be achieved without the merger, benefits are verifiable and have been verified using reliable methodology and evidence, benefits will prevent the risk of a substantial lessening of competition, and benefits are not anticompetitive.[27] According to the guidelines, however, such benefits are often difficult to quantify and verify.
Separate from examining individual proposed mergers, DOT considers a range of related issues, including international route transfers, economic fitness, and code-sharing (an agreement whereby carriers place their marketing code on a flight operated by another carrier).[28] In addition, DOT has statutory authority to investigate and address unfair or deceptive practices or unfair methods of competition by airlines.[29] DOT also monitors fundamental changes in the industry, analyzes industry trends, and assesses factors related to competitive air service, such as perceived barriers to entry or expansion at airports. For example, certain airports must maintain an FAA-approved Competition Plan demonstrating the availability of the necessary infrastructure, such as gates and related facilities, and how it will accommodate new or expanding service.
Studies Generally Found That, in the Short Run, Mergers Increased Fares on Routes Where the Number of Competitors Decreased and Had Inconsistent Effects on Merged Airlines’ Efficiencies
Empirical studies we reviewed and found methodologically rigorous generally concluded that mergers, in the short run, led to higher fares and lower service quality (e.g., worse on-time performance or more cancelled flights) for consumers on routes where the number of competitors decreased, and lower fares and improved service quality on routes where a merged airline entered following a merger. In addition, some of these studies found that mergers resulted in some improvements in airlines’ efficiencies, but challenges associated with merging the airlines, such as combining workforces, sometimes led to reduced or no efficiency gains.[30]
The 40 studies did not evaluate efficiency gains realized by those mergers, if any, against those projected by the merging airlines, in part due to the lack of proprietary cost data that is available to researchers. Further, these studies are generally designed to draw conclusions about merger effects on a subset of routes, not about the overall competitive effects of specific mergers. Since the overall industry-wide competitive effects of a merger would require an assessment of all routes and all players in the industry, researchers would have to construct an alternative scenario (counterfactual) of what the airline industry would have looked like had the merger not happened. Such counterfactuals are challenging to quantify and require various assumptions that could affect the result of such an analysis. As such, researchers on this topic generally focus on a subset of routes affected by the merger, which have a plausible counterfactual in real world data. To characterize the degree of competition over time and to provide additional evidence on how competition evolved after the wave of airline mergers, we present several metrics, such as airfares and market concentration, in the next section of this report.
Consumers Generally Faced Higher Fares and Decreased Service Quality in the Short Run on Routes Where the Number of Competitors Decreased
In general, studies found that mergers, in the short run, led to higher fares and lower service quality for consumers on routes where the number of competitors decreased, and lower fares and improved service quality on routes where the number of competitors increased. Twenty seven studies that met our criteria for inclusion evaluated the effects of individual U.S. airline mergers on consumer fares, service quality, or both.[31] These 27 studies sought to isolate and quantify the effects of one or more mergers from other factors that might have affected fares and certain aspects of service quality (e.g., on-time performance or number of cancelled flights) within a specified time frame (i.e., a few quarters to a few years) after the mergers.[32]
Effects on Fares
Of the 27 studies assessing merger effects on consumers, 12 studies assessed fares, including three studies that we determined had particularly robust methodologies (hereafter referred to as “particularly strong studies”). Nine of those 12 studies found that, in the short run, (1) fares increased on routes where the merger reduced the number of competitors, or (2) fares decreased on routes where a merged airline entered that route following a merger.[33] These 12 studies specifically examined or used data from the time period encompassing five of the six mergers in our review: Delta Air Lines / Northwest Airlines, United Airlines / Continental Airlines, Southwest Airlines / AirTran Airways, American Airlines / US Airways, and Alaska Airlines / Virgin America.[34]
Fares on Routes Where a Direct or Potential Competitor Was Eliminated
Eight of the 12 studies, including three particularly strong studies, found that, on average, fares increased on routes when a merger eliminated a direct competitor.[35] The three particularly strong studies found that fares increased between 1 and 8 percent following a merger, comparing fares across time frames ranging from 1 to 4 years before the merger to 1 to 4 years following the merger, depending on the individual study’s methodology (see table 1).
Table 1: Price Effect of Mergers on Routes Operated by Both Airlines (Overlap Routes) from Empirical Studies GAO Determined to Be Particularly Strong
|
Study |
Merger |
Estimates of price increase range |
Number and type of overlap routes |
Time frame |
|
1 |
United Airlines / Continental Airlinesa |
7.8 to 8.3 percentb |
9 nonstop overlap routes |
Pre-merger: 4 years before merger announcement (2006Q1–2010Q1). Post-merger: 4 years since merger announcement (2010Q2–2013Q4). |
|
2 |
Southwest Airlines / AirTran Airwaysc |
2.1 to 5.3 percentd |
104 nonstop and connecting overlap routes |
Pre-merger: 1 year before DOJ announced the closing Post-merger: 1 year after full integration (2014Q2–2015Q1). |
|
3 |
Delta Air Lines / Northwest Airlinese |
0.2 to 1.8 percentf |
More than 4,000 connecting overlap routes |
Pre-merger: 2 years before merger announcement (2006Q1–2008Q1). Post-merger: 2 years after merger closed (2009Q2–2011Q4). |
Source: GAO review of selected empirical studies. | GAO‑26‑107740
Note: GAO determined these studies to be particularly strong because they adopted a strong causal research design, such as a research design that included the most appropriate control group.
aYing Shen, “Market competition and market price: Evidence from United/Continental airline merger,” Economics of Transportation, vol. 10 (2017): 1–7.
bThe price increase range is derived from different regression specifications.
cHuubinh B. Le, “An Empirical Analysis of the Price and Output Effects of the Southwest/AirTran Merger,” Competition and Regulation in Network Industries, vol. 17, no. 3–4 (2016): 226–240.
dThe price increase range represents the 95 percent confidence interval of the point estimate of 3.7 percent. Unless otherwise noted, the confidence intervals for studies cited in this report were calculated by GAO economists using the point estimates and standard errors presented in the studies. Two other studies also found an increase in price of the overlap routes between Southwest and AirTran. See Alexander McGlothlin, “Mavericks and mergers in concentrated markets,” (Nov. 20, 2019), https://ssrn.com/abstract=3490329; and Pukar KC, “Three Essays in Applied Economics: Topics in Transportation, Industrial Organization and Health Economics, Chapter 2– Higher Together: Price and Welfare Effects of a Merger between two Low Cost Carriers,” PhD diss. (Northeastern University, 2018).
eAditi Mehta and Nathan H. Miller, “Choosing the Appropriate Control Group in Merger Evaluations,” More Pros and Cons of Merger Control, Swedish Competition Authority, 2012.
fThe price increase range represents the 95 percent confidence interval of the point estimate of 1 percent.
Four of these 12 studies, including one particularly strong study, also assessed effects on fares for routes where a merger eliminated a potential competitor and found that, on average, fares increased.[36] For example, the particularly strong study compared fares 1 year before DOJ announced the closing of its investigation into the Southwest Airlines and AirTran proposed acquisition to 1 year after the airlines fully integrated their operations.[37] It found that fares increased both on routes where Southwest Airlines was eliminated as a potential competitor (4.3 to 8.9 percent increase), and on routes where AirTran Airways was eliminated as a potential competitor (2.0 to 4.5 percent increase).[38]
Four of the studies that assessed the effects on fares when a merger eliminated a direct competitor found that, on average, fares decreased, had mixed effects, or did not change post-merger.[39] The variation in findings may be explained by the different time frames analyzed or different definitions of the pre- and post-merger period.[40]
Fares on Routes Where a Merged Airline Entered Following a Merger
Of the three studies that assessed the effects on fares for routes where the merged airline entered, two found that fares, on average, decreased.[41] Of these two, one study, which analyzed fares on 128 routes that Southwest Airlines entered after its merger with AirTran Airways, was a particularly strong study. This study found that, following the entry of the merged airline, fares decreased by 3 to 9 percent, on average, 1 year following the merger when compared to 1 year prior to the merger.[42] The third study—which we did not identify as particularly strong— found mixed effects, either evidence of decreased fares or no evidence of fare changes, depending on different regression models used.[43]
Effects on Service Quality
Of the 27 studies assessing merger effects on consumers, seven studies assessed certain aspects of service quality, such as flight frequency, on-time performance, duration of flight delays, or number of cancelled flights. Six of the seven studies—including five particularly strong studies—found that, in the short run, service quality 1) declined on routes where a competitor was eliminated or 2) improved on routes where the merged airline entered. One study—which we did not identify as particularly strong—found effects differed depending on the time frame analyzed. These seven studies examined four of the six mergers in our review.[44]
Service Quality on Routes Where a Competitor Was Eliminated
Two of the three studies that assessed routes where a direct competitor was eliminated—including one particularly strong study—found that service quality declined. The third study—which we did not identify as particularly strong—found mixed results.[45] These three studies analyzed service quality in terms of routing quality (e.g., availability of nonstop flights versus connecting flights), on-time performance, and flight frequency. They compared differences in service quality over time frames ranging from 3 quarters of a year to 5 years before or after the merger.[46]
The particularly strong study found that on routes United Airlines and Continental Airlines competed on pre-merger, the number of passengers flying nonstop decreased by about 1.1 percent in the 3-year period following their merger.[47] The same study found that on routes Delta Air Lines and Northwest Airlines competed on pre-merger, the percentage of passengers flying nonstop decreased by about 1.4 percent in the 5-year period following their merger.[48] According to the study, these declines could be explained by the merged airlines eliminating or reorganizing hubs following the merger.
Three other particularly strong studies found that service quality declined when market concentration increased at different points in time during the wave of airline mergers.[49] More specifically, the studies found the following:
· If market concentration meaningfully increases, the duration of arrival delays would increase by approximately 2 to 5 minutes, and the probability of airline-caused flight delays of at least 15 minutes would increase by 1.3 to 4.9 percentage points.[50]
· When the number of competitors decreased from three to two in a market, the average delay length increased by 25 percent, and the flight cancellation rate increased by 7 percent.[51]
· If two hypothetical equal-sized competitors, each with a market share of 40 percent merge with each other, the merger would lead to an estimated increase in the average arrival delay of approximately 3 to 5 minutes. Also, an increase of 10 percent in market concentration would be associated with a 0.07 to 0.17 percent increase in the cancellation rate.[52]
Service Quality on Routes Where Merged Airline Entered Following a Merger
The one particularly strong study that assessed service quality on routes after a merged airline’s entry found that, on average, service quality improved.[53] Specifically, this study found that the length of arrival delays decreased by 11 to 29 percent, and the length of departure delays decreased by 4 to 10 percent, on average, within 3 years after the merger.[54] This study assessed four mergers using data from 1993 to 2013 and compared the number of arrival delays and departure delays between 2 years prior to each merger announcement and up to 3 years following each merger.[55]
Multimarket Contact
Nine additional studies, including three particularly strong studies that focused on multimarket contact, found that the level of multimarket contact increased post-merger and that higher levels of multimarket contact led to higher airfares and lower service quality. As previously discussed, multimarket contact describes conditions when airlines compete with the same rival airlines on multiple routes. Following a merger, multimarket contact may increase because, instead of a rival airline competing separately on a set of routes with each of the pre-merger airlines, it may now compete on many more routes served by the merged airline. Multimarket contact can reduce the incentives for an airline to compete aggressively on certain routes if a rival airline has more opportunities to retaliate.
Of the nine studies:
· Three studies—including two particularly strong ones—assessed the extent to which multimarket contact increased following a merger. One particularly strong study found that the level of multimarket contact increased by about 29 percent when comparing the level of contact 2 years post-merger with 2 years pre-merger.[56] The second particularly strong study analyzed the 1,000 largest routes by passenger volume from a time frame encompassing four major mergers and found that multimarket contact generally increased.[57]
· Seven studies—including three particularly strong ones—assessed the extent to which increased multimarket contact affected fares or service quality. All seven found that higher levels of multimarket contact led to higher airfares or lower service quality.[58] For example, one particularly strong study found that a 30 percentage point increase in multimarket contact resulted in a 6.5 to 14.5 percent increase in the least expensive fares and a 3.0 to 9.7 percent increase in the most expensive fares, respectively.[59] Another particularly strong study similarly found a 29 percent increase in multimarket contact, which resulted in airlines cutting flights by roughly 2 to 2.5 roundtrips per week, on average, for routes where they competed with either merging airlines pre-merger.[60] Two other studies found that increased levels of multimarket contact led to a reduction in the number of seats offered and increased flight delays.[61] However, one study found that the presence of Southwest Airlines mitigated the effect on fares of increased multimarket contact.[62] In addition, one particularly strong study found that, if multimarket contact was already very high, an increase in multimarket contact had little effect on fares.[63]
Effects on Small and Rural Communities
None of the 40 studies we selected for review assessed the effects of airline mergers on small and rural communities. In our interviews with stakeholders, some offered thoughts on why studies have not focused on the effects in these communities.[64] One academic researcher explained that because the available air traffic data on small markets are very limited, researchers may prefer to prioritize their resources on studying bigger markets that have more data. Another academic researcher we spoke with said that because these markets tend to be served only by one airline, they did not believe that mergers had much effect on these markets.
Some stakeholders we interviewed suggested airline mergers affected service quality for small and rural communities, but opinions of those effects differed. Some pointed to positive effects. For example, one academic researcher told us that, theoretically, mergers could have benefits for small and rural markets through the creation of larger networks that provided more connections to airlines’ hubs. Representatives from three network airlines told us that mergers have enabled them to expand service to small and rural communities in this way. However, two equity analysts and a consumer advocate told us that mergers had reduced service to some small communities because the merged airlines stopped using certain airports those communities connected to as hub airports. At the same time, they acknowledged that in some cases, even without the merger, it may not have been sustainable for the airlines to continue to serve those communities at the same level. For example, following the Delta Air Lines and Northwest Airlines merger, Memphis International Airport was no longer a hub airport for Northwest Airlines. One equity analyst explained that the small communities that used to have direct flights to Memphis International Airport were instead connected to Atlanta International Airport, which resulted in less frequent flights on larger aircrafts. And, while these two equity analysts explained that it would not be economically efficient for the merged airline to operate at both hubs, they and the consumer advocate recognized that the elimination of hubs can have detrimental effects on the communities and economies where those hubs were formerly located.
Several stakeholders we interviewed stated that the reduced service that many small and rural communities have seen in recent years did not result from mergers.[65] For example, one equity analyst and representatives from several airlines told us that the unfavorable economics of providing airline service to these communities, such as higher labor cost, led to the reduction.[66] Representatives from a lower-cost airline explained that an airline’s decision to operate in a smaller market is typically based on profitability, and if a small market is not profitable, airlines will not operate in that market without government subsidies. Representatives from two network airlines also pointed to the lack of suitable replacement aircraft for routes that were previously served almost exclusively by small turboprops or regional jets. According to representatives of one network airline, as of 2025, these small turboprops are no longer being produced, contributing to reduced service in small and rural communities. We discuss competition for routes serving small and rural communities later in this report.
Studies Found That Some Mergers Improved Fleet Optimization, While Challenges Integrating Operations Reduced Efficiency or Prevented Efficiency Gains
Three of the six studies assessing airline efficiencies found that mergers resulted in some efficiency gains for airlines when examining two common types of efficiencies: cost efficiencies and network efficiencies, such as improved fleet optimization (matching the right aircraft, in terms of size and fuel efficiency, to the right route). None of these three studies were among those we identified as particularly strong. Three other studies, including two particularly strong studies, found challenges associated with mergers that may reduce efficiency or prevent the realization of potential efficiency gains. These six studies examined five of the six mergers in our review. None of the studies, as previously noted, evaluated efficiency gains achieved by those mergers, if any, against those projected by the merging airlines.
Specifically, three of six studies found that a merger resulted in at least some gain in network or cost efficiencies, including reduced fuel consumption, improved fleet utilization, and cost reductions.[67] For example, one study found evidence that two different merged airlines were able to operate larger aircraft with reduced frequency from hubs, resulting in more efficient operations and fuel consumption savings.[68]
In addition to the studies, representatives we spoke to from several network and lower-cost airlines, as well as equity analysts, told us that mergers have resulted in cost and network efficiencies, such as cost savings by eliminating redundancies and more efficient fleet utilization post-merger. For example, representatives from Southwest Airlines told us that after the merger with AirTran, Southwest moved some of AirTran’s aircraft to locations where they could be more efficiently operated and enter more international markets. By doing so, Southwest Airlines representatives said they could lower prices in those markets, which also benefited consumers.
The three studies that discussed challenges (e.g., consolidating workforces, capital, and technology systems) found that challenges that a merged airline faced after the merger either 1) reduced efficiency compared to before the merger, as measured by decreases in on-time performance, or 2) prevented the realization of potential efficiency gains.[69] Of the three studies:
· One particularly strong study examined the effects that merger-related challenges, such as integrating labor contracts, had following three different mergers and found that those challenges reduced the merged airline’s on-time-performance.[70] Specifically, the challenges resulted in an increase in the average minutes of delays for the three merged airlines by 0.52, 0.37, and 1.05 minutes (or, 16 percent, 11 percent, and 34 percent of the industry average delays of about 3 minutes) in the 2 years after the merged airlines integrated their operations as compared to 3 years prior to that integration.[71] For two of the mergers, the study found that the increase in delay generally faded away over the course of roughly 2 years.[72]
· The second particularly strong study examined four different mergers and found that both United Airlines and Southwest Airlines faced substantial integration costs, so much so that the mergers reduced productive efficiency. The study also found the four mergers on average did not result in efficiency gains when comparing traffic and financial data in each quarter up to 2 years prior to each merger closing and 4 years after the mergers.[73]
Airlines anticipate challenges related to integrating workforces and information systems and recognize that these challenges may result in smaller efficiency gains than projected, according to our review of relevant airline public documents.[74] Several equity analysts also told us that while mergers can face such challenges, some workforce and information system efficiencies still had been gained over the long term.
Fare and Market Structure Indicators Suggest Increased Competition Overall in the Past Two Decades
Our analyses of airline competition metrics—which provide a broader look at airline competition over a longer time frame—found that, compared to 2007, competition in the past two decades had increased. This finding was generally consistent across key metrics we assessed—fares; total number of seats offered by airlines; and market structure indicators (i.e., market share, number of effective competitors, and market concentration)—though the market structure indicators plateaued from 2022 through 2024.
In analyzing each metric, we divided domestic routes into five equal segments, or “quintiles,” based on passenger traffic. For simplicity in this report, we use “route” to refer to both travel between two specific airports and between city-pairs, when a city has multiple airports.[75] Because certain routes carry more passengers than others, the number of routes in each quintile differs substantially.[76] See Appendix I for more details on our data analyses.
After an Increase in 2012, Average Estimated Fares on Most Routes Were Lower in 2024 Compared to 2007
Through our data analysis, we found that average inflation-adjusted estimated domestic fares (average fares) were lower in 2024 as compared with 2007, an average of 15 percent across all quintiles (see fig. 3). Fares are the sum of estimated average base fares and average available airline-reported ancillary fees. Specifically, we added ancillary fees that airlines are required to account for separately in their reports to DOT—average baggage fees and reservation change and cancellation fees—to the base fare estimates.[77] Base fares are one-way ticketed fares in either direction, excluding taxes and fees.
The average fares on the less-traveled routes (fourth and fifth quintile)—generally routes to small and rural communities—experienced the largest decrease in fares of about 18 percent (an average of about $44 per ticket) in 2024 as compared with 2007. By comparison, average fares for the busier routes (first through third quintile) were about 14 percent lower (about $28 per ticket). When examining the trend across the most current years of our analysis (2022, 2023, and 2024), we found that fares decreased around 8 percent (about $16 per ticket) across all five quintiles from 2022 through 2024.
Figure 3: Average Estimated Inflation-Adjusted One-Way Airline Fares, City-Pair Quintiles, 2007, 2012, 2017, and 2022–2024
Notes: Fares reflect one-way fares in either direction, excluding taxes and fees, and include average baggage fees and reservation change and cancellation fees.
Each quintile contains approximately the same number of passengers, but the number of city-pair routes differs. For example, in 2024, the first, second, third, fourth, and fifth quintile contained 55, 128, 267, 775, and 10,526 city-pair routes, respectively, each with 20 percent of the roughly 570 million passengers in our sample for 2024.
When examining the number of routes that experienced a decrease in fares, we found that, across all quintiles, the majority of routes (79 percent) experienced lower fares in 2024 compared with 2007. Moreover, on the most-heavily traveled routes (first quintile), 94 percent of those routes had lower fares.
However, consistent with the findings from most of the empirical studies we reviewed, average fares in all five quintiles were higher in 2012 compared to 2007. The time frame between 2007 and 2012 generally coincides with several mergers included in our review. We previously reported that several factors also contributed to fare increases from 2007 to 2012, including “capacity restraint” exercised by airlines (i.e., limiting the supply of available seats in relation to the level of demand) and less price pressure exerted during this time by low-cost airlines.[78]
While increased competition could explain the lower fares in 2024 as compared to 2007, we identified three other factors that could explain the lower fares: the unbundling of fares, changes in airlines’ operating costs, and potential shifts in route distance over time. We determined that each of the factors is less likely to explain the lower fares in 2024 relative to 2007 than the effect of increased competition.
· Fare unbundling. Between 2008 and 2017, U.S. airlines began “unbundling” and introducing new fees for services, such as for carry-on bags, beverages, wireless internet access, and priority boarding. Some of these services used to be included in the base ticket fare. Due to the expansion of these ancillary fees and the lack of available data on those fees beyond baggage and reservation fees, our comparison of 2024 fares to 2007 may overestimate the drop in fares. Therefore, to provide the most equivalent fare comparison, we compared fares in 2024 to those in 2017, when unbundling was generally fully incorporated in fare structures, and found fares decreased 12 percent, on average, across all quintiles.[79] Regarding the number of routes that experienced a decrease in fares, we found that 88 percent of routes across all quintiles experienced lower fares in 2024 compared to 2017. On the most-heavily traveled routes (first quintile), 73 percent of those routes had lower fares.
· Operating costs. Major airlines’ unit operating costs—as measured by cost per available seat mile—were generally higher in 2024, ranging from a 1 percent to 24 percent increase after inflation adjustment, as compared to 2007.[80] We analyzed selected airlines’ cost per available seat mile to compare any changes in operating costs over time to the changes in fares we observed in our analysis.[81] While fluctuations in costs from year to year are to be expected due to changes in labor, fuel, and maintenance costs, we would also expect that, in a competitive environment, airlines would find it challenging to raise fares when experiencing higher costs. Fares were lower when costs were generally higher in 2024 as compared to 2007, suggesting that airlines were generally unable to pass along cost increases to consumers.
· Route distance. Analyzing the change in average estimated airline yields—a measurement of fare per unit of distance—accounts for potential changes in the length of routes over time. For example, if the number of long-haul routes decreased over time, then lower fares may reflect shorter routes. However, if airline yields also decreased over time, lower fares would not be explained by any potential changes in the length of routes. Like fares, we found that yields were lower in 2024 as compared with 2007 (see fig. 4). Specifically, we found a 19 percent decrease across all quintiles in 2024 compared to 2007—exceeding the 15 percent decrease in fares.
Figure 4: Average Estimated Inflation-Adjusted Airline Yields, City-Pair Quintiles, 2007, 2012, 2017, and 2022–2024
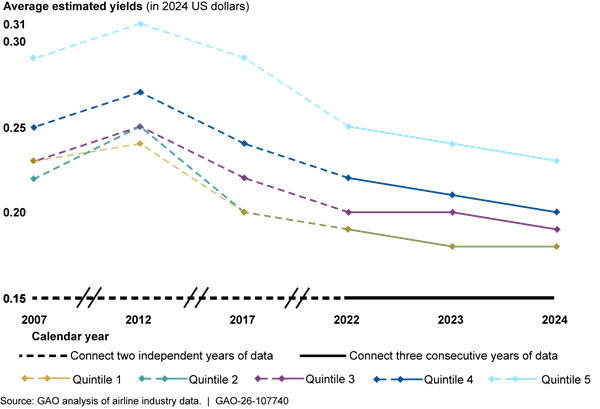
Notes: Stage-length-adjusted yields (“yields”) are calculated as fare per mile multiplied by the square root of flight distance in miles divided by 1,000. Fares reflect one-way fares in either direction, excluding taxes and fees, and include average baggage fees and reservation change and cancellation fees.
Each quintile contains approximately the same number of passengers, but the number of city-pair routes differs. For example, in 2024, the first, second, third, fourth, and fifth quintile contained 55, 128, 267, 775, and 10,526 city-pair routes, respectively, each with 20 percent of the roughly 570 million passengers in our sample for 2024.
One factor that may have contributed to decreasing fares and yields is the growth in lower-cost airlines throughout the last three decades.[82] Despite barriers to entry at some airports, which we discuss below, our analysis found that lower-cost airlines expanded their presence nationwide, including at hub airports that are dominated by a network airline.[83] The increase in market share of lower-cost airlines and the potential effects is discussed more below.
Airlines Offered More Total Seats in 2024 as Compared to 2007, While Decreases in Total Flights Since 2007 Recently Began to Plateau
We found, when comparing 2024 to 2007, that total seats—a measure of capacity—increased across all quintiles, but not on a consistently upward trend (see fig. 5). Total seats were lower across all quintiles in 2012, compared to 2007, which is consistent with our prior report’s discussion of the “capacity restraint” exercised by airlines.[84] But the number of total seats in 2017 and 2022 returned to levels generally similar to those observed in 2007. From 2022 through 2024, however, airlines increased capacity considerably, as evidenced by a 14 percent increase in total seats across all quintiles.
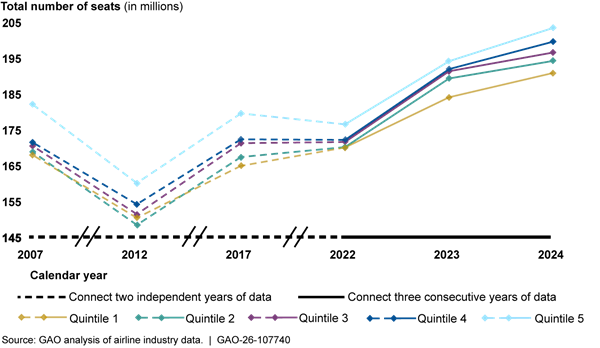
Notes: The data used to calculate the number of seats are based on nonstop segment data. A passenger on a one-stop flight is counted twice in each flight segment.
Each quintile contains approximately the same number of passengers, but the number of city-pair routes differs. For example, in 2024, the first, second, third, fourth, and fifth quintile contained 53, 108, 189, 381, and 1,999 city-pair routes, respectively, each with 20 percent of the roughly 800 million passengers in our sample for 2024.
Airlines increased their capacity—or total seats—while operating fewer flights, as evidenced by a general decrease in total domestic flights per day on an average route (see fig. 6). Specifically, total flights per day were lower in all quintiles in 2022, as compared to 2007, and remained largely the same from 2022 through 2024. For the busiest routes (first quintile), airlines averaged 79 flights per day on any route in 2007, whereas in 2024, the same quintile averaged about 67 flights per day, a 15 percent decline. On the least-traveled routes (fifth quintile), airlines averaged seven flights per day on a given route in 2007 and under five flights per day in 2024, about a 32 percent decline.
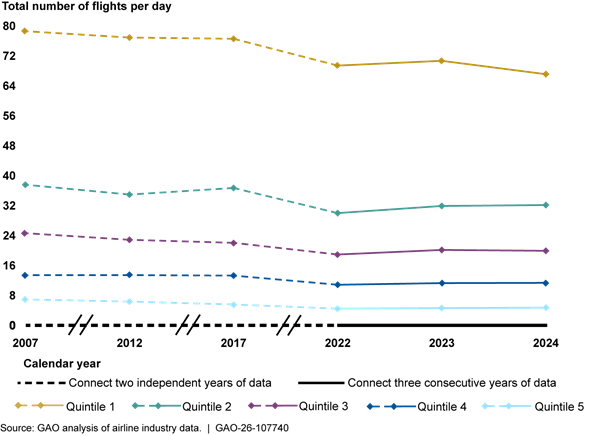
Notes: The data used to calculate the flights per day are based on nonstop segment data. A passenger on a one-stop flight is counted twice in each flight segment.
Each quintile contains approximately the same number of passengers, but the number of city-pair routes differs. For example, in 2024, the first, second, third, fourth, and fifth quintile contained 53, 108, 189, 381, and 1,999 city-pair routes, respectively, each with 20 percent of the roughly 800 million passengers in our sample for 2024.
Increasing the number of seats with decreased flights refers to “up-gauging,” whereby airlines increasingly operate larger aircraft (see fig. 7). For example, the average aircraft flown on the busiest routes (first quintile) was 166 seats in 2024 compared to around 134 seats in 2007, a 24 percent increase. Aircraft size for the least-traveled routes (fifth quintile) increased 54 percent, or 105 seats in 2024 compared to 68 seats in 2007. Up-gauging is generally a reflection of airlines’ desire to increase operational efficiency and lower unit costs (i.e., cost per passenger) by carrying more passengers on fewer planes.
However, up-gauging can have varying effects on consumers. It could benefit consumers if airlines achieve cost-savings through increased operational efficiency and pass on those savings to the consumer through lower fares. On the other hand, reducing the number of flights can harm some consumers. For example, when the base number of flights is lower, such as in the fifth quintile, there are fewer flights per day from which a traveler from a smaller community can choose, reducing the likelihood the traveler can find a flight for their preferred time of the day.[85]
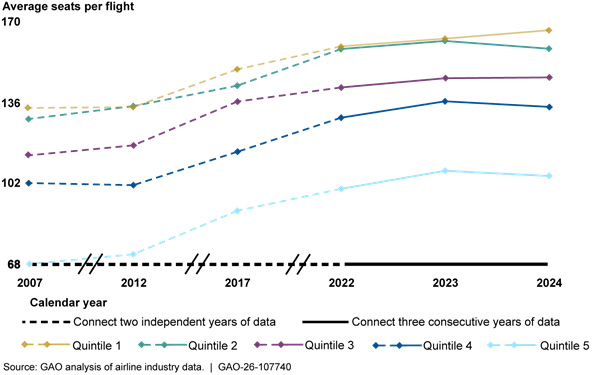
Notes: The data used to calculate the average seats per flight are based on nonstop segment data. A passenger on a one-stop flight is counted twice in each flight segment.
Each quintile contains approximately the same number of passengers, but the number of city-pair routes differs. For example, in 2024, the first, second, third, fourth, and fifth quintile contained 53, 108, 189, 381, and 1,999 city-pair routes, respectively, each with 20 percent of the roughly 800 million passengers in our sample for 2024.
Further, our analysis found that load factors—the proportion of available seats occupied by passengers on a given flight—were overall higher in 2024 as compared to 2007, despite slight decreases from 2022 through 2024 (see fig. 8). Specifically, load factors were highest in 2017 for busier routes (first through third quintiles) as compared to 2007. And, for less-traveled routes (fourth and fifth quintiles), average load factors were highest in 2022, as compared to 2007. While higher load factors indicate that airlines are using aircraft fleets more efficiently, fuller flights also may have consequences for passenger experiences, such as less overhead space, less flexibility to rebook, or more time spent getting on and off the plane.
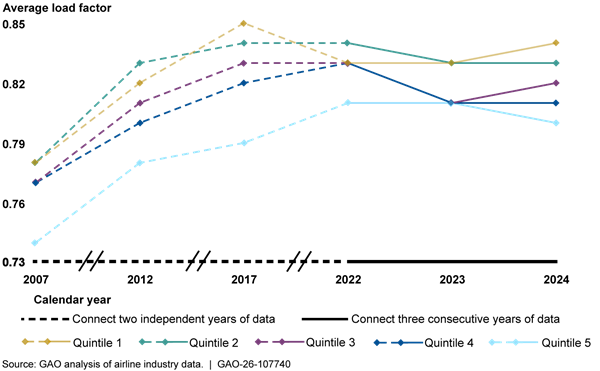
Notes: The data used to calculate the average load factor are based on nonstop segment data. A passenger on a one-stop flight is counted twice in each flight segment.
Each quintile contains approximately the same number of passengers, but the number of city-pair routes differs. For example, in 2024, the first, second, third, fourth, and fifth quintile contained 53, 108, 189, 381, and 1,999 city-pair routes, respectively, each with 20 percent of the roughly 800 million passengers in our sample for 2024.
Key Market Structure Indicators Show Increased Presence of Ultra-Low-Cost Airlines in 2022 as Compared to 2007, with Indicators Plateauing Since 2022
Our analysis of three market structure indicators—market shares for each airline type, the number of effective competitors, and market concentration measured by the Herfindahl–Hirschman Index (HHI)—found that compared to 2007, competition in recent years generally increased, even though indicators remained largely unchanged from 2022 through 2024.
Market Share
In 2022, compared with 2007, we found a decrease in network airlines’ market share and an increase in market share for ultra-low-cost airlines.[86] From 2022 through 2024, market shares across all airline types remained relatively flat (see fig. 9). Market share describes the proportion of total passengers transported by different types of airlines, including network, low-cost, ultra-low-cost, and other (e.g., regional) airlines each year. In the airline industry, the effect of market share on price competition can depend on the type of airline.
Specifically, while network airlines collectively transport the most passengers each year, we found that their market share in 2022 decreased by 7 percentage points compared with 2007, from 65 percent to 58 percent. Low-cost airlines saw a slight decrease, from 30 percent to 28 percent over the same period. In contrast, ultra-low-cost airlines’ market share in 2022 increased by almost 10 percentage points compared with 2007, from 4 percent to 13 percent. As discussed previously, lower-cost airlines (i.e., low-cost and ultra-low-cost airlines), like Southwest Airlines and Spirit Airlines, exert more price pressure on network airlines than network airlines exert on one another, ultimately resulting in lower fares.[87]
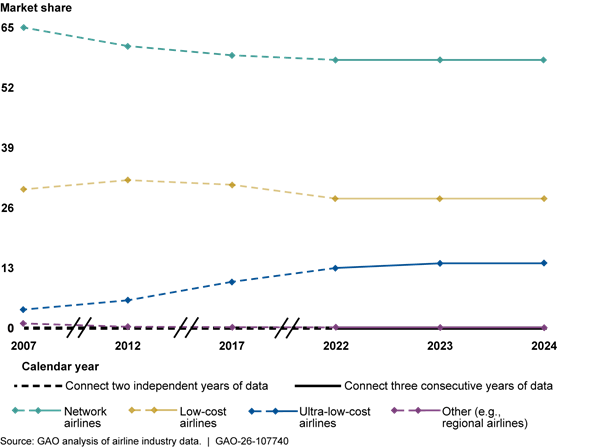
Note: For analytical purposes, we categorized airlines into four types. However, given the dynamic nature of the industry and airlines’ individual business models, an airline may not perfectly fall into a single category across all years and for all purposes.
The market shares are calculated as the weighted average of market shares for each airline type across city-pairs in the U.S. (weighted by passenger count).
From 2022 through 2024, the market share of each airline type changed less than 1 percentage point. The recent stability in market share may be the result of network airlines’ expansion into basic economy services, discussed more in the next section of the report, which has contributed to the plateau of lower-cost airlines’ growth.[88]
Effective Competitors and Market Concentration
In 2022 compared with 2007, the average number of effective competitors—any airline that carries at least 5 percent of the passenger traffic on a given route—and market concentration suggest increased competition on the busiest routes and decreased competition on routes with lower passenger traffic.[89] However, from 2022 through 2024, these indicators remained largely unchanged.
In the airline industry—an industry with relatively few competitors—a higher number of effective competitors on any route typically indicates a higher level of competition. By contrast, an increase in market concentration, which we measured using the Herfindahl-Hirschman Index (HHI), often indicates weakening competition, which increases the likelihood that one or more airlines can exert market power and influence overpricing.[90]
Our analysis found that for the busiest routes (first through third quintiles), the average number of effective competitors was higher in 2022 compared with 2007 and generally flat from 2022 through 2024 (see fig. 10). For example, on the most heavily traveled routes (first quintile), the average number of effective competitors increased from 3.99 in 2007 to 4.58 in 2022 (15 percent), and was 4.64 in 2024, an increase of 1.3 percent from 2022.[91]
Figure 10: Effective Domestic Airline Competitors, City-Pair Quintiles, 2007, 2012, 2017, and 2022–2024
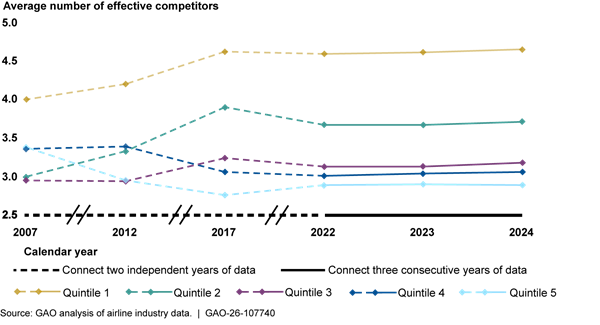
Note: Each quintile contains approximately the same number of passengers, but the number of city-pair routes differs. For example, in 2024, the first, second, third, fourth, and fifth quintile contained 55, 128, 267, 775, and 10,526 city-pair routes, respectively, each with 20 percent of the roughly 570 million passengers in our sample for 2024.
The increase in effective competitors observed in 2022 compared with 2007 was likely a result of entry of ultra-low-cost airlines on routes that previously had no ultra-low-cost presence, corresponding to the growth in ultra-low-cost airlines’ market share leading up to 2022. For example, for the most-heavily-traveled routes (first quintile), 56 percent of the routes saw the entrance of an ultra-low-cost effective competitor at some point between 2007 and 2022.[92]
Consistent with the higher number of effective competitors in 2022 compared to 2007, we found that HHI was lower for the busiest routes (first through third quintiles) in 2022 compared with 2007, and relatively flat from 2022 through 2024 (see fig. 11).[93] While similar to the number of effective competitors, HHI provides a more comprehensive measure of market concentration because it also considers the relative size and market share of each firm, giving more weight to larger airlines.[94] As such, lower HHI and a higher number of effective competitors typically indicate increased competition.
Figure 11: Market Concentration (as measured by HHI) in the Domestic Airline Industry, City-Pair Quintiles, 2007, 2012, 2017, and 2022–2024
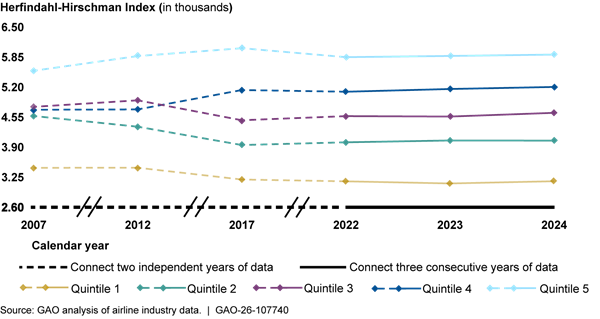
Notes: Each quintile contains approximately the same number of passengers, but the number of city-pair routes differs. For example, in 2024, the first, second, third, fourth, and fifth quintile contained 55, 128, 267, 775, and 10,526 city-pair routes, respectively, each with 20 percent of the roughly 570 million passengers in our sample for 2024.
HHI is a measure of market concentration and is calculated by summing the squares of the individual airline’s market shares. Higher values of this index on a route mean more market power for one or a select few airlines.
In contrast to the busier routes, we found that routes with lower passenger traffic (the fourth and fifth quintiles)—which likely include routes serving small communities—had fewer effective competitors on average and higher HHI in 2022 compared with 2007, indicating decreased competition. Specifically, effective competitors decreased from 3.35 in 2007 to 3 in 2022 for routes in the fourth quintile (HHI increased by 8 percent) and from 3.37 in 2007 to 2.88 in 2022 for routes in the fifth quintile (HHI increased by 5 percent). From 2022 through 2024, number of average effective competitors essentially remained the same, and HHI slightly increased for the fourth and fifth quintiles.[95] Together, the slight increase in HHI and the same number of effective competitors suggest that competition on routes in the fourth and fifth quintile, on average, decreased slightly from 2022 to 2024.
In addition, we found no significant presence of low-cost or ultra-low-cost effective competitors in the fifth quintile, in 2022 as compared with 2007. Specifically, while all routes in the first quintile had either a low-cost or ultra-low-cost effective competitor in each year we analyzed, 58 percent of routes in the fifth quintile had no effective low-cost or ultra-low-cost airline competitor in any year in our sample. According to three stakeholders we spoke with, service in these markets does not offer sufficient passenger traffic to attain profitability for lower-cost airlines that do not operate in hub and spoke systems.[96] However, as we mentioned above, average estimated fares in the fourth and fifth quintiles were still lower in 2022 compared to 2007.
Stakeholders Identified Key Factors That Affect Competition and Some Raised Concerns About Less Robust Competition in the Future
Growth of Airline Credit Cards and Basic Economy Products Are Newer Factors Cited Alongside Other Longstanding Ones
From our interviews with more than 30 stakeholders from various segments of the industry—including airlines, equity analysts, academic researchers, consumer advocates, and industry associations—five key factors that affect airline competition emerged.[97] Two of the key factors reflect new competitive dynamics in the industry—expanded airline credit card reward programs and the introduction of basic economy products. Three other cited factors are those we have discussed in prior work and, according to stakeholders, continue to affect airline competition—airport access, global alliances, and price transparency.[98] These five key factors are not an exhaustive list of factors that may affect competition.
Airline Credit Card Rewards Programs
While airline loyalty and rewards programs have existed for many years, a majority of stakeholders discussed the expanded importance of airline credit cards to these loyalty programs as a key factor affecting competition today. Some of these stakeholders discussed how airlines compete against each other through these programs and associated credit cards. Others discussed how such credit cards can provide some airlines with competitive advantages over the other airlines that are unable to take advantage of the credit card programs in the same way.
Over the past two decades, card holders’ use of airline credit cards has become the predominant method of earning airline rewards.[99] Traditionally, airline loyalty programs were frequent flier programs, where passengers earned “miles” and exchanged them for free or discounted travel or other rewards. As we reported in 2014, traditional loyalty programs can incentivize travelers to concentrate their flying with one airline to accumulate miles and rewards, even though other airlines’ fares may be more competitively priced.[100]
Airlines compete fiercely through reward programs, according to representatives of four airlines and an equity analyst, which may include the benefits offered to card holders. For example, representatives from one network airline told us they invested significantly in their cardholder airport lounges to make their loyalty program more appealing and competitive to consumers. The cards also provide benefits for airline customers by allowing them to redeem points for air travel, seat upgrades, and access to exclusive airport lounges, as well as benefits beyond air travel, such as hotels or restaurants. However, one consumer advocate explained that while these reward programs are popular, consumers may not be wholly better-off, in part because they may overvalue the benefits, and loyalty to the airline may disincentivize comparison shopping. Further, three consumer advocates stated in public comments that the quality of these programs has declined over time, as airlines have devalued points and made rewards more difficult to acquire.[101] For example, one consumer advocate highlighted that some airlines have imposed expiration dates for points.
According to stakeholders, airlines that offer credit cards can obtain competitive advantages by generating revenue beyond the airlines’ operating revenue and further solidifying customer loyalty. Eleven stakeholders, including seven airlines and four equity analysts, stated that airline credit cards have become an increasingly valuable source of revenue to many airlines. For example, Delta Air Lines recently announced that its American Express credit card relationship generated over $8 billion in 2025.[102] Airlines generate significant revenue by selling frequent flyer points—which are predominately accumulated through co-branded credit card transactions and whose value the airlines control—to third parties, such as banks. The banks then use the airline points as a means of attracting and rewarding customers who select their credit cards, according to a study we reviewed.[103]
According to DOT officials, these programs help provide airlines’ revenue stability, particularly in periods of lower travel demand, since the revenue generation is tied to credit card transactions. Further, 10 stakeholders, including representatives from the airlines and equity analyst community, said that airlines with these credit card reward programs may use that revenue to help offset operating costs. For example, according to representatives from one airline, the $3.2 billion in 2024 revenue earned from their airline credit card helped cover operating costs and enabled them to offer lower fares and more services to consumers than it otherwise could have without the credit card program.
However, some stakeholders stressed that not all airlines are able to take advantage of airline credit card programs or leverage their broader reward programs in the same way. These 10 stakeholders, including airline representatives, equity analysts, and a consumer advocate, told us that the reward programs created by smaller airlines, particularly lower-cost airlines, are less attractive than larger airlines due to their relatively small scale of operation. In addition, DOT officials stated that smaller airlines may not receive the best deals with credit card companies because these airlines have fewer passengers and therefore potential card users. As a result, the officials explained the smaller airlines generate much less revenue from such cards.
Introduction of Basic Economy Products
Some stakeholders discussed how network airlines’ introduction of basic economy products changed how they compete with lower-cost airlines and increased competition for customers in the lower-cost space. By 2018, network airlines had launched basic economy—economy tickets offered at a lower price but with fewer included amenities, such as checked baggage, seat selections, or ticket refunds—which DOJ officials stated was in response to competition from lower-cost airlines.[104] One network airline representative and three equity analysts attributed this new offering to changes in consumer preferences following the growth of the low-fare sector. They also mentioned that in the wake of decreased business travel following the pandemic, network airlines reallocated some capacity into leisure markets, which were traditionally held by lower-cost airlines.
Representatives from two network airlines said that basic economy products are popular with consumers and help airlines attract and increasingly compete for the most price-sensitive customers. Furthermore, other stakeholders, including equity analysts and academic researchers, said network airlines’ entry into basic economy fares has increased competition for customers in the lower-cost space. The supply of basic economy seats from the large network airlines now makes up a significant portion of the overall low-cost market, according to two equity analysts and a lower-cost airline. Three equity analysts said there is currently too much capacity in the low-cost sector, and they expect the number of low-cost seats to shrink in the future.
Basic economy products make competing in the low-cost space more challenging for lower-cost airlines, according to some stakeholders, including three lower-cost airline representatives and an equity analyst. Specifically, these products lower the price gap for a price sensitive customer choosing between a flight with a network airline that offers more expansive service or a lower-cost airline that offers more limited service.
Following the introduction of basic economy products by network airlines, two airline representatives and two equity analysts told us lower-cost airlines have begun introducing premium offerings—traditionally outside of the low-cost space—for an extra fee, such as seating with extra legroom, to generate additional revenue. DOT officials and some other stakeholders said these actions are a response to a shift in consumer preferences towards more premium offerings following the COVID-19 pandemic.
Airport Access
Twenty-three stakeholders, including a broad representation of airlines, equity analysts, academic researchers, and consumer groups, told us that airport access—particularly at hub airports—continues to be a significant issue and affects some airlines’ ability to compete. When access is limited, consumers may be affected by fewer airline or scheduling choices. Stakeholders discussed how three access issues (use/lease agreements, gate access, and slot-controlled airports) affect the extent to which airlines can gain access to or maintain their presence at certain airports.[105]
· Provisions in airport use and lease agreements. Stakeholders identified two provisions in airport use and lease agreements that they say can impede an airline’s ability to compete and grow, particularly at the busiest airports.[106]
Fixed fee. Six stakeholders, including airline representatives and equity analysts, pointed to fixed fee provisions in some airports’ use and lease agreements that allocate a proportion of some airport common-use fees (e.g., for baggage claim areas or gates) evenly across all airlines (historically around 20 percent), rather than on the number of passengers carried by each airline. According to these stakeholders, that fee structure disproportionally affects smaller airlines since they pay the same fee amount despite having much fewer passengers than other airlines. Representatives from an industry association told us that some airports have shifted toward fees based more on passengers carried, which would likely lower fees for airlines with a smaller presence at these airports.[107]
Majority-in-interest. In addition, 10 stakeholders (including representatives from the airlines, equity analyst community, academia, and an industry association) said the dominant airline at hub airports—those airlines performing a majority of the operations at that airport—have significant influence over use and lease agreement negotiations and the related majority-in-interest provisions. Majority-in-interest clauses are provisions in an airport’s general use agreement with an airline that typically give the dominant airline power to veto or delay airport expansion when the fees paid by airlines would increase to support the cost of that expansion, according to an industry association.[108] These stakeholders said that these provisions can hinder airport expansion that could help accommodate new competitors. For example, we reported in 2020 that, at one large hub airport with a majority-in-interest provision, some airlines hesitated to support the airport’s efforts to build more common-use gates because it could have increased competition.[109] Representatives from two network airlines said that such provisions give incumbent airlines assurances that airport projects they consider unnecessary will not increase their operating costs and will help protect their own investments in hub airports. For example, one of these representatives noted that the airline had invested billions of dollars to improve airport infrastructure at its core hub airports, including modernizing aging infrastructure and improving the customer experience.
· Gate access. A majority of stakeholders said access to certain gates can be limited in several ways by airlines with existing rights, which may impede new entry or further growth at an airport, particularly at hub airports.[110] An airport industry association stated that airports designate most gates either as preferential use, where the airline that has historically used the gate receives priority, or common use for all airlines.[111]
According to some stakeholders, including representatives from certain lower-cost airlines and the equity analyst community, it can be difficult to acquire gate access at desirable locations or times (for example, during peak hours), in sufficient quantities that are profitable to an airline. For example, one representative for a lower-cost airline told us the only gate available at Los Angeles International Airport was located in a remote terminal that required bussing their customers to the gate. According to this airline representative, the location is less attractive for customers and makes the airline’s operations more onerous.
Seven stakeholders, including two industry associations, representatives from three airlines, and two consumer advocates, also told us that some airlines will “squat” on their preferential gates, for example by using smaller planes or flying less frequent flights. These actions allow the airline to retain the gate by meeting the use requirements in the airline’s airport use-and-lease agreement, according to representatives of an industry association.[112] However, these actions hinder the airport’s ability to offer the gate as common-use to other airlines. Sometimes airlines may sell or lease their preferential use gates to other airlines. For example, in December 2025, Spirit Airlines sold two of its preferential gates at O’Hare International Airport to American Airlines for $15 million each.
With respect to adding new gates, many airports, particularly large hub airports, have limited physical space and large debt balances. Adding new gates may not be possible given space or funding constraints, according to several stakeholders we interviewed. As noted above, incumbent airlines often resist an increase in their operating costs to help fund additional infrastructure unless it directly benefits them, according to representatives of an industry association.[113] Airport gate and runway construction has not kept pace with the increase in air travel demand over the past two decades, according to these representatives and two airlines.
· Slot-controlled airports. Most stakeholders said that access remains particularly difficult at the three busy U.S. airports that are level 3 slot-controlled.[114] Slot controls are limits imposed by FAA through regulations or orders on the number of takeoffs and landings airlines may make per hour. We previously found that slot controls allow airports to manage congestion but can result in the inefficient use of existing airport capacity in a way that benefits incumbent airlines. For example, airlines with slots are only generally required to use a slot 80 percent of the time over a 2-month period.[115]
Global Alliances
Thirteen stakeholders (including an academic researcher, a consumer advocate, representatives from six airlines and an industry association, and four equity analysts) mentioned that global airline alliances, which we identified most recently in 2019 as a competition issue, continue to influence domestic competition.[116] Domestic and international member airlines of such alliances agree to link each member airline’s route networks and coordinate on specified activities, such as marketing and sales; coordination of airport operations (e.g., sharing gates or baggage facilities); and frequent flyer program accrual and redemptions.[117] As of 2026, 59 airlines (including the four U.S. network airlines we identified in this report) are members of three global alliances.[118]
We reported in 2019 that global alliances provide new opportunities for growth in international markets.[119] Several stakeholders we interviewed, including two equity analysts, representatives from three airlines, one industry group, an academic researcher, and a consumer advocate, suggested that these markets tend to be more profitable for airlines than domestic markets. They can also provide competitive advantages for members in the domestic market by generating additional revenue and making their loyalty program more attractive and beneficial to consumers, with more destinations to redeem their rewards. For example, one network airline reported that its membership in a global alliance allows its customers to enjoy the benefits of the airline’s loyalty program while booking flights to destinations around the world that it could not serve on its own.[120]
While the alliances may offer certain efficiencies for their member airlines, they can also limit competition by creating a market where a few airlines dominate on certain routes, according to some stakeholders. A study by the Transportation Research Board reported that U.S. airlines that are less capable of providing international service could become weaker competitors overall, and some stakeholders told us that it is difficult for airlines not in these alliances to compete.[121] For example, one equity analyst said that customers may choose to fly with an airline that is part of an alliance because that airline’s rewards program can be used to reach a greater number of destinations. Additionally, the profit margins of international routes have increased in recent years, according to one equity analyst, which may help improve the overall profitability of airlines participating in these alliances.
Price Transparency
Some stakeholders cited price transparency—including airfare and fee disclosures—as a factor that continues to affect competition, and ultimately consumers. According to DOJ, price transparency can promote competition by ensuring buyers have complete information to compare costs between options, and limited pricing transparency may result in prices higher than those otherwise set through competition, potentially harming consumers.
Six stakeholders—including three consumer advocacy groups and three travel industry associations—said that incomplete information about the total cost of air travel (e.g., ancillary fees and all available fare classes) makes price comparisons difficult. For example, representatives from one consumer group said that consumers typically need to visit multiple websites to accurately compare the total cost of a ticket between airlines. Additionally, these representatives suggested that the expanded use of rewards points, along with their fluctuating value, further obscures price comparisons.
Travel industry associations and consumer advocacy groups also raised concerns that third-party ticket distributors, such as online travel agencies, may not always have complete and up-to-date fare and ancillary fee information. Five stakeholders told us or stated in public comments that airlines increasingly control how fare and fee data are presented, and may employ practices that limit comparison shopping, such as withholding fare and ancillary fee information from third-party distributors.[122] However, several stakeholders said that airlines are incentivized to reach the broadest set of consumers, and their contracts with third-party distributors help airlines ensure their products are accurately marketed.[123] According to some stakeholders, some information gaps may be due to limited capabilities of the old ticket distribution standards and an ongoing industry-wide transition to new ticket distribution standards.[124]
In 2024, DOT issued a rule that required airlines and ticket agents to display charges for certain ancillary services upfront, including for baggage, seat assignments, and any changes to a reservation.[125] However, in February 2026, the rule was vacated by an appeals court due to procedural errors.[126] According to DOT’s regulatory agenda, DOT has planned to propose a new rule that will examine rescinding the ancillary fee disclosure. Nearly all airline representatives we spoke to have said they opposed the 2024 rule, stating that displaying the amount of required information upfront would make the process of purchasing a ticket more confusing. They also explained that displaying the full price upfront would be challenging because ancillary fees differ for different consumers, depending on their needs and willingness to pay for various fees. The representatives also said the costs of complying with the rule would be disproportionately higher for lower-cost airlines. However, several third-party distributors and consumer groups we spoke to said that the 2024 rule would enhance transparency and make price comparison easier for consumers, ultimately improving competition.
Most Stakeholders Described Intense but Uneven Competition, Creating Challenges for Many Lower-cost Airlines
Most selected stakeholders we spoke to described intense competition, and 20 selected stakeholders, as well as DOT officials, pointed to the scale advantages of the four largest domestic airlines as having created an uneven environment that increasingly makes it difficult for other airlines, particularly lower-cost airlines, to effectively compete.[127] Specifically, these scale advantages provide these four largest airlines with operational stability and other benefits relative to their competitors, while also facilitating intense competition against smaller, lower-cost airlines. Also, as discussed above, our data analysis found that, while lower-cost airlines’ market share grew significantly from 2007 through 2022, that growth has stalled in recent years.
According to some stakeholders we interviewed, these scale advantages have played out in many ways but are often grounded in the four largest airlines’ ability to leverage their national networks, which have grown in part through airline consolidation, to achieve operational efficiencies and offer consumers wide-ranging destination and scheduling choices. This can make the largest airlines’ offerings, such as credit card programs or basic economy tickets, more attractive to consumers than similar products offered by smaller airlines, according to some representatives from several airlines and two equity analysts.
Representatives from four airlines, an airline industry association, and an equity analyst suggested that the four largest airlines at times leverage their scale advantages and significant presence at key airports to compete aggressively when other airlines enter a new market. For example, five airline representatives told us that sometimes when they entered a new market, a large airline would leverage their scale to add significant capacity or offer fares at what they believe to be at or below cost to aggressively compete with the new entrant airline. While this may lower prices and benefit consumers in the short run, it can also make operating these routes unsustainable for the new-entrant airlines and cause them to exit the routes in the long run. For example, one airline reported that when they entered a new market, a large network airline responded by increasing its capacity on that route by 178 percent over 2 years, which led the new entrant to exit that route due to poor economic performance.[128]
Multiple stakeholders, including four airline representatives and three equity analysts, told us that the large network airlines’ profitability is being driven by their diversified revenue streams, such as rewards programs, cargo, and premium service. DOT officials described how these airlines’ revenue segmentation strategies allow them to use larger aircraft to offer enough basic economy seats to compete with lower-cost airlines and still cater to premium travelers. Some of these stakeholders, as well as DOT officials, explained that those airlines’ expanded credit card rewards programs provide them a large revenue stream to better weather industry volatility and exercise pricing flexibility. For example, three airline representatives and an equity analyst suggested that such revenue from credit card rewards programs has helped offset the cost of offering basic economy.
Compared to the four largest airlines, smaller, lower-cost airlines have struggled to bounce back from the pandemic, when airlines had negative profit margins. In 2024, the four largest airlines all had positive net profit margins, based on our review of airline financial disclosures. In contrast, the smaller, lower-cost airlines’ profitability, which historically was high, has generally not recovered to pre-pandemic levels.
Furthermore, DOT officials and several airline representatives and equity analysts told us that industry-wide challenges (e.g., rising costs, air traffic control shortages, airspace congestion, and supply chain issues) disproportionately affect lower-cost airlines, which are mostly smaller airlines. For example, lower-cost airlines’ business models rely on lower operating costs to offer lower fares and attract price-sensitive customers. According to DOT officials, since COVID-19, the growth in unit costs has outpaced unit revenue growth for airlines, with the lower-cost sector facing the largest gap in recovering increased costs while facing the largest cost increase. Because lower-cost airlines generally have less ability to absorb rising costs, they may have less ability to maintain low fares, which in turn cuts into their core customer base. Similarly, while network airlines lower their operating costs through hub-and-spoke operating efficiencies, lower-cost airlines’ business models often rely on high utilization of their fleets to help lower their costs. Therefore, issues that affect how many flights an airline can offer, such as air traffic control shortages and airspace congestion, may affect these airlines’ ability to implement their business model more significantly.[129]
Looking ahead, most lower-cost airline representatives and three equity analysts we spoke to raised concerns about the sustainability of the lower-cost airline sector and its ability to exert downward pressure on airfares. For example, one ultra-low-cost airline, Spirit Airlines, filed for bankruptcy twice within one year, and, on May 2, 2026, ceased operations. Some stakeholders suggested that many lower-cost airlines are likely to reduce their market capacity in the future. Additionally, according to four equity analysts and two academic researchers, lower-cost airlines will likely exert less downward pressure on fares than they have historically, as the cost advantage that lower-cost airlines possess over the large network airlines has been diminished by the current competitive landscape.
Some stakeholders, including two airline representatives and two equity analysts, suggested that many lower-cost airlines could improve their position through more flexible business models and revenue streams. For example, representatives from one lower-cost airline suggested that they are more profitable than other small airlines because their dynamic business model incorporates cargo and charter business, which provides steady business during periods of low passenger travel demand. Similarly, several lower-cost airlines have used a strategy of buying older, fully depreciated aircraft with low ownership costs to have greater flexibility in when and where they fly, according to one equity analyst.
However, four equity analysts and three airline representatives suggested that the lower-cost sector is too saturated and will likely see airlines consolidate or exit the market. Some stakeholders said that consolidation would allow struggling lower-cost airlines to acquire the scale necessary to compete with the larger airlines. In 2024, Spirit Airlines attempted to merge with Jet Blue Airways, although this merger was ultimately blocked by DOJ, which cited competition concerns. However, in March 2026, Allegiant Air, a lower-cost airline, proceeded with its acquisition of Sun Country Airlines, another lower-cost airline, without a challenge from DOJ.[130] Some stakeholders, including two consumer advocates, cautioned that a major lower-cost airline exiting the market could result in other airlines increasing their prices. One consumer advocate added that consolidation in the lower-cost sector would likely lead to decreased flight frequency and higher prices for consumers, particularly on routes with significant lower-cost airline competition.
Agency Comments
We provided a copy of this report to DOJ and DOT for review and comment. DOJ and DOT provided technical comments, which we incorporated as appropriate.
We are sending copies of this report to the appropriate congressional committees, the Attorney General, the Secretary of Transportation, and other interested parties. In addition, the report is available at no charge on the GAO website at http://www.gao.gov.
If you or your staff have any questions about this report, please contact Danielle Giese at GieseD@gao.gov or Michael Hoffman at HoffmanME@gao.gov. Contact points for our Offices of Congressional Relations and Media Relations may be found on the last page of this report. GAO staff who made key contributions to this report are listed in appendix III.

Danielle T. Giese
Director, Physical Infrastructure

Michael Hoffman
Chief Economist, Applied Research and Methods
The objectives of this report were to examine (1) findings from empirical studies since 2005 on the effects of U.S. airline mergers on consumers and on airlines’ efficiency; (2) the current state of airline competition (2022 through 2024) in the U.S. compared to 5, 10, and 15 years prior; and (3) stakeholders’ views on the factors affecting the evolution of competition in the U.S. airline industry.
Literature Review
To address all three objectives, we conducted a review of relevant empirical research published from 2005 through March 2025. We chose this time period because, according to the Department of Justice (DOJ), the merger between America West and US Airways started the most recent wave of airline mergers in the U.S., and because of the timing of our analysis.[131] A GAO librarian and a GAO economist conducted searches of various databases (e.g., ProQuest, EBSCO, SCOPUS, DIALOG, and Google Scholar) using keywords such as “airline,” “consolidation,” “merger,” “competition,” “efficiency,” “multimarket contact,” “airfare,” “frequency,” “delay,” “cancel,” “small community,” and “common ownership.” We also identified studies through other sources, such as those cited within the studies we reviewed and those recommended by experts, agencies, and other stakeholders we interviewed. We identified a total of 412 studies from these searches.
To assess the relevance of these studies, two GAO economists independently reviewed each abstract to determine whether the study addressed either (1) the effects of one or more airline mergers within our time frame on consumers (e.g., on fares, the number of and quality of flights, and consumer welfare), small and rural communities, airline efficiencies, or (2) the current state of airline competition. We determined 192 studies to be relevant to our objectives for further review.
Two GAO economists then reviewed the 192 studies to determine whether they met our minimal quality criteria. We excluded those that did not include, to a reasonable extent, the following information: data source, relevant research questions, relevant methodological details, assumptions, limitations, and relevant results. We also excluded studies with extensive spelling or grammar mistakes. We determined 143 studies to be of sufficient quality for us to review in-depth.
When conducting the in-depth review of the remaining studies’ methodologies and findings, two GAO economists compared their individual assessments and discussed and reconciled any differences. We excluded studies that were purely theoretical or based only on simulations as well as those we determined had either significant flaws in their empirical strategy or significant limitations with model specification.[132] We excluded 88 of the 143 studies for these reasons.
We used the remaining 55 studies to provide evidence for our findings. Of these, we identified 40 studies that analyzed merger effects on airline efficiencies or consumers as relevant to the first objective. These studies assessed the effects of one or more of the six domestic airline mergers completed from 2005 through 2016. We used the remaining 15 studies as supporting evidence for the second and third objectives. Of the 40 studies for our first objective, we prioritized 13 that we determined had the strongest causal research designs, such as those that included the most appropriate control group (referred to in this report as “particularly strong studies”).
Several methodological challenges make it difficult to assess the effect of airline mergers on consumers as well as to compare findings across our selected studies. Retrospective studies, such as those we reviewed, typically compare pre-and post-merger prices or quality on “treated” routes, where there was a loss of competition, with pre- and post-merger prices or quality on “control” routes, where there was no loss of competition (i.e., routes where neither or only one of the two merging firms operated).[133] Challenges include defining the pre- and post-merger periods, identifying an appropriate control group, and ensuring the parallel trends assumption used in certain empirical specifications is met. Furthermore, different studies used different pre- and post-merger periods, control groups, and assumptions, which could affect their findings.[134] For example:
· Some studies defined the pre-merger period to include the time period prior to when DOJ closed its investigation into the proposed merger or filed a proposed settlement in court which would resolve the relevant antitrust lawsuit. This definition includes, in the pre-merger period, the time period after merger announcement. However, two studies found that airfares were raised immediately following the announcement of the United Airlines / Continental Airlines’ proposed merger. Therefore, including the time period after the merger announcement and before DOJ closed its investigation into the proposed merger in the pre-merger period might underestimate the fare increase due to the merger.
· One study showed that carefully limiting the control routes to be more like the routes affected by the merger can change the results substantially.[135] It is also important to note that the control routes for one given merger may have been treated routes in the recent past. For example, when United Airlines and Continental Airlines merged in 2010, a natural set of control routes would be ones where neither United Airlines nor Continental Airlines flew on. But if those control routes include ones flown by Delta Air Lines, this could bias the estimates because Delta Air Lines merged with Northwest Airlines just 2 years prior. Consequently, Delta Air Lines’s routes may still be experiencing post-merger effects and therefore be “treated” routes. In the case of United Airlines, this problem can be circumvented by excluding control routes that had Delta Air Lines as an airline. But in the case of assessing the Virgin America and Alaska Airlines merger in 2016, the four largest U.S. airlines had all undergone mergers in the past decade, making it challenging to find clean (i.e., non-treated) control routes.[136]
· To interpret the results of difference-in-difference models as causal requires parallel trends in treatment and control prior to treatment, with the key identifying assumption being that absent the treatment, both the treatment and control group would have followed a similar trend. In the case of airline merger reviews, this would mean seeing airfares or quality metrics in the pretreatment quarters following similar trends for treated and control routes with no statistically significant differences. While a pre-trend analysis is common in most empirical difference-in-difference studies, some of our selected studies did not include statistical tests to ensure the parallel trends assumption was met.
Data Analysis
To compare the current state of U.S. airline competition to 5, 10, and 15 years prior, we analyzed two datasets that we obtained from Cirium, a private data contractor that provides online access to U.S. airline operational and passenger data with a query-based interface: (1) Cirium’s adjusted Department of Transportation (DOT) Origin and Destination Survey (DB1B), which includes fare and itinerary information on every 10th airline ticket (the O&D data), and (2) DOT’s T-100 dataset, which contains information on flight frequency and capacity. To assess the reliability of these data, we reviewed the quality control procedures used by Cirium and DOT. We also conducted electronic data testing for missing data and outliers, and determined the data were sufficiently reliable for our purposes.
· Cirium reports its adjusted DB1B data quarterly and uses an algorithm to project the full universe of the origin and destination data, which improves the coverage of underrepresented segments of the market (e.g., small markets). These steps include scaling passenger count data against DOT’s T-100 datasets, applying the Quality of Service Index (QSI) methodology on Cirium’s schedule data to capture airlines and markets that were otherwise excluded, and conducting fare regressions in rare cases.[137] Cirium also extracts taxes and other fees from the gross fare data to derive net fares and has steps in place to address extreme fare outliers. Zero-dollar fares are replaced by estimates from fare regressions and included in the origin and destination data after adjustment. All nominal fares were converted to 2024 dollars using the consumer price index. For roundtrip itineraries, the fares are divided by two.
· The T-100 dataset is the universe of domestic nonstop segment data reported by both U.S. and foreign airlines to DOT, whose Bureau of Transportation Statistics then reports monthly. T-100 data include airline, origin, destination, available capacity, scheduled departures, departures performed, and load factor when both origin and destination airports are located within the U.S. and its territories.
We excluded tickets with international, Alaskan, or Hawaiian destinations as well as destinations in the U.S. Virgin Islands, U.S. Pacific Trust Territories and Possessions, U.S. Minor Outlying Islands, and Puerto Rico. We eliminated these destinations because cost and competitive conditions involving these destinations are likely to be considerably different than routes within the continental U.S.[138] We also excluded itineraries with more than one connection because domestic flights with two or more stops account for a very small percentage of passengers each year. We excluded flights either operated or marketed by a foreign airline. Regional airline traffic is counted under the network parent or partner airline.
Competition Metrics
The report assesses the current state of competition (i.e., from 2022 through 2024) relative to the competitive landscape in 2017, 2012, and 2007.[139] Analyzing metrics for 2007 and 2012 provides information before and after several large mergers in our review, while 2017 provides a data point prior to the COVID-19 pandemic. We measure competition at the route level as opposed to nationwide because the total number of airlines operating in the U.S. is not informative to overall competition.[140]
For most routes in the country, a city-pair is synonymous with an airport-pair. For a select group of large cities with multiple major airports, however, we created city-pairs following the definitions laid out in an academic study that defines markets for the airline industry because competition extends beyond the airport pair.[141] For example, New York—Washington, D.C. is a city-pair because a traveler may choose from one of the three major airports in New York and one of the three major D.C. area airports.[142]
We analyzed the following metrics to assess the level of competition in the U.S. airline industry: average estimated one-way fares, average estimated yields (airfares per mile), airline market share (by passenger count), the number and type (e.g., network or low-cost airlines) of effective competitors,[143] the Herfindahl-Hirschman Index (HHI),[144] the number of seats available, the total number of flights flown per day, load factor, and the average number of seats per flight.[145] All competitive metrics are measured at the year level. Consistent with our prior work, we defined an effective competitor as an airline with at least 5 percent of total traffic.
To analyze these metrics, we performed several steps to aggregate and filter the data. First, since the ticket data contain one-way-direction ticket information, we combined data on one-way trips traveling in either direction for a given market defined by two cities. For example, we combined the traffic going from Lehigh Valley International Airport (ABE) to Abilene Regional Airport (ABI) with traffic travelling from ABI to ABE to obtain a total passenger count of all traffic between the two airports. Second, we filtered the data to include only those city-pair markets with at least 520 passengers in one direction or 1,040 passengers for round-trip traffic because markets with fewer passengers would be too small to ensure statistical accuracy. Third, we filtered the data to include only those city-pair markets with at least 52 departures in each year we analyzed. This assumes at least one departure per week on average.
Our primary metrics are reported in city-pair quintiles based on passenger traffic (passenger counts).[146] This means that each quintile had roughly 20 percent of the total number of passengers, but the number of city pairs in each quintile varied. These numbers also varied each year. For example, in 2024, we analyzed 11,751 city-pair markets representing about 566 million passengers in the DB1B data (see table 2). Once each route is assigned to a particular quintile, we calculated competition metrics at the quintile level.[147]
|
|
City-pair markets |
Total number of passengers |
|
1st Quintile |
55 |
112,264,317 |
|
2nd Quintile |
128 |
113,866,812 |
|
3rd Quintile |
267 |
113,123,591 |
|
4th Quintile |
775 |
113,300,618 |
|
5th Quintile |
10,526 |
113,232,663 |
Source: GAO analysis of airline industry data. | GAO‑26‑107740
Ancillary Fees
One challenge in comparing airfares over time is the advent of unbundling. The fare data from DOT and Cirium only include the base fare (net of taxes and fees) and not ancillary service fees that passengers may now also pay, such as for checked bags, preferred seats, extra leg room, food and drinks, Wi-Fi, and change/cancellation fees. Such services were mostly included in the base fare of a ticket in 2007 but had been separated out (unbundled) into ancillary fees prior to 2024. This would make the base fare observed in the O&D data artificially lower in 2024 than 2007, even if fares had stayed the same.[148] To make a more accurate comparison, we added the data that DOT collects from airlines on ancillary fees—specifically, baggage fees and reservation cancellation fees—to our base fare calculation. However, we cannot account for other types of ancillary fees, such as seat selection fees, food/drink purchases, or Wi-Fi. We therefore also compared estimated fares between 2017 (when unbundling was generally fully incorporated in fare structures) and 2024 to provide the most equivalent fare comparison.
We accessed revenue information on baggage and reservation cancellation fees through DOT’s Form 41 Financial Data, Schedule P-1.2. To assess the reliability of this data, we reviewed DOT’s quality control procedures, obtained written responses from DOT officials to our data questions, and subsequently determined that the data were sufficiently reliable for our purposes. For each airline, the total dollar amount of ancillary fees is aggregated across all domestic flights in a quarter. We calculated an average one-way ancillary fee per airline per quarter for each passenger to add to the estimated average base fare on a given route. One limitation here is that the actual average ancillary fees collected on each route vary due to different mixes of passengers paying for such fees. While adding an average ancillary fee calculated for an entire airline is imprecise, it is more accurate than excluding them from our calculation altogether.
According to DOT, “domestic operations” defined in the ancillary fee data also include transborder flights between the U.S. and Canada, and flights within and between the Commonwealth of Puerto Rico, the U.S. Virgin Islands, U.S. Pacific Trust Territories and Possessions, and U.S. Minor Outlying Islands. To get a proper denominator in our average ancillary fee calculation on total passenger count, we supplemented our domestic O&D data with international O&D data that include flights between the U.S. and Canada. Interline flights (an itinerary involving multiple airlines on a single ticket) are excluded because, according to DOT, interline passengers only account for a very small percentage of domestic or short-haul O&D passengers, and there is not a straightforward approach to identify the proportion of interline passengers carried by multiple ticketing airlines and their associated ancillary fee revenue.
We are aware of the possibility that average ancillary fees may skew the data if there are any reporting errors in either the Form 41 data or O&D data. As such, we checked the average yearly ancillary fee per passenger that we calculated for each of our selected years for outliers. We found that all airlines reported ancillary fees within a relatively narrow range except for Horizon Air. Due to a data anomaly in the raw data, as shown in table 3, Horizon Air’s average ancillary fee per passenger is calculated to be nearly $400 in 2024 dollars. For sensitivity analysis, we repeated the fare analysis at the city-pair quintile level without Horizon Air in the sample and found nearly identical results.
Table 3: Average One-Way Ancillary Fees per Passenger (Bag Fees and Reservation Cancellation Fees in 2024 U.S. Dollars) per Airline per Selected Year
|
|
2007 |
2012 |
2017 |
2022 |
2023 |
2024 |
|
AirTran Airways |
$2.42 |
– |
– |
– |
– |
– |
|
ATA Airlines |
$6.01 |
– |
– |
– |
– |
– |
|
Alaska Airlines |
$5.79 |
$12.17 |
$3.98 |
$17.08 |
$15.11 |
$8.32 |
|
Allegiant Air |
– |
$20.49 |
$21.71 |
$28.45 |
$27.82 |
$27.76 |
|
American Airlines |
$1.88 |
$17.31 |
$15.28 |
$10.81 |
$9.62 |
$10.22 |
|
Breeze Airways |
– |
– |
– |
$14.24 |
$15.30 |
$11.81 |
|
Continental Airlines |
$1.80 |
– |
– |
– |
– |
– |
|
Delta Air Lines |
$2.43 |
$21.66 |
$18.48 |
$8.74 |
$7.63 |
$7.51 |
|
Frontier Airlines |
$6.46 |
$12.04 |
$32.97 |
$45.89 |
$45.28 |
$38.98 |
|
Hawaiian Airlines |
$7.32 |
$12.12 |
$10.92 |
$10.07 |
$7.40 |
$7.90 |
|
Horizon Air |
$397.38 |
– |
– |
– |
– |
– |
|
JetBlue Airways |
$7.27 |
$10.04 |
$14.67 |
$19.45 |
$17.10 |
$17.46 |
|
Midwest Airlines |
$5.69 |
– |
– |
– |
– |
– |
|
Northwest Airlines |
$14.04 |
– |
– |
– |
– |
– |
|
Southwest Airlines |
$0.36 |
$2.19 |
$0.46 |
$0.57 |
$0.56 |
$0.60 |
|
Spirit Airlines |
– |
$28.29 |
$31.19 |
$32.37 |
$28.69 |
$20.02 |
|
Sun Country Airlines |
– |
$15.53 |
$21.03 |
$30.71 |
$30.79 |
$30.15 |
|
US Airways |
$0.53 |
$18.53 |
– |
– |
– |
– |
|
United Airlines |
$10.12 |
$12.76 |
$12.72 |
$11.29 |
$10.64 |
$10.47 |
|
Virgin America |
$4.75 |
$21.00 |
– |
– |
– |
– |
– = No publicly available data or airlines not established or no longer exist.
Source: GAO analysis of airline industry data. | GAO‑26‑107740
Document Review and Interviews
To address all three objectives, we reviewed relevant federal laws, regulations, and agency documents related to competition and consolidation in the U.S. aviation industry. We also reviewed the more than 100 comments submitted by stakeholders in response to DOJ and DOT’s October 2024 request for information on competition in the airline industry and in other segments of the air transportation industry.[149]
We interviewed DOJ, DOT, and Federal Aviation Administration officials; representatives from five industry associations, two consumer advocacy groups, six academic researchers and consultants; equity analysts from five financial institutions, and one technology firm. We identified and selected these stakeholders based on prior GAO work, a review of relevant academic literature, and the stakeholders’ knowledge in their field. We also interviewed, or received comments from, all 12 major U.S. passenger airlines. We conducted these interviews from October 2024 to January 2026. See table 4 for the airline industry stakeholders we interviewed or received written responses from. Stakeholder views are not generalizable to the views of all industry stakeholders but provide a range of perspectives on competition in the industry.
Table 4: Selected Airline Industry Stakeholders Interviewed by, or Submitted Written Responses to, GAO
|
Type of organization or individual |
Stakeholder |
|
U.S. federal agencies |
Department of Justice |
|
|
Department of Transportation |
|
|
Federal Aviation Administration |
|
Industry associations |
Airlines for America |
|
|
Airports Council International - North America |
|
|
National Air Carrier Association |
|
|
Regional Airline Association |
|
|
Travel Technology Association |
|
U.S. major passenger airlines |
Alaska Airlines / Hawaiian Airlines |
|
|
Allegiant Air |
|
|
American Airlines |
|
|
Avelo Airlines |
|
|
Breeze Airways |
|
|
Delta Air Lines |
|
|
Frontier Airlines |
|
|
JetBlue Airways |
|
|
Southwest Airlines |
|
|
Spirit Airlines |
|
|
Sun Country Airlines |
|
|
United Airlines |
|
Consumer advocates |
American Economic Liberties Project |
|
|
National Consumers League |
|
Technology firm |
Sabre |
|
Academic and policy researchers |
Volodymyr Bilotkach |
|
|
Jan K. Brueckner |
|
|
Federico Ciliberto |
|
|
Diana Moss |
|
|
Dorothy Robyn |
|
|
Megan S. Ryerson |
|
Financial services firms |
Deutsche Bank |
|
|
J.P. Morgan |
|
|
Raymond James |
|
|
TD Cowen |
|
|
Wolfe Research |
Source: GAO. | GAO‑26‑107740
We analyzed airlines’ market shares and average estimated inflation-adjusted domestic fares (average fares) at hub airports with a dominant airline (as defined by at least 60 percent market share of passengers for any year in the scope of our review).
Hartsfield-Jackson Atlanta International Airport
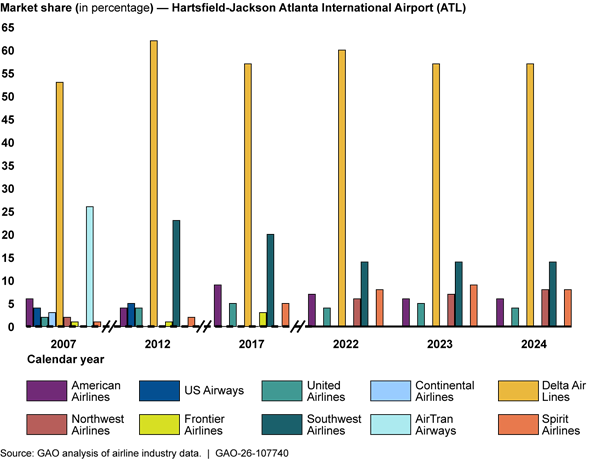
Figure 13: Average Estimated Inflation-Adjusted One-Way Airline Fares by Domestic Airline at ATL, 2017 and 2022–2024
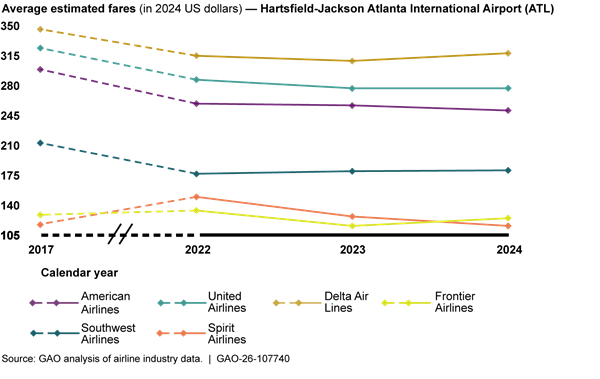
Note: Fares reflect one-way fares in either direction, excluding taxes and fees, and include average baggage fees and reservation change and cancellation fees.
Charlotte Douglas International Airport
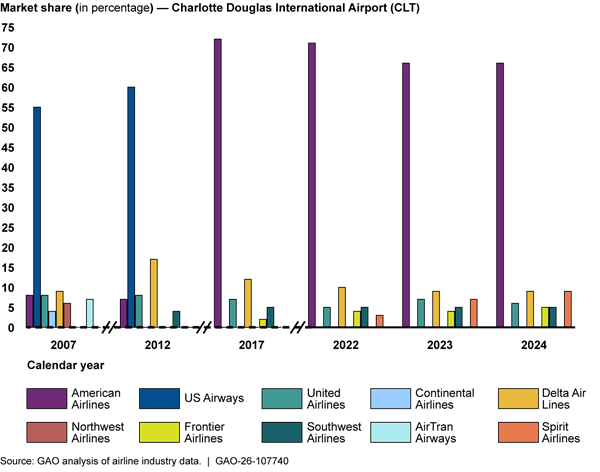
Figure 15: Average Estimated Inflation-Adjusted One-Way Airline Fares by Domestic Airline at CLT, 2017 and 2022–2024
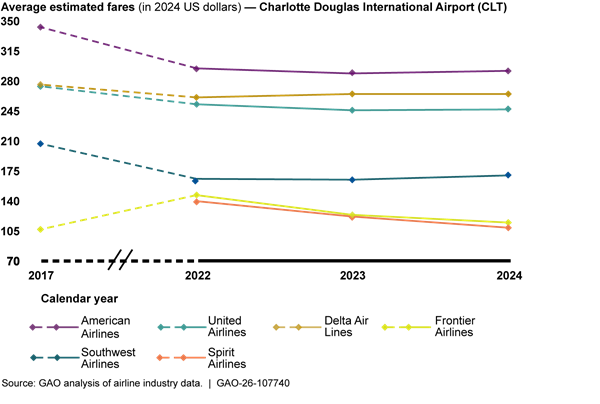
Note: Fares reflect one-way fares in either direction, excluding taxes and fees, and include average baggage fees and reservation change and cancellation fees.
Cincinnati and Northern Kentucky International Airport
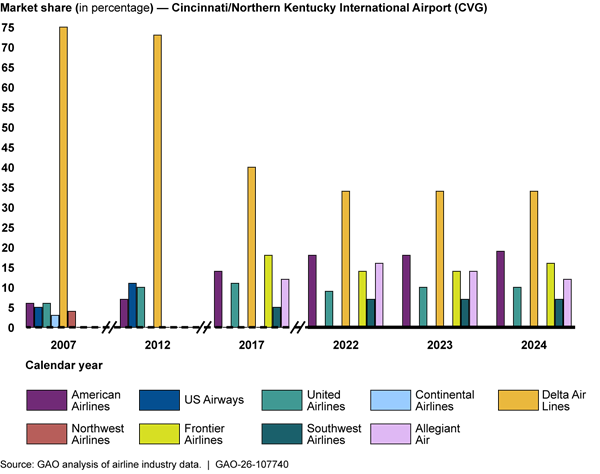
Figure 17: Average Estimated Inflation-Adjusted One-Way Airline Fares by Domestic Airline at CVG, 2017 and 2022–2024
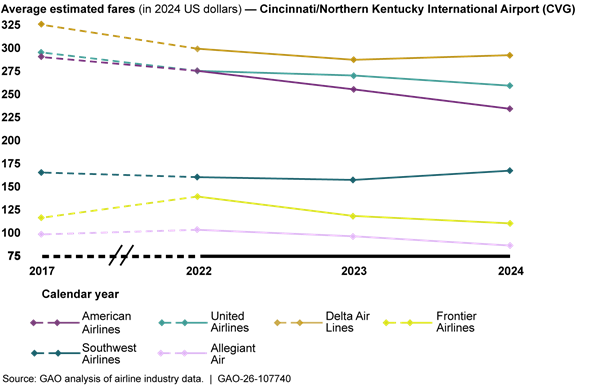
Note: Fares reflect one-way fares in either direction, excluding taxes and fees, and include average baggage fees and reservation change and cancellation fees.
Dallas-Fort Worth International Airport
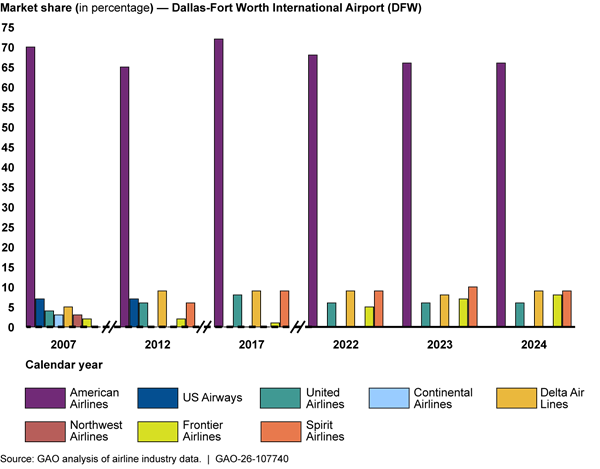
Figure 19: Average Estimated Inflation-Adjusted One-Way Airline Fares by Domestic Airline at DFW, 2017 and 2022–2024
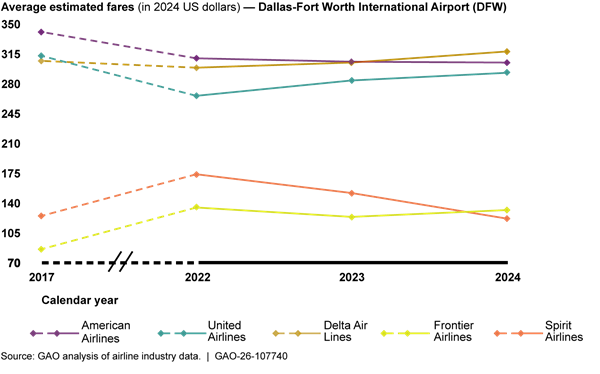
Note: Fares reflect one-way fares in either direction, excluding taxes and fees, and include average baggage fees and reservation change and cancellation fees.
Detroit Metropolitan Wayne County Airport
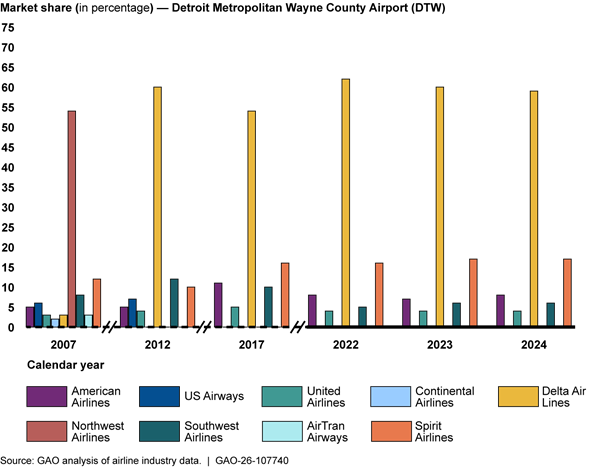
Figure 21: Average Estimated Inflation-Adjusted One-Way Airline Fares by Domestic Airline at DTW, 2017 and 2022–2024
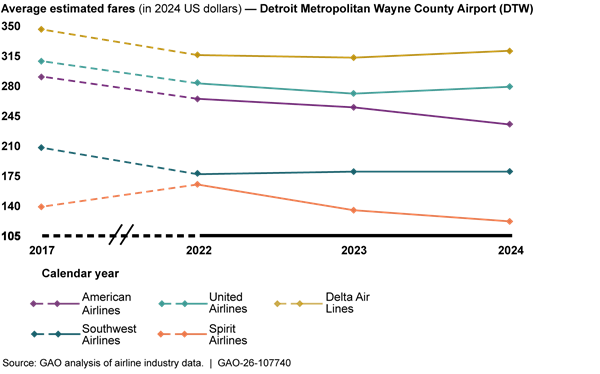
Note: Fares reflect one-way fares in either direction, excluding taxes and fees, and include average baggage fees and reservation change and cancellation fees.
George Bush Intercontinental Airport
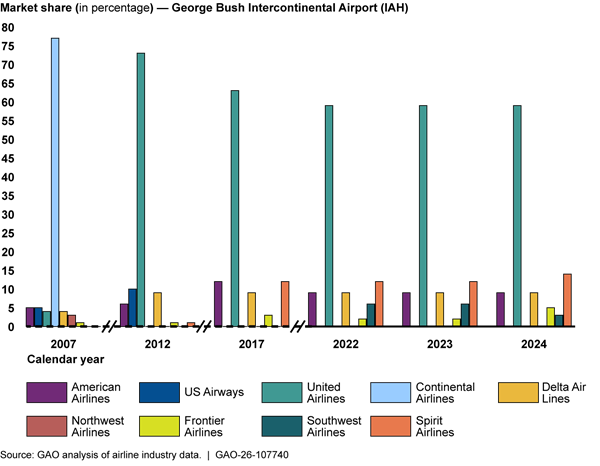
Figure 23: Average Estimated Inflation-Adjusted One-Way Airline Fares by Domestic Airline at IAH, 2017 and 2022–2024
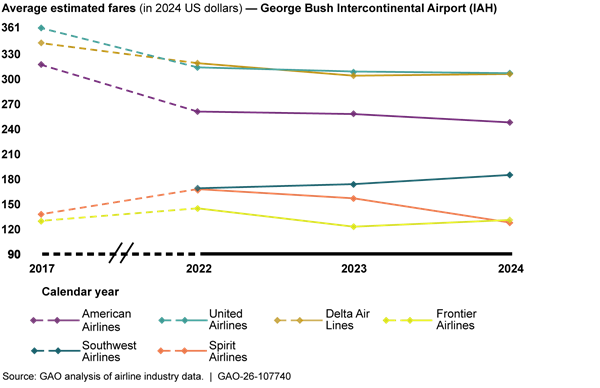
Note: Fares reflect one-way fares in either direction, excluding taxes and fees, and include average baggage fees and reservation change and cancellation fees.
Miami International Airport
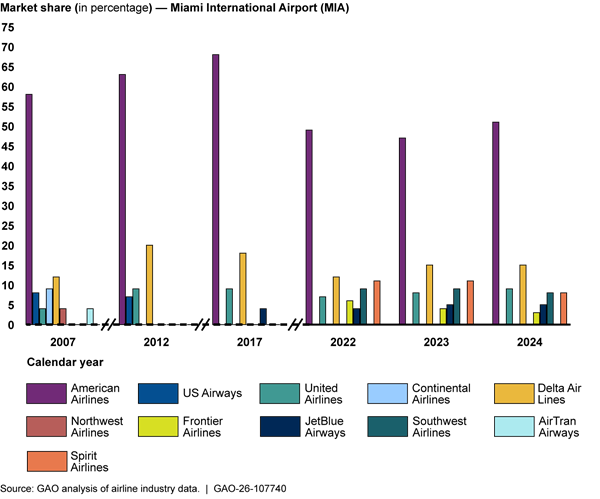
Figure 25: Average Estimated Inflation-Adjusted One-Way Airline Fares by Domestic Airline at MIA, 2017 and 2022–2024
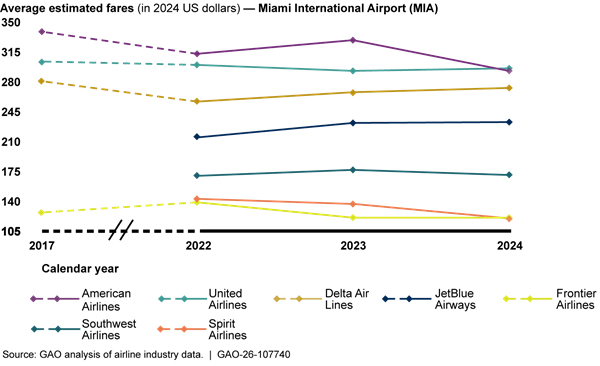
Note: Fares reflect one-way fares in either direction, excluding taxes and fees, and include average baggage fees and reservation change and cancellation fees.
Newark Liberty International Airport
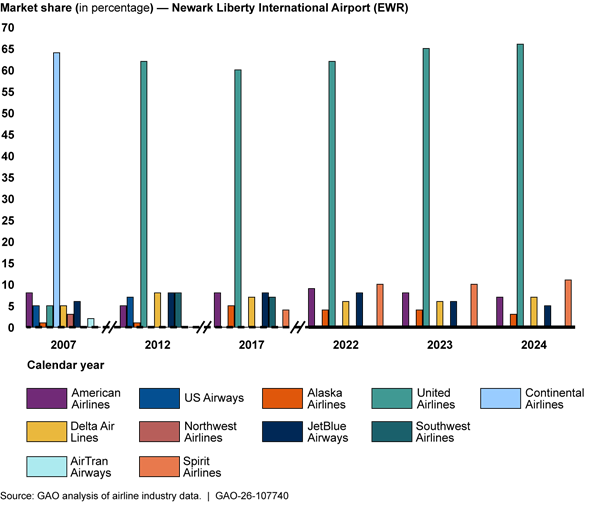
Figure 27: Average Estimated Inflation-Adjusted One-Way Airline Fares by Domestic Airline at EWR, 2017 and 2022–2024
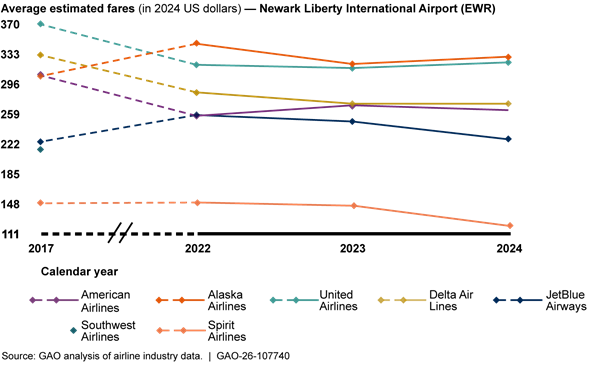
Note: Fares reflect one-way fares in either direction, excluding taxes and fees, and include average baggage fees and reservation change and cancellation fees.
Washington Dulles International Airport
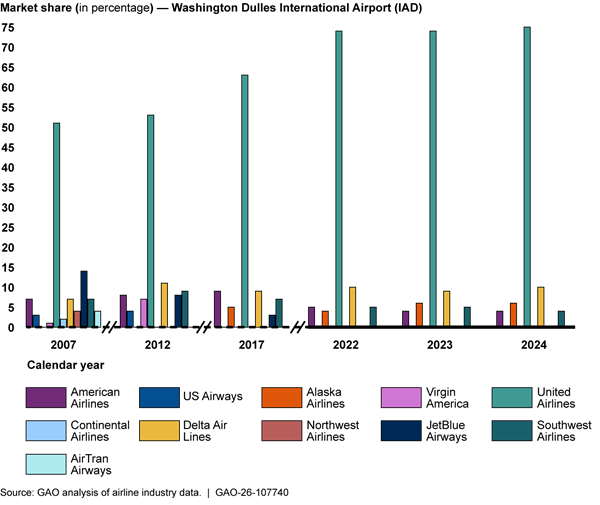
Figure 29: Average Estimated Inflation-Adjusted One-Way Airline Fares by Domestic Airline at IAD, 2017 and 2022–2024
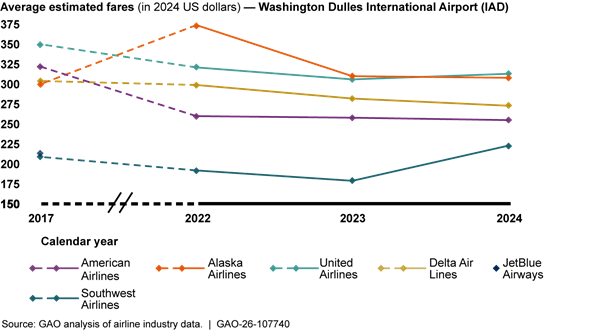
Note: Fares reflect one-way fares in either direction, excluding taxes and fees, and include average baggage fees and reservation change and cancellation fees.
GAO Contacts
Danielle T. Giese, GieseD@gao.gov
Michael Hoffman, HoffmanME@gao.gov
Staff Acknowledgments
In addition to the contacts named above, Jonathan Carver (Assistant Director), Gretchen Snoey (Analyst-In-Charge), Ryan Bhandari, Laura Bonomini, Melanie R. Diemel, David Goldstein, Delwen Jones, Dan Luo, Grant Mallie, Madeleine Orcales, Pamela Snedden, Alicia Wilson, Elizabeth Wood, and Edward Young, made key contributions to this report.
Bet, Germán. “A Retrospective Study of Recent U.S. Airline Mergers: What Can We Learn from Production Data?” Oct. 2021. https://ssrn.com/abstract=3952060
Bilotkach, V. “Multimarket Contact and Intensity of Competition: Evidence from an Airline Merger.” Review of Industrial Organization, vol. 38 (2011): 95–115.
Cao, K. H., B. Krier, C. Liu, B. McNamara, and J. Sharpe. “The Nonlinear Effects of Market Structure on Service Quality: Evidence from the US Airline Industry.” Review of Industrial Organization, vol. 51 (2017): 43–73.
Chen, Y. and P. G. Gayle. “Mergers and product quality: Evidence from the airline industry.” International Journal of Industrial Organization, vol. 62 (2019): 96–135.
Ciliberto, F. and J. W. Williams. “Does multimarket contact facilitate tacit collusion? Inference on conduct parameters in the airline industry.” RAND Journal of Economics, vol. 45, no. 4 (2014): 764–791.
Department of Transportation. Office of Inspector General. Reductions in Competition Increase Airline Flight Delays and Cancellations. CR-2014-040. April 23, 2014.
Fan, H. and M. S. Lewis. “Multimarket contact and price discrimination.” International Journal of Industrial Organization, vol. 97 (2024).
Gil, R. and M. Kim. “Does competition increase quality? Evidence from the US airline industry.” International Journal of Industrial Organization, vol. 77 (2021): 1–32.
González, J., J. Lemus, and G. Marshall. “Mergers and organizational disruption: Evidence from the US airline industry.” Journal of Economics and Management Strategy, vol. 33 (2024): 111–130.
Greenfield, D. “Competition and service quality: New evidence from the airline industry.” Economics of Transportation, vol. 3 (2014): 80–89.
Le, H. B. “An Empirical Analysis of the Price and Output Effects of the Southwest/AirTran Merger.” Competition and Regulation in Network Industries, vol. 17, no. 3–4 (2016): 226–240.
Mehta, A. and N. H. Miller, “Choosing the Appropriate Control Group in Merger Evaluations.” More Pros and Cons of Merger Control. Swedish Competition Authority, 2012.
Shen, Y. “Market competition and market price: Evidence from United/Continental airline merger.” Economics of Transportation, vol. 10 (2017): 1–7.
The Government Accountability Office, the audit, evaluation, and investigative arm of Congress, exists to support Congress in meeting its constitutional responsibilities and to help improve the performance and accountability of the federal government for the American people. GAO examines the use of public funds; evaluates federal programs and policies; and provides analyses, recommendations, and other assistance to help Congress make informed oversight, policy, and funding decisions. GAO’s commitment to good government is reflected in its core values of accountability, integrity, and reliability.
Obtaining Copies of GAO Reports and Testimony
The fastest and easiest way to obtain copies of GAO documents at no cost is through our website. Each weekday afternoon, GAO posts on its website newly released reports, testimony, and correspondence. You can also subscribe to GAO’s email updates to receive notification of newly posted products.
Order by Phone
The price of each GAO publication reflects GAO’s actual cost of production and distribution and depends on the number of pages in the publication and whether the publication is printed in color or black and white. Pricing and ordering information is posted on GAO’s website, https://www.gao.gov/ordering.htm.
Place orders by calling (202) 512-6000, toll free (866) 801-7077,
or
TDD (202) 512-2537.
Orders may be paid for using American Express, Discover Card, MasterCard, Visa, check, or money order. Call for additional information.
Connect with GAO
Connect with GAO on X,
LinkedIn, Instagram, and YouTube.
Subscribe to our Email Updates. Listen to our Podcasts.
Visit GAO on the web at https://www.gao.gov.
To Report Fraud, Waste, and Abuse in Federal Programs
Contact FraudNet:
Website: https://www.gao.gov/about/what-gao-does/fraudnet
Automated answering system: (800) 424-5454
Media Relations
Sarah Kaczmarek, Managing Director, Media@gao.gov
Congressional Relations
David A. Powner, Acting Managing Director, CongRel@gao.gov
General Inquiries
[1]At the time of our review, 2025 data were the most recent full year of data available.
[2]GAO, Airline Competition: The Average Number of Competitors in Markets Serving the Majority of Passengers Has Changed Little in Recent Years, but Stakeholders Voice Concerns about Competition, GAO‑14‑515 (Washington, D.C.: June 11, 2014).
[3]FAA Reauthorization Act of 2024, Pub. L. No. 118-63, § 514, 138 Stat. 1025, 1196 (2024). The act was enacted on May 16, 2024.
[4]We determined these studies to be particularly robust because they adopted a strong causal research design, such as a research design that included the most appropriate control group.
[5]At the time of our analysis, 2024 data were the most recent full year of data available. In addition, amendments to DOT’s regulations changed how the department collects and processes data from airlines as part of the Airline Origin and Destination Survey for transportation taking place on or after July 1, 2025. Illustrative changes include increasing the sample size from 10 percent for all domestic and international city-pair markets to a required sample size of 40 percent, adding new data elements and eliminating others, and increasing the frequency of reporting from quarterly to monthly. “Updates to the Origin—Destination Survey of Airline Passengers,” 88 Fed. Reg. 6145 (Jan. 31, 2023).
[6]Department of Justice & Department of Transportation, Request for Information on Competition in Air Transportation, Docket No. ATR-2024-0001d (Oct. 24, 2024).
[7]Representatives from two of these airlines provided us written responses to our questions instead of an interview.
[8]A few stakeholders as well as DOJ and DOT officials highlighted that some airlines may be categorized differently, dependent on the year or context. For example, DOJ officials said that prior to its merger with Hawaiian Airlines, Alaska Airlines was a hybrid between a network airline and low-cost airline, noting that it operated a hub-and-spoke network at a regional level to keep its costs lower than network airlines, but offered a higher level of service than lower-cost airlines. DOT officials also said that in the context of competition, some airlines, specifically Alaska Airlines, Breeze Airways, and JetBlue Airways, may be considered a “hybrid airline,” in part because the airline may compete for a passenger willing to pay more for higher quality products, but it operates at a smaller scale compared to network airlines. How DOT and DOJ officials categorized each airline in their statements to us did not always align with each other.
[9]Network airlines typically operate a hub-and-spoke route structure, which allows them to link traffic from less traveled spoke airports to their hub airports. For the purposes of this report, of the major airlines operating at the time of our review, we defined Alaska Airlines, American Airlines, Delta Air Lines, and United Airlines as network airlines.
[10]For the purposes of this report, of the major airlines operating at the time of our review, we defined Breeze Airways, JetBlue Airways, and Southwest Airlines as low-cost airlines.
[11]For the purposes of this report, of the major airlines operating at the time of our review, we defined Allegiant Air, Avelo Airlines, Frontier Airlines, Spirit Airlines, and Sun Country Airlines as ultra-low-cost airlines. Spirit Airlines ceased operations on May 2, 2026.
[12]Congress passed three COVID-19 relief laws in 2020 and 2021 that made $132 billion in assistance available for airlines, aviation and other businesses, and airports. Coronavirus Aid, Relief, and Economic Security Act, Pub. L. No. 116-136, §§ 4003(b), 4112(a), tit. IV, XII 134 Stat. 281, 470, 498, 596 (2020); Consolidated Appropriations Act, 2021, Pub. L. No. 116–260, § 402, div. M, tit. IV, 134 Stat. 1182, 1939, 2053 (2020); American Rescue Plan Act of 2021, Pub. L. 117-2, §§ 7102(a), 7202(a), 7301(b), tit. VII, 135 Stat. 4, 96, 103, 104 (2021).
[13]For example, from 2022 through 2024, Spirit Airlines’s and JetBlue Airways’s annual net profit margin ranged from about -8 percent to -25 percent and about -3 percent to -9 percent, respectively. In contrast, Delta Air Lines’s annual net profit margins from 2022 through 2024 ranged from about 3 percent to 8 percent. Net profit margin is calculated by net income (loss) divided by total operating revenue, and it provides a picture of an airline’s economic health. These figures are from the airlines’ annual reports on Form 10-K filed with the Securities and Exchange Commission. According to the commission, the reports provide a comprehensive overview of the company’s business and financial condition and include audited financial statements.
[14]The bureau’s occupational category of “airline pilots, copilots, and flight engineers” consists of workers who pilot and navigate the flight of fixed-wing aircraft, usually on scheduled airline routes, for the transport of passengers and cargo. It includes regional, national, and international airline pilots and flight instructors of airline pilots. The Bureau of Labor Statistics made changes to the Occupational Employment and Wage Statistics estimation methods in May 2021 and May 2022, which will affect the comparability of estimates produced before and after the changes.
[15]See GAO, Aviation Meteorologists: Urgent Actions Needed to Address Staffing Concerns, GAO‑25‑108597 (Washington, D.C.: Aug. 28, 2025); Air Traffic Control: FAA Actions Are Urgently Needed to Modernize Aging Systems, GAO‑24‑107001 (Washington, D.C.: Sept. 23, 2024); and Commercial Aviation Manufacturing: Supply Chain Challenges and Actions to Address Them, GAO‑24‑106493 (Washington, D.C.: Mar. 6, 2024).
[16]The merger of Alaska Airlines and Hawaiian Airlines is not included in the scope of our literature review because it is too recent for any studies to have assessed its effects. Our data analysis, however, does include data after this merger.
[17]This acquisition occurred too recently to be included in the scope of our review.
[18]See, e.g., Delta Air Lines, Inc., Registration Statement (Amendment No. 1 to Form S-4) for Merger with Northwest Airlines Corporation. SEC EDGAR Database. Filed Aug. 6, 2008. https://www.sec.gov/Archives/edgar/data/0000027904/000119312508168222/ds4a.htm.
[19]Although past airline mergers have reduced the total number of domestic airlines, counting the number of airlines nationwide does not provide an accurate depiction of the competition landscape of the U.S. airline industry. Thus, a “city-pair” route is typically viewed as the relevant market for airline travel. These city-pair routes can include both nonstop and connecting flights.
[20]15 U.S.C. § 18.
[21]15 U.S.C. § 4.
[22]The Merger Guidelines were jointly developed by DOJ’s Antitrust Division and the Federal Trade Commission and describe the process the two agencies follow in analyzing proposed mergers. The current version of the guidelines was issued in December 2023. U.S. Department of Justice and the Federal Trade Commission, Merger Guidelines (Dec.18, 2023).
[23]DOJ’s review of proposed mergers considers several factors, including (1) the extent of potential adverse competitive effects of the merger, such as whether the merged entity will be able to charge higher prices or restrict output for the product or service it sells; (2) whether other competitors are likely to enter the affected markets and whether they would counteract any potential anticompetitive effects that the merger might have posed; (3) the verified “merger specific” efficiencies or other competitive benefits that may be generated by the merger and that cannot be obtained through any other means; and (4) whether, absent the merger or acquisition, one of the firms is likely to fail, causing its assets to exit the market.
[24]The Herfindahl-Hirschman Index (HHI) measure of market concentration is calculated by summing the squares of the individual firms’ market shares. Market concentration measures the extent to which a few airlines dominate a route. Mergers increase market concentration when mergers lead to the elimination of competitors on certain routes. Higher market concentration generally suggests lower competition, which may result in higher fares and lower service quality. However, if new firms can readily enter the market and effectively compete, their entry may mitigate the potential anti-competitive effects of high concentration. The intensity of competition in a market is not solely driven by the level of concentration or the ease of entry, however. In some cases, competition can be robust in a highly concentrated market. This could be, for example, because an airline thinks it can drive a rival out of a given route if it lowers fares and increases capacity enough.
[25]DOJ and others have found that when assessing airline mergers, the relevant markets are generally no larger than city-pair routes. Relevant markets may also be defined at the “airport-pair” level.
[26]DOT also has authority under 15 U.S.C. § 21 to bring administrative proceedings against airline mergers that violate the antitrust laws; however, according to DOT, it has not exercised this authority.
[27]U.S. Department of Justice and the Federal Trade Commission, Merger Guidelines.
[28]As part of the merger process, the merging airlines would be expected to apply for DOT approval for any routes to be transferred when consolidating the international routes to be held under one operating certificate post-merger. DOT may approve a transfer of such routes only if it is consistent with the public interest. See 49 U.S.C. § 41105. Airlines must continue to be fit, willing, and able to provide the transportation under 49 U.S.C. § 41110(e). According to DOT, because a merger involves a significant change in the structure of at least one existing airline, DOT also conducts a fitness review to include citizenship, airline management, financials, and compliance disposition. DOT may also review any code-sharing agreements concluded between merging airlines.
[29]49 U.S.C. § 41712.
[30]We selected 40 studies that assessed consumer effects or assessed airline efficiencies from the 143 we identified as relevant. We selected these studies by first reviewing the abstracts to determine if they are within our scope, and by a more in-depth review to assess the data used, relevant methodological details, assumptions, limitations, and results. We determined that 13 of these studies had particularly robust methodologies based on their strong causal research designs. We reported findings for the 13 particularly strong studies and used the remaining selected studies as secondary evidence. Specifically, for the particularly strong studies, we cited either a range of statistically significant point estimates from different regression models or the confidence intervals of the point estimates derived from the preferred regression model, when available (a regression model is a statistical tool that estimates a relationship between an outcome variable and input variables). A bibliography of the 13 particularly strong studies reviewed is included at the end of this report. The findings of the remaining 27 studies are discussed qualitatively. See Appendix I for more details on our methodology.
[31]An additional three studies assessed the effect of divestitures required by DOJ in the United Airlines / Continental Airlines and American Airlines / US Airways mergers. All three of these studies found that the divestitures were effective in promoting entry of low-cost airlines into airports, and two of these studies found that the divestitures reduced fares and mitigated the increase in market power resulted from the mergers. Zhou Zhang, Federico Ciliberto, and Jonathan Williams, “Effects of Mergers and Divestitures on Airline Fares,” Transportation Research Record: Journal of the Transportation Research Board, no. 2603 (2017): 98–104; Christian Bontemps, Kevin Remmy, and Jiangyu Wei, “Ex-post Evaluation of the American Airlines-US Airways Merger, A Structural Approach,” Journal of Transport Economics and Policy, vol. 56, part 2 (2022): 129–155; and Michael T. Clark, “Merger-induced Effects of Airline Route Changes: Consumer Welfare and the Impact of Market Regulation Policy, Chapter 4–Slot Transfers as a Remedy in Airline Mergers: UA-CO Divestitures at Newark,” PhD diss. (Florida State University, 2015).
[32]This is the general approach used in these academic studies because it becomes more challenging to control for other factors that might have affected airfares and service quality in the long run.
[33]Two additional studies examined specific mergers’ unique circumstances, such as the fare impact from elimination of US Airways’s advantage fares and the impact of codeshare restrictions imposed by DOJ following the Alaska Airlines and Virgin America merger. The findings from these two studies were used as contextual information and are, therefore, not discussed in this section. See Soo J. Kim and Yongjoon Park, “Examining the Coordinated Effects of the AA/USAir Merger,” SSRN working paper, 2024; and Hae Y. Park, “Essays on Competition and Antitrust Issues in the Airline Industry, Chapter 2–Effects of Codeshare Exit: Evidence from the Merger of Alaska and Virgin America,” PhD diss. (University of Southern California, 2022).
[34]Some of these studies assessed both the effects on routes when a merger eliminates a direct competitor and effects on routes when a merger eliminates a potential competitor.
[35]As previously discussed, a direct competitor is eliminated on a route when, before the merger, both merging airlines provided service on the same route, and, after the merger, only the merged airline provided service.
[36]As previously discussed, a potential competitor is eliminated when one of the merging airlines had a presence in at least one of the two airports on a route but—unlike the other merging airline—did not provide service on the route itself. Huubinh B. Le, “An Ex Post Analysis of the US Airways/American Airlines Merger,” Review of Economic Analysis, vol. 11 (2019): 383–398; and “An Empirical Analysis of the Price and Output Effects of the Southwest/AirTran Merger,” Competition and Regulation in Network Industries, vol. 17, no. 3–4 (2016): 226–240; Pukar KC, “Higher Together: Price and Welfare Effects of a Merger between two Low Cost Carriers,” PhD diss. (Northeastern University, 2018); and Diana Li, “Three Essays in Applied Microeconomics: Topics in Subsidy Program, Transportation, and Cultural Economics, Chapter 2–The Price Effects of the Alaska Airline and Virgin America Merger,” PhD diss. (Northeastern University, 2024). These four studies compared fares across time frames ranging from 2 quarters to 2 years before the merger to 2 quarters to 4 years following the mergers and examined the Southwest Airlines / AirTran Airways, American Airlines / US Airways, and Alaska Airlines / Virgin America mergers.
[37]Le, “An Empirical Analysis of the Price and Output Effects of the Southwest/AirTran Merger,” 226–240.
[38]Le, “An Empirical Analysis of the Price and Output Effects of the Southwest/AirTran Merger,” 226–240. The fare increase ranges represent the 95 percent confidence interval of the point estimates of 6.6 percent when Southwest Airlines was eliminated as a potential competitor and 3.3 percent when AirTran Airways was eliminated as a potential competitor.
[39]These four studies assessed three of the same mergers as the eight studies discussed above that found increasing fares: Delta Air Lines / Northwest Airlines, US Airways / American Airlines, and United Airlines / Continental Airlines. Dan Luo, “The Price Effects of the Delta/Northwest Airline Merger,” Review of Industrial Organization, vol. 44, No. 1 (2014): 27–48; Le, “An Ex Post Analysis of the US Airways/American Airlines Merger,” 383–398; Dennis Carlton, Mark Israel, Ian MacSwain, and Eugene Orlov, “Are legacy airline mergers pro- or anti-competitive? Evidence from recent U.S. airline mergers,” International Journal of Industrial Organization, vol. 62 (2019): 58–95; and Gaurab Aryal, Anirban Chattopadhyaya, and Federico Ciliberto, “Bridging Quasi-Experimental and Structural Approaches for Robust Evaluation of US Airline Mergers,” Working paper (Feb. 27, 2025), https://ssrn.com/abstract=5159343.
[40]For example, two studies analyzed data from shorter time frames (one quarter) before and after the merger, while two other studies defined the start of the merger as the date DOJ closed its investigation into the proposed merger or filed a proposed settlement in court which would resolve the antitrust lawsuit, as opposed to the date the merger was announced.
[41]A merged airline enters a route following a merger when it begins operating on a route that neither of the merging airlines operated prior to the merger. These studies did not analyze whether the entry by the merged airline was caused by the merger or whether either of the merging airlines would have entered the route absent the merger. See Le, “An Empirical Analysis of the Price and Output Effects of the Southwest Airlines/AirTran Airways Merger,” 226–240; and Luo, “The Price Effects of the Delta Air Lines/Northwest Airline Merger,” 27–48.
[42]Le, “An Empirical Analysis of the Price and Output Effects of the Southwest Airlines/AirTran Airways Merger,” 226–240. The average fare decrease of between 3 percent and 9 percent represents the 95 percent confidence interval of the point estimate of 6.3 percent.
[43]Li, “Three Essays in Applied Microeconomics: Topics in Subsidy Program, Transportation, and Cultural Economics, Chapter 2–The Price Effects of the Alaska Airline and Virgin America Merger.” Some regression models in this study show a statistically significant decrease in fares and others were not statistically significant. These three studies assessed three mergers: Delta Air Lines / Northwest Airlines, Southwest Airlines / AirTran Airways, and Alaska Airlines / Virgin America. They compared fares across time frames ranging from 1 quarter to 2 years before the merger to 1 quarter to 5 quarters following the mergers.
[44]Three additional studies examined specific mergers’ unique circumstances, such as changes in flight frequency due to traffic re-distribution between primary and secondary hubs following the mergers and connectedness of airports. The findings from these three studies were used as contextual information and are, therefore, not discussed in this section. See Volodymyr Bilotkach, Xavier Fageda, and Ricardo Flores-Fillol, “Airline consolidation and the distribution of traffic between primary and secondary Hubs,” Regional Science and Urban Economics, 43 (2013): 951–963; Federico Ciliberto, Emily E. Cook, and Jonathan W. Williams, “Network Structure and Consolidation in the U.S. Airline Industry, 1990–2015,” Review of Industrial Organization, vol. 54 (2019), 3–36; and Megan S. Ryerson and Hyun Kim, “The impact of airline mergers and hub reorganization on aviation fuel consumption,” Journal of Cleaner Production, vol. 85 (2014): 395–407.
[45]Yongmin Chen and Philip G. Gayle, “Mergers and product quality: Evidence from the airline industry,” International Journal of Industrial Organization, vol. 62 (2019): 96–135; Hae Y. Park, “Essays on Competition and Antitrust Issues in the Airline Industry, Chapter 1–Merger Effects of Low-Cost Carriers’ Merger,” PhD diss. (University of Southern California, 2022); and Jeffrey T. Prince and Daniel H. Simon, “The Impact of Mergers on Quality Provision: Evidence from the Airline Industry,” The Journal of Industrial Economics, vol. 65, no. 2 (2017): 0022–1821.
[46]The studies assessed the following four mergers: US Airways / America West Airlines, Delta Air Lines / Northwest Airlines, United Airlines / Continental Airlines, and Southwest Airlines / AirTran Airways.
[47]Chen and Gayle, “Mergers and product quality: Evidence from the airline industry,” 96–135.
[48]Chen and Gayle, “Mergers and product quality: Evidence from the airline industry,” 96–135.
[49]These studies analyzed the time period from 4th quarter 2005 through either 2010 or 2012 and controlled for various factors that could affect delays and cancellation, including weather-related factors.
[50]Daniel Greenfield, “Competition and service quality: New evidence from the airline industry,” Economics of Transportation, vol. 3 (2014): 80–89. The market concentration in this study is measured using the Herfindahl-Hirschman Index (HHI), which is calculated by summing the squares of the individual firms’ market shares. A meaningful increase in market concentration is an increase of HHI by 2,500, which would occur if two equal-sized competitors with market shares of approximately 35 percent merged. The range represents the 95 percent confidence interval of the point estimate of a 3.7 minute increase in the duration of arrival delays and a 3.1 percentage point increase in the probability of flight delays. This study used data from the fourth quarter of 2005 through the third quarter of 2010.
[51]Department of Transportation, Office of Inspector General, Reductions in Competition Increase Airline Flight Delays and Cancellations, CR-2014-040 (Washington, D.C.: Apr. 23, 2014). This study used data from the fourth quarter of 2005 through the fourth quarter of 2012.
[52]Kang Hua Cao, Betty Krier, Chia-Mei Liu, Brian McNamara, and Jerrod Sharpe, “The Nonlinear Effects of Market Structure on Service Quality: Evidence from the US Airline Industry,” Review of Industrial Organization, vol. 51 (2017): 43–73. This study also uses HHI to measure market concentration. Average delay is a little over 5 minutes in the study’s sample. An increase in average delay of 4 minutes implies an approximately 75 percent increase. The average cancellation rate is 1.2 percent in the study’s sample. An increase in cancellation rate by 0.12 percent implies an approximately 10 percent increase.
[53]The study assessed the following mergers: US Airways / America West Airlines, American Airlines / Trans World Airlines, Delta Air Lines / Northwest Airlines, and United Airlines / Continental Airlines merger. The study analyzed all four mergers together in its main analysis, instead of reporting out the results of individual mergers separately. Ricard Gil and Myongjin Kim, “Does competition increase quality? Evidence from the US airline industry,” International Journal of Industrial Organization, vol. 77 (2021): 1–32.
[54]The decrease in the range of the length of arrival delays and departure delays represents the 95 percent confidence intervals of the point estimates of a 20 percent and 7 percent decrease, respectively.
[55]One of the four mergers assessed—the American Airlines / Trans World Airlines merger—is outside of the scope for this review, but we included this study because the other three mergers assessed are within our scope.
[56]This study examined the America West Airlines / US Airways merger. The level of multimarket contact is measured as the count of the number of markets in which the airline competes with nonstop services with the other airlines that it encounters on a given route. Volodymyr Bilotkach, “Multimarket Contact and Intensity of Competition: Evidence from an Airline Merger,” Review of Industrial Organization, vol. 38 (2011): 95–115.
[57]The study examined data from the first quarter of 2010 through the third quarter of 2019—a time frame that encompassed the United Airlines / Continental Airlines, Southwest Airlines / AirTran Airways, American Airlines / US Airways, and Alaska Airlines / Virgin America mergers. Haobin Fan and Matthew S. Lewis, “Multimarket contact and price discrimination,” International Journal of Industrial Organization, vol. 97 (2024): 1–27.
[58]The eighth study assessed the effect of multimarket contact on airlines’ market power, measured as the Lerner index (the percentage of the price that is a markup over marginal cost). Using data from 2002 through 2012, during which several mergers occurred, the study found that airlines with low levels of multimarket contact compete more intensively, and airlines with high levels of multimarket contact sustain higher market power. Jules Yimga, “Multimarket Contact and Market Power Implications in the US Airline Industry,” Networks and Spatial Economics, vol. 23 (2023): 985–1024.
[59]Fan and Lewis, “Multimarket contact and price discrimination.” The least expensive fares are measured as the 10th percentile airfares, and the most expensive fares are measured as the 90th percentile airfares. The ranges represent the 95 percent confidence intervals of the point estimates of a 10 percent and 6 percent increase in the 10th percentile airfares and the 90th percentile airfares, respectively.
[60]This study examined the America West / US Airways merger and analyzed data from February and July of 2 years before the merger (2003 and 2004) and 2 years after the merger (2006 and 2007). Bilotkach, “Multimarket Contact and Intensity of Competition: Evidence from an Airline Merger,” 95–115.
[61]Taesik Kim, “Empirical Essays in Industrial Organization, Chapter 2–Collusive Capacity Reduction Patterns in the US Airline Industry,” PhD diss. (George Washington University, 2022); and Ngoc Ngo, “Competition, Consumer Welfare and Policy Evaluation in Airline and Healthcare Industries, Chapter 2 –Merger, Multimarket Contact, Intensity of Competition and Service Quality: The Case of Delta and Northwest,” PhD diss. (Northeastern University, 2019).
[62]Specifically, the study observed higher fares resulting from increased multimarket contact only in markets without Southwest present and did not observe higher fares in markets served by Southwest. Donggeun Kim, “Firms’ Anti-competitive Effects and Spillovers across Markets, Chapter 1–Tacit Collusion and Price Dispersion in the Presence of Southwest Airlines,” PhD diss. (University of Oklahoma, 2020). Academic literature generally has found that the presence of lower-cost airlines on a route results in lower fares than on routes without the presence of lower-cost airlines (known as the “Southwest effect”). For example, see Jan K. Brueckner, Darin Lee, and Ethan S. Singer, “Airline competition and domestic US Airfares: A comprehensive reappraisal,” Economics of Transportation, vol. 2 (2013): 1–17.
[63]This study analyzed data from 2006 through 2008. Very high multimarket contact refers to markets in which the initial level of multimarket contact index is close to 1.2 on a scale of 0 to 1.2. Federico Ciliberto and Jonathan W. Williams, “Does multimarket contact facilitate tacit collusion? Inference on conduct parameters in the airline industry,” RAND Journal of Economics, vol. 45, no. 4 (2014): 764–791.
[64]We also reviewed stakeholders’ comments submitted to DOJ and DOT’s 2024 request for information on airline competition. Department of Justice & Department of Transportation, Request for Information on Competition in Air Transportation, Docket No. ATR 103 (Oct. 24, 2024).
[65]We have previously reported that scheduled passenger air service to small communities has declined for several decades. See GAO, Commercial Aviation: Certain Nonhub Airports Face Significant Challenges in Securing and Maintaining Air Service, GAO‑26‑107751 (Washington, D.C.: Dec. 17, 2025).
[66]In 2024, we reported that from 2018 to 2023, small communities saw a decrease in flights due to several factors, including pilot and maintenance workforce shortages, increased airline operating costs, and travelers choosing to drive to their destination or use larger airports. See GAO, Commercial Aviation: Trends in Air Service to Small Communities, GAO‑24‑106681 (Washington, D.C.: Sept. 25, 2024).
[67]These studies examined three mergers: Delta Air Lines / Northwest Airlines, United Airlines / Continental Airlines, and American Airlines / US Airways. Ryerson and Kim, “The impact of airline mergers and hub reorganization on aviation fuel consumption,” 395–407; Huubinh B. Le and Jules Yimga, “Market Power and Marginal Cost Effects in Competing Markets: Evidence from Airline Mergers,” Review of Network Economics, vol. 18, no. 2 (2020): 63–108; and Mauricio Varela and Madhu Viswanathan, “Savings that hurt: Production rationalization and its effect on prices,” Journal of Economics and Management Strategy, vol. 29 (2020): 147–172.
[68]This study examined the Delta Air Lines / Northwest Airlines and United Airlines / Continental Airlines mergers. Ryerson and Kim, “The impact of airline mergers and hub reorganization on aviation fuel consumption,” 395–407. The authors acknowledged that the fuel price spike of 2008 may have caused significant reductions in service that cannot be solely attributed to the mergers.
[69]These studies examined four different mergers: US Airways / America West, Delta Air Lines / Northwest Airlines, United Airlines / Continental Airlines, and American Airlines / US Airways mergers. Julia González, Jorge Lemus, and Guillermo Marshall, “Mergers and organizational disruption: Evidence from the US airline industry,” Journal of Economics and Management Strategy, vol. 33 (2024): 111–130; Germán Bet, “A Retrospective Study of Recent U.S. Airline Mergers: What Can We Learn from Production Data?,” SSRN (Oct. 2021), https://ssrn.com/abstract=3952060; and Bontemps, Remmy, and Wei, “Ex-post Evaluation of the American Airlines-US Airways Merger, A Structural Approach,” 129–155.
[70]González, Lemus, and Marshall, “Mergers and organizational disruption: Evidence from the US airline industry,” 111–130. This study examined different mergers: US Airways / America West, Delta Air Lines / Northwest Airlines, and United Airlines / Continental Airlines. It also highlighted some examples of organizations’ disruptions after each merger. For example, the study noted that almost 3 years after the merger between US Airways and America West closed, pilots originally working for US Airways unionized and confronted those who originally worked for America West. The newly formed airline could not settle on contracts for all pilots due to disagreement over the new seniority system.
[71]González, Lemus, and Marshall, “Mergers and organizational disruption: Evidence from the US airline industry,” 111–130.
[72]González, Lemus, and Marshall, “Mergers and organizational disruption: Evidence from the US airline industry,” 111–130.
[73]Bet, “A Retrospective Study of Recent U.S. Airline Mergers: What Can We Learn from Production Data?”. This study analyzed production data from 1990 through 2019. The study examined the Delta Air Lines / Northwest Airlines merger, the United Airlines / Continental Airlines merger, the Southwest Airlines / AirTran Airways merger, and the American Airlines / US Airways merger.
[74]We reviewed airlines’ public documents, including financial reports submitted to the Securities and Exchange Commission, presentations to investors, and press releases.
[75]Because airlines compete on city-pairs—that is, travel between two metropolitan areas—we looked at the state of competition among city-pairs for each of our selected metrics to obtain a more comprehensive picture of industry competition. We identified cities with multiple airports following the academic study of Jan K. Brueckner, Darin Lee, and Ethan Singer, “City-Pairs Versus Airport-Pairs: A Market-Definition Methodology for the Airline Industry,” Review of Industrial Organization, vol. 44 (2014): 1–25.
[76]For example, in 2024, the first quintile includes roughly 113 million passengers (or 20 percent of passenger traffic) spread across 55 of the most heavily traveled routes—such as New York to Los Angeles. In the same year, the fifth quintile spread the roughly 113 million passengers across 10,526 of the least-traveled routes—such as Spokane, WA to Billings, MT or Pittsburgh, PA to Bangor, ME.
[77]Beginning around 2008, airlines began “unbundling” ancillary fees from the base fare, including baggage and other fees. We discuss ancillary fees more below. Airlines may charge passengers ancillary fees for services beyond baggage and reservation change and cancellation fees, but DOT does not require airlines to report revenue generated from all those fees separately. Therefore, we could not include them in our fare estimations. See Appendix I for more information on our methodology for calculating average inflation-adjusted estimated fares.
[79]We previously reported that beginning in 2008, airlines increasingly “unbundled” fares, meaning airlines began to charge fees for a variety of services, such as checked bags and ticket changes, that were previously included in the full fare. GAO, Commercial Aviation: Information on Airline Fees for Optional Services, GAO‑17‑756 (Washington, D.C.: Sept. 20, 2017). Other optional service fees can include for early boarding, seat selection, meals, or other amenities. In addition to these services that were previously included in the base fare, the airline industry has long charged fees for other optional services, such as unaccompanied minors, or changing or canceling a reservation.
[80]Cost per available seat mile is calculated by dividing an airline’s operating expenses by the number of available seat miles (seats available multiplied by the miles flown). Spirit Airlines is the only airline that saw a reduction in cost per available seat mile (a 9 percent decline) among the airlines we selected, when comparing 2024 to 2007.
[81]Airlines included in our analysis are those that publicly reported data on cost per available seat mile in their annual filings of the U.S. Securities and Exchange Committee Form 10-K for each of the years in our review. Selected airlines are: Allegiant Air, American Airlines, Delta Air Lines, JetBlue Airways, Southwest Airlines, Spirit Airlines, and United Airlines.
[82]As mentioned earlier, academic literature generally has found that the presence of lower-cost airlines on a route results in lower fares than on routes without the presence of lower-cost airlines. A recent study found that between 2012 and 2019, network airlines’ fares decreased when facing any one of the three ultra-low-cost airlines. Brad Shrago, “The Spirit Effect: Ultra-Low Cost Carriers and Fare Dispersion in the U.S. Airline Industry,” Review of Industrial Organization, vol. 64 (2024): 549–579. For additional information on the increase in market shares of low-cost airlines and ultra-low-cost airlines in the last three decades, see Darin Lee, Erin Secatore, Ethan Singer, and Eric Amel, “Comments in Response to the Joint Request for Information on Competition in Air Transportation, by the Department of Justice and Transportation,” (2025).
[83]We analyzed airlines’ market shares and average inflation-adjusted estimated domestic fares (average fares) at hub airports with a dominant airline (as defined by at least 60 percent market share of passengers for any year in the scope of our review). We found that ultra-low-cost airlines have a presence, and a relatively small but increasing market share, in all but one of the nine airport hubs we analyzed. Dulles International Airport did not have any ultra-low-cost airlines that had at least 5 percent of market share of passengers for any year in the scope of our review. We also found that, at all nine airports we analyzed, most airlines’ average fares were lower in 2024 as compared to 2017—the year in which unbundling was generally fully incorporated into airlines’ fare structures. See Appendix II for details on airlines’ market share and average fares at selected hub airports.
[85]Up-gauging also may affect infrastructure and operations at airports of all sizes. For example, it may require airfield infrastructure changes (e.g., runway, taxiway, or navigational aids) to better accommodate the change in aircraft using the airport. In some situations, airline up-gauging may also trigger changes in terminal configuration and roadway layout on the landside to accommodate the increase in peak passenger volumes. For additional information, see National Academies of Science, Engineering, and Medicine, How Airports Plan for Changing Aircraft Capacity: The Effects of Upgauging (Washington, D.C.: The National Academies Press, 2019).
[86]The market shares are calculated as the weighted average of market shares for each airline type across city-pairs in the U.S. (weighted by passenger count).
[87]See, for example, Brueckner, Lee, and Singer, “Airline competition and domestic US Airfares: A comprehensive reappraisal,” 1–17.
[88]Another possible explanation for the plateau in lower-cost airlines’ share of the market is a change in the typical consumer’s willingness to pay for network airline tickets coming out of the pandemic, a byproduct of the large increase in savings consumers acquired during the pandemic, according to several stakeholders we spoke with.
[89]The 5 percent market share threshold to assess whether an airline has sufficient presence in a market to affect competition is consistent with our prior work. See, for example, GAO‑14‑515.
[90]HHI is a measure of market concentration and is calculated by summing the squares of the individual airline’s market shares. Higher values of this index on a route mean more market power for one or a select few airlines.
[91]The average number of effective competitors increased from 2.99 to 3.66 in the second quintile and increased from 2.94 to 3.12 in the third quintile, comparing 2007 to 2022.
[92]In the second and third quintiles, 44 percent of routes and 43 percent of routes, respectively, saw the entrance of an ultra-low-cost effective competitor sometime between 2007 and 2022.
[93]HHI decreased by 8 percent for the first quintile, 12 percent for the second quintile, and 4 percent for the third quintile in 2022 compared with 2007. Since 2022, there has been a very slight increase in HHI across all quintiles.
[94]According to the 2023 Merger Guidelines, markets with an HHI greater than 1,800 are “highly concentrated.” U.S. Department of Justice and the Federal Trade Commission, Merger Guidelines (Dec.18, 2023).
[95]Specifically, effective competitors for the fourth quintile increased from 3 to 3.05 average competitors, and the fifth quintile remained constant at 2.88 effective competitors, from 2022 through 2024. HHI increased by 2 percent for the fourth quintile and 1 percent for the fifth quintile from 2022 through 2024.
[96]Network airlines typically operate a hub-and-spoke route structure, which allows them to link traffic from less traveled spokes to their hubs, making otherwise unprofitable service under the point-to-point route structure (typically used by low-cost airlines and ultra-low-cost airlines) profitable.
[97]We also include perspectives from stakeholders provided through written responses to our questions or through comments submitted in response to DOJ and DOT’s October 2024 request for information on competition in the airline industry. See Department of Justice & Department of Transportation, Request for Information on Competition in Air Transportation, Docket No. ATR-2024-0001d (Oct. 24, 2024).
[98]See, for example, GAO, International Air Alliances: Greater Transparency Needed on DOT’s Efforts to Monitor the Effects of Antitrust Immunity, GAO‑19‑237 (Washington, D.C.: Mar. 20, 2019); GAO‑14‑515; and Slot-Controlled Airports: FAA’s Rules Could be Improved to Enhance Competition and Use of Available Capacity, GAO‑12‑902 (Washington, D.C.: Sept. 13, 2012).
[99]Ari Goldfine, “The Financialization of Frequent Flyer Miles: Calling for Consumer Protection,” Vanderbilt Law Review, vol. 77 (2024): 1-233.
[101]These perspectives were included in comments submitted in response to DOJ and DOT’s October 2024 request for information on competition in the U.S. airline industry.
[102]One equity analyst told us that the value of these programs in the U.S. is in part due to what they characterized as high interchange fees—the transaction fee that merchants pay to card-issuing banks when a customer uses an airline-branded credit card to make a purchase. Since these interchange fees make cards valuable for banks, they are willing to pay airlines for their rewards points because the airline partnership makes the cards more attractive for consumers.
[103]Goldfine, “The Financialization of Frequent Flyer Miles,” 1-233.
[104]Airlines refer to these programs by different names. In this report, we refer to them all using the term “basic economy.” In 2025, Southwest Airlines also introduced a basic economy option.
[105]We have previously reported on airport access issues. See, for example, GAO, Airport Infrastructure: Information on Funding and Financing for Planned Projects, GAO‑20‑298 (Washington, D.C.: Feb. 13, 2020); and GAO‑14‑515.
[106]According to stakeholders, airport use and lease agreements detail the terms under which an airline pays for and uses the airport’s facilities and services.
[107]This industry association reported that, based on a 2025 survey of 76 airports, airports now use a variety of approaches for allocating costs of common-use facilities. Fewer than half of these airports reported using fixed fee provisions, where 10 to 20 percent of costs are shared equally by the number of airlines serving the airport.
[108]Representatives from one airport industry association noted that the fees paid by airlines to airports are often too low to finance the infrastructure investments that would attract new entrant airlines. They further explained that funds from other sources, such as passenger facility charges, are insufficient and are often being used to pay off debt on completed projects rather than invest in new projects.
[109]In our 2020 report, we found that while some airports have moved toward shorter-term agreements with greater flexibility to adapt to changing needs, many agreements still included some form of majority-in-interest provisions. See GAO‑20‑298.
[110]Our data analysis found that ultra-low-cost airlines have a presence, and a relatively small but increasing market share, in all but one of the nine hub airports we analyzed that have a dominant airline (as defined by at least 60 percent market share of passengers for any year in the scope of our review). See Appendix II for details on airlines’ market share at our selected hub airports.
[111]According to this representative, airports began in the mid-1990s to shift away from assigning gates exclusively to an airline.
[112]According to representatives of an industry association, airlines may gate “squat” when, under its airline agreement, the airline must operate a minimum number of “turns” (i.e., aircraft movements) to maintain its preferential gate.
[113]Airport infrastructure projects are generally funded through a combination of federal Airport Improvement Program grants, revenue from passenger-facility charges, and airport-generated revenue (e.g., concessions and airline landing fees). See GAO‑20‑298. In our 2020 report, we noted that disagreements between airlines and airports on the justification for an infrastructure project can also affect project funding and timelines.
[114]U.S. level 3 slot-controlled airports are Ronald Reagan Washington National Airport in Washington, D.C., and two major airports in the New York metropolitan area: John F. Kennedy International and LaGuardia.
[115]14 C.F.R. § 93.227. For the purposes of this report, slot control means the operational authority to conduct one instrumental flight rules landing or takeoff operation each day during a specific hour or 30-minute period at one of the three High Density Traffic Airports. 14 C.F.R. § 93.213. See GAO‑12‑902. As of March 2026, there are two open recommendations from this report related to reducing slot utilization inefficiencies.
[116]See GAO‑19‑237.
[117]DOT has exercised its statutory authority to grant certain groups of airlines within these alliances immunity from U.S. antitrust laws affecting international transportation, thereby permitting participants, for example, to coordinate on prices, scheduling, and marketing. This report does not address antitrust immunities. See GAO‑19‑237.
[118]These alliances include Oneworld (15 airlines), SkyTeam (18 airlines), and Star Alliance (26 airlines). Alaska Airlines joined the Oneworld alliance in 2021, after our last review discussing global alliances.
[120]This perspective was included in the airline’s public comments submitted in response to DOJ and DOT’s October 2024 request for information on competition in the U.S. airline industry.
[121]Transportation Research Board National Research Council, Entry and Competition in the U.S. Airline Industry: Issues and Opportunities, Special Report 255 (Washington, D.C.: The National Academies Press, 1999).
[122]Two stakeholders were third-party airline ticket distributors (e.g., online ticket agents) who submitted comments in response to DOJ and DOT’s October 2024 request for information on competition in the U.S. airline industry. Department of Justice & Department of Transportation, Request for Information on Competition in Air Transportation, Docket No. ATR-2024-0001d (Oct. 24, 2024).
[123]According to one third party distributor, more than 40 percent of travelers use third-party websites to compare airlines’ prices and schedules before purchasing. However, this percentage is much lower than in previous decades, in part due to a shift in market power from global distribution systems to airlines, according to this stakeholder.
[124]Several stakeholders told us that airlines and other ticket distribution stakeholders are transitioning to the New Distribution Capability (NDC) from Electronic Data Interchange for Administration, Commerce, and Transport (EDIFACT). The new standards allow airlines to transmit fare choices, such as different types of ancillary fees. This transition is ongoing, as each airline must develop its own capability to use NDC.
[125]Enhancing Transparency of Airline Ancillary Service Fees, 89 Fed. Reg. 34620 (Apr. 30, 2024) (codified at 14 C.F.R. § 399.85).
[126]See Airlines for Amer. et al v Dep’t of Transp., 166 F.4th 487, 488, (5th Cir., 2026).
[127]“The “four largest airlines” refers to three of the four airlines that we identified in this report as network airlines—American Airlines, Delta Air Lines, and United Airlines—and one airline that we identified as low-cost: Southwest Airlines.
[128]This perspective was included in the airline’s public comments submitted in response to DOJ and DOT’s October 2024 request for information on competition in the U.S. airline industry. Department of Justice & Department of Transportation, Request for Information on Competition in Air Transportation, Docket No. ATR-2024-0001d (Oct. 24, 2024).
[129]For example, as previously discussed, the U.S. airline industry is susceptible to external factors, such as fuel costs and changes in domestic and international economic conditions. The recent increase in jet fuel cost due to the conflict in Iran poses challenges for all airlines and makes it harder for some lower-cost airlines to withstand this external shock.
[130]On May 13, 2026, Allegiant Air finalized its acquisition of Sun Country Airlines.
[131]United States et al. v. US Airways Group, Inc. and AMR Corporation; Proposed Final Judgment and Competitive Impact Statement, 78 Fed. Reg. 71378 (Nov. 27, 2013).
[132]Examples of flaws in studies’ empirical strategies included using an insufficient sample size or constructing one dummy variable for two different mergers in a regression model because the mergers were completed in the same quarter. Such treatment is problematic because the two mergers could have fundamentally different effects.
[133]This methodology is called difference-in-difference estimation.
[134]For example, there are several key dates associated with each airline merger: the merger announcement date, merger closing date, and the date the merging airlines received a single operating certificate.
[135]Aditi Mehta and Nathan H. Miller, “Choosing the Appropriate Control Group in Merger Evaluations,” More Pros and Cons of Merger Control, Swedish Competition Authority, 2012.
[136]See additional discussion of this econometrics issue in Brantly Callway and Pedro H.C. Sant’Anna, “Difference in Differences with multiple time periods,” Journal of Econometrics, vol. 225, no. 2 (2021): 200-230.
[137]Throughout the report, we use the terminology “estimated fares” instead of “fares” when referring to fare analyses conducted using Cirium’s data.
[138]Our previous GAO report on airline competition also excluded Alaskan and Hawaiian destinations for the same reason. GAO, Airline Competition: The Average Number of Competitors in Markets Serving the Majority of Passengers Has Changed Little in Recent Years, but Stakeholders Voice Concerns about Competition, GAO‑14‑515 (Washington, D.C.: June 11, 2014).
[139]At the time of our analysis, the data for the full year of 2025 were not available. In addition, amendments to DOT’s regulations changed how the department collects and processes data from airlines as part of the Airline Origin and Destination Survey for transportation, as of July 1, 2025. Illustrative changes include increasing the sample size from 10 percent for all domestic and international city-pair markets to a required sample size of 40 percent, adding new data elements and eliminating others, and increasing the frequency of reporting from quarterly to monthly. “Updates to the Origin—Destination Survey of Airline Passengers,” 88 Fed. Reg. 6145 (Jan. 31, 2023).
[140]In a hypothetical scenario, having 20 airlines each monopolizing all the routes within different regions of the U.S. would be less competitive than having two airlines that compete on every route nationwide.
[141]Jan Brueckner, Darin Lee, and Ethan Singer, “City-Pair Versus Airport-Pairs: A Market Definition Methodology for the Airline Industry,” Review of Industrial Organization, vol. 44 (2014).
[142]The major airports in New York include John F. Kennedy International Airport (JFK), LaGuardia Airport (LGA), and Newark Liberty International Airport (EWR). The major airports in the Washington D.C. area include Ronald Reagan Washington National Airport (DCA), Washington Dulles International Airport (IAD), and Baltimore/Washington International Thurgood Marshall Airport (BWI).
[143]For the purposes of our report, the type of competitor refers to either a network airline (United Airlines, Alaska Airlines, American Airlines, Delta Air Lines, Hawaiian Airlines, Continental Airlines, US Airways, and Northwest Airlines), a low-cost airline (JetBlue, Southwest Airlines, AirTran Airways, America West Airlines, ATA Airlines, Breeze Airways, Midwest Airlines, and Virgin America), an ultra-low-cost airline (Spirit Airlines, Frontier Airlines, Allegiant Air, Sun Country Airlines, and Avelo Airlines), or “other” airline (mostly independent regional airlines operating flights to and from small markets). Dependent on the year or context, some domestic airlines may be categorized differently.
[144]HHI is a measure of the level of concentration in a market and provides an indication of changes in the level of competition. HHI is calculated by squaring the market share of each airline competing in the market and then summing the results. For example, a market consisting of four firms—two of which have market shares of 30 percent and two of which have market shares of 20 percent—has an HHI of 2,600 (302+ 302 + 202 + 202 = 2,600).
[145]Yields capture changes more accurately than airfares, as it does not treat all routes of different lengths on a one-to-one basis; rather, yield accounts for the cost of each additional mile, where cost declines as the route length increases. Yield is calculated as airfare per mile multiplied by the square route of length of haul divided by 1,000.
[146]Given that there are thousands of city-pairs, it would not be feasible to report the competition metrics for each pair.
[147]The market shares are calculated as the weighted average of market shares for each airline type across city-pairs in the U.S. (weighted by passenger count).
[148]Comparing 2024 fares to 2017 fares is less problematic because much unbundling had already happened by then. As we reported in 2017, all airlines were charging for bag fees and changes/cancellations by 2017. GAO, Commercial Aviation – Information on Airline Fees for Optional Services, GAO‑17‑756 (Washington, D.C.: Sept. 20, 2017).
[149]Department of Justice & Department of Transportation, Request for Information on Competition in Air Transportation, Docket No. ATR-2024-0001d (Oct. 24, 2024).