PRIVATE DENTAL AND VISION INSURANCE
Market Concentration Varied Among States
Report to Congressional Requesters
United States Government Accountability Office
A report to congressional requesters
For more information, contact: John Dicken at dickenj@gao.gov
What GAO Found
The concentration of private, stand-alone dental and vision insurance markets varied among states across both the group and individual insurance markets, according to 2024 enrollment data from the National Association of Insurance Commissioners (NAIC), the most recent available at the time of our analysis. The concentration of a market refers to the degree to which a small number of companies control a large part of the market. Across all states, the combined market share of the three largest insurers in each state ranged from about 38 to about 98 percent of enrollment for the dental group market, and from about 41 percent to about 96 percent for the vision group market (see table).
|
|
Range of market share of three largest insurers (percentage) |
Median market share of three largest insurers (percentage) |
Range of market share of single largest insurer (percentage) |
Median market share of single largest insurer (percentage) |
Median number of insurers per state |
|
Dental group market |
37.9 – 97.5 |
66.8 |
13.6 – 95.1 |
38.0 |
39 |
|
Vision group market |
41.2 – 95.5 |
77.4 |
15.8 – 81.9 |
40.9 |
28 |
Source: GAO analysis of data from the National Association of Insurance Commissioners (NAIC). | GAO-26-107787
Note: Market share for each state is based on the total number of individuals insured as of December 31, 2024, as reported by insurers to NAIC. Data from Massachusetts are excluded from the dental insurance market analysis.
Vertical integration exists when a company buys into new lines of business in its supply chain that would otherwise be owned by other companies. GAO did not find aggregate data on the extent of vertical integration in the dental or vision insurance markets. Interviewees from the dental industry that GAO spoke with said vertical integration in the dental insurance market is limited, with one interviewee noting that vertical integration in the dental industry is only a recent development. Some interviewees from the vision industry commented that vertical integration exists in the vision insurance market, including insurer ownership of provider offices, lens and frame manufacturers, and eyewear retail brands.
Limited information was available to assess the effects of concentration and vertical integration in private dental and vision insurance markets. GAO found two peer-reviewed studies that discussed the effects of concentration of dental insurance markets, including reduced reimbursements for dental services paid by insurers to providers in more concentrated markets. Some of the interviewees from the dental and vision industries that GAO spoke with shared nongeneralizable observations about the effects of concentration and vertical integration based on their experiences, including limiting providers’ ability to negotiate contracts and reimbursement with insurers in concentrated markets. Some dental industry interviewees noted a lack of opportunity to evaluate the effects of vertical integration due to limited instances of vertical integration among dental insurers.
Why GAO Did This Study
The market for private health insurance in the United States is highly concentrated, which may reduce competition. Concentrated markets may also exist within private dental and vision insurance, which may be sold separately from health insurance. About one in four Americans had such stand-alone dental or vision insurance in 2024, according to data from NAIC and the Census Bureau. In addition, vertical integration may exist within these markets. Studies suggest vertical integration may result in efficiencies and cost savings but may also reduce competition in a market.
GAO was asked to review concentration of and vertical integration in dental and vision insurance markets. This report describes (1) the concentration of and vertical integration in private dental and vision insurance markets; and (2) what is known about the effects of concentration and vertical integration on competition in private dental and vision insurance markets.
GAO analyzed 2024 enrollment data from NAIC on fully insured, stand-alone dental and vision plans to determine insurer market share by state. GAO also conducted a literature review to examine peer-reviewed studies published in the last 10 years. In addition, GAO interviewed a non-generalizable sample of seven stakeholder groups representing dental and vision insurers, dental and vision care providers, and purchasers of dental and vision care plans. GAO also interviewed a dental industry subject matter expert who recently published a peer-reviewed study on market concentration.
For our report findings based on NAIC data, we provided a draft of these findings to NAIC for third-party review. NAIC had no comments.
|
Abbreviations |
|
|
|
NAIC |
National Association of Insurance Commissioners |
|
|
HHI |
Herfindahl-Hirschman Index |
|
This is a work of the U.S. government and is not subject to copyright protection in the United States. The published product may be reproduced and distributed in its entirety without further permission from GAO. However, because this work may contain copyrighted images or other material, permission from the copyright holder may be necessary if you wish to reproduce this material separately.
March 9, 2026
The Honorable Brett Guthrie
Chairman
Committee on Energy and Commerce
House of Representatives
The Honorable H. Morgan Griffith
Chairman
Subcommittee on Health
Committee on Energy and Commerce
House of Representatives
The Honorable Earl L. “Buddy” Carter
House of Representatives
Private health insurance, such as that provided through an employer, is the most common source of health insurance coverage in the United States. Historically, the market for private health insurance in the United States has been highly concentrated, meaning a small number of insurers enroll most of the people in a given market.[1] Concentrated markets may also exist within private dental or vision insurance, which may be sold to consumers separately from health insurance. Markets can become more concentrated through insurance company consolidation, such as through mergers and acquisitions, or when companies exit the market leaving fewer remaining players. Studies have suggested that highly concentrated health insurance markets may indicate less competition and could thus affect consumers’ choices of insurers as well as the premiums they pay.[2]
As with market concentration, vertical integration may exist within private dental and vision insurance. Vertical integration occurs when a company buys into new lines of business in its supply chain that would otherwise be owned by other companies. Some insurers in the dental and vision industries have vertically integrated by, for example, buying into provider practices, laboratories, manufacturing, and other related businesses. Studies within the health care industry have suggested that, while vertical integration may result in efficiencies and cost savings, it may also reduce competition.[3]
There are questions about the extent of concentration and vertical integration in dental and vision insurance markets and any effects on consumers and providers. You asked us to examine concentration of and vertical integration in these markets. In this report, we describe:
1. the concentration of and vertical integration in private dental and vision insurance markets; and
2. what is known about the effects of concentration and vertical integration on competition in private dental and vision insurance markets.
To describe the concentration of and vertical integration in private dental and vision insurance markets, we analyzed 2024 state-level enrollment data from dental and vision insurers as collected by the National Association of Insurance Commissioners (NAIC). These data capture the total number of individuals insured as of December 31, 2024, by private insurers offering fully insured, stand-alone dental and vision plans purchased separately from health insurance.[4] These data were the most recent available at the time of our analysis.
For each state’s market, we counted insurers as participating in a market if they had enrollment in that market.[5] We did not count insurers that offered coverage in a market but did not have any enrollment. Because there can be multiple insurers within a market that share a single parent company, we aggregated such insurers to the parent-company level. If there was no parent company, we analyzed the data by the individual insurers.[6] We did this to more fully account for the portion of the market held by each parent company. We calculated state-level market share for insurers in each of the 50 states and the District of Columbia by calculating the ratio of enrollment for each insurer in a state to the total enrollment in that state.[7] We calculated market share separately for dental and vision insurance, as well as for group and individual insurance.[8] We also calculated a three-firm concentration ratio for dental and vision insurers each state, defined as the combined market shares of enrollment for the three largest insurers in each state.
We analyzed enrollment data from NAIC as they were reported by insurers to NAIC. We did not independently verify the accuracy or completeness of the information with the insurers. We assessed the reliability of the data in several ways, including reviewing related publications from NAIC and a state insurance agency as well as performing electronic tests of the data to identify any outliers or anomalies. We determined that the data as obtained from NAIC were sufficiently reliable for the purposes of reporting on the concentration of private dental and vision insurance markets.
In addition, for both objectives, we conducted a literature review for studies examining these topics. To identify relevant, peer-reviewed studies, we searched various databases, such as CINAHL with Full Text, LexisNexis, PubMed, ProQuest Research Library, and Scopus. We performed these searches to identify articles published from 2015 through January 2025.
Finally, for both objectives, we obtained stakeholder perspectives. We interviewed a non-generalizable sample of seven stakeholder groups representing dental and vision insurers, dental and vision care providers, and purchasers of dental and vision care plans. We selected these stakeholders by identifying groups that had large national memberships and groups that had conducted research or otherwise published on issues related to dental or vision insurance markets. These included the American Dental Association, the American Optometric Association, the National Association of Dental Plans, the National Association of Vision Care Plans, the Association of Dental Support Organizations, the Professional Eye Care Associates of America, and the ERISA Industry Committee.[9] We also interviewed a dental industry subject matter expert who published a peer-reviewed 2024 study on market concentration.
We conducted this performance audit from August 2024 through March 2026 in accordance with generally accepted government auditing standards. Those standards require that we plan and perform the audit to obtain sufficient, appropriate evidence to provide a reasonable basis for our findings and conclusions based on our audit objectives. We believe that the evidence obtained provides a reasonable basis for our findings and conclusions based on our audit objectives.
Background
Market Concentration and Vertical Integration
Dental and vision insurance markets may be concentrated or vertically integrated.
Market concentration. This refers to the degree to which a small number of companies control a large part of a market.[10] Increased market concentration can occur through consolidation, such as through mergers and acquisitions, companies exiting the market and leaving fewer remaining players, or when larger companies gain market share from smaller companies.
Vertical integration. This occurs when a company takes control of multiple stages of its supply chain, either by merging with or acquiring companies involved in different stages or by developing those stages internally. In the dental and vision insurance markets, vertical integration can be the extent to which companies that provide insurance also own provider practices or other entities providing dental or vision services and products, such as administrative services, laboratories, or supplies.
Dental and Vision Benefits
Certain dental and vision benefits may be covered as part of a health insurance plan while additional dental or vision benefits may be covered through a stand-alone dental or vision plan purchased separately from health insurance. For example, health plans may cover treatment for a dental surgery or vision injury or disease as well as exams and other services. Dental plans typically cover preventive care, including cleanings, as well as procedures like crowns and root canals. Vision plans typically cover routine eye exams and glasses or contacts. Consumers may also forego insurance altogether and pay out of pocket for dental and vision services, which is referred to as self-pay.[11]
Consumers choosing to purchase dental or vision plans can either purchase coverage as part of a group plan or consumers can purchase an individual plan.
Group plans. A group dental or vision plan provides private coverage to a group of individuals, typically employees of a company, or members of an organization, such as a union. Premium costs may be shared between plan members and the company or organization sponsoring the plan. Based on NAIC enrollment data, most consumers purchasing dental or vision plans do so through group plans. Group plans can either be fully insured or self-insured. In fully insured group plans, the plan sponsor—typically an employer—purchases coverage from an insurer. In self-insured plans, the plan sponsor sets aside funds to pay for employee health care. Large employers typically offer self-funded plans.
Individual plans. Consumers may also purchase dental or vision plans individually. This includes plans sold through health insurance exchanges.
According to published data from NAIC, about 75 million adults and children had dental coverage through fully insured, stand-alone group plans and about 12 million had dental coverage through stand-alone individual plans in 2024.[12] During the same time period, about 83 million adults and children had vision coverage through fully insured, stand-alone group plans, and about 3 million had vision coverage through stand-alone individual plans, according to NAIC data. Overall, the number of adults and children in the United States with either a fully insured, stand-alone dental or vision plan represented just over a quarter of the U.S. population of about 340 million in 2024.[13]
Plan Design and Provider Network Structure
Dental and vision insurance plans often differ from health insurance plans in how they offer benefits and set up their provider networks. Dental and vision plans typically set annual limits on the amount of coverage they will provide, called an annual maximum. Vision plans may set annual maximum levels for specific items, such as glasses frames. After reaching the annual maximum, a consumer is responsible for 100 percent of additional expenses for that year. Additionally, while consumers receive discounts when using an in-network dental or vision provider, they may have flexibility if they choose to see a provider that is out of network.[14]
In addition to dental and vision insurance, consumers may choose other products, such as discount plans to reduce dental and vision expenses. These discount plans provide reduced prices on dental or vision procedures at specific providers. While these plans are not insurance, consumers may use them in lieu of an insurance plan. Discount plans may be offered by insurers alongside insurance plans, or they may be offered by another organization. For example, dental service organizations, which specialize in providing centralized administrative support to independent dental providers, often offer discount plans covering providers within their networks.
Concentration of Private Dental and Vision Insurance Markets Varies by State and Vertical Integration Is Limited in Dental Markets
Private Dental Insurance Markets
Concentration. According to our analysis of 2024 data from NAIC, the concentration of private group and individual stand-alone dental insurance markets varied among states. Across all states, the combined market share of the three largest dental insurers in each state ranged from about 38 to about 98 percent of enrollment for the group market and about 38 to about 98 percent for the individual market. Market share of the single largest dental insurer in each state ranged from about 14 to about 95 percent for the group market and about 14 to about 95 percent for the individual market. See table 1.
Table 1: 2024 Market Share for the Three Largest and Single Largest Stand-Alone Dental Insurers and the Median Number of Stand-Alone Dental Insurers
|
|
Range of market share of three largest insurers (percentage) |
Median market share of three largest insurers (percentage) |
Range of market share of single largest insurer (percentage) |
Median market share of single largest insurer (percentage) |
Median number of insurers per state |
|
Group market |
37.9 – 97.5 |
66.8 |
13.6 – 95.1 |
38.0 |
39 |
|
Individual market |
37.5 – 97.5 |
69.5 |
14.4 – 95.1 |
34.5 |
22 |
Source: GAO analysis of data from the National Association of Insurance Commissioners (NAIC). | GAO‑26‑107787
Note: Consumers can either purchase dental or vision coverage as part of a group plan, such as one offered through an employer, or individually, such as through a health insurance exchange. These exchanges, required to be established in each state by the Patient Protection and Affordable Care Act and operated by either the state or federal government, are marketplaces where eligible individuals and small employers can choose insurance plans offered by participating insurers. We calculated market share for each state based on the total number of individuals insured as of December 31, 2024, as reported by insurers to NAIC. Because there can be multiple insurers within a market that share a single parent company, we aggregated such insurers to the parent-company level following the aggregation scheme set forth by NAIC. We excluded all data from Massachusetts from our dental insurance market analysis due to a potential reporting error that we identified in one dental insurer’s enrollment data. We also excluded insurers that reported zero in enrollment in a state market. NAIC data do not include about five million enrollees in private, stand-alone dental plans in California from insurers that are regulated by the California Department of Managed Health Care.
For the dental group market, 11 states each had a combined market share of the three largest insurers of 80 percent or above. Delaware and Hawaii each had the highest combined market share at 97 percent. Twenty-two states each had a combined market share of 60 percent or above but below 80 percent. Louisiana had the lowest combined market share at 38 percent. See figure 1.
Figure 1: Combined Market Share by State for the Three Largest Stand-Alone Dental Insurers in the Group Insurance Market (2024)
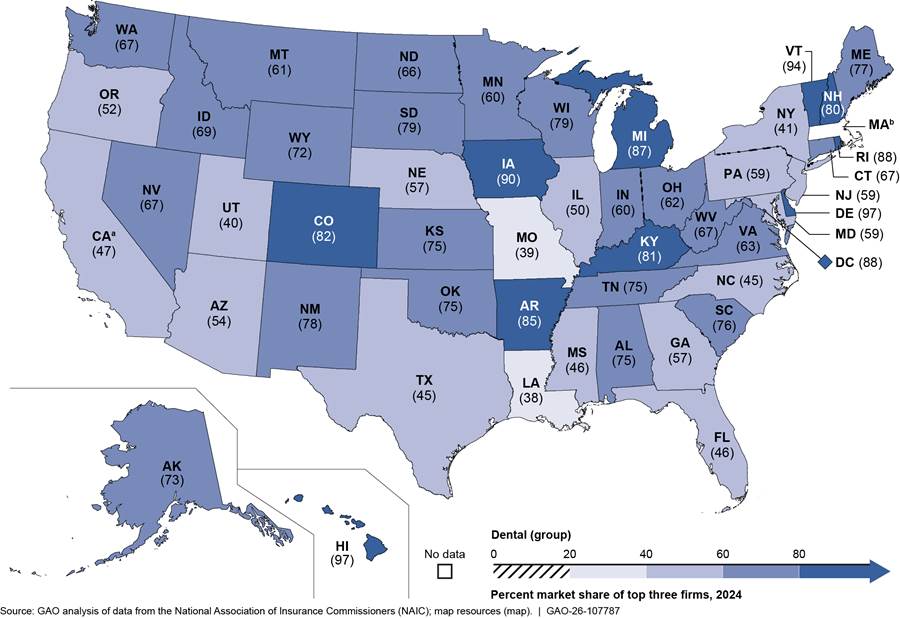
Note: Consumers can either purchase dental or vision coverage as part of a group plan, such as one offered through an employer, or individually, such as through a health insurance exchange. These exchanges, required to be established in each state by the Patient Protection and Affordable Care Act and operated by either the state or federal government, are marketplaces where eligible individuals and small employers can choose insurance plans offered by participating insurers. We calculated market share for each state based on the total number of individuals insured as of December 31, 2024, as reported by insurers to NAIC. Because there can be multiple insurers within a market that share a single parent company, we aggregated such insurers to the parent-company level following the aggregation scheme set forth by NAIC.
aNAIC data do not include about five million enrollees in private, stand-alone dental plans in California from insurers that are regulated by the California Department of Managed Health Care.
bWe excluded all data from Massachusetts from our dental insurance market analysis due to a potential reporting error that we identified in one dental insurer’s enrollment data.
For the dental individual market, 14 states each had a combined market share of the three largest insurers of 80 percent or above. Rhode Island and Delaware each had the highest combined market share at about 97 percent. Twenty-one states each had a combined market share of 60 percent or above but below 80 percent. South Carolina had the lowest combined market share at 37 percent. See figure 2.
Figure 2: Combined Market Share by State for the Three Largest Stand-Alone Dental Insurers in the Individual Insurance Market (2024)
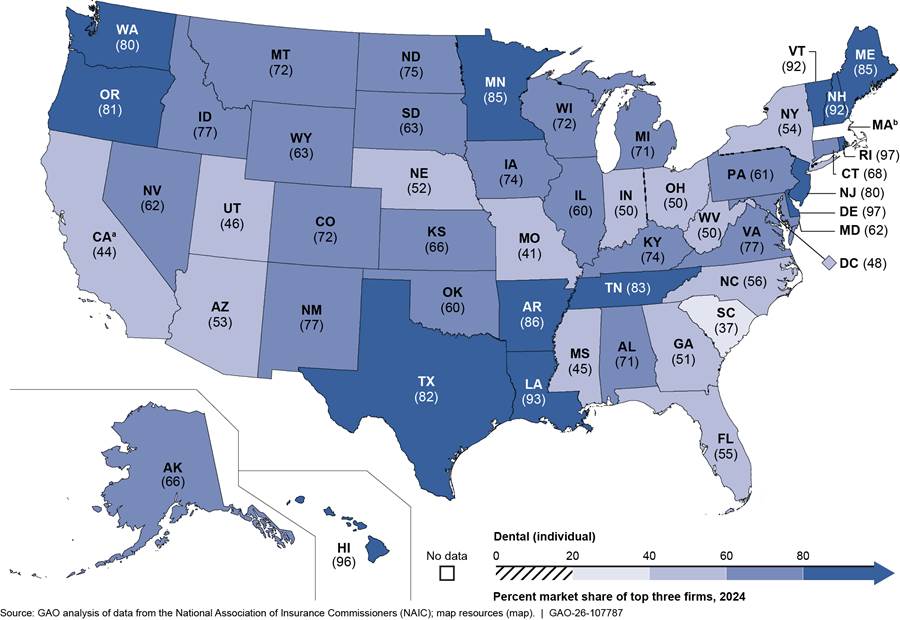
Note: Consumers can either purchase dental or vision coverage as part of a group plan, such as one offered through an employer, or individually, such as through a health insurance exchange. These exchanges, required to be established in each state by the Patient Protection and Affordable Care Act and operated by either the state or federal government, are marketplaces where eligible individuals and small employers can choose insurance plans offered by participating insurers. We calculated market share for each state based on the total number of individuals insured as of December 31, 2024, as reported by insurers to NAIC. Because there can be multiple insurers within a market that share a single parent company, we aggregated such insurers to the parent-company level following the aggregation scheme set forth by NAIC.
aNAIC data do not include about five million enrollees in private, stand-alone dental plans in California from insurers that are regulated by the California Department of Managed Health Care.
bWe excluded all data from Massachusetts from our dental insurance market analysis due to a potential reporting error that we identified in one dental insurer’s enrollment data.
Appendix I provides information on market share for the single largest stand-alone dental insurer in each state as well as the total number of dental insurers in each state in 2024.
Our review of the literature over the last decade identified two peer-reviewed studies that examined concentration of dental insurance markets. These studies found that concentration of dental insurance markets varied across states, as follows.
· One study using data from 2013 through 2015 found significant variation in dental insurance market concentration across states. This study also found that, when dental insurance markets were defined by zip code, about 22 percent of dentists worked in markets that the study identified as highly concentrated, and most dentists (about 75 percent) worked in moderately concentrated dental insurance markets.[15]
· A second study examining dental plans available through health insurance exchanges from 2016 through 2023 found that the number of insurers offering adult stand-alone dental plans varied widely across states, with two states (South Dakota and Vermont) having only one insurer offering plans; in contrast, one state (Texas) had 13 insurers offering plans.[16] At the county level, the study found that 43 percent of counties had six to 10 insurers offering adult stand-alone dental plans, and 7 percent of counties had only one insurer.
Stakeholders from the dental industry and a subject matter expert we interviewed commented on dental insurance market concentration at the state or national levels. These perspectives aligned with some of our findings on concentration. At the state level, one of the four industry stakeholders commented that the concentration of dental markets varied across states. However, the stakeholder added that data and research on dental insurer concentration by state were limited.
Another dental industry stakeholder commented that most states had more than 20 dental insurers and that the number of insurers in states had not changed over time.[17] However, this stakeholder also said that, in some states, a particular insurer may be dominant due to historical reasons such as a longstanding association between an insurer and employers or providers in a market.
At the national level, those we interviewed had varying perspectives on changes in market concentration over time. One of the four dental industry stakeholders we interviewed told us their association members reported that the dental insurance market had become increasingly concentrated over the last 10 years, although the dental insurance market overall was not as concentrated as the broader health insurance market. This stakeholder also said that there had been very little change over time in the set of top companies that make up largest dental insurers. In contrast, two industry stakeholders as well as the subject matter expert we interviewed described concentration in the dental insurance market as relatively stable. For example, the subject matter expert said that the concentration of the dental insurance market has generally been stable with some minor changes, such as insurers leaving the market. One stakeholder said that there have not been major mergers in the dental insurance market as had occurred in the health insurance market, but there have been some acquisitions of smaller dental insurers by larger ones.
Vertical integration. We did not find aggregate data on the extent of vertical integration in the dental insurance market. Further, we did not find any peer-reviewed studies that examined vertical integration of the dental insurance market. Stakeholders from the dental industry and the subject matter expert we interviewed told us that vertical integration in the dental insurance market is limited. One of the four dental industry stakeholders we interviewed said that the largest insurers in dental markets are generally not acquiring providers or otherwise vertically integrating. Another of the four stakeholders said any vertical integration in the dental industry is only a recent development. The subject matter expert we interviewed commented that there are a few examples of vertical integration in the dental insurance industry, but that it was not common. One example we identified through company website information and media reports was that an insurer with a large presence in one state announced in July 2025 that it had acquired a dental practice with about 30 offices.
Private Vision Insurance Markets
Concentration. According to our analysis of 2024 data from NAIC, the concentration of private group and individual stand-alone vision insurance markets varied among states. Across all states, the combined market share of the three largest vision insurers in each state ranged from about 41 to about 96 percent of enrollment for the group market and about 56 to about 99 percent for the individual market. Market share of the single largest vision insurer in each state ranged from about 16 to about 82 percent for the group market and 22 to about 73 percent for the individual market. See table 2.
Table 2: 2024 Market Share for the Three Largest and Single Largest Stand-Alone Vision Insurers and the Median Number of Stand-Alone Vision Insurers
|
|
Range of market share of three largest insurers (percentage) |
Median market share of three largest insurers (percentage) |
Range of market share of single largest insurer (percentage) |
Median market share of single largest insurer (percentage) |
Median number of insurers per state |
|
|
Group market |
41.2 – 95.5 |
77.4 |
15.8 – 81.9 |
40.9 |
28 |
|
|
Individual market |
55.6 – 98.8 |
78.2 |
22.0 – 73.3 |
36.8 |
11 |
|
Source: GAO analysis of data from the National Association of Insurance Commissioners (NAIC). | GAO‑26‑107787
Note: Consumers can either purchase dental or vision coverage as part of a group plan, such as one offered through an employer, or individually, such as through a health insurance exchange. These exchanges, required to be established in each state by the Patient Protection and Affordable Care Act and operated by either the state or federal government, are marketplaces where eligible individuals and small employers can choose insurance plans offered by participating insurers. We calculated market share for each state based on the total number of individuals insured as of December 31, 2024, as reported by insurers to NAIC. Because there can be multiple insurers within a market that share a single parent company, we aggregated such insurers to the parent-company level following the aggregation scheme set forth by NAIC. We excluded insurers that reported zero in enrollment in a state market. NAIC data do not include about eight million enrollees in private, stand-alone vision plans in California from insurers that are regulated by the California Department of Managed Health Care.
For the vision group market, 19 states each had a combined market share of the three largest insurers of 80 percent or above. The District of Columbia had the highest combined market share at 95 percent. Twenty-eight states each had a combined market share of 60 percent or above but below 80 percent. Louisiana had the lowest combined market share at 41 percent. See figure 3.
Figure 3: Combined Market Share by State for the Three Largest Stand-Alone Vision Insurers in the Group Insurance Market (2024)
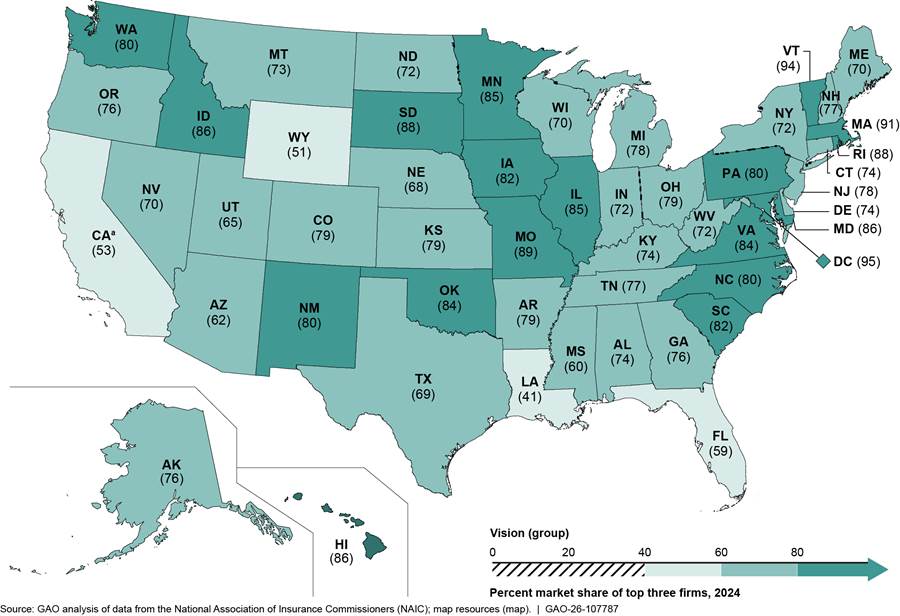
Note: Consumers can either purchase dental or vision coverage as part of a group plan, such as one offered through an employer, or individually, such as through a health insurance exchange. These exchanges, required to be established in each state by the Patient Protection and Affordable Care Act and operated by either the state or federal government, are marketplaces where eligible individuals and small employers can choose insurance plans offered by participating insurers. We calculated market share for each state based on the total number of individuals insured as of December 31, 2024, as reported by insurers to NAIC. Because there can be multiple insurers within a market that share a single parent company, we aggregated such insurers to the parent-company level following the aggregation scheme set forth by NAIC.
aNAIC data do not include about eight million enrollees in private, stand-alone vision plans in California from insurers that are regulated by the California Department of Managed Health Care.
For the vision individual market, 21 states each had a combined market share of the three largest insurers of 80 percent or above. Hawaii had the highest combined market share at 99 percent. Twenty-five states each had a combined market share of above 60 percent or above but below 80 percent. Four states each had the lowest combined market share at 56 percent—Illinois, Indiana, Tennessee, and Wisconsin. See figure 4.
Figure 4: Combined Market Share by State for the Three Largest Stand-Alone Vision Insurers in the Individual Insurance Market (2024)
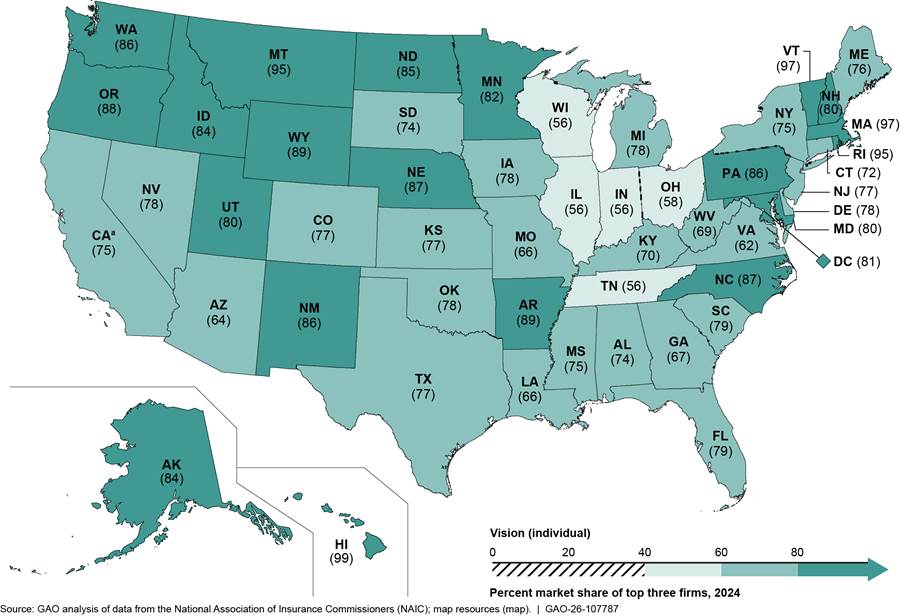
Note: Consumers can either purchase dental or vision coverage as part of a group plan, such as one offered through an employer, or individually, such as through a health insurance exchange. These exchanges, required to be established in each state by the Patient Protection and Affordable Care Act and operated by either the state or federal government, are marketplaces where eligible individuals and small employers can choose insurance plans offered by participating insurers. We calculated market share for each state based on the total number of individuals insured as of December 31, 2024, as reported by insurers to NAIC. Because there can be multiple insurers within a market that share a single parent company, we aggregated such insurers to the parent-company level following the aggregation scheme set forth by NAIC.
aNAIC data do not include about eight million enrollees in private, stand-alone vision plans in California from insurers that are regulated by the California Department of Managed Health Care.
Appendix II provides information on market share for the single largest stand-alone vision insurer in each state as well as the total number of vision insurers in each state in 2024.
We did not find any peer-reviewed studies of concentration of vision insurance markets published in the last decade. One vision industry stakeholder we interviewed told us that, based on an internal study they conducted and a broader definition of the vision insurance market, no vision insurer held a market share at the national level greater than about 30 percent in 2023. This was also the case when the analysis was done within the nine United States census regions, according to the stakeholder.[18]
Vertical integration. We did not find aggregate data on the extent of vertical integration in the vision insurance market. Further, we did not find any peer-reviewed studies that examined vertical integration of the vision insurance market. Two of four vision industry stakeholders we interviewed shared observations on vertical integration in the vision insurance market. One stakeholder said two major players in the vision industry own and operate vision insurance plans, as well as provider offices, lens and frame manufacturers, and eyewear retail brands. This stakeholder said these companies acquire active providers across the country and have a presence in most state vision insurance markets. We subsequently analyzed 2024 NAIC data to obtain more information on these two companies. According to our analysis, one of these two companies had fully insured, stand-alone vision plan enrollees in 47 states. The company’s median market share across these states was 33.6 percent for the group market and 22.2 percent for the individual market. In addition to providing vision insurance, this company also owns vision care providers, retail locations, eyewear retail brands, and an electronic health records company, among other ventures.
The other stakeholder said that vertical integration within the vision industry has existed for at least the last 20 years. This stakeholder said that the vision industry has seen companies expand into operations at multiple stages of the vision industry’s supply chain. This stakeholder said that, despite vertical integration within the industry, most vision providers are not under common ownership with insurers.
Limited Information Is Available to Assess the Effects of Concentration and Vertical Integration on Competition in Private Dental and Vision Insurance Markets
Effects of concentration. Limited information is available to assess any effects of concentration on competition in private dental and vision insurance markets. We did not find any studies over the last decade of the effects of concentration in vision insurance markets and found only two peer-reviewed studies that discussed the effects of concentration of dental insurance markets. These studies found that increased insurer concentration can affect reimbursements for dental services paid by insurers to providers as well as dental practice size and ownership, as follows.
· One study we identified using data from 2015 through 2017 found that, as insurer concentration increased at the county level, reimbursements for dental services paid by insurers to providers generally declined. The study also found that, when dental insurance markets went from moderately concentrated to highly concentrated, the average reimbursement across all dental procedures declined.[19] The authors noted that dental provider markets were substantially less concentrated than insurance markets, and this may have limited the ability of dentists to negotiate for higher reimbursements.
· The second study, which reviewed data from 2013 through 2015, found that more concentrated dental insurance markets were modestly associated with larger dental practices and lower rates of dentist ownership of practices.[20] The authors noted that the effect of changing dental practice structures on patients, including types and prices of services provided, is largely unknown and merits further study.
Some of the dental and vision industry stakeholders as well as the subject matter expert we interviewed shared limited observations about the effects of concentration based on their experiences, including effects on providers’ ability to negotiate contracts and reimbursement with insurers. However, these observations are not generalizable to all dental and vision insurance markets. The subject matter expert we interviewed, as well as two of four stakeholders from the dental industry, commented that an insurer’s dominance within a market can limit a provider’s ability to negotiate for better contract terms with that insurer. Specifically, the subject matter expert said that, due to this, high insurer concentration can mean lower reimbursement for providers. This expert also said that when providers are unable to negotiate beneficial reimbursement rates with insurers, those providers may raise prices for patients paying out of pocket, including for the uninsured. Another dental industry stakeholder said it was understandable that providers would like to see higher reimbursement; but that some consumers—specifically, small employers—purchasing dental insurance can be very price-sensitive, and increased costs for dental insurance can greatly affect demand. Therefore, insurers have to contain costs, which can mean that reimbursement does not increase as quickly as providers would like.
One of four vision industry stakeholders we interviewed provided observations on the effects of concentration. Specifically, this stakeholder noted that providers in one market faced loss of their contracts with a dominant insurer if the providers did not accept new terms implementing significant cuts to reimbursements. These contracts supported the providers’ entire patient base, the stakeholder said.
Effects of vertical integration. Limited information is available to assess any effects of vertical integration on competition in private dental and vision insurance markets. Our review of the literature over the last decade did not find any peer-reviewed studies on vertical integration in either the dental or vision insurance markets. In addition, two of four dental industry stakeholders as well as the subject matter expert we interviewed commented on a lack of opportunity to evaluate the effects of vertical integration due to limited instances of vertical integration among dental insurers. Specifically, they said that, because vertical integration within the dental insurance industry is a recent development and not a common occurrence, it was difficult to identify effects from vertical integration.
Two of four vision industry stakeholders we interviewed provided limited comments related to the effects of vertical integration in the vision insurance industry based on their experiences. One stakeholder said, based on an internal study they had conducted, that vertical integration within any industry may be beneficial for consumers under the right market conditions.[21] The other stakeholder said that vertically integrated vision insurers use contracts with providers to encourage use of insurer-owned labs. The stakeholder also said that providers acquired by insurers feel pressure to focus on selling frames and lenses rather than providing comprehensive care.
Third-Party Views
For our report findings based on NAIC data, we provided a draft of these findings to NAIC for review. NAIC had no comments.
We are sending copies of this report to the appropriate congressional committees and other interested parties. In addition, the report is available at no charge on the GAO website at https://www.gao.gov.
If you or your staff have any questions about this report, please contact me at DickenJ@gao.gov. Contact points for our Offices of Congressional Relations and Media Relations may be found on the last page of this report. GAO staff who made key contributions to this report are listed in appendix III.

John E. Dicken
Director, Health Care
Appendix I: Market Share for the Single Largest Stand-Alone Insurer and Number of Insurers by State in the Group and Individual Dental Insurance Markets (2024)
Table 3: Market Share for the Single Largest Stand-Alone Insurer and Number of Insurers by State in the Group Dental Insurance Market (2024)
|
State |
Insurer |
Market share (percentage) |
Number of insurers in state |
|
Alabama |
BCBS of AL GRP |
50.2 |
39 |
|
Alaska |
PREMERA BLUE CROSS GRP |
42.5 |
30 |
|
Arizona |
Delta Dental Plan of AZ Corp |
23.7 |
44 |
|
Arkansas |
Renaissance Hlth Srv Corp Grp |
56.5 |
38 |
|
California |
METROPOLITAN GRP |
19.1 |
41 |
|
Colorado |
HIGHMARK GRP |
59.8 |
37 |
|
Connecticut |
CIGNA HLTH GRP |
36.1 |
33 |
|
Delaware |
Dentegra Grp |
95.1 |
31 |
|
District of Columbia |
HIGHMARK GRP |
66.8 |
32 |
|
Florida |
GUARDIAN LIFE GRP |
16.3 |
41 |
|
Georgia |
CIGNA HLTH GRP |
21.1 |
41 |
|
Hawaii |
Life & Specialty Ventures LLC Grp |
70.8 |
24 |
|
Idaho |
Delta Dental Plan of ID |
38.4 |
44 |
|
Illinois |
HCSC GRP |
19.6 |
42 |
|
Indiana |
Renaissance Hlth Srv Corp Grp |
40.4 |
45 |
|
Iowa |
Delta Dental of IA Grp |
74.6 |
37 |
|
Kansas |
Delta Dental of KS Grp |
44.1 |
42 |
|
Kentucky |
Renaissance Hlth Srv Corp Grp |
52.1 |
41 |
|
Louisiana |
LOUISIANA HLTH SERV GRP |
13.7 |
38 |
|
Maine |
Northeast Delta Dental Grp |
60.0 |
28 |
|
Maryland |
METROPOLITAN GRP |
28.9 |
35 |
|
Michigan |
Renaissance Hlth Srv Corp Grp |
59.3 |
47 |
|
Minnesota |
Stratacor Grp |
29.1 |
36 |
|
Mississippi |
GUARDIAN LIFE GRP |
18.7 |
41 |
|
Missouri |
METROPOLITAN GRP |
15.7 |
46 |
|
Montana |
HCSC GRP |
26.6 |
32 |
|
Nebraska |
BCBS of NE Grp |
28.3 |
40 |
|
Nevada |
Liberty Dental Plan Grp |
49.4 |
42 |
|
New Hampshire |
Northeast Delta Dental Grp |
53.3 |
25 |
|
New Jersey |
Delta Dental Plan of NJ Grp |
26.1 |
41 |
|
New Mexico |
Renaissance Hlth Srv Corp Grp |
47.8 |
32 |
|
New York |
Dentegra Grp |
13.6 |
35 |
|
North Carolina |
Renaissance Hlth Srv Corp Grp |
17.5 |
42 |
|
North Dakota |
BCBS of ND |
30.1 |
30 |
|
Ohio |
Renaissance Hlth Srv Corp Grp |
38.1 |
47 |
|
Oklahoma |
Delta Dental of OK |
35.0 |
41 |
|
Oregon |
Oregon Dental Serv Grp |
21.8 |
39 |
|
Pennsylvania |
Dentegra Grp |
23.6 |
44 |
|
Rhode Island |
Delta Dental of RI Grp |
47.5 |
21 |
|
South Carolina |
BCBS of SC Grp |
53.9 |
43 |
|
South Dakota |
Delta Dental of SD Grp |
58.9 |
35 |
|
Tennessee |
Renaissance Hlth Srv Corp Grp |
38.0 |
41 |
|
Texas |
CIGNA HLTH GRP |
16.1 |
47 |
|
Utah |
EDUCATORS MUT GRP |
14.2 |
40 |
|
Vermont |
Northeast Delta Dental Grp |
80.1 |
22 |
|
Virginia |
Corvesta Grp |
30.6 |
41 |
|
Washington |
Delta Dental of WA |
51.0 |
37 |
|
West Virginia |
Sun Life Financial Grp |
35.6 |
34 |
|
Wisconsin |
Delta Dental of WI Grp |
64.5 |
37 |
|
Wyoming |
Delta Dental Plan of WY |
47.2 |
30 |
Source: GAO analysis of data from the National Association of Insurance Commissioners (NAIC). | GAO‑26‑107787
Note: Consumers can either purchase dental or vision coverage as part of a group plan, such as one offered through an employer, or individually, such as through a health insurance exchange. These exchanges, required to be established in each state by the Patient Protection and Affordable Care Act and operated by either the state or federal government, are marketplaces where eligible individuals and small employers can choose insurance plans offered by participating insurers. We calculated market share for each state based on the total number of individuals insured as of December 31, 2024, as reported by insurers to NAIC. Because there can be multiple insurers within a market that share a single parent company, we aggregated such insurers to the parent-company level following the aggregation scheme set forth by NAIC. We excluded all data from Massachusetts from our dental insurance market analysis due to a potential reporting error that we identified in one dental insurer’s enrollment data. We also excluded insurers that reported zero in enrollment in a state market. NAIC data do not include about five million enrollees in private, stand-alone dental plans in California from insurers that are regulated by the California Department of Managed Health Care. We present each insurer’s name exactly as it appeared in the NAIC data.
Table 4: Market Share for the Single Largest Stand-Alone Insurer and Number of Insurers by State in the Individual Dental Insurance Market (2024)
|
State |
Insurer |
Market share (percentage) |
Number of insurers in state |
|
Alabama |
BCBS of AL Grp |
60.0 |
26 |
|
Alaska |
Oregon Dental Serv Grp |
34.4 |
12 |
|
Arizona |
Delta Dental Plan of AZ Grp |
30.4 |
27 |
|
Arkansas |
Life & Specialty Ventures LLC Grp |
30.3 |
26 |
|
California |
Elevance Hlth Inc Grp |
15.7 |
20 |
|
Colorado |
Ensemble Innovation Ventures Grp |
34.6 |
22 |
|
Connecticut |
Elevance Htlh Inc Grp |
29.0 |
18 |
|
Delaware |
Dentegra Grp |
95.1 |
17 |
|
District of Columbia |
CAREFIRST INC GRP |
19.7 |
16 |
|
Florida |
Guidewell Mut Holding Grp |
21.9 |
27 |
|
Georgia |
UNITEDHEALTH GRP |
22.9 |
26 |
|
Hawaii |
Life & Specialty Ventures LLC Grp |
84.2 |
14 |
|
Idaho |
Delta Dental Plan of ID Inc |
43.1 |
24 |
|
Illinois |
Delta Dental Plan of IL Grp |
31.7 |
30 |
|
Indiana |
Renaissance Hlth Srv Corp Grp |
25.9 |
28 |
|
Iowa |
Delta Dental of IA Grp |
54.6 |
22 |
|
Kansas |
BCBS of KS GRP |
32.0 |
28 |
|
Kentucky |
Renaissance Hlth Srv Corp Grp |
52.4 |
22 |
|
Louisiana |
Sun Life Financial Inc Grp |
88.7 |
24 |
|
Maine |
Northeast Delta Dental Grp |
67.6 |
14 |
|
Maryland |
Dentegra Grp |
31.0 |
24 |
|
Michigan |
Renaissance Health Srv Corp Grp |
39.4 |
29 |
|
Minnesota |
Stratacor Grp |
72.9 |
16 |
|
Mississippi |
UNITEDHEALTH GRP |
19.6 |
23 |
|
Missouri |
UNITEDHEALTH GRP |
21.7 |
31 |
|
Montana |
HCSC GRP |
41.3 |
18 |
|
Nebraska |
Americans Mut Holding GRP |
20.1 |
24 |
|
Nevada |
UNITEDHEALTH GRP |
23.7 |
21 |
|
New Hampshire |
Sun Life Financial Inc Grp |
62.1 |
18 |
|
New Jersey |
Delta Dental Plan of NJ Grp |
59.6 |
18 |
|
New Mexico |
Renaissance Hlth Srv Corp Grp |
43.4 |
21 |
|
New York |
Dentegra Grp |
22.5 |
19 |
|
North Carolina |
BCBS of NC Grp |
23.8 |
24 |
|
North Dakota |
Stratacor Grp |
36.0 |
16 |
|
Ohio |
Renaissance Hlth Srv Corp Grp |
27.4 |
28 |
|
Oklahoma |
Delta Dental of OK |
27.7 |
28 |
|
Oregon |
Life & Specialty Ventures LLC Grp |
47.4 |
21 |
|
Pennsylvania |
Dentegra Grp |
32.5 |
29 |
|
Rhode Island |
BCBS of RI |
74.1 |
14 |
|
South Carolina |
Americans Mut Holding Grp |
14.5 |
24 |
|
South Dakota |
AFLAC Grp |
28.7 |
15 |
|
Tennessee |
Sun Life Financial Inc Grp |
72.8 |
23 |
|
Texas |
Sun Life Financial Inc Grp |
72.8 |
30 |
|
Utah |
EDUCATORS MUT GRP |
16.6 |
25 |
|
Vermont |
Northeast Delta Dental Grp |
83.3 |
11 |
|
Virginia |
Corvesta Grp |
51.5 |
22 |
|
Washington |
Delta Dental of WA |
65.4 |
19 |
|
West Virginia |
Dentegra Grp |
32.0 |
17 |
|
Wisconsin |
Delta Dental of WI Grp |
60.9 |
28 |
|
Wyoming |
Delta Dental Plan of WY |
43.3 |
20 |
Source: GAO analysis of data from the National Association of Insurance Commissioners (NAIC). | GAO‑26‑107787
Note: Consumers can either purchase dental or vision coverage as part of a group plan, such as one offered through an employer, or individually, such as through a health insurance exchange. These exchanges, required to be established in each state by the Patient Protection and Affordable Care Act and operated by either the state or federal government, are marketplaces where eligible individuals and small employers can choose insurance plans offered by participating insurers. We calculated market share for each state based on the total number of individuals insured as of December 31, 2024, as reported by insurers to NAIC. Because there can be multiple insurers within a market that share a single parent company, we aggregated such insurers to the parent-company level following the aggregation scheme set forth by NAIC. We excluded all data from Massachusetts from our dental insurance market analysis due to a potential reporting error that we identified in one dental insurer’s enrollment data. We also excluded insurers that reported zero in enrollment in a state market. NAIC data do not include about five million enrollees in private, stand-alone dental plans in California from insurers that are regulated by the California Department of Managed Health Care. We present each insurer’s name exactly as it appeared in the NAIC data.
Appendix II: Market Share for the Single Largest Stand-Alone Insurer and Number of Insurers by State in the Group and Individual Vision Insurance Markets (2024)
Table 5: Market Share for the Single Largest Stand-Alone Insurer and Number of Insurers by State in the Group Vision Insurance Market (2024)
|
State |
Insurer |
Market share (percentage) |
Number of insurers in state |
|
Alabama |
VISION SERV PLAN GRP |
51.1 |
27 |
|
Alaska |
VISION SERV PLAN GRP |
51.0 |
20 |
|
Arizona |
VISION SERV PLAN GRP |
28.1 |
33 |
|
Arkansas |
Renaissance Hlth Serv Corp Grp |
44.7 |
23 |
|
California |
FIDELITY SECURITY GRP |
25.2 |
30 |
|
Colorado |
VISION SERV PLAN GRP |
59.9 |
28 |
|
Connecticut |
FIDELITY SECURITY GRP |
32.6 |
25 |
|
Delaware |
FIDELITY SECURITY GRP |
45.1 |
24 |
|
District of Columbia |
UNITEDHEALTH GRP |
44.7 |
24 |
|
Florida |
VISION SERV PLAN GRP |
29.5 |
30 |
|
Georgia |
FIDELITY SECURITY GRP |
44.6 |
32 |
|
Hawaii |
METROPOLITAN GRP |
55.5 |
12 |
|
Idaho |
VISION SERV PLAN GRP |
76.9 |
30 |
|
Illinois |
VISION SERV PLAN GRP |
46.5 |
32 |
|
Indiana |
VISION SERV PLAN GRP |
31.6 |
30 |
|
Iowa |
FIDELITY SECURITY GRP |
37.6 |
26 |
|
Kansas |
VISION SERV PLAN GRP |
34.7 |
29 |
|
Kentucky |
Elevance Hlth Grp |
41.4 |
29 |
|
Louisiana |
VISION SERV PLAN GRP |
15.8 |
30 |
|
Maine |
Elevance Hlth Grp |
28.4 |
22 |
|
Maryland |
FIDELITY SECURITY GRP |
41.7 |
25 |
|
Massachusetts |
FIDELITY SECURITY GRP |
41.7 |
24 |
|
Michigan |
BCBS of MI Grp |
32.6 |
30 |
|
Minnesota |
FIDELITY SECURITY GRP |
34.8 |
28 |
|
Mississippi |
VISION SERV PLAN GRP |
32.4 |
27 |
|
Missouri |
FIDELITY SECURITY GRP |
54.8 |
31 |
|
Montana |
VISION SERV PLAN GRP |
51.1 |
26 |
|
Nebraska |
FIDELITY SECURITY GRP |
34.6 |
27 |
|
Nevada |
FIDELITY SECURITY GRP |
34.7 |
29 |
|
New Hampshire |
VISION SERV PLAN GRP |
38.5 |
20 |
|
New Jersey |
VISION SERV PLAN GRP |
41.7 |
27 |
|
New Mexico |
VISION SERV PLAN GRP |
59.6 |
25 |
|
New York |
VISION SERV PLAN GRP |
29.0 |
29 |
|
North Carolina |
VISION SERV PLAN GRP |
39.2 |
27 |
|
North Dakota |
VISION SERV PLAN GRP |
26.5 |
20 |
|
Ohio |
VISION SERV PLAN GRP |
37.2 |
34 |
|
Oklahoma |
VISION SERV PLAN GRP |
72.1 |
28 |
|
Oregon |
VISION SERV PLAN GRP |
56.7 |
29 |
|
Pennsylvania |
VISION SERV PLAN GRP |
38.4 |
28 |
|
Rhode Island |
VISION SERV PLAN GRP |
57.7 |
15 |
|
South Carolina |
BCBS of SC Grp |
50.6 |
30 |
|
South Dakota |
VISION SERV PLAN GRP |
60.0 |
22 |
|
Tennessee |
FIDELITY SECURITY GRP |
33.0 |
29 |
|
Texas |
VISION SERV PLAN GRP |
40.9 |
34 |
|
Utah |
FIDELITY SECURITY GRP |
30.2 |
32 |
|
Vermont |
VISION SERV PLAN GRP |
81.9 |
22 |
|
Virginia |
VISION SERV PLAN GRP |
59.5 |
29 |
|
Washington |
VISION SERV PLAN GRP |
58.3 |
29 |
|
West Virginia |
HUMANA GRP |
40.0 |
25 |
|
Wisconsin |
Delta Dental of WI Grp |
33.9 |
27 |
|
Wyoming |
PRINCIPAL FIN GRP |
21.6 |
21 |
Source: GAO analysis of data from the National Association of Insurance Commissioners (NAIC). | GAO‑26‑107787
Note: Consumers can either purchase dental or vision coverage as part of a group plan, such as one offered through an employer, or individually, such as through a health insurance exchange. These exchanges, required to be established in each state by the Patient Protection and Affordable Care Act and operated by either the state or federal government, are marketplaces where eligible individuals and small employers can choose insurance plans offered by participating insurers. We calculated market share for each state based on the total number of individuals insured as of December 31, 2024, as reported by insurers to NAIC. Because there can be multiple insurers within a market that share a single parent company, we aggregated such insurers to the parent-company level following the aggregation scheme set forth by NAIC. We also excluded insurers that reported zero in enrollment in a state market. NAIC data do not include about eight million enrollees in private, stand-alone vision plans in California from insurers that are regulated by the California Department of Managed Health Care. We present each insurer’s name exactly as it appeared in the NAIC data.
Table 6: Market Share for the Single Largest Stand-Alone Insurer and Number of Insurers by State in the Individual Vision Insurance Market (2024)
|
State |
Insurer |
Market share (percentage) |
Number of insurers in state |
|
Alabama |
VISION SERV PLAN GRP |
29.2 |
11 |
|
Alaska |
VISION SERV PLAN GRP |
52.3 |
7 |
|
Arizona |
UNITEDHEALTH GRP |
29.8 |
13 |
|
Arkansas |
Arkansas BCBS Grp |
52.3 |
12 |
|
California |
Blue Shield of CA Grp |
48.5 |
11 |
|
Colorado |
Ensemble Innovation Ventures Grp |
34.4 |
11 |
|
Connecticut |
Elevance Hlth Inc Grp |
31.1 |
12 |
|
Delaware |
VISION SERV PLAN GRP |
33.6 |
9 |
|
District of Columbia |
VISION SERV PLAN GRP |
41.2 |
9 |
|
Florida |
VISION SERV PLAN GRP |
32.1 |
14 |
|
Georgia |
UNITEDHEALTH GRP |
42.7 |
14 |
|
Hawaii |
Ameritas Mut Holding GRP |
51.1 |
6 |
|
Idaho |
VISION SERV PLAN GRP |
46.8 |
10 |
|
Illinois |
UNITEDHEALTH GRP |
22.7 |
16 |
|
Indiana |
UNITEDHEALTH GRP |
24.1 |
14 |
|
Iowa |
FIDELITY SECURITY GRP |
48.9 |
11 |
|
Kansas |
UNITEDHEALTH GRP |
27.6 |
12 |
|
Kentucky |
Single Vision Solution Inc |
30.3 |
11 |
|
Louisiana |
UNITEDHEALTH GRP |
36.3 |
11 |
|
Maine |
UNITEDHEALTH GRP |
31.4 |
10 |
|
Maryland |
UNITEDHEALTH GRP |
46.5 |
9 |
|
Massachusetts |
VISION SERV PLAN GRP |
58.0 |
8 |
|
Michigan |
BCBS of MI Grp |
41.8 |
15 |
|
Minnesota |
Ameritas Mut Holding GRP |
32.7 |
12 |
|
Mississippi |
UNITEDHEALTH GRP |
36.8 |
11 |
|
Missouri |
UNITEDHEALTH GRP |
27.7 |
14 |
|
Montana |
VISION SERV PLAN GRP |
69.7 |
8 |
|
Nebraska |
Ameritas Mut Holding GRP |
46.4 |
11 |
|
Nevada |
UNITEDHEALTH GRP |
30.1 |
12 |
|
New Hampshire |
UNITEDHEALTH GRP |
32.8 |
10 |
|
New Jersey |
VISION SERV PLAN GRP |
40.3 |
12 |
|
New Mexico |
VISION SERV PLAN GRP |
58.3 |
8 |
|
New York |
VISION SERV PLAN GRP |
58.1 |
10 |
|
North Carolina |
BCBS of NC Grp |
66.5 |
12 |
|
North Dakota |
Ameritas Mut Holding GRP |
49.4 |
9 |
|
Ohio |
UNITEDHEALTH GRP |
25.1 |
14 |
|
Oklahoma |
VISION SERV PLAN GRP |
29.2 |
13 |
|
Oregon |
VISION SERV PLAN GRP |
52.7 |
11 |
|
Pennsylvania |
UPMC HLTH SYSTEM GRP |
73.3 |
13 |
|
Rhode Island |
VISION SERV PLAN GRP |
67.9 |
7 |
|
South Carolina |
Ameritas Mut Holding GRP |
33.7 |
12 |
|
South Dakota |
VISION SERV PLAN GRP |
34.8 |
9 |
|
Tennessee |
UNITEDHEALTH GRP |
27.9 |
13 |
|
Texas |
UNITEDHEALTH GRP |
33.5 |
14 |
|
Utah |
UNITEDHEALTH GRP |
42.3 |
12 |
|
Vermont |
VISION SERV PLAN GRP |
64.9 |
7 |
|
Virginia |
Elevance Hlth Inc Grp |
22.0 |
10 |
|
Washington |
VISION SERV PLAN GRP |
49.5 |
9 |
|
West Virginia |
VISION SERV PLAN GRP |
27.0 |
12 |
|
Wisconsin |
UNITEDHEALTH GRP |
22.2 |
15 |
|
Wyoming |
UNITEDHEALTH GRP |
42.1 |
9 |
Source: GAO analysis of data from the National Association of Insurance Commissioners (NAIC). | GAO‑26‑107787
Note: Consumers can either purchase dental or vision coverage as part of a group plan, such as one offered through an employer, or individually, such as through a health insurance exchange. These exchanges, required to be established in each state by the Patient Protection and Affordable Care Act and operated by either the state or federal government, are marketplaces where eligible individuals and small employers can choose insurance plans offered by participating insurers. We calculated market share for each state based on the total number of individuals insured as of December 31, 2024, as reported by insurers to NAIC. Because there can be multiple insurers within a market that share a single parent company, we aggregated such insurers to the parent-company level following the aggregation scheme set forth by NAIC. We also excluded insurers that reported zero in enrollment in a state market. NAIC data do not include about eight million enrollees in private, stand-alone vision plans in California from insurers that are regulated by the California Department of Managed Health Care. We present each insurer’s name exactly as it appeared in the NAIC data.
GAO Contact
John E. Dicken, Director, Health Care, DickenJ@gao.gov
Staff Acknowledgments
In addition to the contact listed above, Kristi Peterson (Assistant Director), Ramsey Asaly (Analyst-in-Charge), Julianne Flowers, Joy Grossman, Laurie Pachter, and Timothy Planert made key contributions to this report. Also contributing were Leia Dickerson, Emei Li, Kathleen McQueeney, Monica Perez-Nelson, Ethiene Salgado-Rodriguez, Ravi Sharma, and Kelly Troutman.
The Government Accountability Office, the audit, evaluation, and investigative arm of Congress, exists to support Congress in meeting its constitutional responsibilities and to help improve the performance and accountability of the federal government for the American people. GAO examines the use of public funds; evaluates federal programs and policies; and provides analyses, recommendations, and other assistance to help Congress make informed oversight, policy, and funding decisions. GAO’s commitment to good government is reflected in its core values of accountability, integrity, and reliability.
Obtaining Copies of GAO Reports and Testimony
The fastest and easiest way to obtain copies of GAO documents at no cost is through our website. Each weekday afternoon, GAO posts on its website newly released reports, testimony, and correspondence. You can also subscribe to GAO’s email updates to receive notification of newly posted products.
Order by Phone
The price of each GAO publication reflects GAO’s actual cost of production and distribution and depends on the number of pages in the publication and whether the publication is printed in color or black and white. Pricing and ordering information is posted on GAO’s website, https://www.gao.gov/ordering.htm.
Place orders by calling (202) 512-6000, toll free (866) 801-7077,
or
TDD (202) 512-2537.
Orders may be paid for using American Express, Discover Card, MasterCard, Visa, check, or money order. Call for additional information.
Connect with GAO
Connect with GAO on X,
LinkedIn, Instagram, and YouTube.
Subscribe to our Email Updates. Listen to our Podcasts.
Visit GAO on the web at https://www.gao.gov.
To Report Fraud, Waste, and Abuse in Federal Programs
Contact FraudNet:
Website: https://www.gao.gov/about/what-gao-does/fraudnet
Automated answering system: (800) 424-5454
Media Relations
Sarah Kaczmarek, Managing Director, Media@gao.gov
Congressional Relations
David A. Powner, Acting Managing Director, CongRel@gao.gov
General Inquiries
[1]For more information, see GAO, Private Health Insurance: Market Concentration Generally Increased from 2011 through 2022, GAO‑25‑107194 (Washington, D.C.: Nov. 14, 2024).
[2]In 2022, the Department of Health and Human Services’ Office of the Assistant Secretary for Planning and Evaluation conducted a literature review that examined trends and effects of concentration in health care markets, including health insurance markets. See RAND Corporation, Environmental Scan on Consolidation Trends and Impacts in Health Care Markets (Santa Monica, Calif.: Aug. 2022).
[3]See George Tewfik, Dennis Grech, Linda Laham, Faraz Chaudhry, and Rotem Naftalovich, “The Risks and Benefits of Physician Practice Acquisition and Consolidation: A Narrative Review of Peer-Reviewed Publications Between 2009 and 2022 in the United States,” Journal of Multidisciplinary Healthcare, vol. 17 (2024). See also Jose Ignacio Cuesta, Carlos Noton, and Benjamin Vatter, “Vertical Integration Between Hospitals and Insurers,” Working Paper No. 4001, Stanford Graduate School of Business (2019); Sanford J. Grossman and Oliver D. Hart, “The Costs and Benefits of Ownership: A Theory of Vertical and Lateral Integration,” The Journal of Political Economy, vol. 94, no. 4 (1986); and Department of Justice and Federal Trade Commission, Merger Guidelines (Washington, D.C.: Dec. 18, 2023).
[4]NAIC receives filings from companies required to file with state insurance departments. According to NAIC, not all insurers are required to file with state insurance departments. For example, companies that do not exceed certain thresholds in annual premiums collected may not be required to file. In addition, California is unique in that it is the only state with two separate agencies that oversee health insurance, and this affects the state’s filing requirements. While many health insurers in California file with the California Department of Insurance, some insurers are required to file with the California Department of Managed Health Care. In 2024, about five million individuals were enrolled in private stand-alone dental plans and about eight million individuals were enrolled in private stand-alone vision plans regulated by the California Department of Managed Health Care and are not included in the NAIC data.
[5]Insurers may allocate enrollees to state markets using different methods. This could affect our findings on state-level market share. According to NAIC, these methods may include allocating each enrollee to the state in which the enrollee resides or where the insurance plan sponsor, such as an employer, is located, which may be a different state from where the enrollee resides. For the data we used in our analysis, insurers do not report their allocation methods to NAIC.
[6]Specifically, we considered insurers to have the same parent company if they reported having the same NAIC holding group identifier or the same NAIC company identifier.
[7]We excluded all data from Massachusetts from our dental insurance market analysis due to a potential reporting error that we identified in one dental insurer’s enrollment data. We shared our findings on this potential reporting error with NAIC and the Massachusetts Division of Insurance.
[8]NAIC data for individual insurance markets also include enrollment in dental and vision plans available through health insurance exchanges—marketplaces operated by either the state or federal government that were required to be established in each state by the Patient Protection and Affordable Care Act. Health insurance exchanges are markets that operate within each state’s overall individual and small-group market where eligible individuals and small employers can compare and select among qualified insurance plans offered by participating insurers. See Pub. L. No. 111-148, § 1321, 124 Stat. 119, 186 (2010).
[9]We considered the ERISA Industry Committee to be a stakeholder from both the dental and vision industries due to the organization’s broad role representing the interests of large employer plan sponsors.
[10]Control of a market, or market power, is the ability of a firm or group of firms to price profitably above their marginal cost, indicating a lack of competition.
[11]In 2022, the American Optometric Association reported that self-pay accounted for 31 percent of optometrists’ revenue. See American Optometric Association, 2022 AOA Survey of Optometric Practice: Income from Optometry (St. Louis, Mo.: 2022). In 2024, out-of-pocket spending accounted for about 20 percent of all dental spending, per the National Health Expenditures data. See Centers for Medicare and Medicaid Services, National Health Expenditures by Type of Service and Source of Funds, CY 1960-2024, National Health Expenditure Data, accessed January 28, 2026, https://www.cms.gov/data-research/statistics-trends-and-reports/national-health-expenditure-data/historical.
[12]National Association of Insurance Commissioners, 2024 Accident and Health Policy Experience Report (Kansas City, Mo.: 2025).
[13]Total United States population in 2024 estimated by the United States Census Bureau as of July 1, 2024.
[14]A provider network is a group of providers with which an insurer contracts to provide services to members at negotiated rates.
[15]Kamyar Nasseh, John R. Bowblis, Marko Vujicic, and Sean Shenghsiu Huang, “Consolidation in the Dental Industry: a Closer Look at Dental Payers and Providers,” International Journal of Health Economics and Management, vol. 20 (2020). The authors defined highly concentrated markets as those with a Herfindahl-Hirschman Index (HHI) greater than 2500 and moderately concentrated markets as those with an HHI from 1500 to 2500. HHI is calculated by squaring the market share of each firm competing in the market and then summing the resulting numbers.
[16]Hawazin W. Elani, Md Shahinoor Rahman, Jacob Wallace, Meredith B. Rosenthal, and Benjamin D. Sommers, “Availability of Adult Dental Plans In the Affordable Care Act Marketplaces, 2016-23,” Health Affairs, vol. 43, no. 11 (2024).
[17]Our analysis of NAIC data found that the median number of stand-alone dental insurers per state in 2024 was 39 for insurers offering group plans and 22 for insurers offering individual plans.
[18]This stakeholder’s study findings differed from ours in part because the study was based on a broader definition of the vision insurance market. Specifically, the study was based, in part, on an analysis of vision care claims data from 20 vision insurers and included both self-insured and fully insured plans, as well as claims from Medicare Advantage plans. In addition, the study included vision care transactions from self-pay consumers who did not use vision insurance.
[19]Kamyar Nasseh, John R. Bowblis, and Marko Vujicic, “Pricing in Commercial Dental Insurance and Provider Markets,” Health Services Research, vol. 56 (2021). The authors defined moderately concentrated markets as those with an HHI between 1500 and 2500 and highly concentrated markets as those with an HHI greater than 2500.
[20]Nasseh, Bowblis, Vujicic, and Huang, “Consolidation in the Dental Industry.”
[21]Our prior work has noted that consolidation within the health care industry, including from vertical integration, has the potential to improve efficiency, but it also has the potential to impede competition and contribute to increased costs to patients, employers, insurers, and federal health care programs. See GAO, Health Care Consolidation: Published Estimates of the Extent and Effects of Physician Consolidation, GAO‑25‑107450 (Washington, D.C.: Sept. 22, 2025).