Report to Congressional Requesters
United States Government Accountability Office
A report to congressional requesters
For more information, contact: Nagla'a El-Hodiri, elhodirin@gao.gov.
What GAO Found
Several factors limit the operations of Guam’s Customs and Quarantine Agency (CQA). For example, CQA maintains only paper-based records of customs transactions, which officials said limits efficiency, may compromise data reliability and result in reduced revenue. In August 2025, CQA received funding to implement an automated customs system. Nonfunctional equipment and procurement delays also limit CQA’s operations. For the past 3 years, CQA has had only one working x-ray machine, resulting in time-intensive manual cargo inspections.
GAO identified several considerations for evaluating three selected alternatives to Guam’s current customs model: (1) Guam joins the U.S. customs territory, with U.S. Customs and Border Protection (CBP) administering Guam customs (federalized model); (2) Guam remains outside the U.S. customs territory, with CBP administering Guam customs (hybrid model); or (3) Guam retains its current customs model, with additional funding for CQA from higher fees for incoming passengers or cargo. Considerations include the following:
· Legal changes and funding sources. In the federalized model, federal law would have to be amended for Guam to join the U.S. customs territory. In the federalized or hybrid model, a source of funding for CBP operations in Guam would need to be identified.
· Jurisdiction and security. In the federalized model, CBP would not inspect cargo from the U.S. customs territory. CQA officials said this could increase the risk of illegal drugs entering Guam, as most are smuggled from other parts of the U.S. Also, in the federalized model, Guam’s ports would need to be upgraded to meet all federal security requirements.
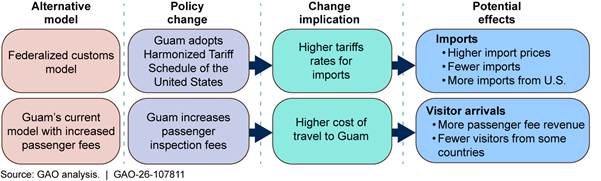
Changes to Guam’s current customs model could also affect Guam’s economy. In the federalized model, imports from foreign countries would be subject to U.S. tariffs, while Guam currently does not impose tariffs. Because manufacturing in Guam is limited, this would likely raise the prices of goods on the island. In Guam’s current model with additional funding for CQA, raising passenger fees to increase CQA funding would likely reduce the number of travellers from some countries to Guam. This, in turn, would likely reduce tourism revenue, which is vital to Guam’s economy.
Why GAO Did This Study
Guam, a U.S. territory in the Indo-Pacific, serves as a strategic U.S. shipping and military hub. Being outside the U.S. customs territory, Guam is not subject to U.S. federal customs administration and may impose its own tariffs on imports. CQA, which administers Guam’s customs operations, is intended to fund its operations through fees collecsted from incoming passengers and for cargo imports. However, a drop in tourism since 2020 has reduced its revenue.
GAO was asked to examine CQA’s operations as well as alternatives to Guam’s current customs model. This report describes (1) factors that limit CQA’s operations, (2) considerations for evaluating selected alternative customs models for Guam, and (3) potential economic effects if Guam adopts one of the selected alternative models.
GAO analyzed documents provided by Guam and U.S. agencies. GAO also interviewed agency officials and stakeholders in Washington, D.C.; Guam; Puerto Rico; and the U.S. Virgin Islands (USVI). GAO selected Puerto Rico and USVI to examine customs models used in other U.S. territories. CBP administers customs in Puerto Rico, which is in the U.S. customs territory and therefore uses U.S. tariffs. CBP also administers customs in USVI, which is not in the U.S. customs territory and sets its own tariffs. GAO analyzed these models, as well as Guam’s current model with additional CQA funding, as possible alternatives for Guam customs operations. GAO also conducted economic analyses to estimate the effects of Guam’s adopting one of the selected models. In comments on a draft of this report, the Office of the Governor of Guam and CQA raised concerns about the scope of GAO’s review. GAO believes its scope was appropriate to answer the report’s objectives.
|
Abbreviations |
|
|
|
|
|
ACE |
Automated Commercial Environment |
|
ASYCUDA |
Automated System for Customs Data |
|
CBP |
U.S. Customs and Border Protection |
|
CNMI |
Commonwealth of the Northern Mariana Islands |
|
CQA |
Customs and Quarantine Agency |
|
HTSUS |
Harmonized Tariff Schedule of the United States |
|
OPA |
Office of Public Accountability |
|
UN |
United Nations |
|
USVI |
U.S. Virgin Islands |
|
WCO |
World Customs Organization |
This is a work of the U.S. government and is not subject to copyright protection in the United States. The published product may be reproduced and distributed in its entirety without further permission from GAO. However, because this work may contain copyrighted images or other material, permission from the copyright holder may be necessary if you wish to reproduce this material separately.
March 18, 2026
The Honorable Andrew R. Garbarino
Chairman
Committee on Homeland Security
House of Representatives
The Honorable James Moylan
House of Representatives
Guam is the westernmost U.S. territory in the Indo-Pacific region, located closer to Beijing than to Hawaii. As such, it serves as a strategic shipping and military hub, supporting crucial operations and logistics for U.S. forces in the region. Residents of Guam rely heavily on goods entering the island from other parts of the United States or imported from other countries.[1]
Guam’s Customs and Quarantine Agency (CQA)—a nonautonomous agency of the Guam government—administers the territory’s customs operations, with a mission of improving trade facilitation and protecting the island’s population. CQA enforces federal and local laws and regulations to protect borders; secure ports of entry; and facilitate trade, commerce, and travel. Its primary functions include inspecting cargo, passenger baggage, vehicles, and vessels for contraband and other restricted items.[2]
For years, CQA has reported on operational challenges affecting its ability to execute its mission. Recently reported challenges included the agency’s declining revenues and the absence of an automated customs data system. For example, in fiscal year 2023, CQA reported that funding shortfalls and laborious procurement processes had both challenged and delayed acquisitions of information technology systems and equipment.[3]
You asked us to examine CQA’s operations and alternatives to Guam’s current customs model. This report describes (1) factors limiting CQA’s operations, (2) considerations for evaluating selected alternative customs models for Guam, and (3) potential economic effects if Guam adopts one of the selected alternative models.
To address these objectives, we analyzed documents and interviewed U.S. federal and Guam government officials, and observed CQA’s operations in Guam.[4] We reviewed Guam laws and regulations, CQA documents and data, and documents provided by other Guam government agencies, U.S. federal agencies, and other stakeholders. We traveled to Guam in January 2025, where we met with a variety of government officials and stakeholder groups, visited offices, toured facilities, and observed CQA operations. In addition, we interviewed officials in Washington, D.C., representing the U.S. Department of the Interior’s Office of Insular Affairs, the Department of Homeland Security’s U.S. Customs and Border Protection (CBP), and the Department of Agriculture’s Animal and Plant Health Inspection Service.
To describe considerations for evaluating selected alternative customs models for Guam, we analyzed three possible alternatives based on those used in the U.S. territories: Puerto Rico’s “federalized” model, the U.S. Virgin Islands’ (USVI) “hybrid” model, and Guam’s current model with additional CQA funding.[5] We selected Puerto Rico’s and USVI’s customs models because their differences from Guam’s. To learn about Puerto Rico’s and USVI’s customs models, we analyzed documents and interviewed U.S. federal and territory officials. We also traveled to Puerto Rico and USVI in April 2025 to interview relevant officials and stakeholders and to visit offices, tour facilities, and observe customs operations.
Moreover, to describe potential economic effects if Guam adopts one of the selected alternative customs models,[6] we focused on potential changes to imports, exports, and visitor arrivals.[7] We used economic models that accounted for the unique features of Guam’s economy to estimate hypothetical changes to Guam’s imports if it adopts Puerto Rico’s customs model and to Guam’s visitor arrivals if it maintains its current customs model with higher passenger inspection fees. For a more detailed discussion of our methodology, see appendix I.
We conducted this performance audit from September 2024 to March 2026 in accordance with generally accepted government auditing standards. Those standards require that we plan and perform the audit to obtain sufficient, appropriate evidence to provide a reasonable basis for our findings and conclusions based on our audit objectives. We believe that the evidence obtained provides a reasonable basis for our findings and conclusions based on our audit objectives.
Background
Guam’s Economic and Trade Activity
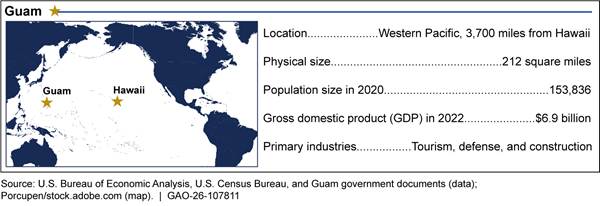
Guam relies heavily on imports because of limited local manufacturing as well as its small size and population. Figure 1 shows information about Guam’s geography, population, and economy.
Note: The population and economic data shown are the most recent available as of August 2025.
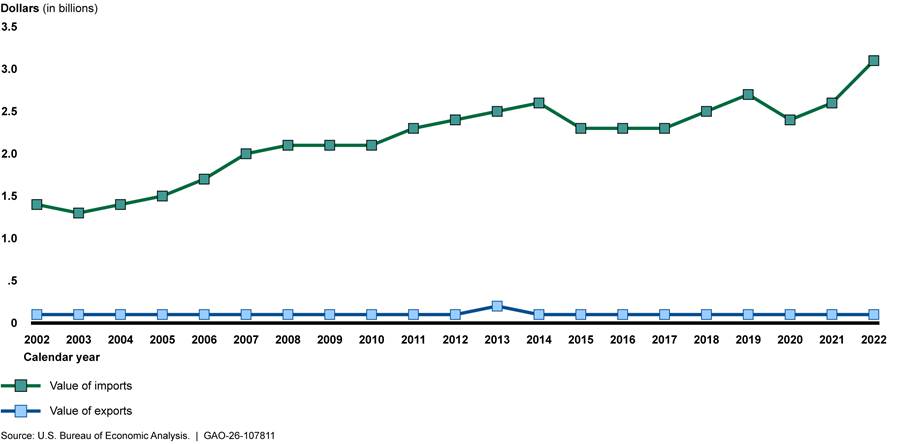
In 2022, the value of imports was $3.1 billion, accounting for 45 percent of Guam’s GDP. In contrast, the value of exports was $76 million, accounting for about 1 percent of GDP.[8] Most of the goods Guam exports are produced elsewhere and shipped through Guam to nearby locations such as the Commonwealth of the Northern Mariana Islands (CNMI). Figure 2 shows the total value of Guam’s imports and exports from 2002 through 2022.
Note: The data shown are the values of imported and exported goods, not services.
Guam is currently a duty-free port, which means that imported goods are not subject to tariffs at the Port of Guam.[9] In fiscal year 2024, the most recent year for which CQA provided these data, Guam received nearly 25 million pounds of air cargo and approximately 3 billion pounds of sea cargo. Guam’s major trading partners include South Korea, Japan, Taiwan, China, and Singapore.
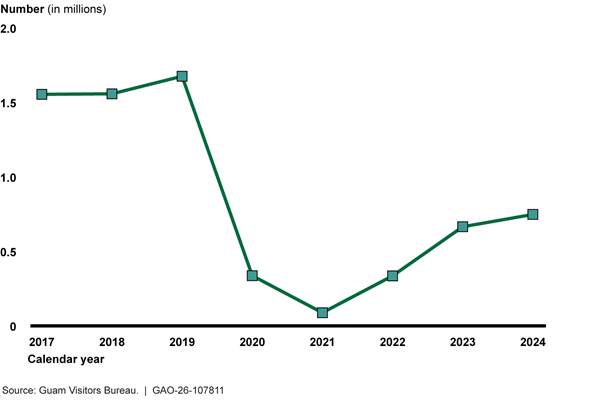
The COVID-19 pandemic drastically affected tourism—one of Guam’s primary industries, along with U.S. military–related activities and construction—and visitor arrivals in Guam. Although visitor arrivals grew steadily from 2021 through 2024, the number of visitors in 2024 was less than half of the number in 2019 (see fig. 3).
The U.S. military’s growing presence in Guam provides a stable and increasing source of economic activity. The U.S. Department of Defense has ongoing construction priorities to support the expanding presence of the Marine Corps, Air Force, and Navy in Guam in coming years.[10]
CQA’s Roles
CQA officers inspect cargo, passenger baggage, vehicles, and vessels for compliance with customs and quarantine regulations. Officers screen for items such as controlled substances, counterfeit goods, and agricultural pests and are authorized to impose a range of penalties for violations. For example, they may arrest suspects; seize goods and contraband; and issue fines for offenses such as misreporting required information, failing to declare imports or exports, submitting forged documents, or possessing or transporting controlled substances or counterfeit items. Figure 4 shows dogs trained and used by CQA to inspect incoming baggage, cargo, and mail.[11]
Figure 4: Dogs Used by Guam Customs and Quarantine Agency (CQA) to Inspect Incoming Baggage, Cargo, and Mail
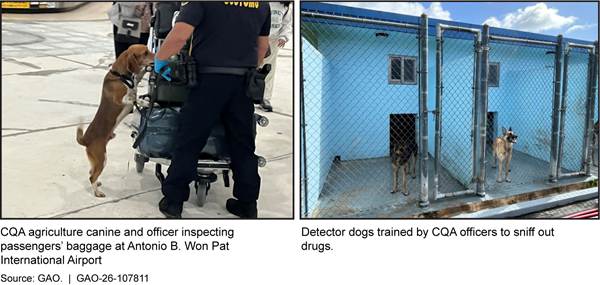
CQA carries out its work primarily at Guam’s five entry points: the Antonio B. Won Pat International Airport, the Port Authority of Guam, the U.S. Postal Service Main Facility, Andersen Air Force Base, and Agat Marina. As of August 2025, CQA had 184 employees.
CQA collaborates with U.S. federal agencies to help them carry out their work in Guam. For example, CQA officials may assist CBP officials in Guam, when needed, with physical inspections of arriving passengers’ property to verify their reason for travel to Guam.[12] In addition, CQA officers work with officials of the U.S. Department of Agriculture’s Animal and Plant Health Inspection Service to check for pests and plant diseases during agricultural inspections at airports, shipping ports, military bases, and cargo facilities.
CQA’s Funding
The government of Guam appropriates funding for CQA from two sources: the General Fund and special revenue funds. The General Fund includes all government revenues that are not otherwise restricted by statute, such as taxes, from which appropriations can lawfully be made.[13] Special revenue funds are created by statute, with identified sources of revenue or appropriation, and expenditures from these funds are restricted to purposes set by statute or as sources for payment on certain government bonds.
Although CQA receives annual appropriations, agency documents state that it is intended to fund itself through fees—its chief source of revenue—as well as taxes, fines, and penalties. The fees that it collects, primarily for inspections of arriving passengers and imported cargo, are deposited into its special revenue fund, the Customs, Agriculture, and Quarantine Inspection Services Fund. This fee structure, established by Guam law, is designed to fund CQA’s operational costs through revenue from inspection activities rather than legislative appropriations from the General Fund, according to CQA documents. Guam law also requires CQA to collect taxes, known as use taxes, on taxable property, construction equipment, and other materials entering Guam.[14] Guam law also requires CQA’s special revenue fund to receive 20 percent of total use tax revenue in annual appropriations. In addition, the agency collects fines and penalties for violations of local customs laws.
CQA’s revenue exceeded its expenditures in fiscal years 2017 through 2019 but fell short in fiscal years 2020 through 2023, according to funding data from the Guam government’s independent auditors’ reports (see fig. 5).[15] After the COVID-19 pandemic began in 2020, reduced tourism decreased the agency’s total collection of passenger fees, which represents a significant portion of its revenue. As a result, CQA’s revenue collection did not fully finance its operations in fiscal years 2020 through 2023. For example, its total expenditures exceeded its revenue collection by about $17.6 million, or 237 percent, in fiscal year 2023.
Figure 5: Guam Customs and Quarantine Agency (CQA) Revenue Collected and Total Expenditures, Fiscal Years 2017–2023
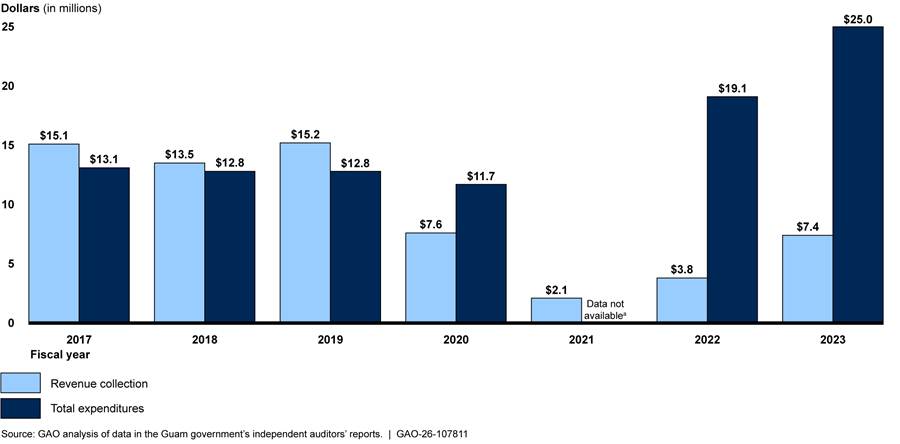
Note: CQA also receives funds not appropriated by the government of Guam, such as grants and federal funds, that are not included in the data shown.
aThe Guam government’s independent auditors’ reports do not contain data on CQA’s expenditures from the General Fund for fiscal year 2021.
When the revenue it collects is insufficient to fund its operations, CQA can request supplemental funding from Guam’s government through General Fund appropriations. According to Guam’s general appropriations laws, the agency’s total annual appropriations increased from around $14.9 million in fiscal year 2017 to around $21.6 million in fiscal year 2025. In fiscal years 2017 through 2019, CQA received no appropriation from the General Fund because the agency collected more revenue than it expended. However, in fiscal years 2020 through 2025, CQA relied on General Fund appropriations. In fiscal years 2021 through 2025, appropriations from the General Fund provided more than half of the agency’s total funding (see fig. 6).
Figure 6: Guam Government Funding Appropriated to Customs and Quarantine Agency, by Appropriation Source, Fiscal Years 2017–2025
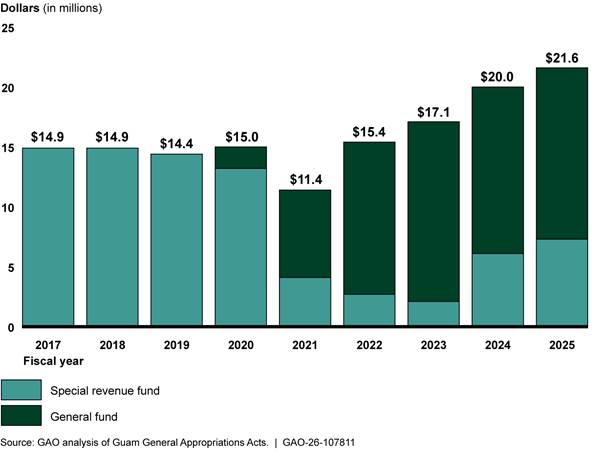
Note: The Customs and Quarantine Agency also receives funds not appropriated by the government of Guam, such as grants and federal funds, that the data shown do not include.
According to CQA, the agency received about $6 million in matching federal grant funding in fiscal years 2017 through 2024. For example, in 2021, the Department of Homeland Security awarded a port security grant of nearly $1.5 million. According to a CQA document, this award was intended to help the agency improve its technology and procure equipment such as handheld x-ray scanners. According to information that CQA provided, it also received funding from the U.S. Departments of Agriculture and Justice to support its canine teams, including those used for agricultural inspections and drug detection.
Customs Models Used in U.S. Territories
Customs models vary across the five U.S. territories,[16] four of which—Guam, American Samoa, the CNMI, and USVI—are outside the U.S. customs territory.[17] As a result, Guam, American Samoa, and the CNMI are responsible for administering their own customs operations and may set their own merchandise categories to track imports and impose tariffs.[18] In contrast, under an agreement with the USVI government, CBP administers USVI’s customs operations while the territory’s government sets its own merchandise categories and imposes its own tariffs. In the Commonwealth of Puerto Rico, which is within the U.S. customs territory, CBP administers customs operations, uses U.S. merchandise categories, and collects duties set by the Harmonized Tariff Schedule of the United States (HTSUS).
Table 1 shows selected characteristics of the five territories’ current customs models.[19]
|
|
Guam, American Samoa, Commonwealth of the Northern Mariana Islands (CNMI) |
Commonwealth of Puerto Rico |
U.S Virgin Islands (USVI) |
|
Customs operations are administered by U.S. Customs and Border Protection. |
✖ |
✓ |
✓ |
|
The Harmonized Tariff Schedule of the United States (HTSUS) is used for duty collection.a |
✖ |
✓ |
✖ |
Legend: ✖ = no, ✓ = yes.
Source: GAO analysis of U.S. government and territories information. | GAO‑26‑107811
Note: Of the five territories, only Puerto Rico is part of the U.S. customs territory. Guam, American Samoa, and the CNMI administer their own customs operations. Guam does not collect duties but imposes cargo and passenger fees. USVI has arranged with U.S. Customs and Border Protection to administer its customs operations, collecting duties that USVI sets.
aThe HTSUS sets the tariffs and statistical categories for all merchandise imported into the U.S. customs territory.
Several Factors Limit CQA Operations
Several factors limit CQA’s ability to carry out its mission effectively and efficiently, including a paper-based customs system, nonfunctional equipment, and delayed procurement.[20] In fiscal year 2020, the Guam government began efforts to automate its customs system, and in August 2025, it provided funding to CQA to implement the automated system. CQA is attempting to obtain new equipment and work with a newly implemented procurement system.
Paper-Based Customs System
Current Process
CQA uses a paper-based customs system for documentation and records management, which limits operational efficiency, may compromise data reliability, and may result in reduced revenue. According to a report by the Guam Office of Public Accountability (OPA),[21] CQA does not have the infrastructure to accept or process electronic manifests, as mandated by Guam law.[22] Instead, CQA relies on nonautomated and paper document submission processes. CQA officials informed us that customs officers maintain paper records of customs transactions, such as inspections, cargo releases, and seizures. Officials also noted, and we observed, that importers generally fill out customs forms manually and provide these hard-copy forms to CQA when their shipments arrive in Guam.
The use of a paper-based customs system affects, or may affect, operations efficiency, data reliability, and government revenue in the following ways, according to Guam government documents and officials:
· Operational efficiency. According to agency officials, Guam’s paper-based system slows customs operations, particularly when multiple officers must wait to access or review physical files. Further, according to a document from the Guam government’s Bureau of Statistics and Plans, CQA’s current manual clearance process and lack of automation severely limits the agency’s capabilities to carry out its federal and local mandates. In addition, another Bureau of Statistics and Plans document notes that the manual process results in cumbersome, tedious, and voluminous paperwork, which can lead to error and wasted effort.
· Data reliability. According to a Guam government agency report and agency officials, the paper-based system can contribute to data inaccuracies. For example, an OPA report found that the manual system prevents CQA from providing real-time or pre-arrival information about cargo, performing or providing detailed analysis and assessments of goods, accounting for commodities, and reporting information in a timely manner.[23] Specifically, according to the report, OPA could not determine the total volume of alcoholic beverages imported and exported through Guam’s maritime and air cargo facilities. In addition, OPA officials told us that data CQA officers collect may contain errors and thus cannot be relied on for completeness and accuracy.
· Government revenue. CQA’s reliance on a paper-based system has affected the government’s ability to record import data and to tax imports, according to a document provided by the Bureau of Statistics and Plans.[24] The document notes that this has resulted in large gaps in economic data collected for Guam as well as “a significant amount of tax leakage” in CQA’s collection of use taxes, which contribute to the government’s revenue. Moreover, a performance audit of Guam’s use tax data and processes found that CQA’s manual recording of incoming air cargo made the agency prone to errors, as air cargo information may be incomplete, erroneous, and unreliable.[25] The audit report stated that without an effective system in place, CQA is exposed to risks of unaccounted, unrecorded, and unassessed taxes on incoming cargoes, resulting in potential revenue loss (see text box). The report also noted that if paper-based records were destroyed, evidence to prove potential fraud would be unrecoverable.
|
2020 Audit Report of Guam Government Use Tax A 2020 audit report by the Guam Office of Public Accountability found that the Customs and Quarantine Agency (CQA) did not collect all available revenue from use taxes. Specifically, the audit found that in 2018, CQA’s Air Cargo Operations received incoming air cargoes worth $1.6 billion and collected $136,000 in use taxes for the Guam government. However, if the agency had assessed and collected use taxes on all incoming air cargo, including cargo that is exempt from the use tax, the government’s use tax revenue could have amounted to $65.5 million. Office of Public Accountability and CQA officials clarified that not all of the air cargo’s total value of $1.6 billion was subject to the use tax, as some cargoes are exempt from use tax, and that the $65.5 million in potential revenue was an estimate. The audit report notes that the true value of use taxes that CQA assessed, collected, and owed to the Guam government is unknown. The Office of Public Accountability made recommendations related to, among other things, strengthening the agency’s internal controls on use tax payments, collections, and deposits to prevent potential fraud. As of August 2025, CQA had implemented some of these recommendations but was waiting on progress with an automated customs system to implement some others, according to agency officials. CQA officials said that they expected the new customs electronic system would significantly improve the agency’s abilities to capture importers' declarations for exemption under the use tax provisions. |
Source: Guam government documents and officials. | GAO‑26‑107811
Warehouse Storage of Paper Records
CQA stores paper records in a warehouse that has reached capacity, according to officials. Some of the files date back to 2007, a time frame that exceeds CQA’s standard retention period of 4 to 7 years, officials said. Some boxes that we saw in the warehouse were labeled as containing documents from 2009 and as having been approved for destruction (see fig. 7). According to a 2025 Guam OPA report, all passenger and cargo entry documents—such as bills of lading, invoices, packing lists, manifests, and other documents required in the customs entry process—are filed in more than 5,000 cardboard boxes stored at the CQA records management warehouse facility.[26]
Figure 7: Boxes of Documents in Guam Customs and Quarantine Agency’s Records Storage Facility, January 2025
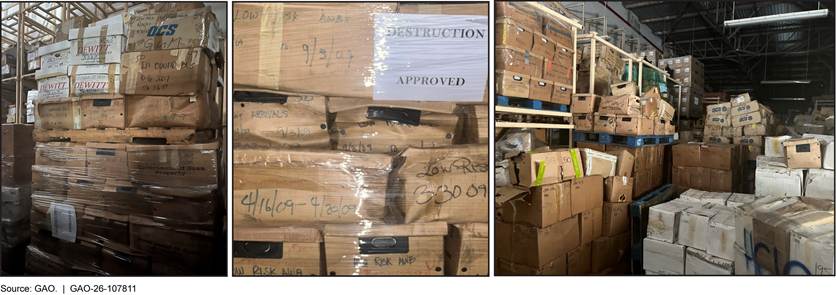
According to records management staff, they received initial approval as early as 2009 from CQA’s leadership to request procurement to dispose of some documents. However, agency staff said that the procurement process was not completed until March 2025 and that as of February 2026, none of the documents approved for destruction had been destroyed.
CQA officials explained that most of the records kept in the warehouse have no digital backup and that the agency does not maintain an inventory of the stored documents, which increases the risk of data loss. They also said that without an inventory of the paper files, they are unable to locate or retrieve records efficiently. These conditions also pose risks to both operational continuity and data security.
Staff expressed concern that if a disaster, such as fire or flood, were to occur, they could not recover some critical customs information; they noted that in 2016, two fires in CQA facilities destroyed customs documents. Moreover, Guam OPA reported that the adequacy or completeness of the files may be compromised during document retrieval from the stored cardboard boxes, given the potential for human error.[27] In addition, the overall condition of the storage facility and exposure of its contents to improper ventilation; the threat of infestation; and environmental factors, such as typhoon, rain and water damage, and humidity, may result in damage to documents, according to Guam OPA.
Efforts to Automate Customs Operations
In fiscal year 2020, the Guam government began implementing a two-phase modernization project to automate its customs operations; in August 2025, CQA received funding from the government to implement an automated customs system. According to agency officials, the automated system would allow importers to provide advance information about their cargo to CQA, which will help officers identify high-risk cargo before its arrival. Officials noted that this will enable more efficient threat and risk assessment and will help CQA optimize resource planning for inspection operations. CQA officials also noted that automation will reduce reliance on the warehouse for storage of paper documents. Furthermore, officials of the Bureau of Statistics and Plans noted that automation of Guam’s customs operations will allow the government to collect economic data needed to analyze its policies and review import trends.
The U.S. Department of the Interior provided funding for both phases of the Guam customs modernization initiative as part of a technical assistance program.[28] CQA and the Bureau of Statistics and Plans also partnered with the Oceania Customs Organisation, a regional group of which CQA is a member, to implement this initiative.[29]
After completing phase 1—the planning phase—of Guam’s customs modernization effort in January 2024, CQA was working on phase 2—the implementation phase—as of December 2025.[30] In its grant request to Interior, the government of Guam expressed its intention to engage the United Nations (UN) Conference on Trade and Development to deploy the Automated System for Customs Data (ASYCUDA) for Guam.[31] According to the grant request, ASYCUDA will streamline import processes and tax collection on imports for the private sector and government of Guam. In addition to receiving funding from Interior, CQA received funding from the Guam government in August 2025 to implement ASYCUDA, according to CQA and Bureau of Statistics and Plans officials. CQA officials also noted that CQA was drafting the rules and regulations that would modernize, reform, amend, and add to Guam’s current entry processes and procedures for imported goods.
Furthermore, CQA and the Guam Visitors Bureau have implemented electronic declaration forms for arriving passengers. According to CQA officials, Guam launched its effort to digitize the form in 2021, to limit interaction between passengers and agency staff at the airport during the COVID-19 pandemic. Passengers may complete the electronic form before arriving in Guam or at kiosks in the customs arrivals area before approaching the inspection lanes. In August 2025, officials said that all passengers arriving at Guam’s Antonio B. Won Pat International Airport and Andersen Air Force Base were using the electronic system.
Equipment and Procurement
Recent Equipment Conditions
During our January 2025 visit to Guam, we observed that most of CQA’s essential inspection equipment for screening airline passengers’ baggage and cargo were nonfunctional. As of December 2025, CQA still had only one functioning x-ray machine to screen cargo; the other three x-ray machines in CQA’s possession had been broken for at least 3 years, according to CQA officials. As a result, CQA officers had to conduct time-consuming manual inspections of most cargo and baggage.
The following describes the status of CQA’s four x-ray machines we saw in January 2025, all of which were more than 10 years old, according to agency officials:
· A mobile x-ray machine acquired in 2015 had been CQA’s only operational x-ray machine for the past 3 years. Officials said the machine is used to screen cargo primarily at the seaport but may also be used at other locations requiring cargo inspections.
· Two baggage x-ray machines, donated to the agency in 2014 for airport operations, had been nonoperational since 2018 and 2021, respectively. The machines were outdated and therefore beyond repair.
· An x-ray machine from 2013, used to screen air freight cargo, had been nonoperational since 2022 due to procurement delays and the unavailability of a certified vendor to make necessary repairs.
Officials informed us that CQA received approval to acquire three new x-ray machines in fiscal year 2025 but had received only one machine that was not yet operational as of December 2025. The following describes the status of CQA’s plans for these three new machines, according to CQA officials in December 2025:
· The agency received a new handheld x-ray machine in November 2025 and planned to provide training to its staff before deploying the machine at Guam’s seaport. CQA officials estimated that the machine would be deployed in February 2026.
· CQA planned to place an x-ray machine at the airport in May 2026, after receiving the machine and providing training to staff. According to CQA officials, procurement of the machine resumed after a suspension of the process was lifted in November 2025.
· CQA’s procurement of another mobile x-ray machine, which the agency had intended to use primarily for container and other inspections at the seaport, was canceled after Guam government agencies’ review. CQA officials noted that the agency was working to identify local funds to re-engage in procurement in fiscal year 2026.
CQA staff also informed us that they had experienced other types of equipment shortages that required officers to find workarounds, in some cases using their own resources. For example, although CQA acquired 25 vehicles from October 2023 to August 2025, some vehicles had broken down or had nonfunctioning parts as of January 2025, according to agency officials. Officials said they had repeatedly asked CQA to procure vehicles or parts but had not received responses or received delayed responses. As a result, CQA staff said that they had used their own cars to conduct CQA business or used their own money to pay for batteries in CQA vehicles and, in some cases, waited more than a year for the agency to reimburse them.
Procurement Issues
CQA officials identified difficulties in procuring necessary equipment, including a cumbersome procurement process, turnover of CQA staff handling procurement, and a new financial system for Guam government procurement. Some of the difficulties with the previous and new Guam financial and procurement system may also affect other Guam government agencies and may not be unique to CQA. In 2023, we reported on Guam’s financial conditions and cited its independent auditor report’s finding about Guam’s inadequate financial management information system, which the government had expected to replace with a modern system.[32]
In 2024, the government began implementing the Guam Financial Management Information System, which is intended to cover Guam government agencies’ financial, payroll, and human resources information.[33] According to CQA officials, the system tracks data that include the agency’s expenditures, vendor payments, budget allotments, procurement transactions, financial account balances, and funding information on federal grants that CQA receives. The agency uses this system as its primary means to track its real-time funding status. In August 2025, CQA officials estimated that it takes about 3 to 4 months for a purchase request entered in the new system to be fully executed. However, as of August 2025, CQA was still waiting for the Department of Administration to approve some procurement requests submitted in January 2025.
CQA and other Guam government officials said that some CQA procurement staff have had difficulty in learning to use the government’s new financial system for processing procurement requests. Officials from the Department of Administration, which manages the new financial system, noted that agency officials can receive training and can ask the department for help with the procurement process. However, Department of Administration officials told us in January 2025 that they had not received requests for assistance from CQA staff. They also noted that the agency’s procurement requests were sometimes incomplete and did not meet requirements for the system’s data fields, causing the system to reject procurement requests and contributing to delays. Additionally, Guam officials noted that complex procurement requests require additional reviews to ensure compliance with Guam and federal laws and can thus contribute to delays.
Considerations for Evaluating Alternative Customs Models Include Legal Changes and Security Issues
Alternatives to Guam’s Current Model Include Those Used in Other U.S. Territories
To identify considerations related to Guam’s adopting a different customs model, we analyzed two alternatives based on those used in other U.S. territories—a “federalized” model, similar to Puerto Rico’s, and a “hybrid” model, similar to USVI’s.[34] We also analyzed, as a third alternative, maintaining Guam’s current model and increasing CQA funding.[35]
· Federalized model. As it does in Puerto Rico, CBP would administer Guam’s customs operations and impose customs user fees and U.S. tariffs in accordance with federal law[36] and the HTSUS.[37]
· Hybrid model. As in USVI, CBP would administer Guam’s customs operations, but Guam would set its own merchandise categories and passenger and cargo fees.
· Current model with more funding. CQA would continue to administer Guam’s customs operations and set passenger and cargo fees, and Guam would continue to determine its own merchandise categories. However, CQA would receive additional funding from higher fees.
Numerous Considerations May Be Relevant for Evaluating Alternatives to Guam’s Current Customs Model
We analyzed the three alternatives to Guam’s current customs model and identified the following considerations for evaluating each alternative: (1) legal changes and funding sources, (2) customs jurisdiction, (3) security and technology, and (4) staffing.[38] Table 2 summarizes selected considerations for each of the three alternatives.
|
Considerations |
Key questions |
Federalized modela |
Hybrid modelb |
Current model with increased fundingc |
|
Legal changes |
Would changes to federal or territorial law be required? |
Y (Federal and territorial) |
U (Federal and territorial) |
U (Territorial) |
|
Funding sources |
Would the funding source for Guam customs operations change? |
Y |
U |
U |
|
Customs jurisdiction |
Would customs officials in Guam be able to inspect cargo entering Guam from the U.S. customs territory?d |
N |
U |
Y |
|
Port security |
Would Guam port security requirements change? |
Y |
U |
N |
|
Technology |
Would an automated system be implemented for Guam customs?e |
Y |
Y |
Y |
|
Staffing |
Could staff currently employed at Guam’s Customs and Quarantine Agency continue working in customs?d |
U |
U |
Y |
Legend: Y = yes, N = no, U = uncertain.
Source: GAO analysis of federal and Guam agency documents and interviews with federal and Guam agency officials. | GAO‑26‑107811
aIn a federalized customs model similar to Puerto Rico’s, Guam would be part of the U.S. customs territory and U.S. Customs and Border Protection (CBP) would administer its customs. Answers shown assume that current federal law would be amended to include Guam in the U.S. customs territory and that other federal laws may be amended as necessary to conform to the addition of Guam.
bIn a hybrid customs model similar to USVI’s, Guam would remain outside the U.S. customs territory and CBP would administer its customs. Answers shown assume that Guam would adopt a customs model similar, but not necessarily identical, to the USVI model and that specific changes in a hybrid model would depend on a negotiated agreement between Guam and CBP.
cIf Guam kept its current customs model, Guam would remain outside the U.S. customs territory and continue to administer its own customs. Answers shown assume that no changes in federal law would be required but that the Guam government could decide to amend territorial law to impose tariffs on imports or could approve increases in passenger or cargo inspection fees.
dIn a federalized or hybrid customs model, CBP would administer customs operations in Guam. In the current model with increased funding, CQA would continue to administer customs operations.
eIn a federalized customs model similar to Puerto Rico’s, CBP would implement the Automated Commercial Environment (i.e., the federal government’s electronic trade processing system for imports and exports) in Guam. If Guam kept its current customs model, the government would implement the World Customs Organization’s Automated System for Customs Data. In a hybrid customs model, an automated system would be implemented in Guam, but it is unclear which system would be chosen.
Legal Changes and Funding Sources
|
CBP Administration of Customs in U.S. Territories Although U.S. Customs and Border Protection (CBP) currently administers customs only for Puerto Rico and the U.S. Virgin Islands (USVI), any U.S. territory can ask CBP to provide services on a reimbursable basis under U.S. law. For example, the USVI government requested that CBP inspect travelers and baggage before they leave the islands. As a result, travelers do not have to pass through customs when they enter the U.S. customs territory. Source: GAO analysis of information provided by CBP. | GAO‑26‑107811 |
Adopting a federalized model would require changes to federal law that would allow Guam to join the U.S. customs territory. CBP would also need to be authorized to administer customs in Guam and be reimbursed—for example, by establishing a trust fund to hold collected revenue.[39] In Puerto Rico, where customs operations are federalized, CBP officials told us that they collect duties and taxes and CBP uses the collected funds to pay for its customs-related operations, sending the Puerto Rico government any surplus funds. As in Puerto Rico, if the funds collected in Guam did not cover its costs, CBP would rely on federal appropriations. For example, according to CBP documents, CBP had to use federal funding to cover some of the costs of its operations in Puerto Rico in fiscal years 2017 and 2018.
All federal customs laws and regulations would be applicable in Guam if it were incorporated into the U.S. customs territory, according to CBP officials.[40] For example, CBP officials told us they would enforce the Security and Accountability for Every Port Act of 2006; the Tariff Act of 1930, as amended by the North American Free Trade Agreements Implementation Act; the Trade Act of 2002; and the Trade Facilitation and Trade Enforcement Act of 2015. The HTSUS sets the rates of duties collected for all goods imported into the U.S. customs territory. As a result, CBP would begin collecting duties on foreign imports to Guam at rates specified in the HTSUS. (See app. II for information about trade classifications in Guam, the World Customs Organization’s Harmonized System, and the HTSUS.)
Adopting a hybrid customs model similar to USVI’s would require Guam and CBP to formally agree that CBP would conduct Guam’s customs operations, according to CBP officials. Guam and CBP would also need to establish a means for Guam to reimburse CBP for its costs, such as through a trust fund to hold the fees collected by CBP or through direct reimbursement. If Guam adopted a hybrid model similar to USVI’s, CBP would expect to be fully reimbursed for its customs operations by the government of Guam and could not use appropriated funding for any shortfalls if CBP’s costs exceeded the revenues collected in Guam, according to CBP officials. Guam would not be required to collect U.S. duties in such a hybrid customs model because it would remain outside the U.S. customs territory. Further, in a hybrid model similar to USVI’s, federal laws would likely apply where Guam has not established local laws. For instance, in USVI, local customs law generally governs imports, but federal laws and regulations generally apply when there is no applicable USVI law or no U.S. law specifically applicable to USVI.[41]
If Guam maintained its current customs model, the Guam government could increase funding for CQA by modifying local laws to change the current passenger or cargo inspection fee structure or to impose tariffs. For example, stakeholders suggested basing the cargo inspection fee on the cargo’s value rather than its weight to increase the amount collected. CQA officials informed us that any fee change must be approved through a process detailed in Guam’s Administrative Adjudication Act, which requires agencies to submit proposed regulatory changes to the public and provide an assessment of the economic impact of the proposed rules. To increase funding by imposing tariffs, the Guam government would need to pass legislation to change its current status as a duty-free port, according to officials.
Stakeholders expressed concerns about the consequences of adopting a federalized customs model or maintaining Guam’s current model with increased funding. For example, some stakeholders expressed concern about Guam’s losing its status as a duty-free port if its customs were federalized or if it imposed its own tariffs, which could increase prices. In addition, some stakeholders said that increasing the passenger inspection fee might reduce tourism, while increasing cargo inspection fees might result in higher prices for consumers.
Customs Jurisdiction
In the federalized model, CBP generally would not have jurisdiction to inspect cargo and mail entering Guam from the U.S. customs territory, according to CBP and CQA officials. Guam stakeholders expressed concern that this could increase the risk that contraband, including drugs, would enter Guam. According to CQA drug seizure data, the majority of illicit drugs in Guam arrive from the rest of the United States. In addition, CBP officials told us that all federal customs laws would apply in Guam, although CBP would not be responsible for enforcing them all. CQA currently enforces federal laws and regulations for multiple federal agencies, according to CQA officials. For example, CQA officials said that the agency conducts agricultural inspections on behalf of USDA. If Guam customs were federalized, agencies such as CBP and USDA would carry out their responsibilities in Guam, as they do in other locations in the U.S. customs territory.
In a hybrid model similar to USVI’s, CBP could have jurisdiction to inspect cargo entering Guam from the U.S. customs territory, similar to CQA’s role in Guam’s current model.[42] For example, CBP could reach an agreement with the U.S. Postal Inspection Service regarding its inspection of mail entering Guam from the U.S. customs territory, similar to U.S. Postal Inspection Service policy in USVI.[43] In a hybrid model similar to USVI’s, federal customs laws would likely not apply in Guam. Instead, CBP would be responsible for enforcing Guam’s customs laws and certain relevant federal regulations, similar to its role in USVI.[44]
In Guam’s current customs model, CQA is authorized to inspect all incoming cargo. CQA’s 2021 memorandum of understanding with the U.S. Postal Inspection Service sets out the arrangement between the U.S. Postal Inspection Service and CQA for CQA officers to screen and inspect certain foreign-origin mail. The memorandum also notes that up to two CQA officers may be assigned to a taskforce to investigate trafficking of controlled substances, firearms, and money-laundering violations perpetrated in the U.S. mail.[45]
Port Security and Technology
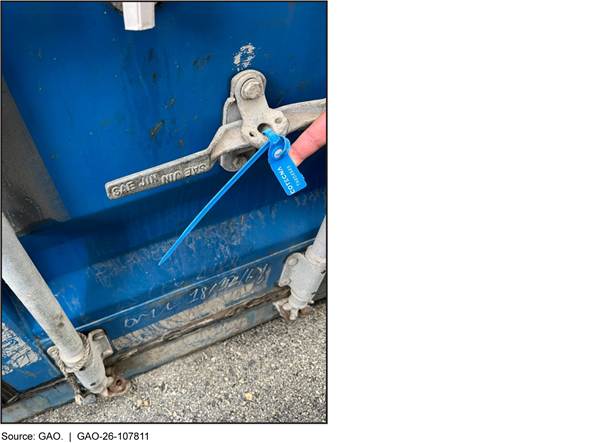
In the federalized model, Guam would be required to meet all port security requirements for the U.S. customs territory, according to CBP officials. Guam currently does not meet all such requirements. For example, CQA officials told us that some cargo container seals currently used in Guam do not comply with federal requirements under the SAFE Port Act.[46] Figure 8 shows a type of seal used on cargo entering Guam. According to agency officials, this type of seal is susceptible to breakage or tampering and may detach when containers are secured for transit from ships to ports. Other seals, such as bolt seals, are more resistant to breakage during transport and act as a stronger deterrent against tampering or unauthorized removal.[47] According to CBP officials, if Guam were to join the U.S. customs territory, Guam would need to update its security to comply with federal requirements.
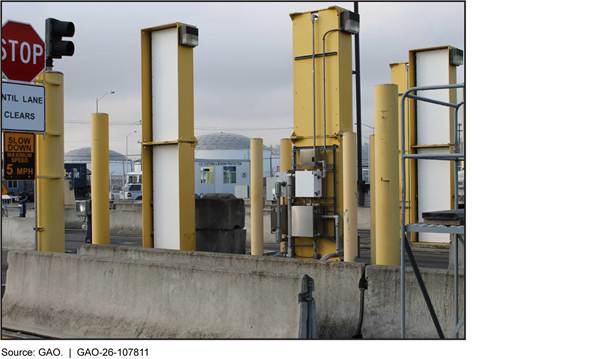
Additionally, in the federalized model or a hybrid model similar to USVI’s, transferring Guam’s customs operations to CBP could require the agency to make initial investments in technology and systems that CQA does not possess. CQA and CBP officials noted that CBP has access to advanced screening technology, data-sharing networks, and specialized training programs, not currently available to CQA, that could enhance enforcement efforts and improve efficiency at Guam’s ports of entry. In Puerto Rico, CBP uses mobile x-ray machines and radiation portal monitors to scan foreign cargo, as the SAFE Port Act requires at ports in the U.S. customs territory (see fig. 9).[48] CQA does not own radiation portal monitors, according to officials.
Furthermore, in the federalized model, CBP would have to establish, implement, and maintain CBP’s Automated Commercial Environment (ACE) system in Guam to meet requirements for customs processes within the U.S. customs territory, according to CBP officials. The ACE system uses the HTSUS to process goods and identify tariffs.[49]
In a hybrid model similar to USVI’s, an automated system would be implemented in Guam, though it is not clear which system would be chosen. For example, Guam and CBP could agree on CBP’s using ACE for some purposes, although doing so might initially increase CBP’s operating costs, according to CBP officials. In USVI, CBP uses ACE in a limited, supportive capacity because USVI has not adopted the HTSUS.[50] According to CBP officials, CBP cannot use appropriated funds to finance ACE implementation in USVI because it is outside the U.S. customs territory and the territory’s trust fund is the only source of funding. CBP officials estimated that integrating USVI tariffs into ACE would cost $7 million to $10 million.
If Guam does not adopt either a federalized model similar to Puerto Rico’s or a hybrid model similar to USVI’s, CQA will likely continue modernizing its customs operations. CQA officials noted in December 2025 that the agency was still pursuing the implementation of ASYCUDA, the automated customs data system developed by the UN Conference on Trade and Development. CQA has funding available to support ASYCUDA’s implementation and maintenance for the first 2 years and may finance maintenance costs in a variety of ways, such as through federal grant funding or through rate adjustments to provide additional revenue, according to officials.
Staffing
In the federalized model or a hybrid model similar to USVI’s, CBP might require employees in Guam to meet requirements—related, for example, to age, fitness, and background investigation—that apply to its employees in the rest of the United States but that CQA does not impose. CQA officials expressed concerns about whether CBP would hire CQA personnel if Guam adopted the federalized model or a hybrid customs model, and some officials said that not all current CQA staff would qualify to work at CBP. For example, according to CQA staffing data for February 2025, over half of CQA’s staff were older than the maximum age for new CBP customs officers.
If Guam adopted the federalized model or a hybrid model similar to USVI’s, the extent to which CBP would be able to recruit and retain employees in Guam is unclear. In 2024, we reported that CBP had taken several actions in recent years to bolster its recruitment efforts but had not always met its staffing targets for officers.[51] Factors such as high attrition rates in some locations, a lengthy hiring process, competition from other law enforcement agencies, and low employee morale affected CBP’s ability to recruit, hire, and retain staff. In addition, recruitment was inhibited by challenges such as negative public perceptions of law enforcement, declines in the general population’s physical fitness, and the requirement to work in geographically remote locations, according to our 2024 report.
CBP officials in Guam told us that the agency had not had attrition problems because most CBP employees there remain on the island for the duration of their careers. Additionally, CQA officials informed us that they could be hired by other Guam government agencies if CQA no longer existed as an agency. Guam government officials noted that dissolving CQA or transferring its staff to another agency could have broader fiscal and personnel implications, such as possible costs related to employee transitions, retirement options, service continuity, and potential furloughs.
Adopting an Alternative Customs Model Could Affect Several Aspects of Guam’s Economy
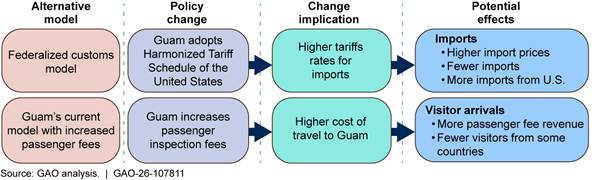
Adopting any of the alternative customs models we analyzed could affect Guam’s economy. For example, in the federalized model, imposition of U.S. tariffs would likely increase the prices of imports to Guam and decrease total import volumes. Adopting the HTSUS in the federalized model could also affect Guam government plans to expand the export market, including disrupting plans for value-added export operations in Guam. In a hybrid model similar to USVI’s, CBP inspections could help exporters in Guam qualify to export to the U.S. customs territory without paying duties under the HTSUS. If Guam maintained its current customs model but increased funding for CQA through a higher passenger fee, the fee increase would likely augment CQA’s revenue but could reduce the number of visitors from some countries. Figure 10 summarizes our analysis of potential effects on imports, in the federalized customs model, and on visitor arrivals, if Guam kept its current model but increased passenger fees.
Import Prices Would Likely Increase and Import Volumes Would Likely Change if Guam Customs Were Federalized
Federalizing Guam customs would likely result in higher prices for imported goods, fewer imports from foreign countries, and more goods from the U.S. customs territory. Under the federalized model, CBP would begin collecting tariffs at rates specified in the HTSUS.[52] Figure 11 shows the average effective tariffs that would have applied to Guam’s foreign imports under the HTSUS from 2017 through 2024.[53] For the entire period, the average effective tariff for Guam would have been about 1.6 percent, compared with 0.03 percent at Guam’s current cargo inspection fee rate.[54]
Figure 11: Average Hypothetical Effective Tariffs for Guam’s Foreign Imports if Guam Had Adopted the Harmonized Tariff Schedule of the United States, 2017–2024
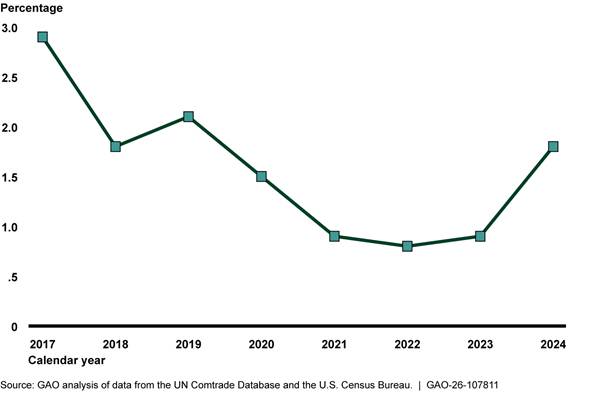
Notes: The Harmonized Commodity Description and Coding System, also known as the Harmonized System, is the World Customs Organization classification for traded products and serves as the basis for product classification in the Harmonized Tariff Schedule of the United States. The average effective tariff is a single value that represents the average tariff per dollar of imports across all import sources and products. We calculated the average effective tariff for each product at the Harmonized System’s four-digit heading level, and the assessed value of tariffs on all U.S. imports divided by the total value of imports in the category. To estimate Guam’s hypothetical tariff, we used the Harmonized System’s four-digit headings to weight this value by Guam’s imports of each product for all product categories Guam imported in each year.
Guam’s limited local manufacturing capacity and high levels of imports from other parts of the United States would affect potential economic outcomes of adopting the HTSUS in Guam.[55] First, Guam’s limited local manufacturing capacity would keep it dependent on imported goods despite increased costs due to tariffs. For example, in 2022, Guam’s manufacturing sector accounted for about 1 percent of the territory’s sales and revenue and 2 percent of its total private sector employment. As a result, Guam would likely be unable to replace imported goods with locally produced goods in response to higher prices resulting from tariffs in the short term. Therefore, if Guam customs were federalized, Guam would need to continue importing goods it cannot produce locally, but the prices for imports would generally rise.
Second, the magnitude of price and import changes after Guam adopted the HTSUS would depend on the share of imports sourced from the U.S. customs territory. Data that Guam’s Bureau of Statistics and Plans collected for March 2022 show that imports from the U.S. customs territory represented about 68 percent of Guam’s total imports.[56] Since such imports would not be subject to the HTSUS, higher shares of imports of specific U.S. products could mitigate any tariff-related price increases in Guam. Therefore, if its customs were federalized, Guam would likely import more goods from the U.S. customs territory than it would import under either of the other two alternative customs models. [57]
Using U.S. tariffs for January through June 2025, we analyzed the potential effects of imposing tariffs on imports to Guam under the federalized customs model.[58] Our analysis found that Guam’s adopting the HTSUS would likely increase the average import price, to varying extents, for five products we selected as examples (see fig. 12).[59] In addition, the imposition of tariffs would likely result in Guam’s importing smaller quantities of each of the five products.[60]
Figure 12: Simulated Effects on Prices and Quantity of Selected Imports to Guam Under the Harmonized Tariff Schedule of the United States
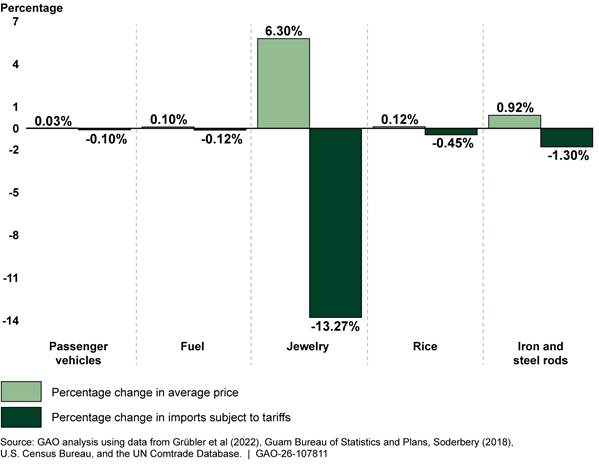
Note: The data shown reflect simulated changes to Guam’s imports in 2023, based on average effective tariffs in the Harmonized Tariff Schedule of the United States (HTSUS) from January 2025 to June 2025. The Harmonized Commodity Description and Coding System, also known as the Harmonized System, is the World Customs Organization classification for traded products and serves as the basis for product classification in the HTSUS. This graph includes estimates of price changes for passenger vehicles (Harmonized System heading 8703), fuel (heading 2710), jewelry (heading 7113), rice (heading 1006), and iron and steel rods (heading 7214). We estimated the percentage changes in prices by using the model developed by Riker and Schreiber. See David Riker and Samantha Schreiber, Structural Equations for PE Models in Group 1 (Perfect Competition) (U.S. International Trade Commission, Office of Economics, March 2020).
The results of our analysis suggest that, although prices of imported goods in Guam could increase if its customs operations were federalized, the effect on the price of specific products might differ on the basis of the new tariff and the import source. For passenger vehicles, the average effective tariff would be relatively high, at 13.1 percent; however, prices would increase by only 0.03 percent and quantities imported would decrease by just 0.10 percent because, according to the most recent data available, Guam imports most passenger vehicles from the U.S. customs territory. For fuel imports, the estimated share imported from the U.S. customs territory is only 10.6 percent, but price and quantity changes would be minor because the average effective tariff would be small (0.2 percent). In contrast, for jewelry—a luxury good purchased by tourists in Guam—relatively high tariffs would both increase the average price and shift the source of imports from foreign countries to U.S. sources, increasing the estimated share imported from the U.S. customs territory by 11.8 percent.[61]
Guam could increase CQA revenue by raising current cargo inspection fees without adopting the HTSUS. Although Guam is currently a duty-free port, it charges a weight-based cargo inspection fee, capped at $500 per bill of lading for noncontainerized bulk shipments, for all imports from both foreign sources and the rest of the United States. Guam could generate more revenue by either increasing the inspection fee per pound of cargo or increasing the fee cap per bill of lading. From 2017 through 2023, the weight-based fee was equivalent to about a 0.03 percent valued-based tariff on all imports to Guam. Stakeholders suggested that basing these fees on the goods’ value instead of their weight could increase CQA’s fee revenue, particularly for high-value goods. While observing customs procedures in the air cargo unit at CQA, we saw CQA charge a $7 fee for a package with a weight of about 100 kilograms and a listed value of about $116,000. If calculated as 0.03 percent of the package’s value, the fee would have been about $35.
Some stakeholders in Guam expressed more receptiveness to changes in existing cargo fees than to adoption of the HTSUS. Guam CQA officials and other stakeholders in Guam expressed concern about price increases under the HTSUS. Specifically, these stakeholders expressed concern that imposing tariffs would increase local prices and costs to consumers for fuel and for staple or basic goods, such as milk.[62] Additionally, according to CBP officials, foreign parts used to repair military and commercial vessels are currently imported duty free, making repairs in Guam less expensive than in the U.S. customs territory. However, these imports of repair parts would become subject to HTSUS tariffs in a federalized customs model.
Plans to Expand Guam’s Export Sector Could Be Affected by Adoption of a Federalized or Hybrid Customs Model
Adopting the federalized or hybrid customs model could affect the Guam government’s plans to expand the territory’s export sector.[63] Guam government officials expressed a desire to increase exports, particularly through value-added operations that take advantage of Guam’s duty-free port and are aimed at increasing exports to the U.S. customs territory.[64] Because of Guam’s small manufacturing sector, exports from Guam to other markets, including the U.S. customs territory, are currently limited, and more than half of Guam’s total exports consist of imports that are directly re-exported to other Pacific Island economies.[65]
All U.S. territories that are outside the U.S. customs territory (i.e., Guam, the CNMI, USVI, and American Samoa) can generally export products to the U.S. customs territory without paying HTSUS duties if less than 70 percent of the product’s total value comes from foreign materials.[66] However, from 2017 through 2021, only 2.4 percent, on average, of Guam’s total exports to the U.S. customs territory were eligible for this duty-free treatment, according to analysis by the U.S. International Trade Commission. According to officials of Guam’s Economic Development Authority, exporters in Guam typically do not know how to meet the requirements to qualify to export goods to the U.S. customs territory without paying duties under the HTSUS. The officials noted that additional cooperation with federal partners could enhance their ability to aid Guam exporters in complying with export requirements to qualify for duty-free treatment in the U.S. customs territory.
In a federalized customs model, Guam’s exports to other parts of the United States would be granted duty-free treatment rather than having to qualify for this treatment on the basis of foreign content. However, because any imports to Guam from outside the U.S. customs territory would be subject to HTSUS tariffs, adopting the federalized customs model could disrupt plans for value-added export operations in Guam. According to a recent report published by the Guam Economic Development Authority, one strategy for expanding Guam’s export sector is to import some raw materials duty-free and use them to manufacture or assemble final products that qualify for tariff-free export to the U.S. customs territory. However, in the federalized model, Guam’s importers would pay HTSUS duties on any raw materials imported from a foreign country for use in manufacturing final products for export to the U.S. customs territory.
In a hybrid customs model similar to USVI’s, additional CBP responsibilities could help support Guam government officials’ development goals for creating value-added manufacturing activities in the territory. For example, according to CBP officials in USVI, CBP officers are responsible for inspecting local factories, such as rum distilleries, to verify compliance with requirements for duty-free exports to the U.S. customs territory. Similar inspections could help new exporters in Guam qualify for duty-free exports to the U.S. customs territory.
Visitor Arrivals Could Decrease if Guam Kept Its Current Customs Model and Raised Its Passenger Inspection Fee
If Guam retained its current customs model, with additional funding for CQA, raising the passenger inspection fee would increase CQA revenue but could also reduce the overall number of visitors to Guam.[67] CQA’s passenger inspection fee currently represents a small share of total costs to travel to Guam and has not changed since 2013. In 2024, the $8.29 fee represented about 1.7 percent of the total costs of the average flight to Guam ($485) and 0.6 percent of the estimated average total cost of a trip to Guam ($1,473). However, because of inflation, the real value of the passenger inspection fee has declined by 25 percent since it was set in 2013. Figure 13 shows the nominal and real values of CQA’s passenger inspection fee from 2013 through 2024.
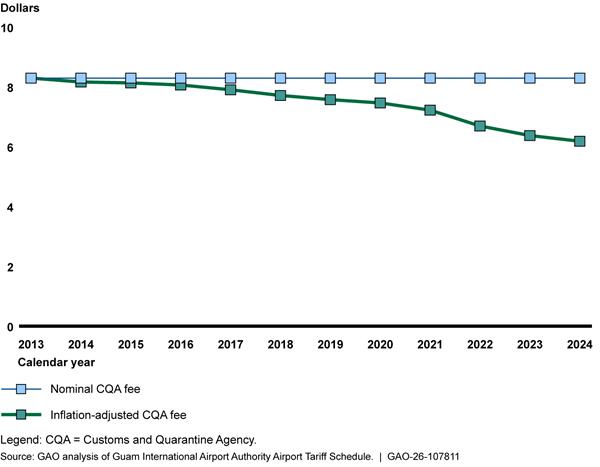
In contrast, the Guam Airport Authority collects passenger-related fees to fund its operations, including immigration inspection fees and an arrival facility service charge, and is able to update its fee annually. As a result, our analysis found that the fees set by the Guam Airport Authority are more responsive to inflation changes than the CQA’s passenger inspection fee. For example, in 2013 dollars, the real value of CQA’s passenger inspection fee declined from $7.90 to $6.18—about 22 percent—from 2017 to 2024, while the real value of Guam Airport Authority arrival facility service charges for signatories declined from $4.14 to $3.99—about 4 percent—over the same period.
Stakeholders expressed concern that a higher passenger inspection fee could decrease the number of visitors to Guam. A Guam Visitor’s Bureau official expressed opposition to any passenger fee increases, suggesting that a higher fee would increase the price of travel to Guam and decrease overall demand for visiting the island. Members of the Guam Tourism and Travel Association stated that any increase in travel costs to Guam, including CQA’s passenger inspection fee, would harm Guam’s tourist industry.
Although increasing the passenger inspection fee would likely increase CQA’s overall funding, our analysis shows that the number of visitors to Guam would likely decline as a result of the higher fees. Specifically, we found that, on average, a 1 percent increase in the cost of travel to Guam—including an increase in the CQA passenger inspection fee—was associated with a 0.9 percent decrease in visitor arrivals.[68] This effect varies by origin market of visitors to Guam. Our analysis predicts that the number of visitors from close-origin markets, including the CNMI, Palau, the Federated States of Micronesia, and Japan, would not decrease, on average, when the price of travel to Guam increased. The number of visitors from origins further from Guam, such as Canada, would tend, on average, to decrease more in response to price changes than the number from closer origins such as South Korea.
To further illustrate how changes to CQA’s visitor arrival fee could affect visitor arrivals, we estimated that raising CQA’s visitor arrival fee from $8.29 to $20 in 2024 would have had the following effects:
· More revenue for Guam CQA. The value of CQA’s passenger inspection fees in 2024 would have increased by 136 percent, or $8.3 million.
· Fewer visitor arrivals. Total visitor arrivals to Guam in 2024 would have decreased by 2 percent, or by about 15,000 total visitors, due to increases in travel costs.
· Reduced visitor spending. Given Guam Visitors Bureau estimates of visitor spending in 2024, this decline in visitors would have reduced total visitor spending by 2 percent, or about $22.7 million.[69]
Agency Comments and Our Evaluation
We provided a draft copy of this report to the Office of the Governor of Guam, to include CQA and other relevant Guam government agencies; the U.S. Departments of Agriculture, Homeland Security, and the Interior; and the U.S. Postal Service for review and comment. The Office of the Governor of Guam, on behalf of the government, and CQA provided comments that we have reproduced, with our responses, in appendixes VI and VII, respectively. Homeland Security, Interior, and the Postal Service provided technical comments that we incorporated as appropriate.
In their comments, the Office of the Governor of Guam stated that it agreed with many of our findings regarding the operational challenges facing CQA, and CQA noted that it welcomed several of our findings. Both the Governor’s office and CQA also commented on our selection of the three alternative customs models. For example, CQA took issue with our omission of a model under which CQA would have autonomy over its funding, hiring, and operations; the Governor’s office emphasized that it does not support the establishment of an autonomous customs authority that would not be subject to executive branch oversight. We maintain that our methodology for selecting as alternative models those that are currently used in U.S. territories is appropriate to our objectives. That is, examining existing customs models provided points of comparison that allowed us to identify broad considerations for evaluating each model as well as potential economic effects of adopting them.
In addition, the Governor’s office and CQA noted that our analysis of the selected alternative models does not address possible solutions for factors that our report describes as limiting CQA operations, such as CQA’s delayed procurement. We did not analyze how or whether adopting these models would address the factors that limit CQA operations, because such analysis was outside the scope of our review. The extent to which adopting any alternative customs model would address solutions for these factors is unclear, as management decisions and actions play a direct role in customs operations regardless of the model. Our analysis focused on broader considerations for evaluating the models and on some potential economic effects.
Furthermore, the Governor’s office and CQA disagreed with our finding that increasing CQA passenger inspection fees would likely have negative economic effects, including a decrease in visitor arrivals. Our methodology is appropriate to estimate the potential effect from raising passenger fees, which is part of the overall travel costs for visitors. While we estimate a decline in visitors overall, the effect varies by country of origin, with certain origins unlikely to experience a decline. See appendixes VI and VII for our detailed responses.
As agreed with your offices, unless you publicly announce the contents of this report earlier, we plan no further distribution until 30 days from the report date. At that time, we will send copies to the appropriate congressional committees; the Secretaries of Agriculture, Homeland Security, and the Interior; the Postmaster General and Chief Executive Officer of the U.S. Postal Service; the Governor of Guam; the Director of the Guam CQA; and other interested parties. In addition, the report will be available at no charge on the GAO website at http://www.gao.gov.
If you or your staff have any questions about this report, please contact me at elhodirin@gao.gov. Contact points for our Offices of Congressional Relations and Media Relations may be found on the last page of this report. GAO staff who made key contributions to this report are listed in appendix VIII.

Nagla’a El-Hodiri
Director, International Affairs and Trade
This report describes (1) factors limiting the Guam Customs and Quarantine Agency’s (CQA) operations, (2) considerations for evaluating selected alternative customs models for Guam, and (3) potential economic effects if Guam adopts one of the selected alternative models. We focused our work on the movement of goods, not people, into and out of Guam. As a result, we did not directly review immigration to Guam, which falls under the responsibility of U.S. Customs and Border Protection (CBP).
To address these objectives, we analyzed documents, interviewed U.S. federal and Guam government officials, and observed CQA’s operations in Guam. We reviewed Guam laws and regulations, CQA documents and data, and documents provided by other Guam government agencies, U.S. federal agencies, and other stakeholders. We traveled to Guam in January 2025 and met with CQA officials; other Guam government officials; and representatives of stakeholders such as the seaport and airport authorities, private companies, and nongovernmental organizations. We also visited offices, toured facilities, and observed CQA operations. In addition, we interviewed officials representing the U.S. Department of the Interior’s Office of Insular Affairs, the Department of Homeland Security’s CBP, and the Department of Agriculture’s Animal and Plant Health Inspection Service in Washington, D.C., and Guam. We also met with the governor of Guam via videoconference.
Specifically, to describe factors limiting CQA’s operations, we reviewed CQA’s and other agencies’ documents, including information about the status of CQA’s current paper-based system, automation efforts, equipment and supplies, and procurement.[70] In Guam, we toured CQA’s facilities and offices to observe CQA’s operations, such as CQA’s use and storage of paper documents and nonoperational x-ray machines. Furthermore, we interviewed CQA staff in various positions and divisions, including senior leaders, officers, and administrative staff, as well as Guam’s Department of Administration, Bureau of Statistics and Planning, and Office of Public Accountability.
To describe considerations for evaluating selected alternative customs models for Guam, we analyzed three possible alternatives: (1) Puerto Rico’s, (2) the U.S. Virgin Islands’ (USVI), and (3) Guam’s current model with additional CQA funding.[71] We selected Puerto Rico’s and USVI’s customs models because of the differences between these two models and Guam’s.[72]
We reviewed documents, including laws and legal documents, related to customs operations in Guam, Puerto Rico, and USVI and interviewed federal and territory officials. In addition to traveling to Guam in January 2025, we traveled to Puerto Rico and USVI in April 2025 to interview CBP officials administering those territories’ customs operations, local government officials, representatives of stakeholders such as the seaport and airport authorities, and other federal officials involved in the customs system. We visited offices, toured facilities, and observed customs operations in both territories. In Puerto Rico, we met with officials representing the office of the governor.
To describe the potential economic effects of Guam’s adopting one of the selected alternative models, we estimated the effects of policy changes on imports and visitor arrivals.[73] We searched for relevant studies of the effects of potential changes to Guam’s customs operations but did not find existing work on this topic. We used economic models that accounted for the unique features of Guam’s economy to estimate hypothetical changes to Guam imports under Puerto Rico’s federalized customs model and hypothetical changes to Guam visitor arrivals under Guam’s current model with higher passenger inspection fees.[74] For a detailed discussion of our methodology for, and results of, these economic models, see appendixes IV and V.
We simulated the effects of tariff changes on trade patterns, prices, and quantities of imports to Guam for five categories of selected product groups.[75] We identified the product groups on the basis of the value of imports to Guam, the estimated share of imports from the U.S. customs territory, and stakeholder suggestions.[76] Given recent changes to the Harmonized Tariff Schedule of the United States (HTSUS) and Guam’s data availability, we based these simulations on 2023 trade patterns, using data on average effective tariffs for January through June 2025.[77] We found these data sufficiently reliable for calculating hypothetical tariffs in Guam under the HTSUS and for simulating hypothetical changes to prices and quantities of imports of the selected products. For a more detailed description of this analysis, see appendix IV.
To understand how travelers to Guam might respond to an increase in passenger inspection fees, we simulated the effect of an increase in CQA passenger inspection fee on visitor arrivals, CQA revenue, and visitor spending in Guam. We analyzed the effects of travel cost differences on arrivals of travelers from various locations and over time from 2017 through 2023. We found these data sufficiently reliable for describing historical trends in Guam’s visitor arrivals and for our economic analysis. We assessed the effect that a 1 percent increase in the cost of travel to Guam would have on visitor arrivals per 1,000 arrivals,[78] holding all other price changes and determinants of visitor arrivals at a fixed level.[79] We applied the results of this economic analysis to visitor arrivals in Guam in 2024, estimating changes to visitor arrivals, CQA revenue, and visitor spending at different levels of CQA passenger inspection fees. For a more detailed description of this analysis, see appendix V.
We conducted this performance audit from September 2024 to March 2026 in accordance with generally accepted government auditing standards. Those standards require that we plan and perform the audit to obtain sufficient, appropriate evidence to provide a reasonable basis for our findings and conclusions based on our audit objectives. We believe that the evidence obtained provides a reasonable basis for our findings and conclusions based on our audit objectives.
World Customs Organization (WCO) Harmonized Commodity Description and Coding System (Harmonized System). The WCO Harmonized System, which is used by 212 member countries and economies, including the United States, serves as the basis for customs tariffs and for collection of international trade statistics. The system classifies traded products by chapter, with two-digit codes; by heading, with four-digit codes; and by subheading, with six-digit codes. This common classification allows for direct comparison of WCO members’ trade data.
Harmonized Tariff Schedule of the United States (HTSUS). Building on the WCO Harmonized System, the HTSUS includes more detailed product codes to classify U.S. tariffs (typically with eight-digit codes) and imports to the U.S. customs territory (typically with 10-digit codes). Although the HTSUS does not apply in the U.S. Virgin Islands (USVI),[80] U.S. Customs and Border Protection uses the HTSUS product classifications to record formal imports to USVI.[81]
Trade classification in Guam. The Guam Bureau of Statistics and Plans uses the WCO Harmonized System’s four-digit headings to record trade statistics. According to one bureau official, the bureau classifies these data manually, using Guam’s current paper-based customs process. Ongoing efforts to modernize Guam’s customs operations and introduce an automated system are intended to allow the bureau to produce trade statistics at the six-digit subheading level.
Figure 14 compares trade statistics classifications for lemons under Guam’s current system, the WCO Harmonized System, and the HTSUS to illustrate the changes in product classification that would result from Guam’s completing the automation of its current customs operations or Guam’s incorporation into the U.S. customs territory (i.e., if Guam’s customs operations were federalized).
Figure 14: Example of Import Product Classification under Guam’s Current Customs System Before and After Automation and If Guam’s Customs Were Federalized
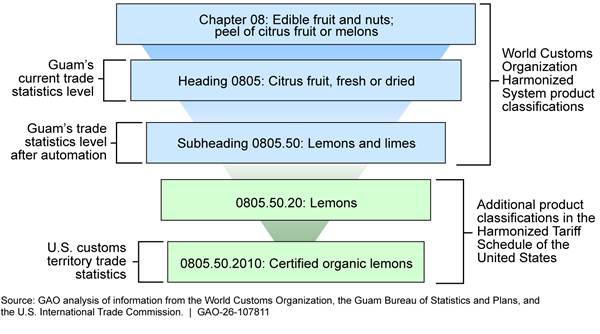
Note: The World Customs Organization Harmonized System is used by 212 member countries and economies, including the United States, and serves as the basis for customs tariffs and for collection of international trade statistics. The system’s two-digit chapters, four-digit headings, and six-digit subheadings appear in the Harmonized Tariff Schedule of the United States.
Appendix III: Import Values, Tariffs and Fees Collected, and Customs Operations Spending for Three U.S. Territories
In Puerto Rico and the U.S. Virgin Islands (USVI), U.S. Customs and Border Protection collects import duties and taxes on behalf of both territories, uses the collected funds to pay for its customs-related operations, and sends the governments any surplus funds.[82] In Guam, the Guam Customs and Quarantine Agency collects import taxes and fees, which it uses to fund its operations. Table 3 shows import values; duties, taxes, and fees collected; and total spending on customs operations for Puerto Rico, USVI, and Guam in 2022—the most current data available for all three territories.
Table 3: Total Import Values, Tariffs and Fees Collected, and Spending on Customs Operations for Puerto Rico, U.S. Virgin Islands, and Guam in 2022
|
|
Puerto Rico |
U.S. Virgin Islands |
Guam |
|
Total import valuea |
57,344.0 |
4,697.0 |
3,105.0 |
|
Total duties, excise taxes, and fees collectedb |
324.1c |
14.6 |
3.8 |
|
Total spending on customs operationsb |
167.8 |
10.3 |
19.1 |
Source: GAO analysis of data from the U.S. Bureau of Economic Analysis, Customs and Border Protection, and Guam government independent auditors. | GAO‑26‑107811
Note: Data on territorial imports for calendar and fiscal years 2022 were the most current data available for all three territories.
aFor calendar year 2022.
bFor fiscal year 2022.
cCBP’s financial system shows that gross collections of duties, taxes, and fees in Puerto Rico for fiscal year 2022 were $342.5 million, according to officials. The difference from the $324.1 million in the table was due to a sequester hold.
Appendix IV: Technical Summary of Analysis of Potential Effects on Imports if Guam Joined the U.S. Customs Territory
This appendix describes our analysis to simulate the potential ways that Guam’s joining the U.S. customs territory and adopting the Harmonized Tariff Schedule of the United States (HTSUS) could affect prices, import quantities, and import sources. Specifically, this appendix describes our (1) simulation model, (2) selection of product categories for the simulations, and (3) simulation results.
Simulation Model
To simulate the potential effect of imposing U.S. tariffs on Guam’s imports, we used the model from Riker and Schreiber (2020).[83] This model assumes that (1) there is no domestic production in the importing market and (2) there would continue to be no domestic production after the change in tariffs. This is a reasonable assumption for Guam because it has limited manufacturing. The model also assumes perfect competition in each product market.
System of Equations for Simulation
The simulation model is a series of five equations:
· Price equation (total industry constant elasticity of substitution price index)
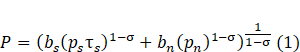
·
Demand equation—imports subject (s) to tariff change
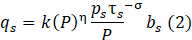
· Demand equation—imports not subject (n) to tariff change
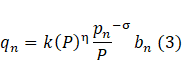
·
Supply equation—imports subject to tariffs

· Supply equation—imports not subject to tariffs
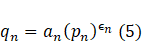
Variables for the Simulation
Table 4 provides definitions and sources for each of the variables in equations 1 through 5. In some cases, the variables are not inputs to the simulation model but were calculated from the pre-tariff change model inputs.
|
Variable |
Definition |
How variable operates in model |
Variable source |
|
|
Price of goods from subject (s) and nonsubject (n) imports |
Normalized to 1 in the baseline model. Adjusts on the basis of tariff change. |
N/A |
|
|
Aggregate industry price index |
Calculated using prices of subject and nonsubject imports, elasticity of substitution, and other calculated variables. |
N/A |
|
|
Quantity of goods from subject (s) and nonsubject (n) imports |
Proxied by import value (since prices are normalized to 1, import value of $100 would imply quantity of 100 units). Adjusts on the basis of tariff change. |
United Nations (UN) Comtrade and Guam Bureau of Statistics and Plans. We used the bureau’s data to approximate U.S. exports of each product to Guam. |
|
|
1+tariff |
Model “shock” that drives changes in prices and quantities of imports. |
U.S. Census Bureau (tariff), UN Comtrade (value of Guam’s imports by country). This variable is initially set to 1, reflecting Guam’s current status as a duty-free port. The tariff change for each sector under federalization is calculated as the average of the average effective tariff for each exporter in the first 6 months of 2025, weighted by the value of imports to Guam in 2023. |
|
|
Elasticity of substitution between imported products |
Defines extent to which consumers see products from various markets as substitutes. Higher values indicate more substitution. |
Soderbery (2018).a We used data for exports to Fiji, because its gross domestic product (GDP), imports, and tourism are similar to Guam’s. If data for exports to Fiji were not available, we used data for exports to French Polynesia. |
|
|
Parameters of preference symmetries and differences in product quality |
Calculated from initial values input into the model. |
N/A |
|
|
Demand parameter |
Calculated from initial values on the basis of total market size. |
N/A |
|
|
Price elasticity of total demand in the industry |
Sensitivity of product demand to price changes. Higher values indicate importers are more sensitive to price changes. |
Grübler et al (2022).b We used data for imports to Fiji because its GDP, imports, and tourism are similar to Guam’s. |
|
|
Export supply price elasticity |
Sensitivity of product supply to price changes. Higher values indicate that exporters are more sensitive to price changes in the importing market. The export supply price elasticity for exports from subject countries to Guam is equivalent to the import supply price elasticity for imports by Guam from subject countries. |
Soderbery (2018). We used values for exports to Fiji, because its GDP, imports, and tourism are similar to Guam’s. If data for Fiji were not available, we used data for exports to French Polynesia. |
|
|
Supply parameter. |
Calculated from initial values input into the model. |
N/A |


Source: GAO analysis using data from Grübler et al (2022), Soderbery (2018), U.S. Census Bureau, United Nations Comtrade database, and Guam Bureau of Statistics and Plans. | GAO‑26‑107811
aAnson Soderbery, “Trade Elasticities, Heterogeneity, and Optimal Tariffs,” Journal of International Economics, vol. 114 (2018): 44–62.
bJulia Grübler, Mahdi Ghodsi, and Robert Stehrer, “Import Demand Elasticities Revisited,” Journal of International Trade and Economic Development, vol. 31, no. 1, (2022): 46–74.
Approximating Tariffs for Guam Under the HTSUS
Because Guam is currently a duty-free port, we calculated average effective tariffs for Guam by using U.S. Census data for the assessed value of duties on all U.S. imports.[84] Specifically, we calculated the effective tariff as the assessed value of duties on all U.S. imports of a product p from country i in time period t, divided by the total value of imports in the category (equation 1). The data were collected by U.S. Customs and Border Protection and reported by the U.S. Census Bureau.
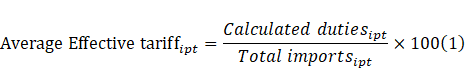
We used this effective tariff measure instead of the duty rates set by the HTSUS because Guam trade data are more aggregated than the HTSUS and because the HTSUS rates are not uniformly implemented as percentages (e.g., 3 percent of a product’s value) and differ by import partner and over time. This methodology also can account for changes to the HTSUS in 2025. Our analysis used 2023 trade data (the latest year of available import data for Guam for all import partners) and calculated average effective tariffs for U.S. imports in the first 6 months of 2025.
Calibrating and Solving Simulation Model
After inputting all of the noncalculated variables in the model, we took the following two steps to solve the model and produce simulation results:
1. Calibrated parameters from initial model values. We used the inputted trade values, initial tariffs (zero for all imports to Guam), and elasticity values to calculate model parameters.
2.
Re-solved equations for new prices after tariff change. We used
the inputted trade values, new duty rates (tariffs under the HTSUS), elasticity
values, and calculated model parameters from stage 1 to calculate changes to
prices and quantities of imports for subject and nonsubject imports. First, the
model substitutes equation 1 into the P terms in equations 2 and 3. Next, this
stage sets equation 2 equal to equation 4 (quantity demanded for goods subject
to tariffs equals quantity supplied) and equation 3 equal to equation 5
(quantity demanded for goods not subject to tariffs equals quantity supplied)
and solves the two-equation system for an equilibrium price of subject and
nonsubject goods ( . We substituted those solutions
back into equation 1 for the new equilibrium price for the whole market and
into equations 2 and 3 to obtain new equilibrium quantities. Finally, the
difference between the new prices and quantities and the initial values (e.g.,
Guam’s 2023 imports) represent the estimated changes in prices and quantities
after the tariff changes.
. We substituted those solutions
back into equation 1 for the new equilibrium price for the whole market and
into equations 2 and 3 to obtain new equilibrium quantities. Finally, the
difference between the new prices and quantities and the initial values (e.g.,
Guam’s 2023 imports) represent the estimated changes in prices and quantities
after the tariff changes.
To complete these model steps, we relied on the Microsoft™ Excel solver provided as a supplement to Riker and Schreiber (2020). Since the equations in this model are nonlinear, the solver simplifies the calculation using a multistep Euler approximation of the nonlinear solution to the system of two demand and supply equilibrium equations described above. The Euler approximation, which divides overall tariff changes into 3,000 intermediate steps, is a more accurate way to solve the system of equations than a single linear approximation of the system would be, because it mitigates the inaccuracy of linear approximation for large changes in duty rates.
Product Category Selection
Our analysis focused on five product categories to illustrate the potential effects of Guam’s adopting the HTSUS. We selected specific product categories to model, using data from Guam’s Bureau of Statistics and Plans and UN Comtrade and stakeholder input regarding important products in Guam’s economy. The selected product categories reflect high values of non-U.S. imports to Guam and offer a mix of import shares from the U.S. customs territory and from non-U.S. sources as well as a mix of end uses, ranging from consumption goods to intermediate goods. We selected the following five product categories:
· Motor cars and other motor vehicles principally designed for the transport of persons (other than those of heading 8702), including station wagons and racing cars (Harmonized System heading 8703).[85] According to data from the UN Comtrade database, passenger vehicles were one of the top 10 products by value imported by Guam from non-U.S. sources from 2017 through 2024 and are an example of a consumer product.
· Petroleum oils and oils obtained from bituminous minerals other than crude; preparations not elsewhere specified or included, containing by weight 70 percent or more of petroleum oils or of oils obtained from bituminous minerals, these oils being the basic constituents of the preparations; waste oils (Harmonized System heading 2710). According to data from the UN Comtrade database, petroleum oils are one of the top 10 products by value imported by Guam from non-U.S. sources in 2017 through 2024 and are an example of intermediate goods. Additionally, CQA officials specifically expressed concern about potential price increases of fuel from Singapore if Guam customs operations were federalized.
· Articles of jewelry and parts thereof, of precious metal or of metal clad with precious metal (Harmonized System heading 7113). According to data from the UN Comtrade database, jewelry was one of the top 10 products by value imported by Guam from non-U.S. sources in 2017 through 2024 and is an example of a luxury good import to Guam. Several stakeholders in Guam mentioned that historically, tourists from Asia have travelled to Guam for tariff-free luxury goods shopping.
· Rice (Harmonized System heading 1006). Rice was one of the top 20 products by value imported by Guam in February 2017, November 2018, and December 2021, according to data from Guam’s Bureau of Statistics and Plans. Additionally, CQA officials suggested that this commodity would be a good example of a staple imported good.
· Other bars and rods of iron or nonalloy steel, not further worked than forged, hot-rolled, hot-drawn or hot-extruded, but including those twisted after rolling (Harmonized System heading 7214). According to data from the UN Comtrade database, iron and steel rods were one of the top 10 products by value imported by Guam from non-U.S. sources in 2017 through 2024 and are an example of an intermediate good that may be used in the construction sector. Officials at the Guam Economic Development Authority described the construction sector as one of the “three pillars” of Guam’s economy.
Table 5 shows the inputs to the simulation model for the five selected product categories. Using effective tariffs for 2025 means that all nonsubject imports are from the U.S. customs territory, while average effective tariffs cover all other import sources. Export supply elasticities are less than 1 in some cases, suggesting that exporters supply of products to Guam are not sensitive to changes in prices. This likely reflects the small market size of Pacific Island economies such as Fiji (the source of these estimates) and Guam.
|
Model input |
Product category (Harmonized System heading) |
||||
|
Passenger vehicles (8703) |
Fuel |
Jewelry |
Rice |
Iron and
steel rods |
|
|
|
13.1% |
0.2% |
11.7% |
3.5% |
9.4% |
|
|
98.2 |
785.1 |
8.4 |
1.1 |
10.3 |
|
|
321.0 |
92.8 |
3.8 |
1.6 |
3.3 |
|
|
0.008 |
1.1 |
4.2 |
0.1 |
0.2 |
|
|
0.007 |
0.1 |
4.3 |
4.2 |
0.2 |
|
|
6.7 |
3.5 |
5.0 |
2.6 |
6.4 |
|
|
-0.8 |
-1.1 |
-1.0 |
-0.9 |
-1.1 |
Source: GAO analysis using data from Grübler et al. (2022), Soderbery (2018), the U.S. Census Bureau, the United Nations Comtrade database, and Guam Bureau of Statistics and Plans. | GAO‑26‑107811
Results
Table 6 shows the results of our economic simulation for the five selected categories if Guam were to adopt the HTSUS. For all five categories, an increase in the tariff for imported goods to Guam would likely increase prices for consumers and decrease the volume of imports from sources subject to tariffs. For three of the five categories, this decrease in imports from sources subject to tariffs would be somewhat mitigated by an increase in imports from countries not subject to tariffs. Since the U.S. customs territory is the only source not subject to tariffs in these simulations, imports from the U.S. customs territory would likely increase in response to tariffs.
Table 6: Simulation Results for Selected Examples of Guam’s Imports Under Harmonized Tariff Schedule of the United States (HTSUS)
|
Results |
Product category (Harmonized System heading) |
||||
|
Passenger vehicles (8703) |
Fuel (2710) |
Jewelry (7113) |
Rice |
Iron and steel rods (7214) |
|
|
Percentage change in average price to consumers |
0.03% |
0.1% |
6.3% |
0.1% |
0.9% |
|
Percentage change in quantity of tariffed imports |
-0.1% |
-0.1% |
-13.3% |
-0.5% |
-1.3% |
|
Percentage change in quantity of nontariffed imports |
0.00% |
0.01% |
11.8% |
0.1% |
0.1% |
Source: GAO analysis using data from Grübler et al (2022), Soderbery (2018), the U.S. Census Bureau, the UN Comtrade database and Guam Bureau of Statistics and Plans. | GAO‑26‑107811
Several factors may affect the specific magnitude of these results. First, all of the elasticity values were estimated with data from Fiji and French Polynesia, so the actual responses in Guam to tariff changes may differ from these responses. Second, actual tariffs in Guam if its customs operations were federalized could vary if the mix of imported products from Guam differed from U.S. customs territory imports or as a result of any changes to the HTSUS after June 2025. Additionally, this model considers the effects of tariff changes on final imports for consumption only and does not consider whether U.S. tariffs on intermediate goods could also result in higher prices for Guam’s imports.
Sensitivity Tests
Given that the elasticity parameters in this model are estimated with data from Fiji and French Polynesia rather than data from Guam, we conducted two sensitivity checks of the model using different elasticity parameters. To conduct the first sensitivity check, we produced a range of simulation results by increasing and decreasing all elasticity parameters by 20 percent (see table 7). This robustness check shows that the results for the quantity of tariffed imports are more sensitive to changes in the elasticity values than prices or nontariffed imports. In most sectors, these ranges show variation smaller than 1 percentage point, while the variation for jewelry is smaller than 6 percentage points.
Table 7: Sensitivity of Model Results to 20 Percent Increase and Decrease in All Elasticity Parameters
|
|
Product category (Harmonized System heading) |
||||
|
Results |
Passenger vehicles (8703) |
Fuel |
Jewelry |
Rice |
Iron and steel rods (7214) |
|
Percentage change in average price to consumers |
0.03a |
0.10a |
6.27 – 6.32 |
0.12a |
0.92a |
|
Percentage change in quantity of tariffed imports |
-0.08 – -0.12 |
-0.10 – -0.15 |
-10.70 – -15.81 |
-0.36 – -0.54 |
-1.04 – -1.55 |
|
Percentage change in quantity of nontariffed imports |
0.00a |
0.01a |
9.37 – 14.12 |
0.10 – 0.15 |
0.10 – 0.15 |
Source:GAO analysis using data from Grübler et al (2022), Soderbery (2018), the U.S. Census Bureau, the UN Comtrade database and Guam Bureau of Statistics and Plans. | GAO‑26‑107811
Note: This table presents a range of estimated changes in price for consumers and in quantity of tariffed and nontariffed imports after we increased and decreased the elasticity parameters in the model by 20 percent.
aChanges to these results were smaller than we can represent with two decimal places.
To conduct a second sensitivity check, we replaced the elasticity parameters for Fiji and French Polynesia with the average elasticity parameters for other small island countries. Specifically, we selected other island countries that the World Bank classified as both tourism dependent and commodity importers and for which both sources of elasticity data were available.[86] While Guam shares these characteristics with other island countries, many of the comparison countries are located in the Caribbean rather than the Pacific and are geographically closer than Guam to large markets, such as the contiguous United States.
As table 8 shows, the effects in this sensitivity test are similar to our main results for fuel and rice, with results within 0.4 percentage points of the result shown in table 6. For passenger vehicles and for iron and steel rods, the effect of tariff changes is larger than in our main specification, while the effect for jewelry is smaller. Taken together, these results show that Guam’s adoption of the HTSUS would likely increase prices and decrease import quantities, but the specific magnitude of these effects is somewhat sensitive to the choice of elasticity values.
|
|
Product category (Harmonized System heading) |
||||
|
Results |
Passenger vehicles (8703) |
Fuel |
Jewelry |
Rice |
Iron and steel rods (7214) |
|
Percentage change in average price to consumers |
1.50 |
0.11 |
3.92 |
0.03 |
5.07 |
|
Percentage change in quantity of tariffed imports |
-7.87 |
-0.18 |
-4.76 |
-0.10 |
-8.14 |
|
Percentage change in Quantity of nontariffed imports |
0.85 |
0.04 |
0.71 |
0.00a |
7.91 |
Source: GAO analysis using data from Grübler et al (2022), Soderbery (2018), the U.S. Census Bureau, the UN Comtrade database and Guam Bureau of Statistics and Plans. GAO‑26‑107811
aChanges to this result were smaller than we can represent with two decimal places.
Appendix V: Technical Summary of Analysis of Relationship Between Travel Costs and Visitor Arrivals in Guam
This appendix describes our regression analysis of the relationship between potential changes in travel costs and visitor arrivals in Guam. Specifically, this appendix describes the (1) regression model used, (2) data inputs, (3) regression results, and (4) simulated effects based on regression results.
Regression Model
Theoretical Framework
We used a gravity model to assess the relationship between travel costs—including passenger inspection fees assessed by the Guam Customs and Quarantine Agency (CQA)—and visitor arrivals to Guam.[87] According to Rosselló Nadel and Santana Gallego, although the economic literature has several possible economic models for modeling tourism demand, a gravity model is the preferred approach for research focused on assessing the effect of a specific policy, such as fees.[88]
The theoretical gravity model in economics was developed to model international trade flows, but Santana Gallego and Paniagua adapted the theoretical framework for tourism flows.[89] In their model, visitor arrivals from origin i to destination j are defined by equation 1:
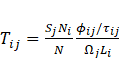 (1)
(1)
In equation 1, the first term represents the distribution of visitors from origin i to different destination markets absent any frictions related to travel. For example, if tourists from country i make up 10 percent of the total global tourists, in a world where all destinations are equally accessible to origin i, visitors from i will make up 10 percent of all visitors at all destinations, including destination j. The second term represents frictions that may influence the specific distribution of visitors to each destination, including information about the destination, costs of travel, and characteristics specific to the origin and destination markets:
·
 = Number of tourists that travel
to destination j from all origins.
= Number of tourists that travel
to destination j from all origins.
·
 = Total population in origin i.
·  =
Total global tourists.
=
Total global tourists.
·
 = Information parameter (
 ). Higher values of this
parameter indicate that potential visitors from origin i have better
information about travelling to destination j than other destinations. If the
parameter = 0, potential visitors are not aware of the destination. For
example, potential visitors from the United States may have better information
(higher value of
). Higher values of this
parameter indicate that potential visitors from origin i have better
information about travelling to destination j than other destinations. If the
parameter = 0, potential visitors are not aware of the destination. For
example, potential visitors from the United States may have better information
(higher value of  ) about travelling to other
English-speaking countries than travelling to non-English-speaking countries.
) about travelling to other
English-speaking countries than travelling to non-English-speaking countries.
·
 = Travel cost term (
 ): Cost of travel from i
to j.
): Cost of travel from i
to j.
·
 = Origin multilateral
resistance—captures characteristics related to the origin in the larger world
context.
= Origin multilateral
resistance—captures characteristics related to the origin in the larger world
context.
·
 = Destination multilateral
resistance—captures characteristics related to the destination in the larger
world context.
= Destination multilateral
resistance—captures characteristics related to the destination in the larger
world context.
Empirical Specification
Economic research has identified several important
measures of travel costs ( in equation 1), which we
incorporated into our regression model. Onaforwa and Owoye note that the price
of tourism includes the cost of living in a destination (typically proxied by
consumer price indices and exchange rates) and travel to the tourist destination.[90] Costs of traveling to the
destination are typically proxied by distance, airfare costs, and flight or oil
price indexes. To measure the cost of travel to Guam, we adapt the empirical
specification proposed by Storeygard to measure the effect of transport costs
on income of sub-Saharan African cities.[91]
Storeygard measures transport costs by using two components, fuel prices, which
vary over time but not across cities, and road distance between cities, which
varies across space but not time. Storeygard interacts these terms to measure
the effect of changes on fuel costs on near and far cities. Our specification
adopts this logic and interacts distance with a monthly price index for U.S.
flights.[92]
in equation 1), which we
incorporated into our regression model. Onaforwa and Owoye note that the price
of tourism includes the cost of living in a destination (typically proxied by
consumer price indices and exchange rates) and travel to the tourist destination.[90] Costs of traveling to the
destination are typically proxied by distance, airfare costs, and flight or oil
price indexes. To measure the cost of travel to Guam, we adapt the empirical
specification proposed by Storeygard to measure the effect of transport costs
on income of sub-Saharan African cities.[91]
Storeygard measures transport costs by using two components, fuel prices, which
vary over time but not across cities, and road distance between cities, which
varies across space but not time. Storeygard interacts these terms to measure
the effect of changes on fuel costs on near and far cities. Our specification
adopts this logic and interacts distance with a monthly price index for U.S.
flights.[92]
Previous studies have shown that, in addition to these variables, the presence of a direct flight may be particularly important for tourism in small island economies such as Guam’s.[93] We also included a control for whether visitors to Guam can enter without obtaining a visa, since Guam and the Commonwealth of the Northern Mariana Islands (CNMI) are part of a special program that allows visa-free entry into the territories.[94]
Equation 4 represents the estimating equation to show how Guam’s visitor arrivals per 1,000 people from destination i in month m (the dependent variable) vary on the basis of relative costs of travel to Guam as well as characteristics of the origin markets of visitors and global tourism demand (the independent variables). Equation 2 is estimated with a Poisson Pseudo Maximum Likelihood estimator, which corrects for heteroskedasticity and does not drop observations where the number of visitor arrivals is zero.[95]

In equation 2, the  terms (
 represent the association
between the independent variables and visitor arrivals to Guam. Since equation
2 is estimated nonlinearly, each term ( must be transformed before it
can be interpreted as a percentage change in visitor arrivals. This
transformation is defined in equation 3.[96]
Specifically, the predicted percentage change in visitor arrivals depends on
the value of the estimated coefficient
represent the association
between the independent variables and visitor arrivals to Guam. Since equation
2 is estimated nonlinearly, each term ( must be transformed before it
can be interpreted as a percentage change in visitor arrivals. This
transformation is defined in equation 3.[96]
Specifically, the predicted percentage change in visitor arrivals depends on
the value of the estimated coefficient  and the change in the
independent variable of interest
and the change in the
independent variable of interest  :
:
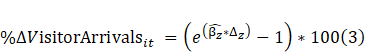
Since we are interested in the combined effect of the flight price term and the interaction between flight prices and distance (which assumes that price changes affect longer distances more than shorter distances), measuring the average effect of a price change on visitor arrivals to Guam means choosing a fixed value of distance. The equation to calculate this combined effect is show in equation 4. We choose the visitor-arrival weighted average distance of the observations in our sample:

The  term in equation 2 represents 20
fixed effects for each origin of visitors to Guam and is used to account for
specific characteristics of the origin market, such as market size, and
characteristics of the origin–Guam relationship, such as common language. In
our preferred specification, the
term in equation 2 represents 20
fixed effects for each origin of visitors to Guam and is used to account for
specific characteristics of the origin market, such as market size, and
characteristics of the origin–Guam relationship, such as common language. In
our preferred specification, the  and
and  terms represent time-related
fixed effects that account for global trends that vary across years (
terms represent time-related
fixed effects that account for global trends that vary across years ( , such as the worldwide decline
in travel during the COVID-19 pandemic, and seasonal monthly trends
, such as the worldwide decline
in travel during the COVID-19 pandemic, and seasonal monthly trends  . Across various specifications
of the model, we use different versions of these time-related fixed effects,
including year alone (e.g., 2023), year and seasonal month fixed effects
(January in every year), and month-year fixed effects (e.g., January 2023).
. Across various specifications
of the model, we use different versions of these time-related fixed effects,
including year alone (e.g., 2023), year and seasonal month fixed effects
(January in every year), and month-year fixed effects (e.g., January 2023).
Data Inputs
Table 9 describes the sources associated with each of the variables in equation 2. Our sample period is January 2017 through December 2023, reflecting the latest month and year with available data for all variables.[97] In our main specification, we exclude observations from March 2020 to December 2021 because of the unique travel conditions during the COVID-19 pandemic.
Table 9: Variables Used in Regression Analysis to Estimate Association Between Travel Costs and Visitor Arrivals to Guam
|
Variables |
Description |
Source |
|
Outcome (dependent) variable |
||
|
Visitor arrivals per 1,000 people to Guam by origin and month |
Includes all air arrivals to Guam (civilian and military) by origin and month. Visitors from the Commonwealth of the Northern Mariana Islands (CNMI) are considered a different origin than visitors from the rest of the United States. Arrival data is normalized by population of visitor origin. |
Guam Visitors Bureau (arrival data) and World Bank World Development Indicators (population data). |
|
Independent variables |
||
|
Distance |
Measures the population-weighted geographic distance in kilometers between the origin market and Guam. |
Gurevich and Herman (2018)b |
|
Flight price |
Captures seasonally adjusted average airfares for both domestic and international U.S. non-business airline travel. The natural log of this variable is used in in the regression model. |
U.S. Bureau of Labor Statistics |
|
Seat capacity |
Measures the number of airline seats available on direct flights between the visitor origin and Guam. To account for zero values in the seat capacity data, we use the log of seat capacity +1. |
Guam Visitors Bureau |
|
Visa-free entry |
Equals 1 for visitors who can enter Guam without a visa, and otherwise equals 0. Visa-free entry includes U.S. citizens, citizens of the freely associated states, and members of the Guam–CNMI Visa Waiver Program.a |
Constructed by GAO |
|
Real effective exchange rate |
Measures international price competitiveness for each country and measured as the geometric trade-weighted averages of bilateral exchange rates, adjusted for relative consumer prices. An increase in the real effective exchange rate indicates a real appreciation of a country’s currency relative to currencies in the rest of the world. |
Bank of International Settlements |
|
Bilateral exchange rate |
Measures the nominal value of a U.S. dollar relative to other currencies. An increase in the bilateral exchange rate indicates a depreciation of a country’s currency relative to the U.S. dollar. |
Bank of International Settlements |
|
Origin indicators |
Generates a variable for each of the visitor origins in each year, to account for specific characteristics of each origin market, such as market size, across 2017–2023. |
Constructed by GAO |
|
Year indicators |
Generates a variable for each year in the sample to account for trends in travel in each year, except the first, which is omitted. |
Constructed by GAO |
|
Month-year indicators |
Generates a variable for each month and year in the sample, except the first, which is omitted. |
Constructed by GAO |
Source: GAO analysis of data from the Guam Visitors Bureau, the U.S. Bureau of Labor Statistics, Gurevitch and Herman (2018), and the Bank of International Settlements. | GAO‑26‑107811
aParticipants in the Guam–CNMI Visa Waiver Program are Australia, Brunei, Hong Kong, Japan, Malaysia, Nauru, New Zealand, Papua New Guinea, South Korea, Singapore, Taiwan, and the United Kingdom. Russian citizens were also eligible for visa free entry to Guam from January 2012 through September 2019 on a case-by-case basis and were included in the visa-free category from January 2017 through September 2019.
bTamara Gurevich and Peter Herman, “The Dynamic Gravity Dataset: 1948–2016,” U.S. International Trade Commission Working Paper 2018-02-A (2018).
Table 10 provides summary statistics for the variables used in the regression.
Table 10: Summary Statistics for Variables Used in Regression Analysis to Estimate Association Between Travel Costs and Visitor Arrivals to Guam
|
Variable |
Mean |
Standard deviation |
Minimum |
Maximum |
Total observations |
|
Visitor arrivals (raw) |
4,247 |
13,208 |
0 |
78,609 |
1,428 |
|
Visitor arrivals per 1,000 people |
2.8 |
7.7 |
0 |
53.7 |
1,428 |
|
Seat capacity (number of airline seats) |
7,452 |
17,506 |
0 |
95,471 |
1,332 |
|
Distance (population weighted km) |
4,627 |
3,337 |
222 |
11,848 |
1,428 |
|
Flight price index (Jan. 2017 = 1) |
0.9 |
0.1 |
0.7 |
1.1 |
1,428 |
|
Real effective exchange rate (2020 dollars) |
100.1 |
6.5 |
71.4 |
149.9 |
1,405 |
|
Bilateral exchange rate |
463.5 |
2,912.8 |
0.81 |
24,079.1 |
1,428 |
|
Visa-free entry |
0.7 |
0.5 |
0 |
1 |
1,428 |
Source: GAO analysis of data from the Guam Visitors Bureau, the U.S. Bureau of Labor Statistics, Gurevitch and Herman (2018), and the Bank of International Settlements. | GAO‑26‑107811
Regression Results
The results of this regression analysis show that visitor arrivals, on average, tend to decrease in response to increases in travel costs, and that the effect is larger for visitors traveling from origin markets farther from Guam. In our preferred specification of the model, we find that on average, a 1 percent increase in the cost of travel to Guam decreases visitor arrivals by 0.9 percent.[98]
Table 11 represents the main regression results for this appendix, excluding observations for approximately the first 2 years of the COVID-19 pandemic (March 2020–December 2021). Across all of the regression specifications shown in table 11, we find that the interaction between distance and travel costs is negative and significant, with a 1 percent increase in the flight price to Guam associated with an additional 0.001 percent decline in visitor arrivals for each kilometer between Guam and the origin market. This suggests that further destinations from Guam are more sensitive to changes in price than closer destinations. However, we also find before accounting for distance, a positive and significant relationship between changes in flight prices and travel to Guam, which suggests that visitors from close destinations may be less price sensitive. In addition, we find that across most of the regression specifications, more seats on direct flights to Guam, more competitive currency (as measured by the real effective exchange rate), and visa-free entry to Guam are significantly associated with more visitor arrivals.
Table 11: Regression Results for January 2017–February 2020 and January 2022–December 2023, Excluding Observations During First 2 Years of COVID-19 Pandemic
|
|
(1) |
(2) |
(3) |
(4) |
|
Dependent variable |
Arrivals per 1000 people |
Arrivals per 1000 people |
Arrivals per 1000 people |
Arrivals per 1000 people |
|
Ln (flight price) |
2.654*** |
2.869*** |
2.947*** |
— |
|
|
[0.498] |
[0.433] |
[0.384] |
— |
|
Distance x Ln (flight price) |
-0.000841** |
-0.000999*** |
-0.00107*** |
-0.00110*** |
|
|
[0.000364] |
[0.000348] |
[0.000306] |
[0.000302] |
|
Ln (seat capacity) |
1.117*** |
0.738*** |
0.572*** |
0.731*** |
|
|
[0.134] |
[0.159] |
[0.104] |
[0.123] |
|
Visa-free entry |
2.222*** |
1.672*** |
1.621*** |
1.699*** |
|
[0.418] |
[0.346] |
[0.329] |
[0.355] |
|
|
Ln (Real effective exchange rate) |
-1.839*** |
2.540*** |
2.914*** |
1.126*** |
|
[0.553] |
[0.809] |
[0.546] |
[0.360] |
|
|
Observations |
945 |
945 |
945 |
945 |
|
Fixed effects |
Origin |
Origin, year |
Origin, year, month |
Origin, month-year |
|
R-squared |
0.921 |
0.945 |
0.976 |
0.990 |
Legend: * = statistically significant at the 10 percent level; ** = statistically significant at the 5 percent level; *** = statistically significant at the 1 percent level; — = not applicable.
Source: GAO Analysis of data from the Guam Visitors Bureau, the U.S. Bureau of Labor Statistics, Gurevitch and Herman (2018), and the Bank of International Settlements. | GAO‑26‑107811
Note: Brackets indicate robust standard errors. We estimated regressions without a constant term, omitting either the 2017 or the January 2017 fixed effect. Sample excludes months from March 2020 through December 2022.
In table 11, we use different combinations of time fixed effects to account for variation in traveler trends to Guam over time and at different periods of the year. Our preferred specification, presented in column 3, includes fixed effects to control for the origin of travelers to Guam, and for the year and month of travel.
In column 1, our specification includes only origin indicators and does not include time fixed effects. In this specification, the relationship between a more competitive currency and visitor arrivals is negative, but this is likely because we do not control for any time-varying trends in column 1. In column 2, we add year indicators to control for global trends that affect all travelers to Guam. In column 3, we add month indicators to control for seasonal trends in travel patterns (e.g., travelers may be more likely to visit Guam during certain months of the year). Finally, in column 4, we replace the separate year and month indicators with fixed effects for each month-year pair in the sample. Although this is the most comprehensive set of fixed effects controls, the flight price indicator drops from the regression because it varies only over time and not across countries; as a result, we cannot use column 4 to calculate the overall price sensitivity of travelers to Guam. However, the similarity of the results in columns 3 and 4 suggests that the year-and-seasonal-month fixed-effects effectively capture much of the variation in the data due to global trends over our sample period.
The results in table 11 suggest that for tourists to Guam, increases in the price of flights matter more for distant origins than for closer origins. To show the effect of this finding, table 12 calculates the effect of a 1 percent increase in flight prices to Guam for origin markets at various distances from Guam, using the regression results estimated in table 11, column 3. Close origins, such as the CNMI, Republic of Palau, and Federated States of Micronesia, are not sensitive to changes in the price of flights to Guam, because the estimated changes in visitor arrivals are positive following price increases. For origins that are sensitive to price changes (negative estimated change in visitor arrivals when prices increase), a 1 percent increase in flight prices to Guam decreases visitors to Guam by 0.01 to 9.2 percent. Using the visitor-weighted average distance for travelers to Guam, we find that a 1 percent increase in flight prices is associated with a 0.9 percent decrease in visitors to Guam.
Table 12: Estimated Percentage Change in Visitor Arrivals in Response to Change in Flight Prices, Based on Distance Between Origin Market and Guam
|
Visitor origin market |
Distance from Guam (population-weighted kilometers) |
Estimated change in visitor arrivals (percentage) |
|
Commonwealth of the Northern Mariana Islands |
222 |
2.73 |
|
Palau |
1,305 |
1.55 |
|
Federated States of Micronesia |
1,637 |
1.20 |
|
Philippines |
2,472 |
0.30 |
|
Japan |
2,605 |
0.16 |
|
Taiwan |
2,766 |
-0.01 |
|
Marshall Islands |
2,996 |
-0.26 |
|
South Korea |
3,094 |
-0.36 |
|
Hong Kong |
3,373 |
-0.66 |
|
China |
3,837 |
-1.15 |
|
Vietnam |
4,132 |
-1.46 |
|
Malaysia |
4,594 |
-1.94 |
|
Singapore |
4,698 |
-2.05 |
|
Thailand |
4,758 |
-2.11 |
|
Australia |
5,281 |
-2.65 |
|
India |
7,064 |
-4.49 |
|
Russia |
8,791 |
-6.22 |
|
Canada |
11,466 |
-8.86 |
|
United States (all other U.S. origins) |
11,631 |
-9.02 |
|
European Union |
11,848 |
-9.23 |
Source: GAO analysis of data from the Guam Visitors Bureau, the U.S. Bureau of Labor Statistics, Gurevitch and Herman (2018), and the Bank of International Settlements. | GAO‑26‑107811
Robustness Checks
As a robustness check to the main model, in table 13 we replace the real effective exchange rate variable with a bilateral exchange rate variable compiled by the Bank of International Settlements, which includes the nominal value of a US dollar relative to a given currency for 192 countries.[99] While the bilateral variable does not adjust for inflation, it has the advantage of allowing us to include Vietnam in the sample, and it directly compares the visitor origin currency and U.S. dollar. As table 13 shows, the results of using this variable are mostly consistent with the main findings in table 11.[100]
|
(1) |
(2) |
(3) |
(4) |
|
|
Dependent variable |
Arrivals per 1000 people |
Arrivals per 1000 people |
Arrivals per 1000 people |
Arrivals per 1000 people |
|
Ln (flight price) |
1.946*** |
3.156*** |
3.264*** |
— |
|
|
[0.536] |
[0.429] |
[0.385] |
— |
|
Distance x Ln (flight price) |
-0.000624 |
-0.000994*** |
-0.00105*** |
-0.00110*** |
|
|
[0.000385] |
[0.000350] |
[0.000309] |
[0.000300] |
|
Ln (seat capacity) |
1.180*** |
0.820*** |
0.600*** |
0.736*** |
|
|
[0.144] |
[0.157] |
[0.109] |
[0.121] |
|
Visa-free entry |
1.829*** |
1.654*** |
1.521*** |
1.535*** |
|
[0.362] |
[0.366] |
[0.336] |
[0.353] |
|
|
Ln (bilateral exchange rate) |
-1.627*** |
-1.062** |
-1.645*** |
-1.368*** |
|
[0.429] |
[0.453] |
[0.461] |
[0.478] |
|
|
Observations |
968 |
968 |
968 |
968 |
|
Fixed effects |
Origin |
Origin, year |
Origin, year, month |
Origin, month-year |
|
R-squared |
0.917 |
0.940 |
0.973 |
0.990 |
Legend: * = statistically significant at the 10 percent level; ** = statistically significant at the 5 percent level; *** = statistically significant at the 1 percent level; — = not applicable.
Source: GAO analysis of data from the Guam Visitors Bureau,
the U.S. Bureau of Labor Statistics, Gurevitch and Herman (2018), and the Bank
of International Settlements. | GAO‑26‑107811
Note: Brackets indicate robust standard errors. We estimated regressions without a constant term, omitting either the 2017 or the January 2017 fixed effect.
In the main specification of our model, we exclude the COVID-19 pandemic because restrictions on both domestic and international travel drove global tourism trends. As a second robustness check, in table 14, we reproduce table 3 using the full sample of observations from 2017 to 2023. The results of table 14 are consistent with the main findings, but the coefficient on the interaction term is significant only in column 4, where we include the full set of month-year fixed effects. This lack of a significant relationship with the COVID-19 period included in columns 1 through 3 may be driven by a disconnection between flight prices and travel in 2020 and 2021, where flight prices were low but travel was limited due to COVID-19-related restrictions.
|
|
(1) |
(2) |
(3) |
(4) |
|
Dependent variable |
Arrivals per 1000 people |
Arrivals per 1000 people |
Arrivals per 1000 people |
Arrivals per 1000 people |
|
Ln (flight price) |
3.263*** |
2.834*** |
2.835*** |
— |
|
|
[0.417] |
[0.400] |
[0.338] |
— |
|
Distance x Ln (flight price) |
-0.000201 |
-0.000102 |
-0.0000429 |
-0.000476** |
|
|
[0.000226] |
[0.000219] |
[0.000201] |
[0.000200] |
|
Ln (seat capacity) |
1.050*** |
0.694*** |
0.656*** |
0.439*** |
|
|
[0.0741] |
[0.0730] |
[0.0599] |
[0.0616] |
|
Visa-free entry |
2.559*** |
1.961*** |
1.953*** |
1.887*** |
|
[0.390] |
[0.344] |
[0.346] |
[0.328] |
|
|
Ln (real effective exchange rate) |
-2.283*** |
2.378*** |
2.743*** |
1.952*** |
|
[0.558] |
[0.724] |
[0.554] |
[0.341] |
|
|
Observations |
1,309 |
1,309 |
1,309 |
1,309 |
|
Fixed effects |
Origin |
Origin, year |
Origin, year, month |
Origin, month-year |
|
R-squared |
0.915 |
0.942 |
0.973 |
0.987 |
Legend: * = statistically significant at the 10 percent level; ** = statistically significant at the 5 percent level; *** = statistically significant at the 1 percent level; — = not applicable.
Source: GAO analysis of data from the Guam Visitors Bureau, the U.S. Bureau of Labor Statistics, Gurevitch and Herman (2018), and the Bank of International Settlements. | GAO‑26‑107811
Note: Brackets indicate robust standard errors. We estimated regressions without a constant term, omitting either the 2017 or the January 2017 fixed effect.
Simulated Effects Based on Regression Results
To better illustrate these regression results’ relation to hypothetical change in Guam’s customs fees, we use the estimated coefficient in table 11, column 1, to estimate hypothetical changes to visitor arrivals, CQA total revenue, and spending per visitor. These simulated effects show that although increasing passenger fees would improve CQA revenue, it would likely decrease visitor arrivals and related spending by a larger amount than CQA’s revenue gains.
We used values of flight prices and visitors to Guam in 2024 to estimate hypothetical changes to visitor arrivals and spending after a change in Guam CQA’s passenger inspection fees. Table 15 describes these initial values.
|
Initial values |
Definition |
Source |
Value |
|
Baseline visitors (number of visitors) |
Total civilian visitors to Guam in 2024 |
Guam Visitors Bureau |
739,145 |
|
Baseline price (2024 dollars) |
Average price of flights to Guam, provided by Guam Visitors Bureau |
Guam Visitors Bureau |
485 |
|
Baseline Guam Customs and Quarantine Agency (CQA) passenger fee (2024 dollars) |
CQA’s current passenger inspection fee |
Guam Airport Authority |
8.29 |
|
Baseline CQA revenue |
Approximated as inspection fee X total visitors |
GAO calculation |
6.1 |
|
Average visitor spending |
Total spending by visitors to Guam divided by total civilian visitors. Averaged over 2017–2021 and inflation-adjusted to 2024 dollars. |
Guam Visitors Bureau |
1,473.07 |
|
Baseline visitor spending (millions of 2024 dollars) |
Approximated as spending per visitor X total visitors |
GAO calculation |
1,088.8 |
|
Weighted average distance |
Average of distance value (km), weighted by visitor arrivals |
GAO calculation |
3,579 |
|
Travel cost coefficient |
Elasticity of demand for changes in travel costs, calculated as ln(flight price) + distance X ln(flight price), at weighted average distance |
GAO analysis |
-0.9 |
Source: GAO analysis of data from the Guam Visitors Bureau, the Guam Airport Authority the U.S. Bureau of Labor Statistics, Gurevitch and Herman (2018), and the Bank of International Settlements. | GAO‑26‑107811
Using these initial values, we calculated the response of visitors, CQA revenue, and visitor spending to increases in the Guam CQA fee. Starting with the initial value of 8.29, in table 16, we calculate a fee increase to $10, $20, and $30 to illustrate the potential effects of an increase in passenger inspections fees on visitor arrivals. These results highlight the trade-offs of increasing Guam CQA’s passenger inspection fees. At each fee level, an increase in the fees is predicted to increase CQA revenue but also to decrease the total number of visitors and visitor spending overall in Guam.
Table 16: Predicted Effects of Hypothetical Increase in Guam Customs and Quarantine Agency (CQA) Passenger Inspection Fee from $8.29 to $10, $20, or $30
|
Effect |
Passenger inspection fee |
|
||
|
|
$10 |
$20 |
$30 |
|
|
Average flight price |
$486.71 |
$496.71 |
$506.71 |
|
|
Percentage change in visitors |
- 0.3% |
- 2.1% |
-3.8% |
|
|
Change in visitors (relative to actual 2024) |
- 2,293 |
-15,405 |
-28,029 |
|
|
Change in CQA revenue (in millions) |
$1.2 |
$8.3 |
$15.2 |
|
|
Change in visitor spending (in millions) |
- $3.4 |
- $22.7 |
-$41.3 |
|
Source: GAO analysis of data from the Guam Visitors Bureau, the Guam Airport Authority the U.S. Bureau of Labor Statistics, Gurevitch and Herman (2018), and the Bank of International Settlements. | GAO‑26‑107811
The following is our response to the Office of the Governor of Guam’s letter dated February 13, 2026.
GAO Response
Scope of governance alternatives considered. On page 2 of its letter, the Office of the Governor of Guam commented that our report would benefit from additional clarification regarding its scope. We clarified in our report that the models we analyzed are not exhaustive of all options available to Guam.
The Governor’s office also noted that we did not analyze options for enhanced administrative flexibility or internal governance reform for the Guam Customs and Quarantine Agency (CQA). The office further commented that many governance reforms that directly address the challenges identified in the report, such as procurement delays, compensation rigidity, and technology deployment, can be achieved within the existing executive branch structure through territorial law, administrative reform, and budgetary action, without federalization or structural transfer of authority. While we agree that the reforms that the Governor’s office discussed—which are within the Guam government’s purview—could improve customs operations under any model, the degree to which that might occur is unclear. Therefore, we did not analyze how the selected models might affect customs operations in Guam. We believe that we have used an appropriate framework for our analysis of considerations for evaluating the models and of their potential economic effects.
Fees and funding considerations. On page 2 of its letter, the Governor’s office disagreed with our report’s implication that modernization of customs user fees would necessarily result in negative economic impacts for Guam’s population. Our empirical analysis illustrates the potential trade-offs between additional revenue for CQA and visitor arrivals, and our findings should not be interpreted as suggesting that CQA’s visitor arrival fees cannot be increased. We applied commonly used economic modeling techniques and accounted for various factors that can affect visitor arrivals to Guam, including exchange rates, seating capacity for flights between Guam and the visitor’s origin market, and visa-free entry to Guam.
We did not differentiate whether the cost increase results from passenger fees or some other sources; however, our empirical analysis captured the effect of the cost increase on the number of visitors. We believe our methodology is appropriate to estimate the potential effect of raising passenger fees, which is part of visitors’ overall travel costs. While our results show higher visitor arrival fees leading to a decline in visitors overall, this effect varies by country of origin, as table 12 shows. Visitors from some markets, including Japan and the Commonwealth of the Northern Mariana Islands, would likely not decrease in response to an increase in CQA’s visitor arrival fee according to our analysis. Moreover, the real value of CQA’s fees has declined over time, as figure 13 shows.
Workforce and transition risks. On page 3 of its letter, the Governor’s office requested that we clarify information related to workforce impact associated with federalized or U.S. Customs and Border Protection-administered customs models. In response, we added information in our report regarding the potential broader fiscal and personnel implications of dissolving an agency or transferring its staff to another agency.
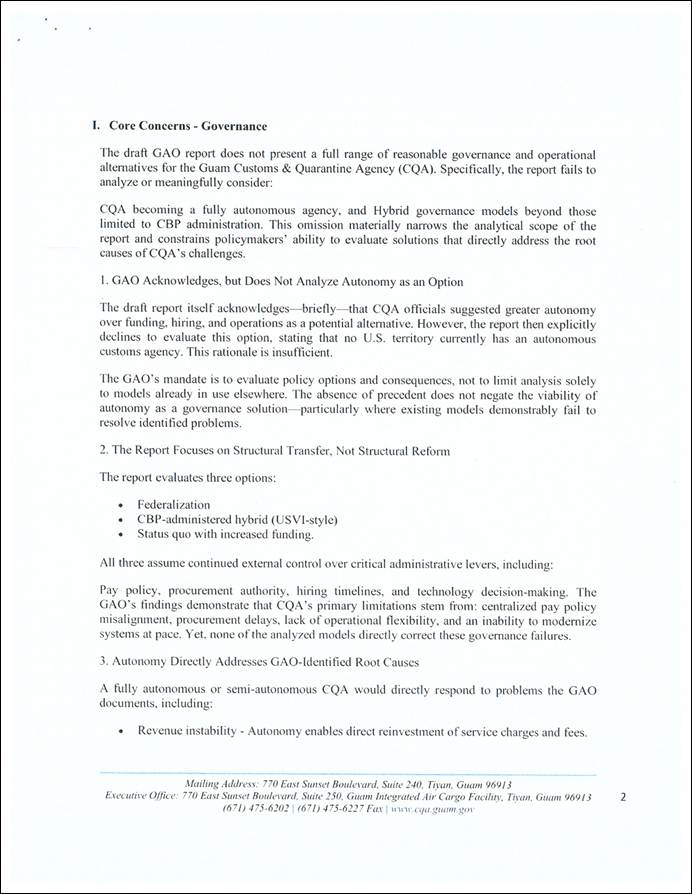
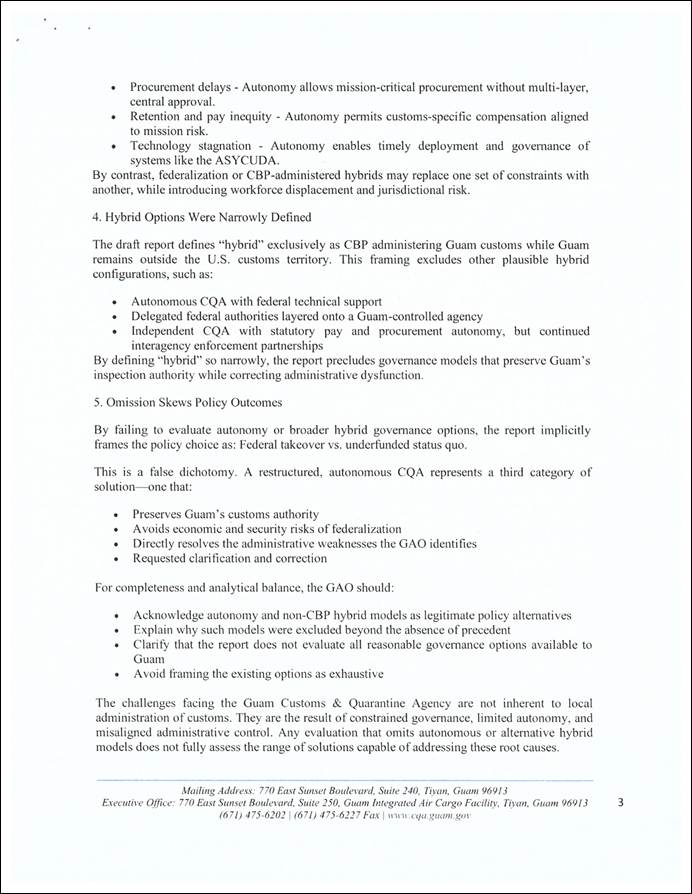
The following is our response to the Guam Customs and Quarantine Agency’s (CQA) letter dated February 12, 2026.
GAO Response
CQA’s core concern regarding governance. On pages 2 and 3 of its letter, CQA expressed concern that we did not evaluate CQA becoming an autonomous customs agency and other hybrid approaches as alternative customs models. Additionally, CQA’s letter noted that CQA autonomy would directly address the root causes of the agency’s operational issues but the federalized model would replace one set of constraints with another.
We believe that we used an appropriate methodology in selecting the three alternative models we evaluated. We examined customs models currently in use in U.S. territories, such as the hybrid model currently used in U.S. Virgin Islands; none of the U.S. territories has an autonomous customs agency. Examining existing customs models provided points of comparison that allowed us to identify considerations for evaluating each model as well as potential economic effects of adopting them. Analysis of a customs model in which an autonomous CQA increases fees to cover its customs operations, while Guam remains tariff free, would be similar to our analysis of Guam’s current customs model with additional funding for CQA. In addition, management decisions and actions play a direct role in addressing factors that limit operations under any model.
CQA’s core concern regarding fees. On pages 4 and 5 of its letter, CQA expressed concerns about our analysis of its fees. We believe that our analysis appropriately estimated the economic effects of increasing CQA passenger inspection fees. Our empirical analysis illustrates the potential trade-offs between fee increases, to provide additional revenue for CQA, and visitor arrivals. We used historical, Guam-specific data to assess the effect of price changes on visitor arrivals and applied those historically supported findings to hypothetical changes in the Guam CQA user fee. We applied commonly used economic modeling techniques and accounted for various factors that can affect visitor arrivals in Guam, including exchange rates, seating capacity for flights between Guam and the visitor’s origin market, and visa-free entry to Guam.
While our results show a decline in visitors overall, the effect varies by country of origin, (as table 12 shows). Visitors from some markets, including Japan and the Commonwealth of the Northern Mariana Islands, would likely not decrease in response to an increase in CQA’s visitor arrival fee, according to our analysis. We did not differentiate whether the cost increase resulted from passenger fees or other sources; however, our empirical analysis captured the effect of the cost increase on the number of visitors. We believe that our methodology is appropriate to estimate the potential effect from raising passenger fees, which is part of visitors’ overall travel costs. CQA pointed out that the real value of CQA’s fees has declined over time, as we discuss in our report and illustrate in figure 13.
Additionally, CQA observed that our draft report did not consider certain mitigation mechanisms, such as phased or incremental fee increases. Examining the mechanisms CQA discussed in its comments is outside the scope of our report, which focuses at a high level on the potential economic effects of adopting one of the selected hypothetical alternative models. If any policy change were to occur, further research could explore ways to achieve any defined policy goals, such as minimizing the effects of fee increases on certain sectors or populations.
Other CQA comments. On page 5 of its letter, CQA requested that we revise a statement, attributed to CQA officials, about the potential effects on agency personnel of adopting a federalized or hybrid model. CQA also asked for a clarification regarding the procurement process for disposal of CQA documents approved for destruction. We made revisions in our report to address these points.
GAO Contact
Dr. Nagla’a El-Hodiri, Elhodirin@gao.gov
Staff Acknowledgments
In addition to the individual
named above, Ming Chen (Assistant Director), Cheryl Goodman (Assistant
Director), Victoria Lin (Analyst-in-Charge), Sarah Oliver, Joshua Timko, Noor
Tofailli, Reid Lowe, Gergana Danailova, Daniel Kannell, Neil Doherty, and Christopher
Keblitis made key
contributions to this report.
The Government Accountability Office, the audit, evaluation, and investigative arm of Congress, exists to support Congress in meeting its constitutional responsibilities and to help improve the performance and accountability of the federal government for the American people. GAO examines the use of public funds; evaluates federal programs and policies; and provides analyses, recommendations, and other assistance to help Congress make informed oversight, policy, and funding decisions. GAO’s commitment to good government is reflected in its core values of accountability, integrity, and reliability.
Obtaining Copies of GAO Reports and Testimony
The fastest and easiest way to obtain copies of GAO documents at no cost is through our website. Each weekday afternoon, GAO posts on its website newly released reports, testimony, and correspondence. You can also subscribe to GAO’s email updates to receive notification of newly posted products.
Order by Phone
The price of each GAO publication reflects GAO’s actual cost of production and distribution and depends on the number of pages in the publication and whether the publication is printed in color or black and white. Pricing and ordering information is posted on GAO’s website, https://www.gao.gov/ordering.htm.
Place orders by calling (202) 512-6000, toll free (866) 801-7077,
or
TDD (202) 512-2537.
Orders may be paid for using American Express, Discover Card, MasterCard, Visa, check, or money order. Call for additional information.
Connect with GAO
Connect with GAO on X,
LinkedIn, Instagram, and YouTube.
Subscribe to our Email Updates. Listen to our Podcasts.
Visit GAO on the web at https://www.gao.gov.
To Report Fraud, Waste, and Abuse in Federal Programs
Contact FraudNet:
Website: https://www.gao.gov/about/what-gao-does/fraudnet
Automated answering system: (800) 424-5454
Media Relations
Sarah Kaczmarek, Managing Director, Media@gao.gov
Congressional Relations
David A. Powner, Acting Managing Director, CongRel@gao.gov
General Inquiries
[1] In this report, unless otherwise noted, United States refers to the 50 states, District of Columbia, and all U.S. territories and possessions.
[2] In this report, unless otherwise specified, cargo refers to containers, packages, and letters sent via air or sea through private carriers, such as Matson, FedEx, UPS, and DHL.
[3] Guam Customs and Quarantine Agency’s Citizen-Centric Report for Fiscal Year 2023, published in accordance with Guam law. 1 GCA § 1922.
[4] We focused our work on the movement of goods, not people, into and out of Guam. As a result, we did not directly review immigration to Guam, which is under U.S. Customs and Border Protection’s (CBP) purview.
[5] The three customs models we selected for our analysis do not represent an exhaustive list of potential alternatives. For example, CQA officials suggested that CQA could be given autonomy to make decisions about its funding, hiring, and operations rather than acting only as an executive branch agency of the Guam government. The models we selected are those currently used in U.S. territories, none of which has an autonomous customs agency.
[6] In commenting on our draft report, the Office of the Governor of Guam and CQA noted that our analysis of the selected alternative models does not address possible solutions for factors that our report describes as limiting CQA operations. We did not analyze how or whether adopting these models would address the factors that limit CQA operations, because such analysis was outside the scope of our review. The extent to which adopting any alternative customs model would address solutions for these factors is unclear, as management decisions and actions play a direct role in customs operations regardless of the model. Our analysis focused on broader considerations for evaluating the models and on some potential economic effects.
[7] In this report, imports refers to imported goods, not services; exports refers to exported goods, not services.
[8] In June 2025, we published a report discussing Guam’s and other U.S. territories’ economic and public debt outlook. See GAO, U.S. Territories: Public Debt and Economic Outlook—2025 Update, GAO‑25‑107560 (Washington, D.C.: June 30, 2025).
[9] In this report, tariffs refers to duty rates on imported goods.
[10] See GAO, Missile Defense: DOD Faces Support Challenges for Defense of Guam, GAO‑25‑108187 (Washington, D.C.: May 22, 2025.)
[11] For the purposes of our report, unless otherwise specified, mail includes letters and packages sent through the U.S Postal Service.
[12] According to CBP officials, CBP enforces U.S. immigration laws when processing all inbound passengers and crew members arriving by air at the Guam International Airport and by sea at the Port of Guam, including collecting immigration fees from passengers arriving in Guam from outside the United States. CBP officials told us that CBP is not reimbursed for performing immigration inspection activities in Guam. CBP officials’ roles also include pre-inspection processing of all passengers departing Guam for the rest of the United States as well as collaboration with CQA for customs-related matters, such as importation of restricted and prohibited items.
[13] The three primary sources of General Fund revenues are income taxes; business privilege taxes, also known as gross receipt tax; and federal funding, such as federal income taxes from military personnel who are based on the island or consider Guam to be their state of legal residence.
[14] 11 GCA § 28105. According to a report by Guam’s Office of Public Accountability, a use tax is a sales tax on purchases, made outside one’s state of residence, of taxable items that will be used, stored, or consumed in one’s state of residence and on which no tax was collected in the state of purchase. Three Guam government agencies handle the assessment, collection, data processing, and record-keeping for Guam’s use tax, which CQA is responsible for assessing and collecting.
[15] We used funding data from the Guam government’s independent auditors’ reports.
[16] The United States has five permanently inhabited territories: American Samoa, the CNMI, Guam, the Commonwealth of Puerto Rico, and USVI. The U.S. Department of the Interior helps coordinate federal policy and manages several federal funding programs for Guam, American Samoa, the CNMI, and USVI.
[17] The U.S. customs territory comprises the 50 states, the District of Columbia, and Puerto Rico. 19 C.F.R. § 101.1. The World Trade Organization defines a customs territory as a geographic area where separate tariffs or other regulations of commerce are maintained for a substantial part of trade with other territories.
[18] The World Customs Organization’s Harmonized Commodity Description and Coding System—also known as the Harmonized System—is used by 212 countries and economies, including the United States, to compile trade statistics. The system’s four-digit headings and six-digit subheadings appear in the HTSUS, which sets tariffs and statistical categories for all merchandise imported into the U.S. customs territory. U.S. tariffs are typically set at the more detailed eight-digit subheading level, which is designated by the U.S. government.
[19] See appendix III for a comparison of total import values, tariffs and fees collected, and spending on customs operations for Puerto Rico, USVI, and Guam in 2022, the most recent year for which such data were available.
[20] CQA officials and other stakeholders described numerous factors that limited CQA's operations. We are reporting on those we could corroborate and analyze through our own observation and research.
[21] Guam Office of Public Accountability, Customs and Quarantine Agency Processing of Imported and Exported Alcoholic Beverages: Analysis, January 1, 2021 to December 31, 2022, OPA Report No. 25-06 (April 2025).
[22] Pursuant to 5 GCA §§ 73110(a)(1)(E) & 73110(b)(1), the master or the agent of vessels and aircraft is required to transmit electronic manifests containing information regarding the crews on board, passengers, and cargo or baggage to the Customs Office.
[23] Guam Office of Public Accountability, OPA Report No. 25-06.
[24] Bureau of Statistics and Plans, Government of Guam, “Technical Assistance Program 2024, Office of Insular Affairs, CFDA: 15.875. Project Title: Phase 2 Government of Guam Customs and Import Operations Modernization,” March 15, 2024.
[25] Guam Office of Public Accountability, Government of Guam Use Tax on Air Cargo: Performance Audit, October 1, 2016 through December 31, 2018, OPA Report No. 20-01 (January 2020).
[26] Guam Office of Public Accountability, OPA Report No. 25-06.
[27] Guam Office of Public Accountability, OPA Report No. 25-06.
[28] According to a Guam government document, the intended beneficiaries of the program include CQA and other Guam government agencies—the Bureau of Statistics and Plans, Department of Agriculture, Department of Revenue and Taxation, Guam Environmental Protection Agency, and Department of Public Health and Social Services.
[29] According to the Oceania Customs Organisation Secretariat, in 1998, the heads of Oceania Customs Administrations established the Oceania Customs Organisation to promote efficiency and effectiveness in all aspects of Regional Customs Administrations. According to the organization, its principal activity is facilitating and, where appropriate, helping the administrations of its 24 member countries and territories in the Pacific region to align with international customs standards and best practices.
[30] In 2024, the Guam legislature passed a law that provided for CQA to modernize and automate customs operations. Guam Pub. L. 37-82 (2024).
[31] ASYCUDA is a computerized customs system that uses the World Customs Organization classification for traded products—the Harmonized Commodity Description and Coding System, also known as the Harmonized System.
[32] See GAO, U.S. Territories: Public Debt Outlook—2023 Update, GAO‑23‑106045 (Washington, D.C.: June 29, 2023); and Deloitte & Touche LLC. Government of Guam Single Audit Reports, Year Ended September 30, 2021 (Tamuning, Guam: July 13, 2022).
[33] In a 2025 report, we found that although Guam has made some progress in this area by implementing a new financial management system, it has struggled to remediate several material weaknesses in internal control over financial reporting and compliance identified by its independent auditors. See GAO, U.S. Territories: Public Debt and Economic Outlook—2025 Update, GAO‑25‑107560 (Washington, D.C.: June 30, 2025).
[34] Customs models vary across the five permanently inhabited U.S. territories—Guam, American Samoa, the Commonwealth of the Northern Mariana Islands, the Commonwealth of Puerto Rico, and the U.S. Virgin Islands.
[35] For our analysis of alternative customs models, we selected those that are currently used in U.S. territories. American Samoa and the Commonwealth of the Northern Mariana Islands have a customs model similar to Guam’s, where the territories administer their own customs and are outside of the U.S. customs territory. Other hypothetical alternatives to Guam’s current customs model may exist. For example, CQA officials suggested that CQA could become autonomous, making decisions about its funding, hiring, and operations rather than acting only as an executive branch agency of the Guam government. Currently, none of the U.S. territories has an autonomous customs agency.
[36] 19 U.S.C. § 58c.
[37] The HTSUS sets the tariffs and statistical categories for all merchandise imported into the U.S. customs territory.
[38] In commenting on our draft report, the Office of the Governor of Guam and CQA noted that our analysis of the selected alternative models does not address possible solutions for factors that our report describes as limiting CQA operations. We did not analyze how or whether adopting these models would address the factors that limit CQA operations, because such analysis was outside the scope of our review. The extent to which adopting any alternative customs model would address solutions for these factors is unclear, as management decisions and actions would play a direct role in customs operations regardless of the model. Our analysis focused on broader considerations for evaluating the models and on some potential economic effects.
[39] Federal law requires duties and taxes collected in Puerto Rico to be paid into its treasury. CBP deposits duties, taxes, and fees that it collects on behalf of Puerto Rico into a trust fund, which are then transferred to its treasury after deductions for CBP expenses. USVI also has a trust fund that holds revenue collected by CBP on behalf of USVI. See 48 U.S.C. §§ 740 and 1406i.
[40] If Guam were incorporated into the U.S. customs territory, the incorporating legislation would define the specific terms. As a result, we cannot determine any potential effect that existing U.S. treaties with other countries, such as the United States--Mexico—Canada Agreement would have on Guam.
[41] 19 C.F.R. § 7.2.
[42] CBP staff in USVI indicated that their typical duties include inspecting agricultural goods arriving in USVI from Puerto Rico or Florida and processing import paperwork for goods originating in the U.S. customs territory.
[43] For more information, see U.S. Postal Service, Administrative Support Manual, Issue 13 (July 1999, updated January 2021), https://www.nalc.org/workplace‑issues/resources/body/Administrative‑Support‑Manual‑Issue‑13‑July‑1999‑Updated‑Through‑January‑2021.pdf.
[44] CBP officials noted the possibility that under a hybrid model in Guam, in contrast to the hybrid model currently in effect in USVI, goods from the U.S. customs territory would not be subject to CBP inspection because of a federal court decision regarding the definition of import. In 2003, a federal appellate court held that the transport of drugs on a nonstop flight from one location within the United States to another does not constitute importation within the meaning of a federal statute prohibiting the import of drugs into the customs territory of the United States. United States v. Cabaccang, 332 F.3d 622 (9th Cir. 2003). For the purposes of our analysis, we hypothesized a hybrid model similar to the one currently in effect in USVI, but other hybrid models might operate differently.
[45] CQA officers conduct this screening and inspection in a dedicated area of a U.S. postal facility in Guam, according to U.S. Postal Inspection Service officials.
[46] 6 U.S.C. § 921.
[47] CQA officials informed us that as of August 2025, the governor of Guam’s legal office was reviewing CQA’s proposed bill to update container seal security and requirements, including requiring bolt seals, for sealable shipping containers entering or transiting Guam.
[48] 6 U.S.C. § 921.
[49] CBP’s ACE is an electronic commercial trade processing system through which the trade community reports imports and exports and the government determines their admissibility and collects applicable duties, taxes, and fees.
[50] In USVI, CBP employs ACE on a limited basis to enter and query importer records, verify importer bonds, and reference tariff numbers, according to officials.
[51] Our 2024 report examined CBP recruitment, hiring, and retention for law enforcement positions throughout the agency. See GAO, U.S. Customs and Border Protection: Efforts to Improve Recruitment, Hiring, and Retention of Law Enforcement Personnel, GAO‑24‑107029 (Washington, D.C.: Sept. 25, 2024).
[52] Our analysis does not consider CBP’s cargo inspection fees, which generally include a flat fee for merchandise valued at less than $2,500 and a value-based fee for merchandise valued at more than $2,500.
[53] The average effective tariff is a single value that represents the average tariff per dollar of imports across all import sources and products. We calculated the average effective tariff for each product at the Harmonized System four-digit heading level and the assessed value of tariffs on all U.S. imports, divided by the total value of imports in the category. To estimate Guam’s hypothetical tariff, we used the Harmonized System’s four-digit headings to weight this value by Guam’s imports of each product.
[54] Guam’s current cargo inspection fee is collected on the basis of goods volume. We calculated this tariff-equivalent fee rate as the total value of cargo inspection fees divided by the total value of imports in 2017 through 2024.
[55] Although we did not conduct an economic analysis of hypothetical changes to Guam’s cargo inspection fees, our method for analyzing changes to prices and imports under the HTSUS could also be used to analyze changes to cargo inspection fees.
[56] Guam collects its own customs data, because federal import and export statistics do not include comprehensive data for Guam and other territories. See GAO, U.S. Territories: Coordinated Federal Approach Needed to Better Address Data Gaps, GAO‑24‑106574 (May 9, 2024).
[57] Guam’s imports from the U.S. customs territory may contain intermediate inputs that were subject to the HTSUS when they entered the U.S. customs territory. Our analysis focused on the direct effect if Guam were to adopt the HTSUS, not on HTSUS’s secondary effect on goods exported to Guam from U.S. customs territories.
[58] Specifically, our economic analysis assessed the hypothetical effect of a change in tariffs on Guam’s 2023 imports, which was the last year for which data were available for all countries that report data on exports to Guam. These averages do not account for any changes to the HTSUS since June 2025, including the elimination of duty-free imports of low-value articles into the U.S. customs territory, often referred to as the de minimis tariff exemption. Section 321 of the Tariff Act of 1930 currently allows this exemption; however, Section 70531 of Public Law 119-21 repealed de minimis treatment effective July 2027, and the President issued an Executive Order suspending duty-free de minimis treatment for all countries for certain articles. See Pub. L. No. 119-21, § 70531, 139 Stat. 283 (2025); 19 U.S.C. § 1321(a); and Exec. Order No. 14324, 90 Fed. Reg. 37775 (July 30, 2025). As a result of changes to the HTSUS after June 2025, the effective average tariffs for imports to Guam would likely be higher than the hypothetical average tariffs shown in figure 11. For details, see appendix IV.
[59] Our product selection considered whether each product had a high value of non-U.S. imports to Guam, varying shares of imports from the U.S. mainland, or stakeholder interest. See appendix IV for a full description of our methodology.
[60] See appendix IV for full results.
[61] Tariffs for imports into the U.S. customs territory can change over time. For example, more than 100 revisions to the HTSUS were published from January 2020 to November 2025. Because Guam currently imposes no tariffs, our analysis, using U.S. duty rates for January to June 2025, is intended to show how the imposition of tariffs could affect Guam’s imports and economy.
[62] Cargo fees in Guam from 2017 to 2024 were roughly equivalent to a tariff of 0.03 percent, compared with an estimated tariff of 1.6 percent under the HTSUS in the same years. Thus, cargo fees could increase while remaining below HTSUS tariffs.
[63] Because Guam’s current export sector is small, we did not conduct an economic analysis projecting the effects of such changes. For more information about our methodology, see appendix I.
[64] From 1958 to 1965 Guam established several plants for manufacturing mechanical watches. However, the introduction of quotas on duty-free watch exports to the U.S. Customs Territory, reliance on pre-assembled watch components from the Soviet Union, and changes in consumer preferences for quartz digital watches all contributed to the decline of this sector. The last watch assembly plant in Guam closed in 1992.
[65] We did not conduct an economic analysis of the effect of changes to exports because available data did not allow us to distinguish between products that are directly re-exported and exports produced in Guam.
[66] The Caribbean Basin Economic Recovery Act makes some exceptions to this rule for specific goods. 19 C.F.R. § 7.3(a)(1)(i).
[67] See appendix V for details of our economic analysis of potential effects on visitor arrivals.
[68] See appendix IV for full results of our economic modeling.
[69] Guam Visitors Bureau officials estimated that each visitor to Guam spent $1,473.07 on average in 2024.
[70] We reported on factors, among those identified by CQA officials and other stakeholders, that we could corroborate and analyze through our own observation and research.
[71] The three customs models we selected for our analysis do not represent an exhaustive list of potential alternatives. For example, CQA officials suggested that CQA could be given autonomy to make decisions about its funding, hiring, and operations rather than act only as an executive branch agency of the Guam government. For our analysis of alternative models, we selected customs models that are currently used in U.S. territories, none of which has an autonomous customs agency.
[72] Guam is outside the U.S. customs territory, administers its own customs operations, and may set its own merchandise categories to track imports and impose tariffs. Puerto Rico is in the U.S. customs territory and therefore uses U.S. duty rates; CBP administers its customs. USVI is not in the U.S. customs territory and sets its own duty rates, and CBP administer its customs.
[73] In commenting on our draft report, the Office of the Governor of Guam and CQA noted that our analysis of the selected alternative models does not address possible solutions for factors that our report describes as limiting CQA operations. We did not analyze how or whether adopting these models would address the factors that limit CQA operations, because such analysis was outside the scope of our review. The extent to which adopting any alternative customs model would address solutions for these factors is unclear, as management decisions and actions play a direct role in customs operations regardless of the model. Our analysis focused on broader considerations for evaluating the models and on some potential economic effects.
[74] Our analysis of economic effects is based on our decisions to use information, including tariff rates in a certain time period and industry sectors, that we determined to be relevant. The tariff rates for imports in the U.S. customs territory can change over time but are generally higher than those for imports to Guam, as Guam imposes no tariffs. Our analysis is a simulation intended to illustrate how tariffs might affect Guam’s imports and economy.
[75] To simulate these effects, we used a model described by David Riker and Samantha Schreiber in Structural Equations for PE Models in Group 1 (Perfect Competition) (U.S. International Trade Commission, Office of Economics, March 2020).
[76] The five example products are those listed under the following headings of the World Customs Organization’s Harmonized Commodity Description and Coding System, also known as the Harmonized System: 8703 (motor cars and other motor vehicles principally designed for the transport of persons, including station wagons and racing cars); 2710 (petroleum oils and oils obtained from bituminous minerals other than crude; preparations not elsewhere specified or included, containing by weight 70 percent or more of petroleum oils or of oils obtained from bituminous minerals, these oils being the basic constituents of the preparations; waste oils); 7113 (articles of jewelry and parts thereof, of precious metal or of metal clad with precious metal); 1006 (rice); and 7214 (other bars and rods of iron or non-alloy steel, not further worked than forged, hot-rolled, hot-drawn or hot-extruded, but including those twisted after rolling).
[77] The World Customs Organization’s Harmonized System is used by 212 countries and economies, including the United States, to compile trade statistics. Harmonized System four-digit headings and six-digit subheadings appear in the HTSUS, while U.S. tariffs are typically set at the more detailed eight-digit subheading level designated by the U.S. government. The average effective tariff is a calculation used to summarize duty rates across broad categories of imported products and is calculated as the CBP-assessed value of duties on all U.S. imports of a product divided by the total value of imports in the category at the four-digit Harmonized System heading level.
[78] For this analysis, we used the economic model described by María Santana Gallego and Jordi Paniagua in “Tourism and Migration: Identifying the Channels with Gravity Models,” Tourism Economics, vol 28, no. 2 (2022).
[79] Specifically, this analysis includes variables that control for the impact of the following other potential drivers of visitor arrivals: exchange rates, seating capacity for flights between Guam and the visitor’s origin market, visa-free entry to Guam, characteristics of visitor origin markets (e.g., market size), year, and seasonal trends. The results of our analysis, described in detail in appendix IV, are statistically significant at the 99 percent confidence level.
[80] The HTSUS does not apply in USVI because USVI is outside the U.S. customs territory.
[81] Personal and commercial imports valued at less than $2,500 are considered informal, with some exemptions for high-risk goods and goods subject to quotas, antidumping, or countervailing duties. Imports that are not designated as informal are formal imports.
[82] For multiple reasons, Puerto Rico, where customs operations are federalized, has higher customs revenue than USVI, with its hybrid customs model, or than Guam. These reasons include Puerto Rico’s collection of higher U.S. tariffs and the larger amount of imports to Puerto Rico than to USVI or Guam.
[83] Specifically, we used Riker and Schreiber’s nonnested constant elasticity of substitution demand tariff model with no domestic production. This approach assumes that the distribution of products imported is similar for Guam and the United States as a whole. See David Riker and Samantha Schreiber, Structural Equations for PE Models in Group 1 (Perfect Competition) (U.S. International Trade Commission, Office of Economics, March 2020).
[84] This approach assumes that the distribution of imported products is similar for Guam and the United States customs territory.
[85] These heading codes are from World Customs Organization Harmonized Commodity Description and Coding System, known as the Harmonized System, which 212 countries and economies, including the United States, use to compile trade statistics. The Harmonized System also serves as the basis for the HTSUS’s further delineation of product categories. For more information, see appendix II.
[86] These countries are Antigua and Barbuda, the Bahamas, Barbados, Dominica, Grenada, St. Kitts and Nevis, St. Lucia, Maldives, and Mauritius.
[87] A gravity model is named for Newton’s Law of Gravity, which predicts that the “gravity” (e.g., international trade or tourism flows) between two countries depends on their sizes and the distance between them.
[88] Jaume Rosselló Nadel and María Santana Gallego, “Gravity Models for Tourism Demand Modeling: Empirical Review and Outlook,” Journal of Economic Surveys, vol. 36 (2022): 1358–1409.
[89] María Santana Gallego and Jordi Paniagua, “Tourism and Migration: Identifying the Channels with Gravity Models,” Tourism Economics, vol. 28, no. 2 (2022): 394–417.
[90] Olugbenga Onafowora and Oluwole Owoye, “Modeling International Tourism Demand for the Caribbean,” Tourism Economics, vol. 18, no. 1 (2012): 159–180.
[91] Adam Storeygard, “Farther on down the Road: Transport Costs, Trade and Urban Growth in Sub-Saharan Africa,” Review of Economic Studies, vol. 83 (2016), 1263–1295.
[92] Chao and Hsu show that increases in fuel costs have a larger effect on the total costs of flights travelling longer distances, which provides support for the choice to adapt Storeygard’s model to measure the price effects for tourism destinations at different distances from Guam. See Chin-Cheng Chao, and Ching-Wen Hsu, “Cost Analysis of Air Cargo Transport and Effects of Fluctuations in Fuel Price,” Journal of Air Transport Management, vol. 35 (2014): 51–56.
[93] Alexander Culiuc, “Determinants of International Tourism,” IMF Working Paper 14/82 (2014); U.S. International Trade Commission, “U.S.-Pacific Islands Trade and Investment: Impediments and Opportunities,” USITC Investigation 332-593 (September 2023).
[94] This Guam–CNMI Visa Waiver Program, which is distinct from the U.S. Visa Waiver Program, does not allow visitors to travel to the rest of the United States.
[95] Heteroskedasticity means that the error terms in a regression are not randomly distributed over the whole sample of data. A Poisson Pseudo Maximum Likelihood estimator is a nonlinear multiplicative regression model.
[96] Throughout this appendix, the Greek letter delta (Δ) signifies change in.
[97] The seat capacity data, released in 2025, are available only through 2023.
[98] We calculate this estimate
using equation 4, setting
 .
.
[99] An increase of the bilateral exchange rate indicates a depreciation of the origin currency relative to the U.S. dollar.
[100] Given the definitions of the bilateral exchange rate and real effective exchange rate, we expect these variables to have opposite signs if they are producing consistent results. Specifically, an increase in the real effective exchange rate indicates that a country’s currency is more competitive globally in general, while an increase in the bilateral exchange rate indicates that the country’s currency is less competitive relative to the U.S. dollar.