Report to Congressional Requesters
United States Government Accountability Office
A report to congressional requesters
Contact: Jacqueline M. Nowicki at NowickiJ@gao.gov.
What GAO Found
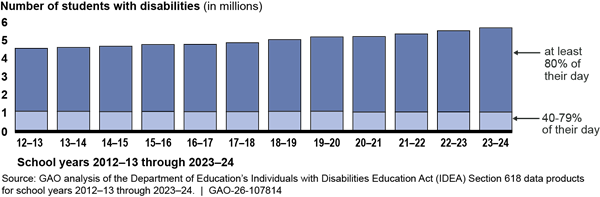
Under federal special education law, students with disabilities are to be educated alongside their peers without disabilities to the maximum extent appropriate. Nationally, the number of students with disabilities in the general education classroom (gen ed) for at least 40 percent of their day increased 25 percent from school year 2012–13 through school year 2023–24 (see figure). The largest increase came from students with disabilities in gen ed for at least 80 percent of their day. The total number of students with disabilities increased 21 percent during this period. GAO also found the share of students with disabilities in gen ed for much of their day increased in 42 of 50 states and the District of Columbia (no data were available for New Mexico for school year 2023–24). However, within states, changes over this period varied widely. For example, the District of Columbia had the largest increase (7.7 percentage points), while in North Dakota the share of students with disabilities in gen ed for at least 40 percent of their day decreased by 3.2 percentage points.
National Enrollment Trends for Students with Disabilities in the General Education Classroom for Much of Their Day (at Least 40 Percent)
For school year 2022–23 (the most recent data available), certain factors related to district resources were associated with higher rates of students with disabilities in gen ed for much of their day, according to GAO’s regression analysis. Specifically, GAO found that for the following types of districts a higher percentage of students with disabilities spent at least 40 percent of their day in gen ed: (1) districts with higher and lower levels of poverty, (2) districts that did not have a standalone special education school, and (3) districts with lower per pupil revenue (i.e., funding per student).
Across the districts and schools GAO visited, officials commonly identified resource availability, parental involvement in educational placement decisions, and school environment (i.e. facilities and school culture) as factors that influenced the educational setting of students with disabilities.
Officials from these schools and districts described challenges and successes creating a sense of belonging in the school community for students with disabilities. For example, officials at one school said funding constraints prevented the school from hiring an additional athletic coach with needed expertise or training to meaningfully include students with disabilities in sports. Officials and educators at a school in another state said they had successfully promoted belonging through small group work where students with disabilities are intentionally grouped with students without disabilities.
Why GAO Did This Study
About 7 million children aged 6 through 21 received special education and related services under Part B of the Individuals with Disabilities Education Act (IDEA) in school year 2023–24. Under IDEA, children with disabilities are to be educated in the “least restrictive environment.” According to Department of Education guidance, inclusive practices can positively shape outcomes for all students. The guidance further notes that all children deserve to feel a sense of belonging in their learning environment.
GAO was asked to review the settings in which students with disabilities are educated. This report addresses: (1) how general education placements for students with disabilities vary nationwide and statewide, (2) factors that influence educational placement for students with disabilities, and (3) how selected districts and schools encourage a sense of belonging in the school community for students with disabilities.
GAO used federal special education data and reviewed federal laws, regulations, guidance, and studies. GAO assessed the number of students who spent much of their day in gen ed by analyzing data on students who spent 40 to 79 percent and 80 percent or more of their time in gen ed. GAO’s regression analysis identified district characteristics associated with the percentage of students with disabilities in gen ed for much of their day. GAO also interviewed Education officials, and officials and educators from 12 districts and eight schools in Connecticut, Illinois, and Washington. GAO selected districts and schools based on factors such as enrollment size and locale.
|
Abbreviations |
|
|
|
|
|
CCD |
Common Core of Data |
|
Clearinghouse |
What Works Clearinghouse |
|
CRDC |
Civil Rights Data Collection |
|
ESEA |
Elementary and Secondary Education Act of 1965, as amended |
|
gen ed |
general education classroom |
|
IDEA |
Individuals with Disabilities Education Act |
|
IEP |
individualized education program |
|
LRE |
least restrictive environment |
|
618 data |
IDEA Section 618 Data Products |
This is a work of the U.S. government and is not subject to copyright protection in the United States. The published product may be reproduced and distributed in its entirety without further permission from GAO. However, because this work may contain copyrighted images or other material, permission from the copyright holder may be necessary if you wish to reproduce this material separately.
July 2, 2026
The Honorable Bernard Sanders
Ranking Member
Committee on Health, Education, Labor and Pensions
United States Senate
The Honorable Tim Kaine
United States Senate
About 7 million children aged 6 through 21 received special education and related services under Part B of the Individuals with Disabilities Education Act (IDEA) in school year 2023–24 (the most recent data available at the time of our review). Under IDEA, eligible students are entitled to a free appropriate public education provided in the “least restrictive environment” (LRE).[1] The LRE requirement ensures that students with disabilities are educated, to the maximum extent appropriate, in the general education classroom (gen ed) with their peers. According to Department of Education (Education) guidance, inclusive educational practices can positively shape the outcomes of students with and without disabilities, and all children deserve to feel a sense of belonging in their learning environment.[2] Most students served under IDEA (students with disabilities) are educated in gen ed for the majority of their day, with some of their services, such as speech therapy, provided outside gen ed.
Congress appropriated $14.6 billion for IDEA Part B grants in fiscal year 2025 for states to assist them in providing special education and related services to eligible children with disabilities from age 3 and possibly lasting to the student’s 22nd birthday, depending on state law or practice.[3] Students eligible for special education services under IDEA have an individualized education program (IEP). States must generally have policies and procedures to ensure that public agencies in the state meet the LRE requirement. However, some research indicates that states and districts interpret the LRE requirement differently, and that state regulations and guidance vary. These researchers have raised questions about whether the application of LRE may be inequitable across school and student characteristics.[4]
You asked us to review where students with disabilities receive their education. This report addresses (1) how general education placements for students with disabilities vary nationwide and statewide, (2) what factors influence educational placement for students with disabilities, and (3) how selected districts and schools encourage a sense of belonging in the school community for students with disabilities.
To understand how general education placements for students with disabilities vary nationwide and statewide, we focused our analysis on students with disabilities who were placed in gen ed for much of their day (40 percent or more).[5] We analyzed Education’s most recent data available at the time of our review from three collections:
· IDEA Section 618 Data Products (618 data) for school years 2012–13 through 2023–24.[6] For this time period, we examined and compared the number and placement rate by race and ethnicity, sex, type of disability, and school level for students with disabilities in gen ed for at least 40 percent of their day nationwide and for each state. We also analyzed school district-level data for school year 2022–23—the only available year of district-level 618 data. For this district analysis, we calculated the percentage of students with disabilities in gen ed for at least 40 percent of their day for each district within a state.[7] We then ordered the districts—from high to low—and split them into four equal groups (quarters) to calculate the average percentage of students with disabilities in gen ed for at least 40 percent of their day for each quarter.
· Common Core of Data (CCD) for school years 2012–13 and 2023–24.[8] For these school years, we compared student enrollment trends by demographics for K-12 public schools nationwide. We also compared these trends to enrollment for students with disabilities and demographic groups over the same time period.
· EdFacts for school years 2022–23 and 2023–24.[9] For three states we visited— Connecticut, Illinois, and Washington—we analyzed variation across districts for students with disabilities in gen ed for at least 40 percent of their day by sex, type of disability, and English learner status. We selected these states because they had publicly available district-level data on LRE educational settings. We compared the representation of each group in a district to that of the state’s average. This analysis is not generalizable.
To understand what factors influence educational placement for students with disabilities, we performed a descriptive regression analysis to identify the association between district characteristics and students with disabilities in gen ed for at least 40 percent of their day (our outcome variable).[10] We also performed a descriptive regression analysis to identify the association between access to gen ed and district-level outcomes for public school students with disabilities (i.e., graduation rates, dropout rates, and discipline).
To conduct these analyses, we combined district-level data from Education’s 618 data (school year 2022–23); Civil Rights Data Collection (CRDC, school year 2021–22); and CCD Finance Survey Data (school year 2021–22) with CCD non-fiscal data (school year 2022–23).[11] In our descriptive regression analysis, we controlled for district characteristics: urbanicity, student-to-staff ratios, poverty, student demographics, per pupil revenues, and the presence of standalone special education schools.
We assessed the reliability of all datasets by performing electronic testing, interviewing knowledgeable officials, or reviewing relevant documentation. We determined that all datasets we used were sufficiently reliable for our analyses of how gen ed placements for students with disabilities varied nationally, across states, and across districts, and to understand factors that influenced educational placement.
To further understand factors that influence student placement and how selected districts and schools encourage a sense of belonging in the school community for students with disabilities, we conducted in-person site visits to Connecticut, Illinois, and Washington. Within these states, we selected districts to represent a mix of enrollment sizes and locales (i.e., urban, suburban, rural). Within these districts, we visited a mix of elementary, middle, and high schools to gather information across school levels. In total, we held 31 interviews with officials from 12 districts and educators from eight schools to obtain perspectives on (1) how resources (e.g., staffing and curriculum) and other factors (e.g., parental involvement or school environment) influenced decisions about students’ educational settings, and (2) how district and school officials encouraged a sense of belonging for students with disabilities.
We used a qualitative analysis software program to analyze these interviews. We coded content from the interviews by categories that corresponded to our research questions and key terms discussed in the interviews. We then analyzed the coded content to identify common themes across the districts and schools we visited. Information from this analysis is not generalizable across all K–12 public schools.
To address how schools and districts encouraged a sense of belonging, we reviewed Education’s What Works Clearinghouse (Clearinghouse)—a source of scientific evidence on education programs, products, practices, and policies—to identify best practices for promoting belonging in school for students with disabilities. Specifically, we reviewed studies that Education classified as strong (tier 1), moderate (tier 2), or promising (tier 3) which align with categories of allowable evidence under the Elementary and Secondary Education Act of 1965, as amended (ESEA).[12] We used these studies as illustrative examples.
We also deployed a nongeneralizable, structured, opt-in online questionnaire to collect perspectives of former and current students with disabilities in K–12 public schools on their experiences with their educational setting and their feelings of belonging in school.[13] We pretested the questionnaire with former and current K–12 public school students with disabilities to obtain feedback on the content, clarity, and accuracy of the questions and response options. A link to the questionnaire was posted to GAO’s Facebook, LinkedIn, and X social media pages for eligible parents and caregivers to opt in. Respondents could skip questions if they wished. We received 34 responses.
To address all research questions, we interviewed special education experts to better understand existing research on LRE and how they defined LRE.[14] We also interviewed state educational agency officials from Connecticut, Illinois, and Washington to learn about their LRE policies and procedures. Finally, we interviewed Education officials and reviewed federal laws, regulations, and guidance to understand Education’s role.
We conducted this performance audit from September 2024 to July 2026 in accordance with generally accepted government auditing standards. Those standards require that we plan and perform the audit to obtain sufficient, appropriate evidence to provide a reasonable basis for our findings and conclusions based on our audit objectives. We believe that the evidence obtained provides a reasonable basis for our findings and conclusions based on our audit objectives.
Background
|
Least Restrictive Environment Education Settings Education collects data on the number of students with disabilities in: 1. General education (gen ed) for 80 percent or more of their day 2. Gen ed between 40 and 79 percent of their day 3. Gen ed for less than 40 percent of their day 4. Separate special education schools 5. Residential facilities 6. A hospital or who are homebound 7. Private schools (parentally placed) 8. Correctional facilities Source: GAO analysis of Department of Education data documentation. | GAO‑26‑107814 |
Students with disabilities are a diverse group with a range of abilities and needs. These students are generally identified as eligible for special education under one or more of a variety of different disability categories recognized under IDEA, such as speech or language impairments and intellectual disabilities.[15]
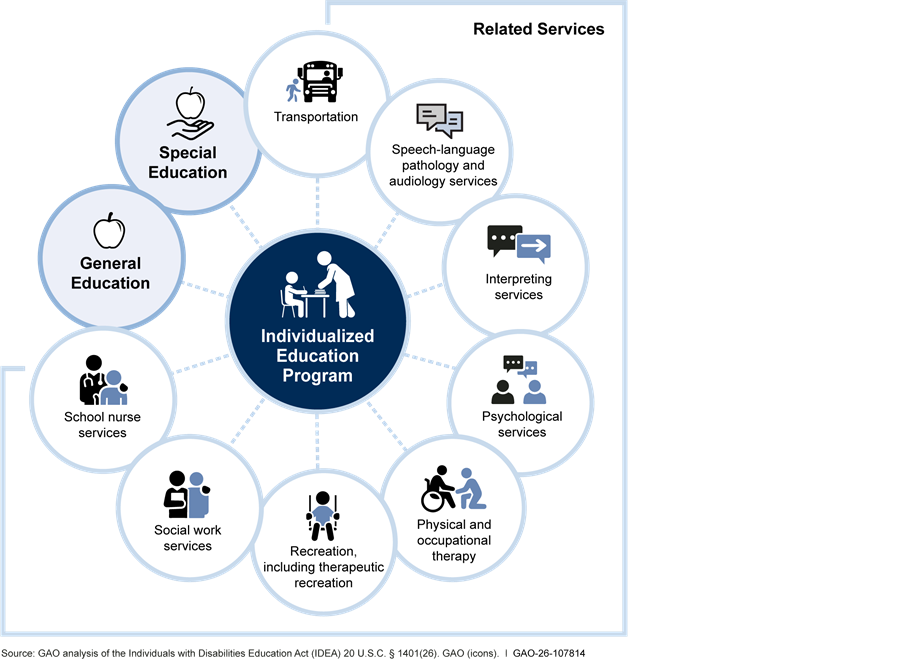
Under IDEA, students with disabilities receive special education and related services as outlined in their IEPs in a variety of educational settings. An IEP is an individualized written plan developed by a team, which includes district and school officials, parents, and, when appropriate, the student. It includes things like a statement of the student’s present levels of academic achievement and functional performance, annual goals, and the services needed to attain those goals.[16] Related services can include social work services, interpreting services, and other services (see fig. 1). As with special education, related services can be provided inside or outside a gen ed classroom.
Note: A free appropriate public education is guaranteed to
students with disabilities under IDEA. It includes special education and
related services (such as speech therapy, psychological services, occupational
therapy, and physical therapy) that, among other requirements, are provided as
laid out in an individualized education program (IEP). An IEP is a written plan
developed by a team that includes district and school officials, parents, and
(when appropriate) the student. The IEP includes things like a statement of the
student’s present levels of academic achievement and functional performance,
annual goals, and the services the student needs to attain those goals. 20
U.S.C. § 1414(d)(1)(A)-(B).
The Number of Students with Disabilities in General Education Increased Nationally from School Years 2012–13 Through 2023–24, with Larger Growth in Some States
The Number of Students with Disabilities in General Education for At Least 40 Percent of Their Day Increased Nationally from 4.6 Million to 5.7 Million from School Years 2012–13 through 2023–24
Nationally, the number of students with disabilities in gen ed for at least 40 percent of their day increased by 25 percent, or 1.1 million students, from school year 2012–13 through 2023–24 (see fig. 2).[17] In comparison, the total number of students with disabilities increased by 21 percent during this period. Growth in the number of students with disabilities in gen ed for at least 40 percent of their day was driven by the share of students with disabilities in gen ed for at least 80 percent of their day.
Figure 2: National Enrollment Trends for Student with Disabilities in the General Education Classroom (Gen Ed) for At Least 40 Percent of Their Day (School Years 2012–13 through 2023–24)
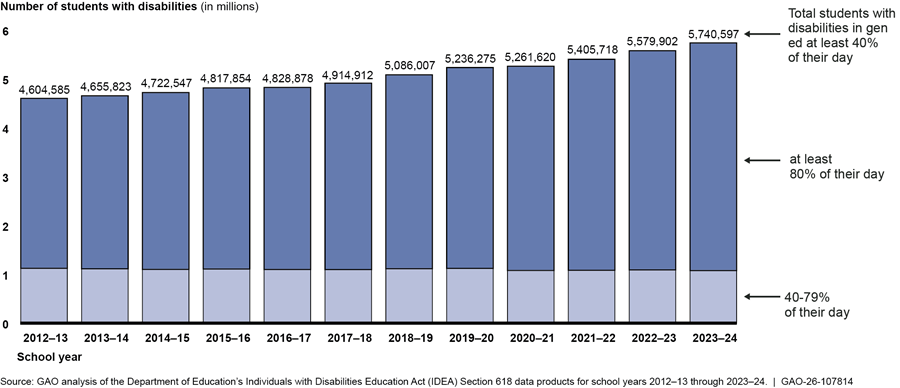
Note: Education collects data on eight educational settings. Three focus on time students with disabilities spent in gen ed: (1) less than 40 percent of time in gen ed, (2) 40–79 percent, and (3) 80 or more percent. GAO combined the latter two categories for this figure. New Mexico did not report any of these data for school year 2023-24.
We analyzed the number of students with disabilities in gen ed for at least 40 percent of their day by race and ethnicity, type of disability, sex, English learner status, and school level. We found that the number of students with disabilities in this educational setting increased from school years 2012–13 through 2023–24 across most student characteristics.[18]
Race and Ethnicity
The number of students with disabilities in gen ed for at least 40 percent of their day increased across most race and ethnicity groups (six of seven) from school years 2012–13 through 2023–24 (see table 1). Notably, we found that during this period and in this setting the share of Hispanic, Multiracial, and Asian students as a percentage of all students with disabilities increased. The share of White, Black, and American Indian and Alaska Native students with disabilities decreased. Changes in the composition of students with disabilities by race and ethnicity were roughly proportional to changes in the composition of the overall K–12 public school student population by race and ethnicity, between school years 2012–13 through 2023–24.
Table 1: National Enrollment Trends for Students with Disabilities in the General Education Classroom (Gen Ed) for At Least 40 Percent of Their Day, by Race and Ethnicity (School Years 2012–13 and 2023–24)
|
|
Number of students with disabilities in gen ed at least 40 percent of their day |
Share of students with disabilities in gen ed at least 40 percent of their day |
Share of students enrolled in K–12 public schools |
|||
|
Students by race and ethnicity |
School year 2012–13 |
School year 2023–24 |
School year 2012–13 |
School year 2023–24 |
School year 2012–13 |
School year 2023–24 |
|
White |
2,501,578 |
2,742,728 |
54% |
46% |
51% |
44% |
|
Hispanic |
983,821 |
1,700,288 |
21% |
28% |
24% |
29% |
|
Black |
826,040 |
984,826 |
18% |
16% |
16% |
15% |
|
Multiracial |
118,479 |
316,689 |
2.6% |
5.3% |
2.8% |
5.1% |
|
Asian |
93,519 |
149,311 |
2.0% |
2.5% |
4.8% |
5.6% |
|
American Indian and Alaska Native |
67,493 |
66,849 |
1.5% |
1.1% |
1.1% |
0.9% |
|
Native Hawaiian and Pacific Islander |
13,655 |
16,362 |
0.3% |
0.3% |
0.4% |
0.4% |
Source: GAO analysis of the Department of Education’s Individuals with Disabilities Education Act (IDEA) Section 618 Data Products for School Years 2012–13 and 2023–24 and Education’s Common Core Data for School Years 2012–13 and 2023–24. | GAO‑26‑107814
Note: Education collects data on eight educational settings. Three focus on time students with disabilities spent in gen ed: (1) less than 40 percent of time in gen ed, (2) 40–79 percent, and (3) 80 or more percent. GAO analyzed the share of students by race and ethnicity relative to all students with disabilities for students in gen ed for at least 40 percent of their day. Percentages do not add up to 100 percent due to rounding. New Mexico did not report any of these data for school year 2023–24.
Type of Disability
The number of students with disabilities in gen ed for at least 40 percent of their day increased across most types of disabilities (eight of 12) from school years 2012–13 through 2023–24 (see table 2). While the shares of students with disabilities changed by disability type, we found that specific learning disability, speech or language impairment, and other health impairment remained the three most common disability types in this educational setting.
Table 2: National Enrollment Trends for Students with Disabilities in the General Education Classroom (Gen Ed) for At Least 40 Percent of Their Day by Type of Disability (School Years 2012–13 and 2023–24)
|
|
Number of students with disabilities in gen ed at least 40 percent of their day |
Share of students with disabilities in gen ed at least 40 percent of their day |
||
|
Student by type of disability |
School year 2012–13 |
School year 2023–24 |
School year 2012–13 |
School year 2023–24 |
|
Specific learning disability |
2,080,660 |
2,285,213 |
45% |
40% |
|
Speech or language impairment |
952,987 |
1,058,151 |
21% |
18% |
|
Other health impairment |
652,812 |
1,030,020 |
14% |
18% |
|
Autism |
253,750 |
543,868 |
5.5% |
9.5% |
|
Emotional disturbance |
222,075 |
231,135 |
4.8% |
4.0% |
|
Intellectual disability |
180,492 |
199,274 |
3.9% |
3.5% |
|
Hearing impairment |
50,398 |
47,800 |
1.1% |
0.8% |
|
Orthopedic impairments |
36,885 |
19,116 |
0.8% |
0.3% |
|
Multiple disabilities |
36,384 |
42,136 |
0.8% |
0.7% |
|
Visual impairment |
19,316 |
18,163 |
0.4% |
0.3% |
|
Traumatic brain injury |
17,855 |
16,890 |
0.4% |
0.3% |
|
Deaf-blindness |
415 |
741 |
0.01% |
0.01% |
Source: GAO analysis of the Department of Education’s Individuals with Disabilities Education Act (IDEA) Section 618 Data Products for School Years 2012–13 and 2023–24. | GAO‑26‑107814
Note: Education collects data on eight educational settings. Three focus on time students with disabilities spent in gen ed: (1) less than 40 percent of time in gen ed, (2) 40–79 percent, and (3) 80 or more percent. GAO analyzed the share of students by disability relative to all students with disabilities for students in gen ed for at least 40 percent of their day. Some students may have multiple disabilities. GAO did not report on data on the number of students with developmental delay because Education changed its definition during the time period GAO analyzed. New Mexico did not report any of these data for school year 2023–24. Iowa did not report data on type of disability for school year 2023–24.
Sex, English Learner Status, and School Level
The number of students with disabilities in gen ed for at least 40 percent of their day increased across sex, English learner status, and school level for school years 2013–14 through 2023–24 (see table 3).
Table 3: National Enrollment Trends for Students with Disabilities in the General Education Classroom (Gen Ed) for At Least 40 Percent of Their Day by Sex, English Learner Status, and School Level (School Years 2012–13 and 2023–24)
|
|
Number of students with disabilities in gen ed at least 40 percent of their day |
Share of students with disabilities in gen ed at least 40 percent of their day |
||
|
Student groups |
School Year 2012–13 |
School Year 2023–24 |
School Year 2012–13 |
School Year 2023–24 |
|
Girls |
1,557,149 |
2,163,131 |
34% |
36% |
|
Boys |
3,047,436 |
3,810,888 |
66% |
64% |
|
English learners |
421,725 |
725,480 |
9.2% |
13% |
|
Primary school |
2,178,626 |
2,825,297 |
50% |
51% |
|
Secondary school |
2,198,911 |
2,714,853 |
50% |
49% |
Source: GAO analysis of the Department of Education’s Individuals with Disabilities Education Act (IDEA) Section 618 Data Products for School Years 2012–13 and 2023–24 and Education’s Common Core Data for School Years 2012–13 to 2023–24. | GAO‑26‑107814
Note: Education collects data on eight educational settings. Three focus on time students with disabilities spent in gen ed: (1) less than 40 percent of time in gen ed, (2) 40-79 percent, and (3) 80 or more percent. GAO analyzed the share of students by sex, English learner status, and school level relative to all students with disabilities for students in gen ed for at least 40 percent of the day. For the purpose of this analysis, GAO defines primary school as students aged 6 to 11 and secondary school as students aged 12 to 17. New Mexico did not report any of these data for school year 2023–24.
Most States Experienced Increases in the Share of Students with Disabilities in General Education at Least 40 Percent of Their Day
From school year 2012–13 through 2023–24, the share of students with disabilities in gen ed for at least 40 percent of their day increased in 42 of 50 states and the District of Columbia (states) (see fig 3).[19] The District of Columbia and California had the largest increases (7.7 and 6.4 percentage points, respectively). In contrast, North Dakota and Nevada had the largest decreases (3.2 and 2.6 percentage points, respectively).
Figure 3: Changes in Shares of Students with Disabilities in General Education for At Least 40 Percent of Their Day, By State (School Years 2012–13 through 2023–24)
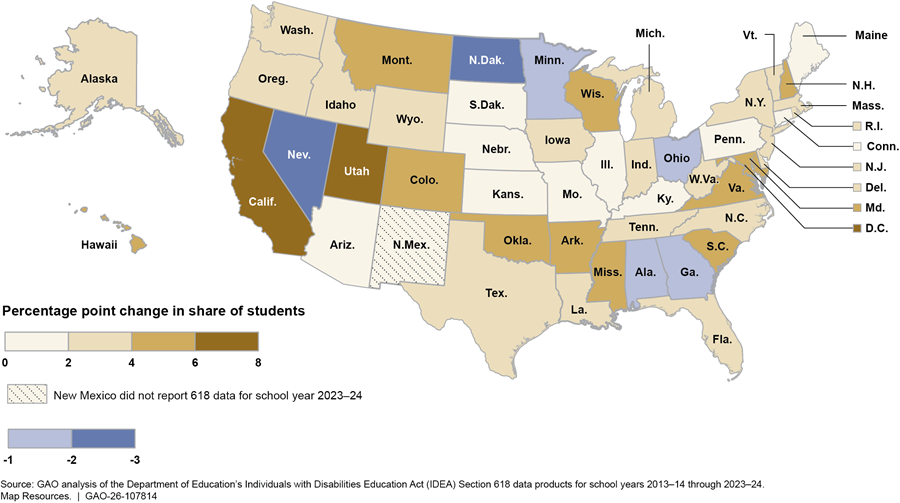
Note: Education collects data on eight educational settings. Three focus on time students with disabilities spent in gen ed: (1) less than 40 percent of time in gen ed, (2) 40-79 percent, and (3) 80 or more percent. For the purposes of our analysis, GAO focused on the students in gen ed for at least 40 percent of their day. New Mexico did not report Section 618 data for school year 2023–24.
Similar to our national analysis, we analyzed the share of students with disabilities in gen ed for at least 40 percent of their day, by race and ethnicity, type of disability, sex, English learner status, and school level, for states and the District of Columbia for school years 2012–13 through 2023–24.[20]
· The share of Hispanic and Multiracial students with disabilities increased in all states with available data (50 of 50). For example, we found that the largest increases in the share of Hispanic students with disabilities were in Hawaii, Connecticut, and New Jersey. We also found that the largest increases in the share of Multiracial students with disabilities were in Hawaii, Alaska, and Oklahoma.
· The share of students with orthopedic disabilities (49 of 49), hearing disabilities (44 of 49), and visual disabilities (42 of 49) decreased in most states. For example, we found that the largest decrease in the share of orthopedic disabilities occurred in Colorado, Louisiana, and Michigan.
· The share of girls with disabilities increased across all states (50 of 50). We found that the largest increases in the share of girls with disabilities were in Connecticut, Idaho, Mississippi, and Texas.
· The share of English learners with disabilities increased in most states (45 of 50). We found that the largest increase in the share of English learners with disabilities were in Illinois, the District of Columbia, Maryland, and Rhode Island.
· The share of students with disabilities in primary schools increased in most states (40 of 50). We found that the largest increases in the share of students with disabilities in primary schools were in Texas, North Dakota, New Hampshire, and Rhode Island.
State Data from School Year 2023–24 Showed Similarities in Where Students with Disabilities Were Educated Across States, While District Data Showed Wider Variation Within States
We found that, on average, the percentage of students with disabilities in gen ed at least 40 percent of their day ranged from 71 percent to 93 percent across states in school year 2023–24—the most recent year for which data were available for states (see fig. 4).
Figure 4: Average Percentage of Students with Disabilities in the General Education Classroom (Gen Ed) for At Least 40 Percent of Their Day, By State (School Year 2023–24)
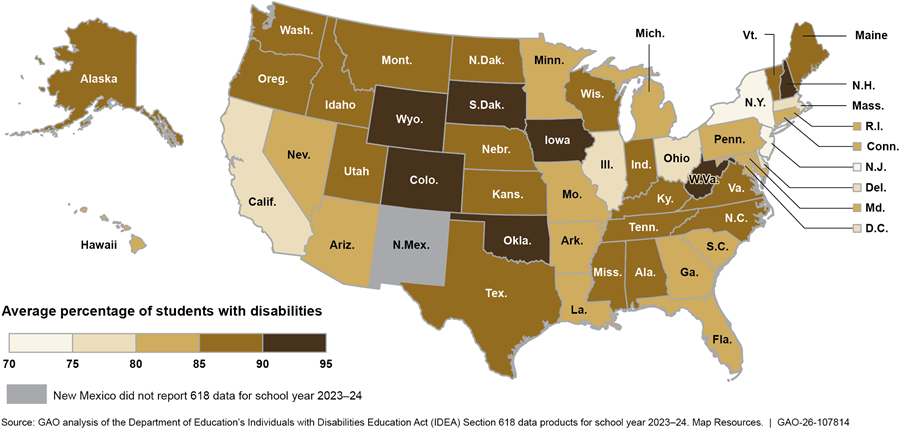
Note: Education collects information from districts on the number of students with disabilities in gen ed for: students with disabilities in gen ed for less than 40 percent, from 40 up to 79 percent, and from 80 up to 100 percent of their day. For the purposes of our analysis, GAO focused on the students in gen ed for at least 40 percent of their day.
Across states and the District of Columbia, we found some common characteristics for students with disabilities in gen ed for at least 40 percent of their day in school year 2023–24.[21] For example:
· Students with a specific learning disability were often placed in gen ed for at least 40 percent of their day. All states (49 of 49) had this type of disability among their top three with 84 to 99 percent of these students placed in this educational setting.
· English learners with disabilities were placed in gen ed for at least 40 percent of their day at high rates. At least 75 percent of English learners with disabilities were placed in this educational setting in most states (49 of 50).
· Girls were placed in gen ed for at least 40 percent of their day more often than boys. We found that a higher percentage of girls were placed in this educational setting in all states (50 of 50). For example, Delaware had the largest difference between the share of girls and boys with disabilities in this educational setting (84 percent and 78 percent, respectively).
· Student placement decisions within states were generally consistent across race and ethnicity. Most states (40 of 50) placed at least 70 percent of students with disabilities, regardless of race and ethnicity, in this educational setting.
· Student placement decisions within states were consistent across school levels. In most states (46 of 50), across primary and secondary schools, placement of students with disabilities in this educational setting was within 5 percentage points.
In contrast to the generally consistent patterns in placement decisions we observed across states, we found varying patterns across districts within states during school year 2022–23 (according to the most recent available district-level data) (see app. I).[22] For example:
· In Wyoming, on average, the top quarter of districts had 98 percent of students with disabilities in gen ed for at least 40 percent of their day compared to 89 percent in the bottom quarter of districts.
· In Arizona, on average, the bottom quarter of districts had 52 percent of students with disabilities in gen ed for at least 40 percent of their day compared to 93 percent in the top quarter of districts.
Additionally, we analyzed how districts in states we visited—Connecticut, Illinois, and Washington—placed students with disabilities in gen ed for at least 40 percent of their day by student characteristics.[23] We found little difference in student group representation (less than 5 percentage points) between district and state averages.
School Resources, Parental Involvement, and School Environment Influenced Where Students with Disabilities Learned
Districts With Certain Poverty Levels and Without Special Education Schools Were Associated with Higher Rates of Students with Disabilities in General Education for Much of Their Day
For school year 2022–23 (the most recent data available), certain factors related to district resources were associated with higher rates of students with disabilities placed in gen ed for at least 40 percent of their school day, nationwide, according to our regression analysis.[24] Specifically, we found higher placement rates in this educational setting in districts: (1) with higher and lower levels of poverty,[25] (2) without standalone special education schools, and (3) with lower per pupil revenue (i.e., funding per student).[26]
Poverty Level of District
We found that students with disabilities who went to school in lower and higher-poverty districts were associated with higher rates of placement in gen ed for at least 40 percent of their day compared to districts in the middle of the poverty range (see fig. 5).
Figure 5: Association Between District Poverty Level and Estimated Percentage of Students with Disabilities in the General Education Classroom (Gen Ed) for At Least 40 Percent of Their Day
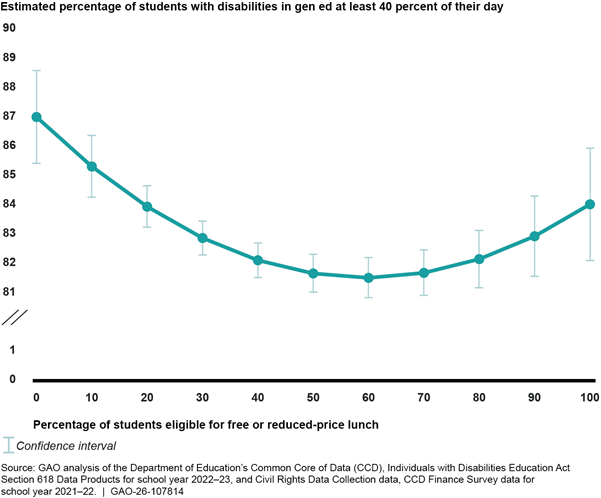
Note: Education collects data on eight educational settings. Three focus on time students with disabilities spent in gen ed: (1) less than 40 percent of time in gen ed, (2) 40–79 percent, and (3) 80 or more percent. The regression analysis found a statistically significant relationship between poverty and the percentage of students with disabilities in gen ed for at least 40 percent of their day that follows the curve shown in the figure. Overlapping confidence intervals do not necessarily indicate that the difference between estimates is insignificant. GAO’s regression analysis included state fixed effects and robust standard errors. GAO excluded districts with fewer than 10 students with disabilities from this analysis to minimize differences that result from small sample sizes. GAO used percentage of students in the district eligible for the free or reduced-price lunch program as a proxy for poverty.
Availability of Special Education Schools
Districts that did not have standalone special education schools were associated with a 5.2 percentage point increase in the percentage of students with disabilities in gen ed for at least 40 percent of their day, relative to districts with a special education school, on average.
Per Pupil Revenue
Districts with lower per pupil revenue were associated with a higher percentage of students with disabilities in gen ed for at least 40 percent of their day.[27] Specifically, we found a 30 percent decrease in per pupil revenues in a district was associated with a 1.6 percentage point increase in the share of students with disabilities in this educational setting, on average.
Other Factors
We also found that the number of school counselors and the percentage of English learners in the district were associated with students’ placement. We found, however, that large changes would be needed to shift the percentage of students with disabilities in gen ed for at least 40 percent of their day. For example, our analysis indicated that an additional 100 students in a school counselor’s caseload was associated with a less than 1 percentage point (.35) decrease in the percentage of students with disabilities in gen ed for at least 40 percent of their day, on average. In addition, a 1 percentage point increase in the percentage of English learners in a district was associated with a less than 1 percentage point (.07) increase in the percentage of students with disabilities in the same educational setting, on average.
Our regression also identified some factors that did not have an association with the rates of students with disabilities spending at least 40 percent of their day in gen ed. Such factors included: (1) the ratio of teachers to students, (2) the ratio of other support staff to students (i.e., nurses and social workers), and (3) other district-level demographic characteristics, including student race, ethnicity, and sex.
Officials and Educators in the 12 Districts We Visited Cited Resources, Parental Involvement, and School Environment as Factors That Influenced Students’ Educational Setting
In our interviews, officials and educators from state educational agencies, districts, and schools in Connecticut, Illinois, and Washington commonly identified resource availability, parental involvement in educational placement decisions, and school environment as factors that influenced the educational setting of students with disabilities. Regardless of the factor, officials and educators across all districts and schools we visited said they supported students as best they could with the resources available and followed their districts’ policies and processes for determining a student’s appropriate education setting.[28]
Availability of Resources
In keeping with our regression analysis, officials at most states, districts, and schools we visited cited availability of resources as the most common factor in determining a student’s educational setting. For example, state education agency officials in two of three states said that specific resource constraints that influenced student educational settings included staffing, lack of available specialized services and programs, and the costs of specialized and out-of-district placement. Officials at 10 of the 12 districts and educators at six of the eight schools we visited also told us that staffing was a key factor that influenced students’ placement in educational settings and generally affected their ability to provide special education services. For instance, educators from four schools said that they needed more paraeducators to help students with disabilities meaningfully participate in gen ed. See figure 6 for quotations from district officials.
Figure 6: Voices from the Field: How Staffing Can Affect Educational Placement Decisions for Students with Disabilities
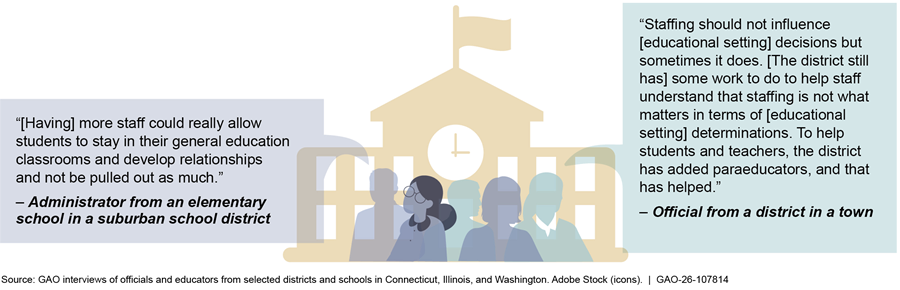
Note: GAO selected quotations that represent the range of responses it received when we asked about the extent to which staffing affected educational placement decisions. These quotations are not generalizable to all K–12 public schools.
Officials from 10 of 12 districts and educators from six of eight schools we visited said that the lack of availability of programs within a district limited their ability to provide services for some students with disabilities. For example, officials from one district told us that educational placement decisions were affected when they did not have sufficient resources or programs to support students with significant medical or intellectual impairments. District officials from six of 12 districts said that in cases where their districts did not have the resources or services to meet the students’ needs, they placed students with disabilities outside their districts. District officials and an educator from three of 12 districts also noted challenges providing services to students who needed higher levels of services, such as self-contained classrooms where students spend their day entirely outside those of the gen ed classroom. See figure 7 for quotations from officials and educators we spoke with.
Figure 7: Voices from the Field: How Availability of Programs and Services Affect Educational Placement Decisions
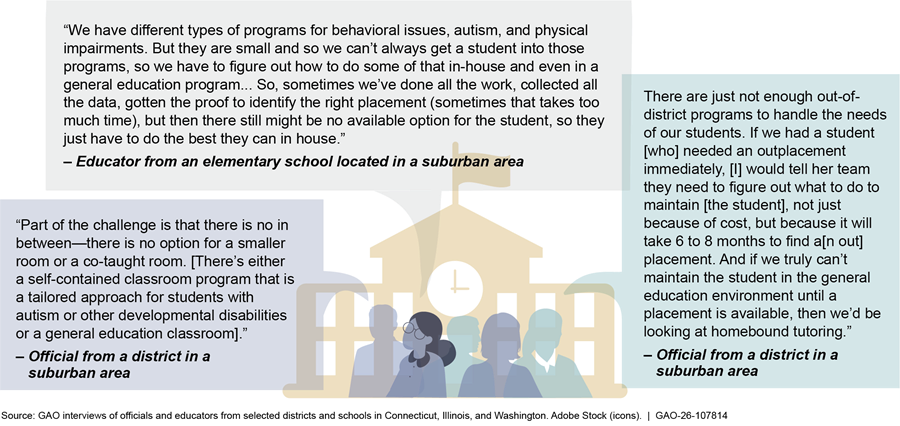
Note: GAO selected quotations that represent the range of responses it received when we asked about the extent to which the availability of programs and services affect educational placement decisions. These quotations are not generalizable to all K–12 public schools.
Parental Involvement
Officials from almost all the districts, schools, and states we visited cited parental involvement (e.g., level of involvement in the student’s IEP meetings) as a factor that can influence the educational setting for students with disabilities. For example, officials from nine of 12 districts and educators from five of eight schools told us that some parents had specific educational settings in mind for their child and requested they be assigned to that setting—i.e., they wanted their child in the gen ed classroom with additional services outside the classroom. On the other hand, officials also said that some parents were not involved in their child’s IEP meetings.
In addition, current and former students with disabilities who completed our opt-in, nongeneralizable online questionnaire described the effect of their parents’ involvement on their school experience.[29] For example, a few students noted how much their parents worked to secure related services and support their education (see fig. 8).
Figure 8: Selected Examples of Responses about Parental Involvement in Educational Placement Decisions
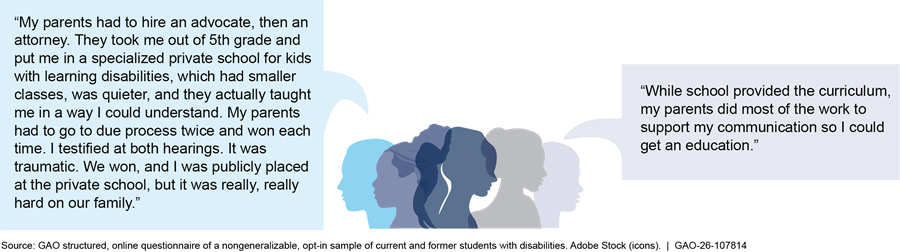
Note: GAO selected excerpts from a structured, online questionnaire it used to solicit feedback from a nongeneralizable, opt-in sample of current and former students with disabilities in calendar year 2025 to learn about their experiences in K–12 public schools. GAO received 34 responses from current and former students with disabilities. It selected quotations that represent a range of responses provided when respondents discussed parental involvement in their educational placement decisions. These responses are not generalizable.
School Environment
Officials in more than half of the districts (eight of the 12) and educators from half of the schools (four of eight) we visited said that school environment (i.e., facilities and school culture) played a key role in deciding educational settings for students with disabilities. For example, officials from six districts and educators from three schools said that they did not have access to appropriate spaces for the needs of some students with disabilities (e.g., accessible playgrounds or facilities specific to specialized courses such as life skills). In addition, officials from six districts and two schools said that school culture or personal beliefs also affected educational setting decisions. For example, officials from one district said that some principals felt that every child with an IEP needed 3 hours a day of special education instruction, regardless of their skill level (see fig. 9).
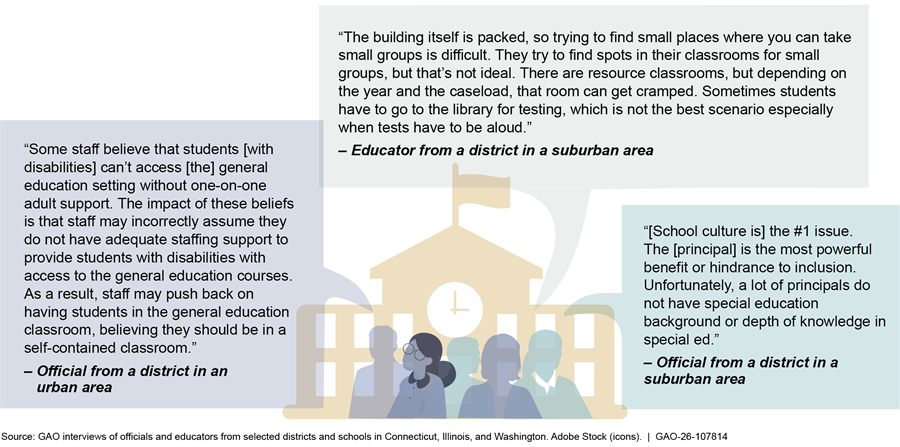
Note: GAO selected quotations that represent the range of responses it received when it asked about the extent to which school environment (i.e., facilities and school culture) can affect least restrictive environment decisions. These quotations are not generalizable to all K–12 public schools.
District Officials and School Educators in the Districts We Visited Described Mixed Success Creating a Sense of Belonging in School for Students with Disabilities
The school experiences of students with disabilities and relationships with their teachers and peers can affect their sense of belonging, according to Education’s research.[30] Officials and educators we interviewed outlined challenges and successes creating an inclusive education and a sense of belonging for students with disabilities.
Challenges for Creating a Sense of Belonging
Officials from most districts (10 of 12) and all eight schools outlined challenges for creating a sense of belonging for students with disabilities in the school community. For example:
· Teacher contract limitations. In one state we visited, multiple officials in one district explained that labor contract provisions allowed teachers to opt out of co-teaching (i.e., a gen ed and a special education teacher working together in a gen ed classroom), which may have affected placements for students with disabilities.
· School culture. Officials from all three states we visited told us that school culture, such as student behaviors or staff mindset, could create challenges for students with disabilities. An educator and social worker from one school explained that students with disabilities were sometimes bullied by their peers. A gen ed teacher explained that sometimes students with disabilities avoided asking for help or accepting accommodations included in their IEP because they did not want to be singled out. A district official in another state said that some staff believed that students with disabilities may not have been able to comprehend the gen ed curriculum without one-on-one support from paraeducators and thus should have been taught exclusively by special education teachers in a special education setting.
· Resource constraints. Officials from two states we visited said they faced challenges including students with disabilities in gen ed or extracurricular activities because they could not afford to increase educators’ salaries to fill vacancies. For instance, an official from one school said that they had good teachers and special education staff but struggled to fill vacancies because “the pay rate [was] not enough to entice people.” They further explained that the school had a paraeducator vacancy for months and because of that they had unsupported students with disabilities who “elop[ed] from the classroom all over the building and [ran] around.” They stated that more paraeducators and behavioral health staff would have helped address students’ needs. Another official quoted a local Board of Education member who said that “[they could not] be expected to support special education at the level it is required because it is too expensive.” Officials and educators at a school in another state explained that to meet the volume of elevated needs of students with disabilities, the district would have needed to overcome funding constraints and hire an outside athletic coach with needed expertise to meaningfully include students with disabilities in extracurriculars and sports.
According to our non-generalizable, opt-in online questionnaire of current and former special education students, respondents described experiencing some of the same challenges to belonging that were reported by officials (see fig. 10). Respondents were generally unsatisfied with their access to extracurricular activities across grade levels.[31] Further, less than half of those who responded reported that teachers or staff encouraged them to participate in extracurricular activities, sports, or clubs.[32] Responses were similar regarding whether other students also encouraged them to participate in these activities.[33]
Figure 10: Selected Examples of Students with Disabilities Not Feeling a Sense of Belonging in Their School Communities
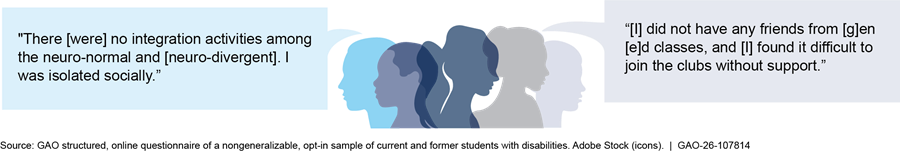
Notes: GAO used a structured, online questionnaire to solicit feedback from a nongeneralizable, opt-in sample of current and former students with disabilities in calendar year 2025 to learn about their experiences in K–12 public schools. GAO received 34 responses. It selected quotations that represented responses provided when respondents discussed issues around belonging at school. These responses are not generalizable.
Successful Approaches for Creating Belonging
Officials from some of the districts (seven of 12) and schools (three of eight) said they had identified some successful approaches in their schools for connecting students with disabilities with curriculum or their peers by being in gen ed and participating in extracurricular activities. For example:
· Connecting with the curriculum. Officials from one district praised their principal for taking extra steps to increase the time students with disabilities could spend in gen ed. The principal shifted class schedules so that students with disabilities could attend classes better aligned with their IEP goals. The school developed an overall schedule around students’ interests and availability, making sure classes like career and technical education and physical education were in periods where students with disabilities could participate with their peers without disabilities. In another example, an official from a district with K–6 students with disabilities said that teachers modified the curriculum and provided supplemental aid and supports to keep students with disabilities in gen ed with their peers. District officials highlighted that this practice ensured that students with disabilities could learn and collaborate with their peers.
· Connecting with peers. Educators from one high school said they ensured that students with disabilities were not all seated together in gen ed and that group work included students with disabilities partnering with students without disabilities. An official in another school said they made an extra effort to pair students in non-academic activities. For example, all students picked up recycling around the building once a week and participated in activities such as pumpkin decorating and gingerbread house making. The official noted observing students with disabilities and those in gen ed forming friendships.
· Connecting through extracurricular activities. Officials from four of 12 districts highlighted nation-wide programs that their students with disabilities participated in, such as Best Buddies and Special Olympics. In these programs, students with disabilities partner with other students to build friendships, improve social skills, and create inclusive school communities. Educators from two of eight schools we visited told us they had school-specific programs such as peer tutoring and “buddy lunches.”
|
Department of Education’s Best Practices for Promoting Inclusion Education’s What Works Clearinghouse identifies several best practices for promoting belonging for students with disabilities in the classroom and school community. For example: · Using behavioral interventions that require minimal resources to demonstrate expected classroom behaviors. · Classroom management strategies aimed at improving social skills for students, minimizing disruptive behaviors, and creating a positive education setting for all students. · Targeted instructional practices for teacher-identified students aimed at promoting positive teacher-student interactions and student engagement. Source: GAO analysis of Department of Education’s What Works Clearinghouse. | GAO‑26‑107814 |
Education’s What Works Clearinghouse, a database of scientific evidence on education programs, products, practices, and policies, provides examples of best practices for creating inclusion in the classroom.
According to our online questionnaire of current and former special education students, respondents in higher grades reported higher levels of satisfaction with the amount of time they spent in gen ed and special education settings, their classroom experiences, and their ability to learn compared to respondents in lower grades. For example, with regard to their ability to learn in gen ed, more respondents in kindergarten through fifth grade were dissatisfied compared to those in grades nine through 12. Also, seven of 31 responses for students in kindergarten through fifth grade indicated the student was satisfied with the amount of time they spent in general education compared to seven of 21 responses for students in grades nine through 12.[34]
See figure 11 for experiences shared by current and former students with disabilities.
Figure 11: Selected Examples of Participation in Extracurricular Activities from Students with Disabilities
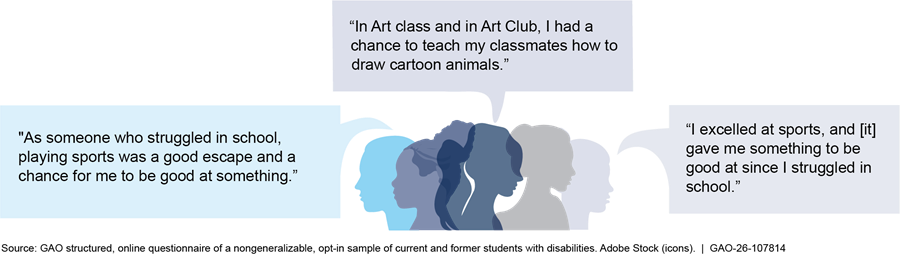
Notes: GAO used a structured, online questionnaire to solicit feedback from a nongeneralizable, opt-in sample of current and former students with disabilities in calendar year 2025 to learn about their experiences in K–12 public schools. GAO received 34 responses. It selected quotations that elaborated on student experiences with extracurricular activities when answering our questions about belonging in school. These responses are not generalizable.
Agency Comments
We provided a draft of this report to Education for review and comment. Education provided written technical comments, which we incorporated as appropriate.
We are sending copies of this report to the appropriate congressional committees, the Secretary of Education, and other interested parties. In addition, the report will be available at no charge on the GAO website at https://www.gao.gov.
If you or your staff have any questions about this report, please contact me at NowickiJ@gao.gov. Contact points for Offices of Congressional Relations and Media Relations may be found on the last page of this report. GAO staff who made key contributions to this report are listed in appendix II.

Jacqueline M. Nowicki, Director
Education, Workforce, and Income Security Issues
We found there was variation in the percentage of students with disabilities who spent at least 40 percent of their day in the general education classroom (gen ed). See table 4 for the average percentage of students with disabilities who spent at least 40 percent of their day in gen ed, in the top and bottom quarters for each state.
Table 4: District Variation in Placement Decisions for Students with Disabilities in the General Education Classroom (gen ed) for At Least 40 Percent of Their Day, School Year 2022–23
|
State |
Top quarter, average percent |
Bottom quarter, average percent |
|
Alabama |
95 |
74 |
|
Alaska |
96 |
63 |
|
Arizona |
93 |
52 |
|
California |
88 |
67 |
|
Colorado |
98 |
68 |
|
Connecticut |
93 |
71 |
|
Delaware |
85 |
71 |
|
Florida |
94 |
73 |
|
Georgia |
89 |
72 |
|
Idaho |
96 |
80 |
|
Illinois |
88 |
65 |
|
Indiana |
92 |
80 |
|
Iowa |
95 |
85 |
|
Kansas |
95 |
84 |
|
Kentucky |
95 |
85 |
|
Louisiana |
91 |
74 |
|
Maine |
91 |
70 |
|
Maryland |
91 |
79 |
|
Massachusetts |
88 |
70 |
|
Michigan |
97 |
59 |
|
Minnesota |
92 |
72 |
|
Mississippi |
91 |
76 |
|
Missouri |
95 |
65 |
|
Montana |
93 |
58 |
|
Nebraska |
94 |
83 |
|
Nevada |
96 |
83 |
|
New Hampshire |
97 |
62 |
|
New Jersey |
88 |
57 |
|
New Mexico |
94 |
80 |
|
New York |
86 |
59 |
|
North Carolina |
93 |
71 |
|
North Dakota |
94 |
61 |
|
Ohio |
88 |
69 |
|
Oklahoma |
98 |
82 |
|
Oregon |
94 |
81 |
|
Pennsylvania |
93 |
78 |
|
Rhode Island |
93 |
76 |
|
South Carolina |
89 |
65 |
|
South Dakota |
97 |
72 |
|
Tennessee |
92 |
82 |
|
Texas |
93 |
74 |
|
Utah |
97 |
67 |
|
Vermont |
94 |
72 |
|
Virginia |
92 |
77 |
|
Washington |
94 |
83 |
|
West Virgina |
95 |
76 |
|
Wisconsin |
96 |
79 |
|
Wyoming |
98 |
89 |
Source: GAO analysis of the Department of Education’s Individuals with Disabilities Education Act 618 Data Products (618 data) for school year 2022–23 | GAO‑26‑107814
Note: For this analysis, GAO calculated the percentage of students in gen ed for at least 40 percent of their day for each district within a state. It then ordered the districts by this percentage, from high to low and split them into four equal groups, or quarters. GAO refers to the quarter with the highest percentages as the “top” quarter. GAO refers to the quarter with the lowest percentages as the “bottom” quarter. GAO then found the average of each quarter, which it reports here. The number of schools within a district varied widely. The most recent data available to GAO for this analysis from Education’s 618 data were from school year 2022–23. GAO excluded Hawaii and Washington, D.C. from this analysis because they only have one district.
GAO Contact
Jacqueline M. Nowicki, NowickiJ@gao.gov
Staff Acknowledgments
In addition to the contact named above, Jennifer Gregory (Assistant Director), Melinda Bowman and Manuel Valverde (Analysts in Charge), Katie McElroy, Melissa Jaynes, and Kassandra Vaught made key contributions to this report. Also contributing to this report were Elizabeth Calderon, Joanna Carroll, Lara Laufer, Michael Murray, Mimi Nguyen, Jessica Orr, James Rebbe, Rebecca Sero, and Seline Wiedemer.
The Government Accountability Office, the audit, evaluation, and investigative arm of Congress, exists to support Congress in meeting its constitutional responsibilities and to help improve the performance and accountability of the federal government for the American people. GAO examines the use of public funds; evaluates federal programs and policies; and provides analyses, recommendations, and other assistance to help Congress make informed oversight, policy, and funding decisions. GAO’s commitment to good government is reflected in its core values of accountability, integrity, and reliability.
Obtaining Copies of GAO Reports and Testimony
The fastest and easiest way to obtain copies of GAO documents at no cost is through our website. Each weekday afternoon, GAO posts on its website newly released reports, testimony, and correspondence. You can also subscribe to GAO’s email updates to receive notification of newly posted products.
Order by Phone
The price of each GAO publication reflects GAO’s actual cost of production and distribution and depends on the number of pages in the publication and whether the publication is printed in color or black and white. Pricing and ordering information is posted on GAO’s website, https://www.gao.gov/ordering.htm.
Place orders by calling (202) 512-6000, toll free (866) 801-7077,
or
TDD (202) 512-2537.
Orders may be paid for using American Express, Discover Card, MasterCard, Visa, check, or money order. Call for additional information.
Connect with GAO
Connect with GAO on X,
LinkedIn, Instagram, and YouTube.
Subscribe to our Email Updates. Listen to our Podcasts.
Visit GAO on the web at https://www.gao.gov.
To Report Fraud, Waste, and Abuse in Federal Programs
Contact FraudNet:
Website: https://www.gao.gov/about/what-gao-does/fraudnet
Automated answering system: (800) 424-5454
Media Relations
Sarah Kaczmarek, Managing Director, Media@gao.gov
Congressional Relations
David A. Powner, Acting Managing Director, CongRel@gao.gov
General Inquiries
[1]See 20 U.S.C. § 1412(a).
[2]U.S. Department of Education, Building and Sustaining Inclusive Educational Practices Aligned with the Elementary and Secondary Education Act of 1965 (ESEA) and Part B of the Individuals with Disabilities Education Act (IDEA), (Washington, D.C.: January 2025).
[3]20 U.S.C. §§ 1411(a)(1), 1412(a)(1)(B), 1419. Part B grants include the Grants to States program, for children ages 3 through 21, and the Preschool Grants program, for children ages 3 through 5.
[4]Julia M. White, Meghan Cosier, and Deborah Taud, How States Interpret the LRE Clause of IDEA: A Policy Analysis (Minneapolis, MN: University of Minnesota, The TIES Center, November 2018); National Center for Learning Disabilities, Significant Disproportionality in Special Education: Current Trends and Actions for Impact (Washington, D.C.: 2020); and National Council on Disability, IDEA Series: The Segregation of Students with Disabilities (Washington, D.C.: February 7, 2018).
[5]The Department of Education collects data on eight educational settings. Three focus on time students with disabilities spent in gen ed: (1) less than 40 percent of time in gen ed, (2) 40–79 percent, and (3) 80 or more percent. For our national, state, and district analyses, we combined the latter two categories and refer to the setting as “gen ed for at least 40 percent of their day.” This grouping accounted for 83 percent of students with disabilities in school year 2023–24. Unless otherwise stated, all 50 states and Washington, D.C. were included in our analyses. New Mexico did not report 618 data for school year 2023–24.
[6]IDEA Section 618 requires that each state submit data about the number of children with disabilities aged 3 to 21 serviced under IDEA Part B. Specifically, 618 has data on these students by their educational environment, type of disability, race and ethnicity, sex, and English leaner status. We analyzed all 11 years of 618 data available at the time of our review (school years 2012–13 through 2023–24).
[7]We excluded districts with fewer than 10 students with disabilities and districts with fewer than five schools from this analysis to minimize reporting on differences driven by small sample sizes. We excluded Hawaii and Washington, D.C. from this analysis because they only have one district.
[8]CCD is Education’s primary database, updated annually, on all public schools and districts. We analyzed CCD data for school years 2012–13 and 2023–24 to align with our 618 data analysis.
[9]Education’s EdFacts collects data on district and school demographics, program participation, and performance data. This includes data on the number of children with disabilities covered by IDEA who are aged 5 (in kindergarten) through 21. EdFacts data also include district level student counts for each educational environment disaggregated by sex, type of disability, or English learner status. We analyzed school year 2023–24 because it was the most recent available at the time we did our work and to align with our 618 data analysis.
[10]This analysis is not causal and cannot differentiate between whether the different district characteristics caused students’ education setting or vice versa, or whether there are characteristics not in the data that are associated with both the educational setting and the district characteristics. This analysis only applies to public school districts.
[11]The CRDC is a mandatory survey of public school districts and schools in 50 states, Washington, D.C., and Puerto Rico by Education’s Office for Civil Rights. The CRDC collects information on district and school characteristics, such as enrollment, school staff, students with disabilities, and discipline. These are the most recent data available except for CCD. We used 2022–23 CCD data instead of school year 2023–24 data to improve the match across datasets with different year availability. School-level data in the CCD and CRDC were aggregated to the district level. The regression included state fixed effects and robust standard errors. We also excluded districts with fewer than 10 students with disabilities from this analysis.
[12]Studies that are eligible for review by the Clearinghouse use methodologies that align with categories of allowable evidence under the ESEA: (1) strong (tier I), (2) moderate (tier II), and (3) promising (tier III). According to Education officials, the Clearinghouse has not reviewed all studies meeting its research standards, due to resource constraints and other factors. Further, it does not include information about all interventions. Education does not consider the Clearinghouse to be a definitive resource for all interventions that meet the ESEA definition of evidence based.
[13]To be eligible, respondents had to have been students with disabilities who were at least 18 years old, enrolled in K–12 public schools during the period from 2015 through 2025, and have received special education and related services under IDEA during this time.
[14]We selected organizations with expertise in special education and research on LRE. These included the National Association of State Directors of Special Education, the Council for Exceptional Children, the Council of Parent Attorneys and Advocates, the PROGRESS Center, and the National Disability Rights Network.
[15]Disability categories specified in IDEA include: autism, deaf-blindness, developmental delay, emotional disability, hearing impairment, intellectual disability, multiple disabilities, orthopedic impairment, other health impairment, specific learning disability, speech or language impairment, traumatic brain injury, and visual impairment. 20 U.S.C. § 1401(3)(A).
[16]20 U.S.C. § 1414(d)(1)(A).
[17]For this analysis, we examined the number of students with disabilities in gen ed from 40 up to 79 percent and from 80 up to 100 percent of their day. For reporting purposes, we combined these two gen ed settings and refer to it throughout the report as “gen ed for at least 40 percent of their day.” New Mexico did not report any of these data for school year 2023–24.
[18]We analyzed data on student characteristics by race and ethnicity (seven categories), type of disability (12 categories), sex (two categories), English learner (one category), and school level (two categories). For 20 of these 24 categories, the number of students with disabilities in gen ed at least 40 percent of their day increased.
[19]New Mexico did not report Section 618 data for school year 2023–24.
[20]Depending on the analysis, the total number of states and Washington, D.C. analyzed are different. In particular, New Mexico did not report data for school year 2023–24. Iowa did not report data on educational setting by type of disability for school year 2023–24.
[21]New Mexico did not report any of these data for school year 2023–24. Iowa did not report data on educational setting by type of disability for school year 2023–24.
[22]For this analysis, we calculated the percentage of students in gen ed for at least 40 percent of their day for each district within a state. We then ordered the districts by this percentage from high to low and split them into four equal groups, or quarters. We refer to the quarter with the highest percentages as the “top” quarter. We refer to the quarter with the lowest percentages as the “bottom” quarter. We then found the average of each quarter, which we are reporting here. We excluded Hawaii and Washington, D.C. from this analysis because they only have one district.
[23]We analyzed data on student characteristics including disability type, sex, English learner status, and school level.
[24]The regression analysis included district-level student-to-staff-ratios (i.e., counselors, nurses, and social workers), poverty, locale, student demographics, the number of schools, the presence of special education schools, logged per pupil revenue, and whether the district is predominantly one race. The outcome variable was the percentage of students with disabilities in gen ed for at least 40 percent of their day. The regression included state fixed effects and robust standard errors. We excluded districts with fewer than 10 IDEA students from this analysis to minimize differences that result from small sample sizes.
[25]We used the percentage of students eligible for free or reduced-price lunch as a proxy for poverty.
[26]We also conducted a regression analysis to understand the effects of time in gen ed on discipline, drop out rates, and graduation rates of students with disabilities. We did not find a statistically significant relationship between district level discipline, drop out, or graduation rates and the percentage of students with disabilities who spent at least 40 percent of their day in gen ed.
[27]Per pupil revenue is the total amount per district, per year, of revenue collected from local, state, and federal sources divided by the number of students in the district (regardless of the expenditures associated with students in the district). This amount is different from the per pupil expenditure, or average amount spent per student.
[28]We did not examine state, school district, or school compliance with IDEA and the right to a free appropriate public education as part of this review.
[29]We asked students about their experiences in grades kindergarten through 5, six through eight, and nine through twelve and included the following optional open-ended question after each section: “Do you have any other comments (good or bad) you would like to share [related to your experiences as a student who received special education services in the ‘least restrictive environment]?’” Respondents provided open-ended responses.
[30]The Institute of Education Sciences, Regional Educational Library Midwest, “The Importance of Student Sense of Belonging [Infographic]” (December 2022). https://ies.ed.gov/use‑work/resource‑library/resource/fact‑sheetinfographicfaq/importance‑student‑sense‑belonging.
[31]We asked respondents about how satisfied they were with extracurriculars related to their sense of belonging. Fourteen of 31 grade kindergarten through grade 5 respondents, 10 of 26 grade six through eight respondents, and nine of 21 grade nine through 12 respondents were dissatisfied or very dissatisfied. We asked respondents to rate whether they were very satisfied, satisfied, neither satisfied or dissatisfied, dissatisfied, very dissatisfied, or did not know, in response to the question “Please identify your level of satisfaction with each of the following related to your sense of belonging in: … e) Participation in extracurricular activities, sports, or clubs with peers in grades K-5, 6-8, and 9-12.”
[32]We asked respondents to answer yes, no, or unsure if they were encouraged to participate in extracurricular activities, sports, or clubs by a) teachers or staff, or b) other students. For teachers or staff, 12 of 31 kindergarten through grade five responses, 11 of 26 grade six through eight responses, and nine of 21 grade nine through 12 responses were yes.
[33]For other students, eight of 31 grade kindergarten through grade five responses; 12 of 26 grade six through eight responses; and six of 21 grade nine through 12 responses were yes.
[34]Using the scale very satisfied, satisfied, neither satisfied or dissatisfied, dissatisfied, very dissatisfied, or did not know, we asked respondents: “Please identify your level of satisfaction with each of the following related to your experience in: …c) The amount of time you spent in the general education classroom (room where students with and without learning disabilities learn together)… e) Your ability to learn in the general education classroom environment (for example, the sights, sounds, and seating in the classroom)…in grades K-5, 6-8, and 9-12.”