ACCESSING AIRPORTS
Available Public Transit Options and Efforts to Promote Their Use
Report to Congressional Committees
United States Government Accountability Office
A report to congressional committees
For more information, contact: Andrew Von Ah at VonahA@gao.gov
What GAO Found
Of the 51 large, medium, and small airports included in GAO’s review, all but two small airports have some level of public transit service by bus or rail. Accessing airports by transit, instead of driving or taking taxis or rideshares, can help reduce congestion on increasingly busy airport roads. GAO found that 23 of the nation’s 31 large airports have rail service such as light or commuter rail. For 18 of these airports, the rail service is either located on airport grounds or off-site but connected by an air train that moves passengers on dedicated tracks. The remaining five large airports have rail service located off the airport grounds but connected by a free bus. The 20 selected medium and small airports generally have bus service from the airport curb to the local downtown.
Note: Includes large hub airports per Federal Aviation Administration 2023 passenger boarding (enplanement) data.
Use of transit by passengers and airport and airline employees varies widely across airports. Transit use ranged from 4 percent to 19 percent for the 12 airports for which GAO identified reports on passengers’ mode of transport. For employees, two large airports GAO visited reported that 17 percent and 19 percent of surveyed employees used public transit. Meanwhile an estimated 4 percent of airport and airline employees nationwide used public transit to commute, according to GAO’s analysis of Census data. Factors that influence individuals’ transit decisions include cost, travel time, and familiarity with transit options, according to Transit Cooperative Research Program reports and stakeholders GAO interviewed. In addition, people with disability consider factors such as availability of elevators or accomodations for mobility aids. Employees may also consider the availability of parking or transit benefits and transportation modes that match their work shifts, which often begin early in the morning.
Some airports have begun to implement transportation demand management (TDM) strategies to promote the use of existing transit options. TDM broadly refers to efforts to reduce congestion and vehicle-related emissions. Five airports GAO visited were implementing TDM strategies, such as additional signage or advertising of transit options, or offering incentives, such as reduced cost transit. Although airports are implementing TDM strategies for passengers and employees, some are prioritizing strategies for employees who may be more willing to shift to transit due to their familiarity with the airport. Two airports GAO visited set, and plan to assess, transit use goals for their TDM strategies.
Why GAO Did This Study
Millions of passengers and employees travel to and from U.S. airports daily. Increased air travel demand has renewed concerns about congestion on roads to airports. Some airports and transit agencies have implemented TDM strategies to increase transit capacity or the use of existing transit to relieve congestion.
The Federal Aviation Admministration (FAA) Reauthorization Act of 2024 includes provisions for GAO to assess the extent to which U.S. commercial airports are accessible by transit and the TDM strategies that airports are implementing.
This report addresses, among other things, (1) public transit availability at selected U.S. airports; (2) passenger and employee use of public transit to access airports and the factors that influence their decisions to do so; and (3) TDM strategies selected large airports are implementing and plans by the airports to assess the effects of these strategies.
GAO reviewed airport websites and conducted literature searches to identify documentation on transit options and use for 51 airports—all 31 large-hub airports and a random selection of 20 medium-hub and small-hub airports based on 2023 FAA enplanement data. GAO contacted all 51 airports to confirm this information was accurate. GAO also analyzed 2019-2023 Census data on employee commutes. GAO reviewed Department of Transportation (DOT) guidance and interviewed officials from DOT and nine stakeholder organizations selected to represent a range of perspectives. GAO visited five large airports that recently implemented projects to increase transit capacity, were implementing TDM strategies, or both. At each airport, GAO interviewed airport and transit agency officials and other stakeholders.
Abbreviations
ACI Airports Council International
ADA Americans with Disabilities Act
DOT U.S. Department of Transportation
FAA Federal Aviation Administration
FTA Federal Transit Administration
KCATA Kansas City Area Transportation Authority
MARC Mid-America Regional Council
RTD Regional Transportation District
TDM Transportation Demand Management
AIP Airport Improvement Program
CIG Capital Investment Grants
CMAQ Congestion Mitigation and Air Quality Improvement Program
PFC Passenger Facility Charges
TIFIA Transportation Infrastructure Finance and Innovation Act Program
This is a work of the U.S. government and is not subject to copyright protection in the United States. The published product may be reproduced and distributed in its entirety without further permission from GAO. However, because this work may contain copyrighted images or other material, permission from the copyright holder may be necessary if you wish to reproduce this material separately.
January 28, 2026
The Honorable Ted Cruz
Chairman
The Honorable Maria Cantwell
Ranking Member
Committee on Commerce, Science, and Transportation
United States Senate
The Honorable Sam Graves
Chairman
The Honorable Rick Larsen
Ranking Member
Committee on Transportation and Infrastructure
House of Representatives
Airports are vital hubs for connectivity and economic growth, supporting millions of passengers and employees daily nationwide. Every day, more than 3 million passengers travel to and from U.S. airports.[1] Additionally, approximately 1.4 million airport and airline employees across various occupations commute to work at airports.[2] There are thousands of public airports in the U.S., but 97 percent of all passenger air traffic is handled by 138 of the country’s largest commercial service airports.[3] The civil aviation industry directly contributed $856 billion to the U.S. economy in 2022.[4]
Increased air travel demand following the COVID-19 pandemic has renewed concerns about traffic congestion on airport access roadways. Such congestion results from the many car-based modes used to access airports, such as dropping off or picking up; rideshares such as Uber and Lyft; and taxis. For example, 46 percent of airports that responded to a survey administered in late 2016, particularly those with increasing rideshare volumes, reported increased congestion on access roadways or at curbsides.[5] Public transit offers an alternative to car-based travel. However, individuals may face barriers using transit, such as lack of availability or infrequent or unreliable service. Additionally, individuals with disability may face unique barriers when accessing transit, such as a lack of accommodations for mobility aids on vehicles or out-of-service elevators in transit stations.[6]
Some airports, transit agencies, and local and state governments have sought to increase transit options and usage to relieve congestion and improve access at airports. Some airports have begun to implement transportation demand management (TDM) strategies to encourage the use of high occupancy modes, namely transit, to access airports. TDM refers to strategies aimed at maximizing traveler choices to reduce congestion and vehicle-related emissions. For airports, this can include projects to increase transit capacity (which we refer to as transit capacity projects), such as new rail lines or multimodal ground transportation facilities. Additionally, airports can promote the use of existing transit options.
Sections 755 and 736 of the Federal Aviation Administration (FAA) Reauthorization Act of 2024 contain provisions for GAO to review the extent to which U.S. commercial airports are accessible via public transit and are implementing TDM strategies to increase public transit use and what the effects of these strategies have been.[7] This report addresses:
1. the extent to which public transit is available at selected U.S. airports and airports’ role in, and federal funding contributions to, selected transit capacity projects;
2. the extent to which passengers and employees access airports using public transit and the factors that influence their decisions to do so;
3. the TDM strategies selected large-hub airports have implemented to increase the use of existing transit options and plans by the airports to assess the effects of these strategies.
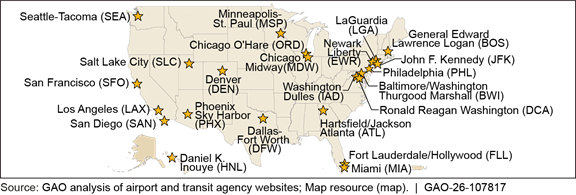
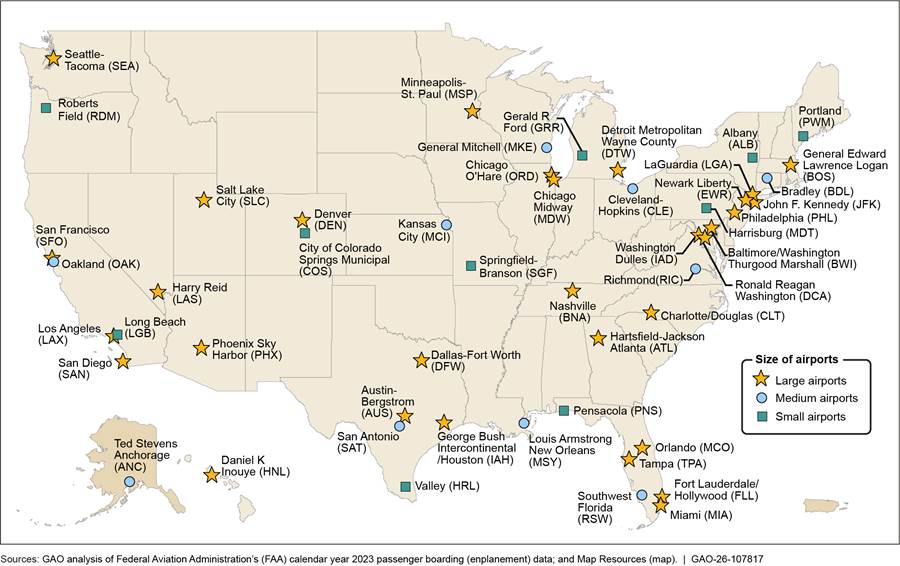
To determine the extent of public transit availability at selected U.S. airports, we collected data on public transit options at 51 airports – all 31 large-hub (referred to as large airports) and a random sample of 10 medium-hub and 10 small-hub (referred to as medium and small airports, respectively). We selected these airports using FAA’s calendar year 2023 enplanement (passenger boardings) data.[8] See figure 1 for all 51 selected airports. We reviewed airport and relevant transit agency websites to collect information on the transit options at each airport. We defined public transit as regularly scheduled bus, subway, metro, light rail, or commuter rail service that is available to the public and provided by a transit agency or airport.[9] For rail options, we used online mapping tools to determine whether the rail transit station was “on-site” within the airport boundaries, or “off-site” and outside those boundaries.[10]
Figure 1: Map of Selected Large, Medium, and Small Commercial Airports by Calendar Year 2023 FAA Passenger Boardings Data
To identify the extent to which passengers and employees access airports using public transit, we reviewed airport websites and conducted internet searches to identify any documentation or reports on ground transportation mode share usage at the 51 selected airports. We also conducted a literature search for documentation or reports on ground transportation mode share usage at U.S. commercial airports.[11] From these sources, we identified relevant documentation or reports for 12 airports. These documents or reports surveyed individuals about how they access the airport, including public transit, to determine the percentage that used each ground transportation mode. We reviewed the reported survey methodologies for each of the identified mode share documents and reports, when available.[12] In December 2025, we contacted representatives from all 51 airports to confirm that we had accurately identified transit options and available documentation or reports on ground transportation mode share as of November 2025.
To assess the extent to which employees accessed airports using public transit, we analyzed Census’s American Community Survey data for the 5-year period from 2019 through 2023, the most recent 5-year period available.[13] We analyzed responses to questions on the mode of transportation the employee used to commute to work.[14] We conferred with Census officials to select occupational categories that corresponded with employees likely to commute to airports for work.[15] To assess the reliability of the data, we interviewed Census officials, reviewed relevant documentation, and performed standard data quality checks for logical errors and missing data. We determined the data to be sufficiently reliable for the purposes of identifying the extent to which airport employees use transit to access airports.
To address all objectives, we reviewed relevant documentation from the Department of Transportation (DOT), conducted literature searches, and interviewed officials from DOT and nine stakeholder organizations. We reviewed documents and interviewed officials from DOT and operating administrations, including FAA, the Federal Transit Administration, and the Federal Highway Administration. We conducted literature searches on the availability of transit to access airports and the extent to which airports are using transportation demand management to increase use of existing transit.[16] We identified and reviewed reports from the National Academies of Sciences, Engineering, and Medicine’s Airport and Transit Cooperative Research Programs on public transit options at U.S. airports, factors that influence public transit use, and TDM strategies that airports were implementing. We also interviewed nine national stakeholder organizations including airport and transit industry groups, disability advocacy organizations, an airline industry group, and a labor union representing airport employees.[17] We selected stakeholders to represent a range of perspectives on transit access and TDM at airports.
In addition, from February 2025 to April 2025 we visited five large airports: (1) Boston Logan International Airport, (2) Chicago O’Hare International Airport, (3) Denver International Airport, (4) Seattle-Tacoma International Airport, and (5) Washington Dulles International Airport.[18] We selected these airports based on those that received federal funding for a project to expand transit capacity from 2014 through 2024, completed or have ongoing TDM initiatives, and vary geographically. We identified airports with completed or ongoing TDM initiatives through our literature search and interviews with DOT officials and national stakeholder organizations. At each airport, we interviewed the local airport sponsor, transit agency, metropolitan planning organization, and the local Service Employee International Union airport affiliate. To determine the extent to which site visit airports were implementing TDM strategies; the effects of any such strategies; and the extent employees and passengers used transit; we reviewed documentation, such as TDM implementation plans and airport emissions reduction strategies as available.
We conducted this performance audit from September 2024 to January 2026 in accordance with generally accepted government auditing standards. Those standards require that we plan and perform the audit to obtain sufficient, appropriate evidence to provide a reasonable basis for our findings and conclusions based on our audit objectives. We believe that the evidence obtained provides a reasonable basis for our findings and conclusions based on our audit objectives.
Background
Airport Operations
Every day, FAA manages more than 44,000 flights transporting more than 3 million passengers in and out of airports throughout the country. Although the U.S. has thousands of public airports, 31 large U.S. airports handled 72 percent of all passenger boardings in calendar year 2023 (see fig. 2).[19]
Figure 2: Commercial Airport Categories for U.S. Airports Based on Calendar Year 2023 Passenger Boardings Data
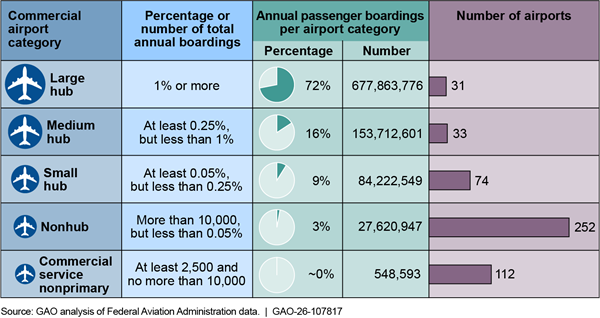
Note: Federal law categorizes commercial airports into size categories based on the number of passenger boardings. The statutory ranges for each category are provided in the second column. See 49 U.S.C. § 47102(7), (11), (13), (14), (16), and (25).
To support this flight volume, almost 1.4 million workers regularly commute to work at airports.[20] A large-hub airport can have tens of thousands of employees, and, in some cases, is the largest employer in the state.[21] Employers include airlines (e.g., pilots and flight attendants), contractors (e.g., aircraft cleaners, wheelchair attendants, and food and retail workers), and the federal government (e.g., Transportation Security Administration agents). Airports are 24-hour operations that require airport employees to support very early and late flights.
Options to Access Airports
Options to access airports vary depending on the airport, are often car-based, and may include public transit. Individuals accessing airports have many car-based options, including driving and parking, being dropped off or picked up by family or friends, or using car rentals, and taxis. In addition, app-based ride-hailing services such as Uber and Lyft (rideshares), have become an increasingly popular means of accessing airports over the past decade. Many airports also have connections to the local transit system, including the bus, subway, commuter rail, or light rail. Cities vary in the scale of their transit network, ranging from those with bus service and multiple types of rail service with numerous connecting lines to those solely with bus service. How individuals access transportation options at airports, including transit, varies and could include access at the curbside outside of baggage claim or taking an air train or a bus.[22]
Transportation Demand Management
TDM is a concept that has been used in transportation planning for the past several decades and aims to improve the efficiency of transportation systems by maximizing traveler choices, thereby increasing mobility and reducing congestion and emissions. TDM has traditionally focused on reducing single-occupancy vehicles and shifting commuter demand away from peak travel time (i.e., rush hour) through efforts such as carpooling and telework. More recently, TDM has also included efforts, such as advanced traveler information and congestion-based pricing, that can shift trips to other routes or modes, or to off-peak times.
Expanding transit capacity and encouraging the use of existing transit options are TDM strategies that can be deployed at airports. Given that travel to and from airports is driven by flight schedules, TDM practices to shift demand to off-peak times are not practical. We have previously reported on how U.S. commercial airports have pursued transit options in response to traffic congestion. Specifically, in 2005 we found that, of the 31 large airports we include in this review, all 31 had connections to local bus systems, 17 had connections to local rail systems, and 10 had proposals to add additional rail service.[23]
Stakeholders and Funding Sources
The development, operation, and funding of transit to airports can involve several local stakeholders. Local transit agencies are responsible for building, maintaining, and operating transit systems. Various state and local authorities also may be involved in long-term transportation and transit planning, in conjunction with metropolitan planning organizations.[24] State and local authorities may also oversee land use planning. Meanwhile, airport sponsors oversee infrastructure projects on existing airport grounds.[25] Depending on the airport structure, airlines that serve the airport may also play a role in decision-making for infrastructure projects.
DOT and its operating administrations do not have funding programs specific to transit access to airports. However, airports and transit agencies can use federal funding and financing programs for projects to enhance transit connectivity at airports (see table 1). DOT and operating administrations provide guidance and conduct oversight to help ensure that airports and transit agencies comply with federal laws and regulations, including the Americans with Disabilities Act (ADA).
Table 1: Examples of Federal Programs That Can Fund or Finance Projects to Enhance Transit at Airports
|
Program |
Description |
|
Capital Investment Grant (CIG) (Federal Transit Administration) |
CIG provides support for transit capital investments, including heavy rail, commuter rail, light rail, streetcars, and bus rapid transit. CIG includes New Starts projects (for which the federal assistance is $150 million or more, or have an anticipated capital cost of $400 million or more) and Small Starts projects (new fixed guideway projects, extensions to existing fixed guideway systems, or corridor-based bus rapid transit projects seeking less than $150 million in CIG funds and have a total estimated capital cost of less than $400 million). |
|
Transportation Infrastructure Finance and Innovation Act (TIFIA) (Department of Transportation) |
TIFIA provides credit assistance in the form of direct loans, loan guarantees, and standby lines of credit for eligible surface transportation projects, including transit, airport, and intermodal projects. Credit assistance from this program often has more advantageous terms than such products in the financial market. |
|
Congestion Mitigation and Air Quality Improvement (CMAQ) (Federal Highway Administration) |
CMAQ provides funding to states and local governments, under a formula established in statute, to support transportation projects that reduce emissions of certain criteria pollutants, including projects to expand transit services. This program funds projects in areas that do not currently, or did not previously, meet federal air quality standards for certain pollutants. |
|
Airport Improvement Program (AIP) (Federal Aviation Administration) |
AIP has been providing grants for airport planning and development since 1982, generally restricted to projects on airport grounds. Historically, AIP funds have been primarily spent on “airside” projects such as runways and taxiways, although they can also be used for “landside” projects such as terminals and certain other activities. |
|
Passenger Facility Charges (PFC) (Federal Aviation Administration) |
Commercial service airports—if they choose and subject to Federal Aviation Administration (FAA) approval—are authorized to collect a local PFC from each passenger, which is included in the airline ticket price and remitted to the airport sponsor. FAA reviews airport PFC projects to ensure that they meet eligibility criteria. PFC revenues are heavily used for landside projects. |
Source: GAO analysis of relevant laws, regulations, and DOT documentation; Congressional Research Service. | GAO‑26‑107817
Airport sponsors have multiple sources of other revenue from both the “airside” and “landside” that can be used for projects on airport property, including those to enhance transit connectivity. Airside revenue includes landing fees charged to airlines. Landside revenue includes terminal concessions or fees on ground transportation, including parking, which represents a significant and important revenue source for airports.[26] In addition, many airports impose customer facility charges, a user fee imposed on each rental car user, collected by rental car companies.[27] State and local governments and airport sponsors may also fund infrastructure projects by issuing tax-exempt bonds.
Almost All Selected Airports Have Some Level of Transit Access, and Airport Roles Varied for Selected Transit Capacity Projects
Three-Quarters of Large Airports Have Rail Service, Often On-Site or Via Air Train, While Medium and Small Airports Generally Have Bus Service
As of November 2025, all large airports and almost all selected medium and small airports, have some level of transit access. Specifically, of the 31 large airports, 23 have rail service, and 27 have bus service.[28] Of the 10 selected medium airports, eight solely have bus service, one solely has rail service, and one has both bus and rail service. Eight of the 10 selected small airports have bus service; the other two airports do not have transit service. See appendix I for additional information on the transit options at all selected airports.
Large Airports
Of the 23 large airports with rail transit service, 18 have rail service on-site or via air train.[29] Specifically, 14 airports have rail service on-site and 4 have service off-site connected via air train. An additional five large airports have rail service off-site connected by a free bus service (see fig. 3).[30] For the 14 airports with rail stations on-site, given the sizable footprint of large airports, individuals may still access the rail station using an air train. For example, although the light rail service is located on the Minneapolis–Saint Paul International Airport property, passengers access the station via the on-airport tram. Six large airports are served by two or more rail operators.
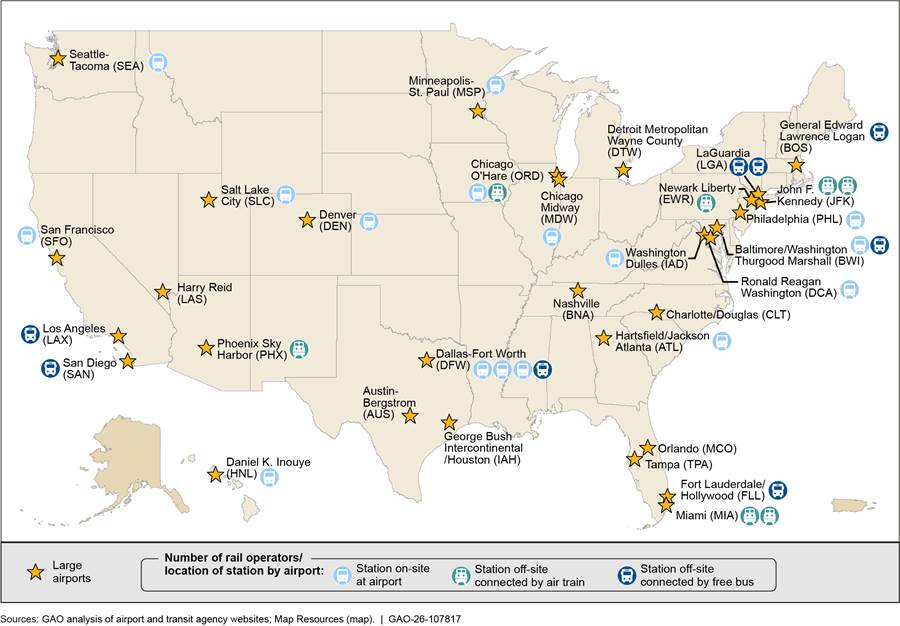
Note: Federal law defines large hub airports as those that have 1 percent or more of total annual passenger boardings. See Appendix I for additional information on the transit options at all selected airports.
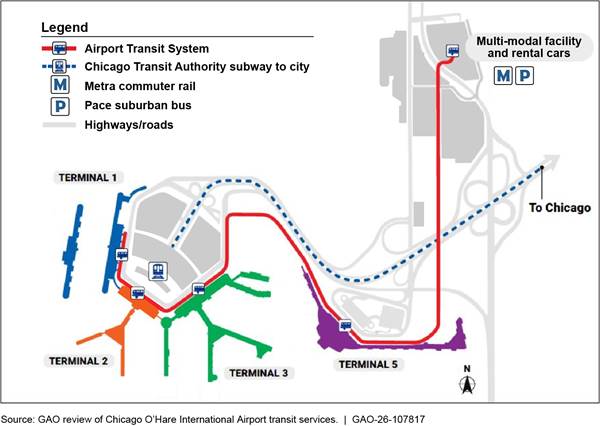
Chicago O’Hare is an example of a large airport with both on- and off-site rail service. The Chicago Transit Authority provides subway service between the airport (specifically three of the airport’s terminals) and downtown. In addition, Metra’s commuter rail line, which connects downtown Chicago to Antioch, Illinois, stops at O’Hare’s off-site multimodal facility that is accessible from the airport via air train (see fig. 4).
Ten large airports have gained rail service since our 2005 report.[31] For example, subway (Metrorail) and commuter rail (Tri-Rail) service to Miami International Airport began in 2012 and 2015. More recently, in October 2025, Daniel K. Inouye International Airport in Honolulu, Hawaii, gained rail service with the launch of the Skyline metro operated by the Honolulu Authority for Rapid Transportation. The same month, Dallas-Fort Worth International Airport gained another rail option, with the launch of the Dallas Area Rapid Transit Silver Line commuter rail service. Further, as of November 2025, a project is underway to better connect Los Angeles International Airport via an air train to a new LAX/Metro Transit Center.[32] The air train is anticipated to be completed in time to transport visitors to the city for the 2028 Olympics.
Transit service at large airports generally provides access throughout the local metropolitan area. Specifically, 28 of the 31 large airports have more than one transit route, with multiple stops that serve different destinations throughout the local metropolitan area, including downtown.[33] Figure 5 shows the areas of Boston directly served by transit to and from Boston Logan International Airport, including downtown and suburbs around the city. In addition to bus and rail service provided by the local transit agency, Massachusetts Bay Transportation Authority, the airport provides Logan Express bus service between the airport and five locations throughout the metropolitan area.[34] Similarly, Los Angeles International airport operates the LAX FlyAway bus, which has two routes and associated destinations, Los Angeles Union Station, and a bus terminal adjacent to the Van Nuys Airport. Some rail services at large airports were specifically designed with service between downtown and the airport in mind, such as the A Line train between downtown and Denver International Airport.[35]
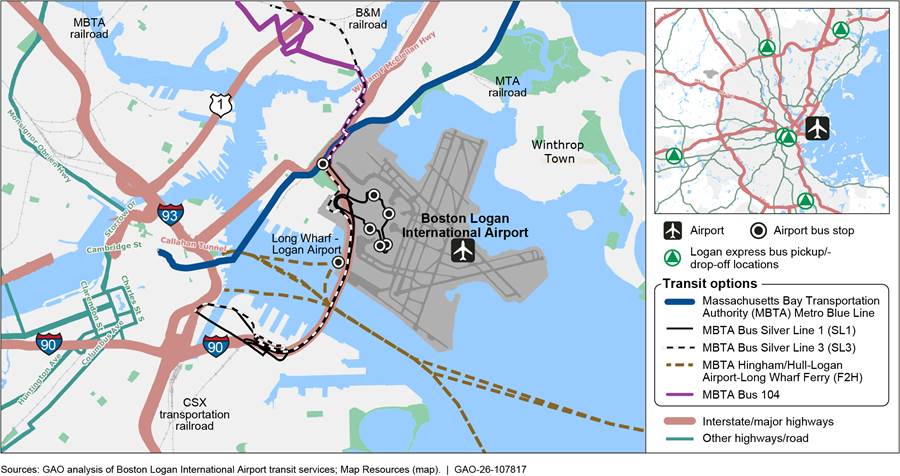
Note: There are also Massachusetts Bay Transportation Authority ferry services that operate between Boston Logan International Airport and Winthrop and Quincy, Massachusetts. We do not include those services in our analysis because they only operate between April and November.
Rail services at large airports generally operate from early in the morning to past midnight, reflecting the volume of passengers that large airports support.[36] Specifically, of the 23 large airports with rail service, 16 provided weekday service, starting between 3:00 am and 5:30 am and operating until midnight to 2 am.[37] Three—LaGuardia, John F. Kennedy, and O’Hare—have rail service operating 24 hours a day. During hours of operation, time between trains can change throughout the day. For example, the Chicago Transit Authority’s Blue Line serving O’Hare has trains every 3-8 minutes during rush hour and up to 20 minutes between trains late at night.
Selected Medium and Small Airports
Medium and small airports in our review generally have bus service from the airport curb. As previously noted, of the 10 selected medium airports, eight solely have bus service, one (Cleveland Hopkins International Airport) solely has rail service, and one (Oakland San Francisco Bay International Airport) has both bus and rail service. Eight of the 10 selected small airports have bus service; the other two airports do not have transit service. Further, all of the selected medium and small airports with bus service have it available curbside at the airport terminal. In terms of rail service, Cleveland Hopkins’s rail station is located within its terminal, while Oakland’s is connected to an off-site rail station by air train.[38]
Most selected medium and small airports with transit service have direct access to the local downtown. Nine of the 10 selected medium airports have transit routes with multiple stops serving the airport, their local downtown, and other destinations.[39] For example, Milwaukee Mitchell International Airport has two bus routes—one connecting the airport, downtown, and two college campuses. In addition, Kansas City International Airport has a single bus route between the airport and downtown, with multiple stops, including a hospital. Of the eight selected small airports with transit service, five have bus service between the airport and the local downtown, with multiple stops in between.[40]
Airport Roles and Federal Funding Sources Differed for Selected Transit Capacity Projects
Airports served varying roles, such as primary project sponsor or stakeholder, in the transit capacity projects implemented at four site visit airports.[41] For two projects, the airport was the primary sponsor, and local transit agencies managed the other two projects (see table 2). These projects include constructing new rail lines, extending existing rail lines, and constructing a multimodal transit facility.
|
Airport |
Project sponsor |
Project name and description |
|
Chicago O’Hare International Airport |
Chicago Department of Aviation (airport) |
O’Hare Multi-Modal Facility. The O’Hare Multi-Modal Facility opened in 2018 and provides centralized access to local and regional bus transit services, Metra commuter rail, rental car operations, and a parking garage. The facility is connected to Chicago O’Hare International Airport via air train. Metra commuter rail was previously accessible by shuttle bus. |
|
Denver International Airport |
Regional Transportation District (transit agency) |
A Line. The A Line opened in 2016 and provides direct rail service between the airport and downtown Denver with multiple stops. The A Line is part of a larger initiative, called the Eagle P3 Project, to expand rail options in the Denver region. |
|
Seattle-Tacoma International Airport |
Sound Transit (transit agency) |
Federal Way Link Extension. The Federal Way Link Extension opened in late 2025, adding three new Sound Transit light rail stations south of Seattle-Tacoma International Airport. Although the light rail has served the airport since 2009, the project expanded rail access to the airport to communities in South King County, Washington. |
|
Washington Dulles International Airport |
Metropolitan Washington Airports Authority (airport) |
Washington Metropolitan Area Transit Authority Silver Line Extension. The Silver Line Extension provides direct rail service between Washington Dulles International Airport and downtown with multiple stops. This project added 11 new stations, including one at the airport. The Silver Line began operation in 2014, and the extension to the airport opened in 2022. |
Source: GAO analysis of airport documentation of selected transit capacity projects at four site visit airports. | GAO‑26‑107817
The transit capacity projects at four site visit airports used funding from various DOT funding programs, and all projects received financing from DOT’s Transportation Infrastructure Finance and Innovation Act program (see table 3).
Table 3: Federal Funding and Financing Sources for Selected Transit Capacity Projects at Site Visit Airports
|
|
|
|
Federal funding or financing program |
|
||||||
|
Airport |
Project |
Total capital costs (dollars in millions) |
Transportation Infrastructure Finance and Innovation Act (TIFIA) (dollars in millions) |
Capital Investment Grants (dollars in millions) |
Congestion Mitigation Air Quality (dollars in millions) |
Passenger Facility Charge (dollars in millions) |
||||
|
Chicago O’Hare International Airport |
O’Hare Multi-Modal Facility |
$876 |
$288 |
— |
— |
$37.7 |
||||
|
Denver International Airport |
Eagle P3 Project (includes Regional Transportation District A Line)a |
$2,043 |
$280 |
$1,030 |
$62 |
— |
||||
|
Seattle-Tacoma International Airport |
Federal Way Link Extension |
$3,161 |
$630 |
$790 |
$13 |
— |
||||
|
Washington Dulles International Airport |
Silver Line Extensionb |
$6,010 |
$1,876b |
$900 |
$11 |
$246 |
||||
Legend: — = Not applicable
Source: GAO analysis of documents of federal funding and financing sources for transit capacity projects at site visit airports. | GAO‑26‑107817
aThe amounts listed are for the Eagle P3 Project that combined three commuter rail projects, including the A Line, into a single public-private partnership.
bThe TIFIA total for the Silver Line extension includes three TIFIA loans: one for the Metropolitan Washington Airport Authority, and one for Fairfax and Loudoun Counties each.
Selected transit capacity projects also used state and local funding sources. For example, a majority of funding for the Silver Line extension is financing that is being repaid by revenue from the Dulles toll road.[42] Seattle’s Federal Way Link Extension and Denver’s A Line were both partly funded through voter-approved local taxes.[43] The A Line is also a public-private partnership and received over $450 million in private financing.[44] Chicago O’Hare International Airport also used customer facility charges to fund the Multi-Modal Facility. According to airport officials, customer facility charges can be preferable to Passenger Facility Charges, because airports can enter into agreements with rental car companies to collect customer facility charges without FAA involvement.
In 2021, FAA formally updated its guidance to allow airports to use Passenger Facility Charges for more types of rail transit.[45] Previously, FAA limited the use of these funds to rail lines that originated or terminated at the airport to ensure that all transit passengers were airport users.[46] FAA found that, because population growth in metropolitan regions was extending beyond airports, its previous guidance restricted transit access for these communities. The Silver Line Extension was the first time an airport used Passenger Facility Charges to fund a through rail line (i.e., a rail line that does not originate or terminate at the airport). Per FAA guidance, airports can only use Passenger Facility Charges for the on-site portion of transit capacity projects, such as stations or track segments, to ensure that the airport does not subsidize non-airport transit users.[47] FAA provided methods to determine the amount of Passenger Facility Charges airports can use to fund through rail lines, such as basing the funding on expected transit ridership from airport users.
Similarly, FAA recently issued internal guidance that permits airports to use airport revenue to fund transit capacity projects, including through rail lines. In June 2025, FAA issued internal guidance clarifying the amount of revenue airports can contribute to on-airport transit capacity projects.[48] For transit projects that serve both airport and non-airport passengers, airport revenue funding is prorated based on the projected share of airport versus non-airport users.
Some Selected Airports Report Over 10 Percent of Transit Use Share, and Several Factors Account for the Varied Transit Use at Selected Airports
Available Airport Documentation and Census Data Show that Passenger and Employee Transit Use to Access Airports Varies Widely
Passenger transit usage varied widely across the 12 airports with ground transportation mode share documentation available since 2022.[49] Of the 10 large airports with mode share documentation, five reported passenger transit use share of over 10 percent to access the airport. Passenger transit use reported by the 10 airports ranged from 19 percent at John F. Kennedy International Airport, which included subway and both transit and other buses, to an estimated 4 percent at Baltimore/Washington International airport.[50] The two medium airports for which we identified reports fell within the lower-end of this range. John F. Kennedy International Airport’s high level of transit usage may be due to New York City’s uniquely extensive and utilized transit system. A 2023 Federal Transit Administration (FTA) report found that New York City accounts for 45 percent of transit trips in the entire U.S.[51]
However, comparing reported mode share at airports is difficult. Some airports specifically measured transit rail and bus use, while others captured broader categories of bus use, including transit buses along with hotel shuttles and other private buses. In addition, survey methodologies differ, as they did with the two medium airport surveys, with one sampling residents rather than passengers at the airport and the other sampling attendees of a sporting event. Specifically, a 2023 survey of residents in 21 northern California counties regarding their last air travel trip to Oakland San Francisco Bay International Airport found that 4 percent of respondents reported using transit to get to the airport. In addition, a 2023 survey of attendees of the 2023 NFL draft, which took place in Kansas City, asked attendees how they traveled from Kansas City International Airport to their lodging destination during the draft event. The survey found that 4 percent used transit to get from the airport to their lodging.
Employee transit usage also varies widely. Our analysis of 2019-2023 data from the Census’s American Community Survey estimated that 4 percent of airport employees nationwide reported using transit to commute to work.[52] Two of the five site visit airports conducted surveys among a convenience sample of employees and reported airport employees commuting by transit at higher rates than our estimated 4 percent of airport employees nationwide. Specifically, Denver International Airport’s 2022 survey and Seattle-Tacoma International Airport’s 2025 survey found that 17 percent and 19 percent of responding employees, respectively, reported using public transit for their commutes to work.[53] Both airports have direct rail service that operates 7 days a week, from early in the morning to late at night, which may influence employee choice in transit.
While passenger and employee transit usage varies by airport, transit usage broadly was also significantly affected by the pandemic. However, we previously found that the ridership demand of commuter rail lines serving airports helped those commuter rail systems recover ridership after the pandemic.[54] This may be, in part, because air travel passenger volumes in the U.S. reached 2019 levels relatively quickly after the pandemic and because of the in-person nature of the work performed by airline and airport employees.[55]
However, the available mode share documentation and reports all found that car-based modes were the dominant choice for passengers and employees to get to the airport.[56] Of these reports, San Francisco International Airport estimated the highest share of passengers using car-based travel to get to the airport, at 90 percent. Boston Logan and Seattle-Tacoma International Airports estimated the lowest, at 77 percent of departing passengers, according to 2024 surveys. The lower estimated level of car-based travel at these two airports may be due, in part, to a limited supply of parking. Specifically, Boston Logan’s parking is limited, due to a parking freeze that began in 1975, while an official from the Seattle-Tacoma airport said parking is limited by the airport’s constrained space.[57] In addition, according to our analysis of the 2019-2023 American Community Survey data, most airport employees drove to work alone: 80 percent of employees reported they commuted by car and, of these, 93 percent reported they drove alone.
While these analyses provide some insight into transit usage to and from airports, there are limitations with the information we identified and analyzed:
· Most of the airports we reviewed (39 of 51) did not have available reports or documentation on passenger ground transportation mode share.[58]
· The 2019-2023 American Community Survey data analysis may not accurately reflect the share of airport employees that use transit. For example, while we consulted with Census officials to restrict our analysis to airport employees likely to work on-site at airports, the data may include individuals who do not work at airports and exclude others that do, such as those that did not report working primarily in air transportation. In addition, some of the data were collected during the pandemic, when air travel was disrupted. Further, the survey asks for the method of transportation used for most of the distance of the commute to work. As a result, the data may undercount those who used multiple transportation modes to work, such as driving and then taking transit, or who may take car-based transportation to work but transit home from work.[59]
Cost, Familiarity, and Reliability Are Among the Factors Influencing What Mode of Transportation Passengers and Employees Use to Access Airports
Individuals consider various factors when choosing whether to use transit to access airports. We identified these factors based on a review of Transit Cooperative Research Program reports and interviews at site visit airports and with national stakeholders. These factors include the following:
· Cost. Cost is a factor that individuals consider when deciding how to access airports.[60] In general, transit is often a less expensive mode to access the airport than taking a taxi or rideshare and can be less expensive than driving and parking. However, passengers, particularly business travelers, are willing to pay a premium for convenience of car-based travel. Staff from one of the transit agencies we spoke with also noted that large groups traveling together, such as families, may find that a taxi or rideshare offers a comparable price to transit service. Conversely, service worker employees at all site visit airports, who worked in occupations such as aircraft cabin cleaners and wheelchair attendants, noted that affordability was a key consideration in their transportation decisions.[61]
According to airport officials we met with, some employees commuting to airports, such as those who work directly for the airport sponsor or airlines, receive parking benefits that makes driving more affordable. They explained that other employees, such as those employed by contractors or concessionaires, who may not receive parking benefits, may choose to commute by transit because of its lower cost.[62] For example, service workers we spoke with at three site visit airports said that they drive to park-and-rides away from the airport and use transit for the last leg of their commute to avoid expensive airport parking.
· Familiarity. According to DOT and one stakeholder organization we interviewed, passengers are primarily concerned with catching their flight, and many visit the airport infrequently—once or twice a year. These individuals may be unaccustomed to reading a transit system map or timetable or determining how to pay a transit fare and may be further deterred from using transit if they have heavy luggage or are traveling with young children, according to DOT officials. Further, passengers may choose car-based modes to access the airport, due to those modes’ familiarity. For example, individuals that are experienced using rideshare services may opt to use those services over transit because of the consistency of the user interface, regardless of location, and ability to go directly to their destination. In addition, passengers that are inexperienced with using transit in general are less likely to use transit to access the airport.[63] Conversely, since employees commute regularly, they may be more familiar with all ground transportation options and be more willing to consider using transit.
· Reliability. Reliability—such as whether a train or bus arrives and departs frequently and arrives on-time—is important for passengers.[64] Representatives from the American Public Transportation Association said that, even individuals familiar with a transit system may opt to take alternative means of transportation if the system is not reliable or convenient. In addition, airport service employees we spoke with emphasized the importance of getting to work on-time and noted that they could lose their jobs if they are late to work. Conversely, in cities with significant traffic congestion, it is possible that roadways could be less reliable than transit at peak travel times.
· Travel time. Passengers may choose not to use transit if the travel time is considerably longer than car-based modes, such as driving and parking or taking a taxi or rideshare.[65] However, many of the service workers at the site visit airports reported lengthy commutes to and from the airport using transit, with some commutes taking upwards of 2 hours.
· Location. All stakeholder organizations and all service worker airport employees we interviewed during our site visits said that even if an airport has transit service, it may be challenging for some individuals to use because that service may not serve their neighborhood. As noted earlier, some of the airport employees we interviewed said that they take transit to work but must first drive and park at a transit station to do so. Other areas may have transit, but individuals need to transfer to additional bus or rail routes to get to the airport. Transfers can serve as a deterrent to using transit by adding complexity to travel and introducing more opportunities for delays.[66] Since airports draw passengers from a wide area, it is not possible to provide direct service everywhere.[67] In addition, transit options at airports may not be convenient for airport employees—such as air cargo workers—that do not work in the main terminal building, requiring them to identify other means of transportation.
· Transit hours of service. Many airports are 24-hour operations that rely on employees that work in shifts around the clock, including to support early flights.[68] If transit does not operate during employees’ commute times, or when passengers need to arrive at or depart from the airport, they must use alternative forms of transportation. Employees we spoke with at Chicago O’Hare International Airport noted how beneficial it is that the Chicago Transit Authority’s Blue Line operates 24 hours a day. Employees we spoke with at Washington Dulles International Airport noted that sometimes they need to work later than expected to support late-arriving flights and that this can result in them leaving work after transit service has ended for the day. As a result, these employees need to identify alternative ways to get home or they might get stranded at work.
In addition, individuals with disabilities may consider accessibility when deciding whether to use transit to access airports. A 2012 survey of the experiences of individuals with disabilities when using transit identified concerns with physical barriers at transit stations. These barriers included broken elevators and insufficient accommodations for mobility aids (such as concern that bus drivers will not be able to properly secure wheelchairs), the attitudes of transit staff and fellow passengers toward individuals with disabilities, and the lack of information from transit agencies on potential barriers they may encounter.[69] In addition, a representative from another stakeholder organization we spoke with noted that even if an airport transit stop is accessible to people with disabilities, if other portions of the transit system are not—such as the transit station near an individual’s home—then transit is not an option to access the airport. Further, a Paralyzed Veterans of America representative we spoke with mentioned that the difficulty of managing luggage on transit is compounded for individuals with disabilities who may be unable to transport, or have difficulty transporting, luggage because they need to operate a mobility aid.
The FTA conducts reviews of the accessibility of transit systems’ receiving federal funds as part of overseeing transit agencies’ compliance with the ADA. For example, at least every 3 years, FTA examines how transit agencies that receive Urbanized Area Formula Funding program funds meet statutory and administrative requirements, including for ADA compliance.[70] FTA also reviews states’ management practices and program implementation of several other formula grants every three years, including for ADA compliance. In addition, FTA conducted six reviews of transit agencies’ compliance with bus lift and stop announcement requirements from 2015 through 2017. In each review, FTA found deficiencies, including nonfunctioning bus lifts and insufficient accommodations for mobility aids. Transit agencies are required to address any deficiencies identified in FTA’s reviews. Transit agencies are also generally required to provide paratransit services, which DOT regulations define as “comparable transportation service required by the ADA for individuals with disabilities who are unable to use fixed route transportation systems.”[71]
Selected Large Airports Have Implemented TDM Strategies to Increase Use of Existing Transit Options, and Some Plan to Assess the Effects
The five site visit airports considered, and are implementing, various TDM strategies to increase passenger and employee use of existing transit options. These include advertising campaigns to increase awareness of airport transit options and incentive programs to reduce the cost of transit.[72] While all airports are implementing TDM strategies that broadly target passengers and employees, some airports are prioritizing TDM strategies that specifically target employees. Two site visit airports have established goals for increased passenger and employee transit use and have plans to assess the effects of their TDM strategies.
All Selected Large Airports Have Implemented a Range of TDM Strategies, with Some Prioritizing Those That Target Employees
All five site visit airports are implementing TDM strategies to alleviate congestion on airport access roadways, due to increasing air travel demand. Officials at the site visit airports identified, and are implementing, TDM strategies applicable to both passengers and employees, but some airport officials said they are prioritizing strategies that target employees. According to airport officials, employees are generally more open to shifting from car-based modes to transit. Officials at one airport said this is generally because employees are more familiar with airport transit options than passengers, especially compared with arriving passengers who have not traveled to the airport before. In addition, officials at another airport said employees may be more cost-sensitive than passengers and more likely to shift to transit. Denver International Airport’s 2024 plan contains 20 TDM strategies—12 aimed exclusively at employees, five aimed at both passengers and employees, and three aimed exclusively at passengers.[73] According to airport officials, as of August 2025, Seattle-Tacoma International Airport was implementing its 2019 Ground Transportation Access Plan work program, a set of TDM strategies specifically for airport employees.
We found that these airports considered or implemented five different types of TDM strategies, each of which generally seeks to address one or more of the factors previously discussed as influencing transit use:
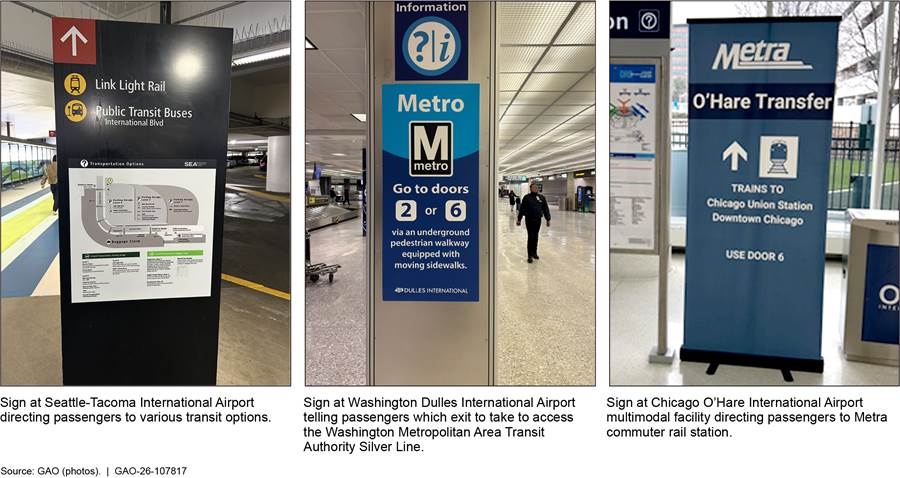
Providing transit information and advertisements. As of August 2025, all five airports were implementing efforts to better inform passengers and employees of the public transit options available at the airport. As discussed above, a lack of information or familiarity can deter transit use. Airport strategies include advertisement campaigns on social media and ensuring adequate signage is posted throughout the airport to help passengers and employees be aware of and find the transit options. At each airport, we observed signage, particularly in the arrivals area, that provided directions to the transit options (see fig. 6). Additionally, all five airports had information booths to assist passengers and provide directions, including to ground transportation options such as transit.
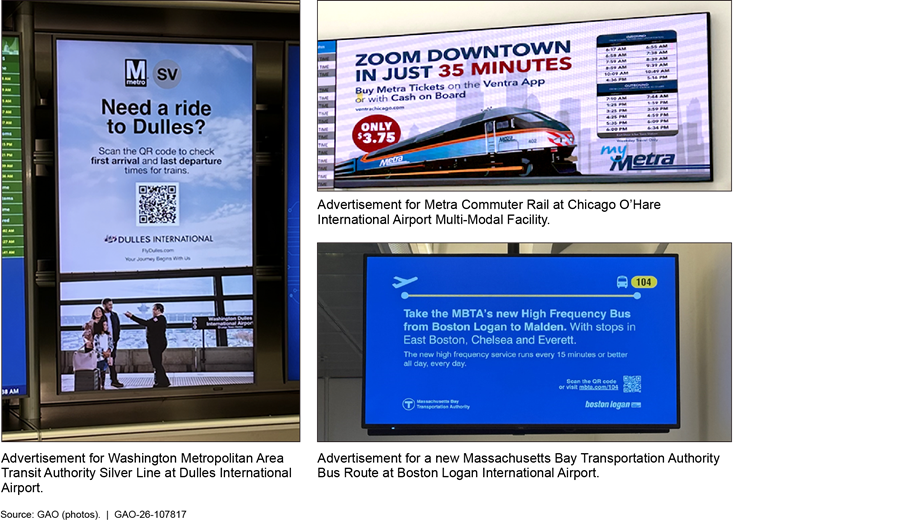
The airports also advertised various public transit options that were available (see fig. 7).
Officials at four of the site visit airports said some information-sharing strategies were targeted at airport employees. For example, since 2023, Seattle-Tacoma International Airport has hosted an annual transportation resource fair and gave multiple presentations to increase employee awareness of transit. Additionally, Boston Logan International Airport advises airport employers on transit options and benefits.
Offering transit incentives. All five airports we visited offered incentives to make transit more cost-competitive relative to car-based modes. As discussed above, cost is a key consideration for passengers and employees when choosing a ground transportation mode. Some individual employers may offer certain airport employees transit benefits, but not all do so. According to Denver International Airport’s 2024 TDM plan, most surveyed airport employers do not offer transit subsidies for employees. According to an Airport Cooperative Research Program report, the large number of employers at airports makes it difficult to coordinate transit subsidies for all employees.[74] However, Denver International Airport is implementing transit subsidy programs that cover employees across multiple employers. Officials at this airport worked with Denver’s transit agency to place all shop and restaurant employers under one transit pass contract to maximize volume-based discounts.
In addition to employee programs, three site visit airports were implementing incentives for passengers. For example, Boston Logan International Airport offers free public transit on the Back Bay Logan Express and the Massachusetts Bay Area Transit Authority Silver Line from the terminal curbside to downtown Boston.[75] Additionally, Denver International Airport plans to offer shopping, food, and drink discounts to passengers that take transit to the airport. In addition to monetary incentives, two airports offer, or are considering offering, expedited security screenings to passengers that take transit to the airport. Boston Logan International Airport offers a “ticket to skip” to passengers that take water transportation or the Back Bay Logan Express to the airport, which entitles passengers to go to the front of the security line. Denver International Airport is exploring implementing a similar policy in the second phase of its TDM plan.
Collecting car access fees. Airports seeking to increase transit use can strategically charge fees to car-based modes, which can encourage transit use by increasing the cost of driving to the airport. All site visit airports charge fees for parking, rideshare services, and taxis. Additionally, three airports considered, but did not implement, fees to pick up or drop off passengers at the terminal curbside. According to a DOT report, strategically pricing parking can be an effective tool to encourage transit use and mitigate excess congestion by reducing vehicle demand.[76] DOT officials noted that an airport could encourage the use of transit through higher charges on parking, rideshares, and rental cars. Officials from a transit agency said that, while raising parking prices may encourage transit use, airports may be reluctant to do so because parking is a primary source of nonaeronautical revenue for airports.
Providing supplemental overnight service. Two airports, as well as a transit agency, have added supplemental overnight service options to accommodate employees with early or late shifts. As discussed above, gaps in transit operating hours can preclude some employees from taking transit to and from work. At Denver International Airport, the local transit agency expanded hours for the airport rail line so employees working early shifts could take the train to work. Boston Logan International Airport operates the Sunrise Shuttle, an overnight shuttle between the airport and surrounding communities with high densities of airport employees, for employees whose shift starts before or after transit operating hours. Seattle-Tacoma International Airport is considering offering a similar service to employees.
Increasing the frequency of existing transit options. Three airports plan to increase the frequency of certain airport transit services.[77] For example, Boston Logan International Airport plans to increase the suburban Logan Express frequency from every 30 minutes to every 20 minutes, effectively adding a new bus every hour. Denver International Airport plans to conduct a transit study to determine if more frequent service will increase transit use, and Seattle-Tacoma International Airport is working with local transit agencies to increase the frequency of certain bus routes.
Some transit agencies and metropolitan planning organizations manage region-wide TDM programs that are not specific to, but could benefit, airport passengers or employees. For example, Regional Transportation District in Denver and Sound Transit in Seattle both offer fare-free transit for youths to encourage more families to take public transit. Additionally, officials from two metropolitan planning organizations said they manage guaranteed ride home programs. Such programs encourage workers to take transit, or to carpool with other employees to work, by offering no-cost taxi services home in certain situations such as working beyond scheduled bus or rail service due to unscheduled overtime or an unplanned early carpool departure.
Airports considered various factors and goals when selecting TDM strategies to implement, including the potential for immediate impact and costs to implement. Denver and Seattle-Tacoma International Airports chose the TDM strategies to implement based on the potential for immediate impact, financial cost and ease of implementation, and ability to meet broader airport policy goals, such as reducing congestion and greenhouse gas emissions. For example, Seattle-Tacoma International Airport selected 10 TDM strategies to implement out of 60 identified strategies, using a scoring methodology that considered target audience (passengers or employees), cost of implementation, and ability to meet the airport’s congestion and sustainability goals.[78] To identify potential TDM strategies, Denver and Seattle-Tacoma International Airports surveyed passengers and employees, interviewed major airport employers and stakeholders, and reviewed TDM strategies that peer airports had implemented.[79]
Some Selected Airports Have Plans to Assess the Effects of Their TDM Strategies but Could Face Challenges Doing So
Two of the five airports we visited have specific mode share goals for certain ground transportation options, including transit, and plan to assess the effects of their TDM strategies on reaching those goals. Two airports we visited had broad goals related to congestion reduction and sustainability, in addition to specific passenger and employee ground transportation mode share goals (see table 4). The other three airports broadly sought to increase transit use but did not have specific transit targets. For example, encouraging public transit use is one of Washington Dulles International Airport’s goals in its 2025 sustainability plan, but the airport has not set any specific transit mode share targets.[80] Additionally, Seattle-Tacoma International Airport’s TDM plan included goals such as addressing traffic congestion, influencing passenger mode share, and promoting sustainability.
Table 4: Site Visit Airport Congestion Reduction and Sustainability Goals and Transportation Demand Management (TDM) Specific Targets
|
Airport |
Goals related to congestion reduction and sustainability |
TDM-specific targets |
|
Boston Logan International Airport |
Increase high-occupancy vehicle mode sharea Reduce employee drive-alone rates Improve roadway function related to ride shares Increase coordination with transit agency Improve ground access management through technology |
Forty percent high-occupancy vehicle mode share by 2027 |
|
Denver International Airport |
Manage Demand and Congestion Improve Sustainability Improve Air Quality Increase Equity and Access to Jobs Improve Mobility Use Innovative Technologies |
Increase passenger transit and shuttle use by 10 percentage points by 2035 (from 9 percent as of 2022)b Reduce employee drive-alone rates by 10 percentage points by 2035 (from 71 percent as of 2022) |
Source: GAO analysis of site visit airport TDM plans. | GAO‑26‑107817
aBoston Logan International Airport defines high-occupancy vehicles as vehicles with two or more passengers. This includes bus and rail service in addition to some car-based modes such as shared ride vehicles or shuttles and vans.
bIncludes transit (6.3 percent) and regional shuttles (2.1 percent), which according to Denver International Airport officials rounds up to 9 percent.
While two airports set goals for transit use, they may not know the effects of their TDM strategies for some time because they have only recently begun to implement them. All the site visit airports were in the early stages of implementing the TDM strategies, and many strategies the airports identified may not be implemented for years because they require funding and policy changes. For example, Denver International Airport’s TDM plan has four implementation phases—the initial phases focus on strategies that are easy to implement and have potential for immediate impact, whereas the later phases focus on strategies that will likely require funding and policy changes to implement. These strategies will also take time to have an effect, once implemented.
More broadly, airports may face challenges assessing the effects of TDM strategies on transit use. As noted above, airports may not regularly collect data on passenger ground transportation mode use, making systematic assessment of the effects of TDM strategies difficult. According to DOT officials, transit agencies can track transit ridership at airports, and airports could combine this transit ridership data with airport data such as passenger boardings and number of employees, to get a sense of the extent passengers and employees use transit to access the airport. Beyond data collection, it may be difficult to isolate the effects of TDM strategies. For example, increased transit ridership can result from an overall increase in air travel, rather than a TDM strategy. A decrease in transit ridership can also be due to transit service disruptions outside of airports’ control, not the failure of a TDM strategy. Alternatively, transit ridership to airports can increase during roadway closures and construction. For example, officials at Boston Logan International Airport said transit ridership increased when one of the highway tunnels used to access the airport was closed for construction.
Agency Comments
We provided a draft of this report to DOT for review and comment. DOT provided technical comments, which we incorporated as appropriate.
We are sending copies of this report to the appropriate congressional committees, the Secretary of Transportation, and other interested parties. In addition, the report is available at no charge on the GAO website at https://www.gao.gov.
If you or your staff have any questions about this report, please contact me at vonaha@gao.gov. Contact points for our Offices of Congressional Relations and Public Affairs may be found on the last page of this report. GAO staff who made key contributions to this report are listed in appendix III.

Andew Von Ah
Director
Physical Infrastructure
We created summaries of the public transit options available at 51 airports. Specifically, we collected information on public transit options at all 31 large-hub (referred to as large airports) and a random sample of 10 medium-hub and 10 small-hub (referred to as medium and small airports).[81] We selected these airports using the Federal Aviation Administration’s (FAA) calendar year 2023 enplanement (passenger boardings) data.[82] We defined public transit as regularly scheduled bus, subway, metro, light rail, or commuter rail service that is available to the public and provided by a transit agency or airport.[83] For rail options, we used online mapping tools to determine whether the rail transit station was “on-site” within the airport boundaries, or “off-site” and outside those boundaries.[84] In December 2025, we contacted representatives from all 51 airports to confirm that we had accurately identified transit options as of November 2025.
|
Denver International Airport (Large) In July and August 2022, Denver International Airport conducted a survey of 4,800 departing passengers in gate holding areas using a sampling methodology to obtain a range of departing passengers. Of the departing passengers surveyed, 6 percent used transit to arrive at the airport (2 percent bus and 4 percent train rail/subway), 86 percent used car-based transportation (including being dropped off, taking a taxi, rideshare, or limousine, parking on- or off-site, or rental car shuttle), 2 percent used a hotel shuttle, 2 percent used a regional shuttle, 3 percent “Other” transportation, and one percent provided no response. |
|
John F. Kennedy International Airport (Large), Newark Liberty International Airport (Large), LaGuardia Airport (Large) Publicly available traffic reports from the Port Authority of New York and New Jersey, dated April 2025, reported ground transportation mode share data from the 2024 Airport Service Quality survey conducted by Airports Council International (ACI) for John F. Kennedy International Airport, Newark Liberty International Airport, and LaGuardia Airport. As reported from ACI, the survey includes departing passengers randomly selected at boarding gates of pre-selected flights. Flights are selected based on destination and airline to obtain a representative sample of all departing passengers. Passengers are surveyed during all operating hours, each day of a week, and every month of a quarter. Frequency of survey administration is determined by the program a participating airport selects and can be administered once, twice or 4 times per year (once per quarter). According to ACI, this methodology assures the airports that the resulting samples are representative of the true distribution of its passengers, allowing the extrapolation of results to all passengers. At John F. Kennedy International Airport, of the passengers surveyed, 19 percent used transit, including 4 percent bus/shuttle/coach (including hotel shuttles and charter buses in addition to public transit buses), and 15 percent rail/subway, 78 percent used car-based transportation (including being dropped off, using private/company car, rental car, rideshare, or taxi/limousine), and 3 percent used “Other” transportation. At Newark International Airport, of the passengers surveyed, 13 percent used transit, including 7 percent bus/shuttle/coach (including hotel shuttles and charter buses in addition to public transit buses), and 6 percent rail/subway, 84 percent used car-based transportation (including being dropped off, using private/company car, rental care, rideshare, or taxi/limousine), and 4 percent used “Other” transportation. At LaGuardia Airport, of the passengers surveyed, 13 percent used transit, including 9 percent bus/shuttle/coach (including hotel shuttles and charter buses in addition to public transit buses), and 4 percent rail/subway, 85 percent used car-based transportation (including being dropped off, using private/company car, rental care, rideshare, or taxi/limousine), and 2 percent used “Other” transportation. |
|
Seattle-Tacoma International Airport(Large) In 2024 Seattle-Tacoma International Airport conducted a survey of 2,400 departing passengers in gate holding areas. Of the departing passengers, an estimated 9 percent used transit (8 percent light rail, 1 percent bus), 77 percent used car-based transportation (including limousine, on-site and off-site parking, being dropped off by a private vehicle, taxi, or rideshare, or used a rental vehicle), 8 percent used private or charter buses, 3 percent used hotel courtesy shuttles, and 2 percent used “Other” transportation. |
|
San Francisco International Airport (Large) In 2024, San Francisco International Airport surveyed 2,237 travel parties, representing 4,022 departing passengers, on the ground transportation mode they used to access the airport in gate holding areas. Each survey was conducted by interviewing only one member of each travel party, meaning that each response represents one travel party, which may be more than a single passenger. Of the departing passengers, 5 percent reported using transit, 90 percent used car-based transportation (including being dropped off, using rideshares/taxis, rental cars, parking, or using a limousine/hired car), with 5 percent using other forms of transportation (such as hotel shuttle or commercial bus). |
|
Oakland San Francisco Bay International Airport (Medium) Researchers at the University of California-Davis conducted a revealed preferences survey among passengers to four airports in Northern California residing in 21 counties in the region, including Oakland San Francisco Bay International Airport, one of our selected airports. The survey was administered between December 2022 and March 2023, using an online opinion panel employing a quota sampling approach to obtain a range of respondent characteristics, such as age, gender, and household income. Among all airports, 1,038 respondents completed the survey. Among all respondents · 202 respondents provided information on the form of ground transportation they used to get to Oakland San Francisco Bay International Airport for their most recent departing flight; 183 reported the form of ground transportation they used to leave Oakland San Francisco Bay International Airport after their most recent return flight; and · among Oakland San Francisco Bay International Airport respondents reporting modes of transport to get to the airport for their most recent departing flight, 4 percent reported using transit, 78 percent reported using car-based transportation (including driving and parking, being dropped off/picked up, or using a ride-hailing service), 9 percent reported using “Other” transportation, and 9 percent reported using multiple forms of transportation. Among Oakland San Francisco Bay International Airport respondents reporting modes of transport to return from the airport after their most recent return flight, 4 percent reported using transit, 81 percent reported using car-based transportation (including driving and parking, being dropped off/picked up, or using a ride-hailing service), 8 percent reported using “Other” transportation, and 7 percent reported using multiple forms of transportation. |
|
Boston Logan International Airport (Large) Boston Logan International Airport conducted a survey over a 3-week period between April and May 2024 of departing passengers (6,000 departing passengers responded to the survey). The survey aimed to estimate the proportion of air passengers arriving at the airport using various modes of transportation. The responses were weighted to represent passengers from a range of flights passing through the airport during the survey period. Of the departing passengers, an estimated 11 percent used transit to arrive at the airport (including bus, rail, and ferry/water taxi service), 77 percent used car-based travel (including being dropped off, driving and parking, using rental car, taxi, rideshare or limousine/van), 8 percent used a private or charter bus, 3 percent used a courtesy shuttle, and 1 percent used “Other” transportation. The survey reports ferry service—which is publicly provided transit—and water taxi service—which is privately operated, and therefore, not transit—together. However, the total share of passengers using ferry and water taxi service is so small (.3% of passengers) that it does not affect the rounded total for transit. |
|
Baltimore/Washington International Airport (Large), Ronald Reagan Washington National Airport (Large), Washington Dulles International Airport (Large) The National Capital Region Transportation Planning Board conducted the Regional Air Passenger Survey of departing passengers at randomly selected gates over a 2-week period in October 2023. Across Dulles International Airport, Baltimore/Washington International Airport, and Ronald Reagan Washington National Airport, 468 flights were surveyed yielding 9,599 responses. Responses were weighted based on annual passenger boardings to reflect air passengers for an annual period. At Baltimore/Washington International Airport: · 4,018 departing passengers completed the survey; and · of departing passengers, an estimated 4 percent used transit, 88 percent used car-based transportation (including a private car, rental care, taxi, or rideshare), 2 percent used a hotel/motel courtesy bus, 3 percent used an airport bus, van, or limousine, and 3 percent used “Other” transportation. At Ronald Reagan Washington National Airport: · 3,039 departing passengers completed the survey; and · of departing passengers an estimated 12 percent used transit, 82 percent used car-based transportation (including a private car, rental care, taxi, or rideshare), 2 percent used a hotel/motel courtesy bus, <1 percent used an airport bus, van, or limousine, and 3 percent used “Other” transportation. At Dulles International Airport: · 2,542 departing passengers completed the survey; and · Of departing passengers, an estimated 8 percent used transit, 86 percent used car-based transportation (including a private car, rental care, taxi, or rideshare), 2 percent used a hotel/motel courtesy bus, 2 percent used an airport bus, van, or limousine, and 3 percent used “Other” transportation. |
|
Kansas City International Airport (Medium) The Kansas City Area Transportation Authority (KCATA) and the Mid-America Regional Council (MARC) surveyed a convenience sample of attendees of the 2023 NFL draft in Kansas City. Specifically, the project team surveyed 1,125 attendees in 387 groups, with a focus on capturing out-of-town guests. Of those surveyed, 42 percent traveled to Kansas City by plane with another 56 percent traveling by car. Those 42 percent that traveled to Kansas City by plane accessed their lodgings using different modes of ground transportation: Respondents indicated accessing lodging mainly via taxi (42 percent), car rental (30 percent), and having a friend/ family pick them up (24 percent). Four percent of respondents used a bus to get from Kansas City International Airport to their lodging and 1 percent stated they planned on taking a bus to get back to the airport. KCATA and MARC also surveyed a sample of residents after an August 22, 2023, public meeting as part of the Kansas City International Airport Public Transit Services Action Plan. The online survey was available for 30 days following the in-person event and was promoted at other regional meetings. In total, a convenience sample of 404 residents responded. When asked “Do you use public transit” over 10 percent of respondents selected that they use public transit “locally to get to/from KCI.” The survey did not ask about frequency of travel to/from the airport or the reason for travel (such as employment). |
Note: In some cases, we rounded mode share percentages in the identified airport documentation and reports to whole numbers. Due to mode-share category summation and rounding procedures, rounded percentages may be within, but no more than, one percent of the reported percentages in the identified reports and documentation.
Andrew Von Ah, vonaha@gao.gov
In addition to the contacts named above, the following individuals made key contributions to this report: Emily Larson (Assistant Director); Ethan Levy (Analyst in Charge); Michael Armes; Eva Cheng; Emily Crofford; Delwen Jones; Michael Murray; Lorin Obler; Kelly Rubin; Norma-Jean Simon; Pamela Snedden; Malika Williams; Alicia Wilson; and Christopher Wolf.
The Government Accountability Office, the audit, evaluation, and investigative arm of Congress, exists to support Congress in meeting its constitutional responsibilities and to help improve the performance and accountability of the federal government for the American people. GAO examines the use of public funds; evaluates federal programs and policies; and provides analyses, recommendations, and other assistance to help Congress make informed oversight, policy, and funding decisions. GAO’s commitment to good government is reflected in its core values of accountability, integrity, and reliability.
Obtaining Copies of GAO Reports and Testimony
The fastest and easiest way to obtain copies of GAO documents at no cost is through our website. Each weekday afternoon, GAO posts on its website newly released reports, testimony, and correspondence. You can also subscribe to GAO’s email updates to receive notification of newly posted products.
Order by Phone
The price of each GAO publication reflects GAO’s actual cost of production and distribution and depends on the number of pages in the publication and whether the publication is printed in color or black and white. Pricing and ordering information is posted on GAO’s website, https://www.gao.gov/ordering.htm.
Place orders by calling (202) 512-6000, toll free (866) 801-7077,
or
TDD (202) 512-2537.
Orders may be paid for using American Express, Discover Card, MasterCard, Visa, check, or money order. Call for additional information.
Connect with GAO
Connect with GAO on X,
LinkedIn, Instagram, and YouTube.
Subscribe to our Email Updates. Listen to our Podcasts.
Visit GAO on the web at https://www.gao.gov.
To Report Fraud, Waste, and Abuse in Federal Programs
Contact FraudNet:
Website: https://www.gao.gov/about/what-gao-does/fraudnet
Automated answering system: (800) 424-5454
Media Relations
Sarah Kaczmarek, Managing Director, Media@gao.gov
Congressional Relations
David A. Powner, Acting Managing Director, CongRel@gao.gov
General Inquiries
[1]Federal Aviation Administration, Air Traffic Organization and Systems Operation Services, Air Traffic by the Numbers, 2025-AJO-084 (June 2025).
[2]Airports Council International - North America, The Economic Impact of U.S. Commercial Service Airports in 2024 (March 2025).
[3]This includes all large-, medium-, and small-hub airports. Large-hub airports are those receiving 1 percent or more of annual U.S. commercial enplanements (passenger boardings); medium-hub airports are those receiving at least 0.25 but less than 1 percent of annual U.S. commercial passenger boardings; and small-hub airports are those receiving at least 0.05 but less than 0.25 percent of annual U.S. commercial passenger boardings. See 49 U.S.C § 47102 (11), (13), (25).
[4]Federal Aviation Administration, The Economic Impact of U.S. Civil Aviation State Supplement 2022, 2025-APL-031_MM264 (Washington, D.C.: September 2025). The civil aviation industry encompasses all commercial airline, cargo, and general aviation operations.
[5]National Academies of Sciences, Engineering, and Medicine, Transportation Network Companies: Challenges and Opportunities for Airport Operators (Washington, D.C.: The National Academies Press, 2017). In 2016, an online survey was conducted of ground transportation operations staff at the 100 largest U.S. airports. Of airports surveyed, 72 responses were received.
[6]National Academies of Sciences, Engineering, and Medicine, Strategy Guide to Enable and Promote the Use of Fixed-Route Transit by People with Disabilities (Washington, D.C.: The National Academies Press, 2014).
[7]Federal Aviation Administration Reauthorization Act of 2024, Pub. L. No. 118-63, §§ 736, 755, 138 Stat. 1025, 1275-76, 1285. Section 755 defines TDM as the “use of planning, programs, policy, marking, communications, incentives, pricing, data, and technology to optimize travel modes, routes used, departure times, and number of trips.” § 736(d).
[8]We randomly selected 10 out of 33 total medium hub airports and 10 out of 74 total small-hub airports.
[9]Our definition of public transit does not include taxis; rideshares provided by Lyft, Uber, or other services; hotel or employee shuttles; on-demand services such as paratransit; or seasonal transit services. It also does not include intercity bus or rail (e.g., Amtrak). We previously reported on Amtrak’s connectivity to U.S. commercial airports. See GAO, Intermodal Transportation: A Variety of Factors Influence Airport-Intercity Passenger Rail Connectivity, GAO‑13‑691 (Washington, D.C..: Aug. 2, 2013).
[10]See appendix I for the complete list of transit options and location of rail stations, if applicable, at the 51 selected airports. We selected the airports using FAA 2023 passenger boardings data. However, the appendix presents the number of passenger boardings per airport using FAA 2024 data, the most recent data available as of November 2025.
[11]We searched the ProQuest and TRID databases. We limited our scope to reports since 2022 to exclude data from the time during and prior to the COVID-19 pandemic.
[12]See App. II for more information on the documentation or reports for each of the 12 airports. When methodological details regarding the survey sample were unclear, we contacted airport representatives to collect additional information regarding the sampled population, time frames of data collection, and response rate.
[13]We specifically analyzed the survey’s Public Use Microdata Sample 2019 through 2023.
[14]American Community Survey question 32 specifically asks, “How did you usually get to work LAST WEEK? Mark (X) ONE box for the method of transportation used for most of the distance.”
[15]For example, we included in our analysis the categories of “Aircraft Pilots and Flight Engineers,” “Baggage Porters, Bellhops, and Concierges,” “Cargo and Freight Agents,” “Maintenance and Repair Workers,” and “Cleaners of Vehicles and Equipment”—as well as food service worker categories. We did not include occupational categories such as “Computer Systems Analysts” and “Human Resource Workers” because, while individuals in these categories may work for airports or airlines, it is less certain that they work on-site at airports.
[16]We searched the ProQuest, TRID, EBSCO, Scopus, Dialog, and Nexus databases.
[17]Airport and transit industry groups we interviewed were Airports Council International – North America, InterVistas Consulting, Association for Commuter Transportation, Association of Metropolitan Planning Organizations, and American Public Transit Association. Disability advocacy organizations we interviewed were the National Council on Independent Living and Paralyzed Veterans of America. The airline industry group we interviewed was Airlines for America. The labor union we interviewed was the Service Employees International Union.
[18]We refer to these airports as “site visit airports” or “airports we visited” throughout our report to distinguish our site visit sample from the 51 selected airports.
[19]Passenger boardings are the number of revenue passengers who board a flight at a particular airport in the prior calendar year. For the purposes of reporting air traffic, FAA defines revenue passenger as “a passenger for whose transportation an air carrier receives commercial remuneration.” See 14 C.F.R. § 217.1. This includes both passengers boarding a flight at their original airport as well as boarding a connecting flight. Federal law categorizes commercial service airports based on the number of passenger boardings.
[20]Airports Council International - North America, The Economic Impact of U.S. Commercial Service Airports in 2024.
[21]National Academies of Sciences, Engineering, and Medicine, Exploring Airport Employee Commuting and Transportation Needs (Washington, D.C.: The National Academies Press, 2024).
[22]For the purposes of our report, air trains move airport users to locations both on and off airport grounds on dedicated tracks. Many air trains are also referred to by FAA and others as Automated People Mover systems. These systems, which can be located inside or outside of airport security, are used to transport passengers between stops on a frequent basis. Most air train systems are free to ride, while others, such as AirTrain JFK at John F. Kennedy International Airport in New York, may charge a fee to passengers.
[23]GAO, Intermodal Transportation: Potential Strategies Would Redefine Federal Role in Developing Airport Intermodal Capabilities, GAO‑05‑727 (Washington, D.C.: July 26, 2005). The 2005 report reviewed transit options at 72 U.S. airports, including the 31 large airports we selected for this review.
[24]For example, states must produce both Statewide Transportation Plans, with a minimum 20-year forecast period, and Transportation Improvement Programs, which cover a 4-year planning period, in conjunction with metropolitan planning organizations for covered metropolitan areas. 23 U.S.C. § 135(f), (g). A metropolitan planning organization is a federally mandated organization designated for each urban area in a state with a population of more than 50,000. See id. § 134(d)(1).
[25]A sponsor is a public agency or private owner of a public-use airport that submits an application on behalf of the airport for certain financial assistance. 49 U.S.C. § 47102(26). Airport sponsors are generally public entities, such as city, county, or state governments or a port authority with a board appointed by a mayor or governor.
[26]Increased use of rideshares can affect airport revenue from parking fees. A 2017 Airport Cooperative Research Program report found that public parking transactions declined up to 13 percent at airports after the introduction of rideshares. National Academies of Sciences, Engineering, and Medicine, Transportation Network Companies, Challenges and Opportunities for Airport Operators.
[27]National Academies of Sciences, Engineering, and Medicine, Airport Customer Facility Charges: Analysis of Laws, Regulations, and Case Law (Washington, D.C.: The National Academies Press, 2023). Unlike Passenger Facility Charges, customer facility charges are not a federal program, and airports can enter directly into agreements with rental car companies.
[28]Hartsfield/Jackson Atlanta International, Dallas-Fort Worth International, Salt Lake City International and Ronald Reagan Washington National have rail, but not bus, service.
[29]We counted airports with multiple rail service operators as having on-site service, if one of the operators provides on-site service.
[30]Large airports generally have bus service curbside at their terminals. Of the 27 large airports with bus service, 23 have service curbside at the airport terminal. Bus service is accessible via air train at Chicago O’Hare, Phoenix Sky Harbor, and Tampa International. Bus service is currently accessible via free shuttle bus at Los Angeles International Airport; however, access via air train is planned to open in 2026.
[31]GAO‑05‑727. These airports gaining rail service may have previously lacked rail service, or may have already had rail service but added additional service, or may have established a free shuttle bus to existing off-site rail service.
[32]According to LA Metro, while the new transit center opened in June 2025, the air train connecting the airport to the transit center is expected to open in 2026. Access to the transit center is currently provided by free shuttle bus.
[33]We identified downtown as the core business district of the metropolitan area served by the airport. Three large airports—Nashville International Airport, Salt Lake City International, and Austin-Bergstrom International —have one transit route each to downtown, with multiple stops between end points.
[34]The Massachusetts Bay Transportation Authority also provides a ferry service between Hingham, Massachusetts and downtown Boston with the airport as one stop on the route.
[35]While the A Line’s terminating stations are at Denver International Airport and downtown Denver, the line also has multiple stops in between.
[36]We did not collect information on bus service operating hours for airports of any size, due to the frequency with which bus route hours change.
[37]The Salt Lake City airport rail service operates from 5:20 am to 11:27 pm; the San Diego airport rail service operates from 6:11 am to 11:47 pm; the Honolulu airport rail service operates from 4 am to 10:29 pm; and the Fort Lauderdale/Hollywood International airport rail services operates from: 4:24 am to 10:29 pm.
[38]Like large airports, rail service at the medium airports that have it operates from early in the morning to late at night. Specifically, rail service at Cleveland Hopkins operates from about 3:30 am to 1:30 am and at Oakland from about 5:00 am to 12:00 am on weekdays.
[39]One medium airport, Southwest Florida International Airport in Fort Myers, has a single bus route with multiple stops, including a transit center where transfers are available to downtown Fort Myers. The airport bus route terminates at a park-and-ride near Fort Myers Beach.
[40]The other three small airports have single bus routes that provide service to other locations, such as a military base or a transit center with transfers to other bus routes, but do not directly serve the local downtown.
[41]We visited five airports in total. One airport we visited, Boston Logan International Airport, did not implement a transit capacity project within the past 10 years. We selected Boston Logan International Airport due to the TDM strategies the airport was implementing to encourage use of existing airport transit options.
[42]The Dulles toll road runs from the Capital Beltway to Leesburg, Virginia, and is directly owned and operated by the Metropolitan Washington Airports Authority.
[43]In 2004, voters in Denver approved an increase on Regional Transportation District (RTD) fare sales tax to fund the Eagle P3, which includes the RTD A Line. Additionally, in 1996, voters in Seattle authorized local taxes to fund the Sound Transit light rail lines.
[44]The structure of public-private partnerships in transportation varies. For instance, the public-private partnership can be contractual relationships, typically between a state or local government, which are the owners of most transportation infrastructure, and a private company. In some public-private partnerships, the private company helps design, build, finance, operate, or maintain a transit project. In such a partnership, the public agency may repay the private company through revenue generated from the project, such as fare or toll payments.
[45]See Federal Aviation Administration, PFC 75-21. Eligibility of on-airport rail access projects. Memorandum to Regional Airports Directors, 610 Branch Managers, and ADO Managers (Jan. 12, 2021).
[46]See Notice of Policy Regarding the Eligibility of Airport Ground Access Transportation Projects for Funding Under the Passenger Facility Charge Program, 69 Fed. Reg. 6366 (Feb. 10, 2004).
[47]Per federal law, airports receiving certain federal funds are generally prohibited from using airport revenue and funding programs to subsidize non-airport passengers. 49 U.S.C. § 47133. Therefore, airports are limited to funding the on-site portion of transit capacity projects to ensure that eligible costs are for the portion of the project that exclusively serves the airport.
[48]See Federal Aviation Administration, Compliance Guidance Letter 2025-02, FAA Guidance Regarding the Use of Airport Revenue for Airport Ground Access Projects (June 9, 2025). In the letter, FAA notes that it has previously permitted airports to use revenue to fund through rail lines. For example, in 2000, FAA permitted Minneapolis-St. Paul International Airport to use airport revenue to fund part of the Hiawatha light rail system, which goes between downtown Minneapolis and the Mall of America with the airport as an intermediate stop.
[49]Ten of the 31 large airports and two of the 10 selected medium airports had mode share documentation. The available reports and documentation reviewed included surveys conducted by airports, academics, and metropolitan planning organizations and presentation slides an airport provided to us. Surveys conducted at the 10 large airport were of passengers waiting for departing flights. Surveys conducted at the two medium airports were of residents and recent travels. See app. II for additional information on the data collection methodologies, respondents, and results for each of the 12 airports. Two additional large airports had available mode share documentation, but we excluded these airports from our reporting, as we could not ascertain sufficient details regarding their data collection methodologies.
[50]Fifteen percent of surveyed passengers at John F. Kennedy International airport reported using “subway/ rail” to access the airport. Another 4 percent of passengers reported using “bus/shuttle/coach” service to access the airport. However, “bus/shuttle/coach” included hotel shuttles and charter buses in addition to transit buses. Meanwhile, Baltimore/Washington International specifically counts public transit, including bus and rail, as its own category.
[51]Federal Transit Administration, National Transit Summaries and Trends 2023 Edition, (Washington D.C.: 2024).
[52]For the analysis of American Community Survey data, we define transit modes as including bus, subway or elevated rail, long-distance train or commuter rail, light rail, streetcar or trolley, and ferryboat.
[53]Denver International Airport surveyed employees in the fall of 2022. The survey was available in paper and on-line formats and was distributed through airport employers, airport communication channels, and employee events. The survey received 2,702 responses, representing approximately 8 percent of all airport employees at the time of the survey. Five percent of respondents reported taking the bus, and 12 percent reported taking rail to get to the airport. Seattle-Tacoma International Airport received survey responses from 1,477 employees in January and February 2025. The survey was conducted in-person at employee screening checkpoints and airport bus stops, distributed via email, and posted to airport employee websites. Ten percent of respondents reported taking the light rail and 9 percent reported taking the bus to get to the airport.
[54]GAO, Commuter Rail: Most Systems Struggling to Recover Ridership Following the COVID-19 Pandemic, GAO‑25‑107511 (Washington, D.C. May 7, 2025).
[55]Federal Aviation Administration, Forecast Process 2024 TAF, (Washington, D.C.: January 2025).
[56]These documentation and reports generally identify car-based travel as driving and parking, use of taxis or rideshare, rental cars, and limousines; or being dropped off or picked up.
[57]Since 1975, Boston Logan International Airport has been subject to a parking freeze that caps the number of commercial and employee parking spaces on airport property to reduce vehicle-related pollution. The Environmental Protection Agency implemented the Logan Parking Freeze to help Boston reduce vehicle-related emissions and achieve air quality standards established in the Clean Air Act of 1970. See 40 C.F.R. § 52.1135; Promulgation of Final Amendments to Transportation Control Plan – Boston, Massachusetts, 40 Fed. Reg. 25,152 (June 12, 1975). The cap has been periodically updated to account for growth in air travel. As of 2017, the most current update, Boston Logan International Airport is limited to 26,088 parking spaces, with 2,448 employee parking spaces and 23,640 commercial (i.e., passenger) parking spaces.
[58]While we reviewed the reported survey methodologies for the 12 reports and documentation identified, we did not assess the reliability of the survey data. The results of the surveys may not be representative or generalizable to all airports or airport passengers. In addition, results may not be comparable across airports, due to different definitions of transit, as well as varying survey methodologies.
[59]According to DOT, the Census Transportation Planning Package data measures transit use on both ends of the commute. However, according to DOT, the most recent available data from the package is from 2017 through 2021, which is 2 years older than the American Community Survey data we relied on.
[60]National Academies of Sciences, Engineering, and Medicine, Improving Public Transportation Access to Large Airports (Washington, D.C.: The National Academies Press, 2000).
[61]Transit costs can vary throughout the day. For example, as of November 2025, the cost of Denver’s A Line train between downtown Denver and Denver International Airport was $10 at all times, while the cost of the Silver Line between downtown Washington, D.C., and Dulles International Airport was $6.75 on weekdays but dropped to $2.25 after 9:30 pm and on weekends.
[62]Concessionaires are airport businesses that sell goods and services to travelers including food and drink, retail items, parking, and rental cars.
[63]National Academies of Sciences, Engineering, and Medicine, Improving Public Transportation Access to Large Airports.
[64]National Academy of Sciences, Engineering, and Medicine, Improving Public Transportation Access to Large Airports.
[65]National Academies of Sciences, Engineering, and Medicine, Improving Public Transportation Access to Large Airports.
[66]National Academies of Sciences, Engineering, and Medicine, Improving Public Transportation Access to Large Airports.
[67]The Environmental Protection Agency has developed “The Access to Jobs and Workers Via Transit Tool,” which provides indicators of accessibility to destinations by public transit. Federal Transit Administration, “Smart Location Mapping,” accessed September 25, 2025, https://www.epa.gov/smartgrowth/smart-location-mapping.
[68]National Academy of Sciences, Engineering, and Medicine, Improving Public Transportation Access to Large Airports.
[69]National Academy of Sciences, Engineering, and Medicine, Strategy Guide to Enable and Promote the Use of Fixed-Route Transit by People with Disabilities. The survey was administered online between April and May 2012, was promoted heavily throughout the U.S. disability community, and open to the public. Responses were received from 1,927 U.S.-based individuals self-identified with an interest in public transit.
[70]The Urbanized Area Formula Funding program (49 U.S.C. § 5307) makes federal funding available to governors and other recipients for transit capital, transportation-related planning, job access and reverse commute, and operating assistance in urbanized areas. An urbanized area is an area that has been defined and designated by the U.S. Department of Commerce, Bureau of the Census, as an “Urban Area” with a population of 50,000 or more.
[71]49 C.F.R. § 37.3.
[72]The airports we visited were Boston Logan International Airport, Chicago O’Hare International Airport, Denver International Airport, Seattle-Tacoma International Airport, and Washington Dulles International Airport.
[73]For additional details see Denver International Airport, DEN Transportation Demand Management Plan Mobility Recommendations (Denver, CO: 2024)
[74]See National Academies of Sciences, Engineering, and Medicine, Ground Access to Major Airports by Public Transportation (Washington, D.C.: The National Academies Press, 2008).
[75]Boston Logan International Airport directly operates the Back Bay Logan Express. Additionally, Boston Logan International Airport contributes a majority of operating costs for the Massachusetts Bay Transportation Authority Silver Line 1 route because most of the length of the Silver Line 1 Route is between the airport and the first off-airport stop. These services are only fare free going from the airport to downtown Boston; passengers taking these services to the airport must pay the fare.
[76]For additional information, see Department of Transportation Federal Highway Administration, Contemporary Approaches to Parking Pricing: A Primer, FHWA-HOP-12-026 (Washington, D.C..: May 2012).
[77]For this category of TDM strategies, airports need to coordinate with local transit agencies because transit agencies generally set service levels (i.e., operating hours, frequency, etc.). The exception is the Logan Express, which is operated directly by Boston Logan International Airport.
[78]See Ricondo & Associates, Inc., Service Directive #7: Ground Transportation Access Plan (GTAP) Study Final Report, a report prepared at the request of the Port of Seattle (Seattle, WA.: August 2018).
[79]Denver and Seattle airports both studied TDM strategies at peer airports (i.e., similar airports in terms of passenger volume and transit connections) to identify strategies that may be effective. Denver reviewed nine peer airports, including six domestic large airports and three European airports. Seattle reviewed 11 peer airports, including seven domestic large airports and four European airports.
[80]See Metropolitan Washington Airports Authority, Washington Dulles International Airport Master Plan: Technical Report, (Washington, D.C.: May 2025).
[81]Large-hub airports are those receiving 1 percent or more of annual U.S. commercial enplanements (passenger boardings); medium-hub airports are those receiving at least 0.25 percent but less than 1 percent of annual U.S. commercial passenger boardings; and small-hub airports are those receiving at least 0.05 percent but less than 0.25 percent of annual U.S. commercial passenger boardings. See 49 U.S.C § 47102 (11), (13), (25).
[82]We randomly selected 10 out of 33 total medium hub airports and 10 out of 74 total small-hub airports.
[83]Our definition of public transit does not include taxis; rideshares provided by Lyft, Uber, or other services; hotel or employee shuttles; or on-demand services, such as paratransit. It also does not include intercity bus or rail (e.g., Amtrak).
[84]While we selected the airports using FAA 2023 passenger boardings data, the appendix presents the number of passenger boardings per airport using FAA 2024 data, the most recent data available as of November 2025.