K-12 EDUCATION
Characteristics and Turnaround Strategies of Schools Identified for Comprehensive Support and Improvement
Report to Congressional Committees
United States Government Accountability Office
A report to congressional committees
Contact: Jacqueline M. Nowicki at nowickij@gao.gov
What GAO Found
Under Title I, Part A of the Elementary and Secondary Education Act of 1965, as amended (ESEA), states are required to measure the performance of their public schools. They must also identify three categories of low-performing schools for support and improvement, including those that need comprehensive support and improvement (CSI)—among the lowest-performing schools in the nation.
· The number of CSI schools increased from 6.5 percent of all public schools in school year (SY) 2019–20 to 7.3 percent in SY 2022–23. Most of this increase was due to schools that were recategorized from needing additional targeted support and improvement (ATSI) to needing CSI because they did not meet their state’s criteria to exit ATSI.
· CSI schools in SY 2022–23 were more academically challenged and economically disadvantaged than the CSI schools identified in SY 2019–20. For example, more CSI students experienced deep poverty in SY 2022–23 than in SY 2019–20.
· Overall, 46 percent of CSI schools identified in SY 2019–20 had exited improvement status by SY 2022–23. Factors influencing the chances of a school exiting CSI status included student characteristics and size. For example, large- and medium-sized schools had increased chances of exiting, while schools with a higher percentage of poor students had decreased chances of exiting.
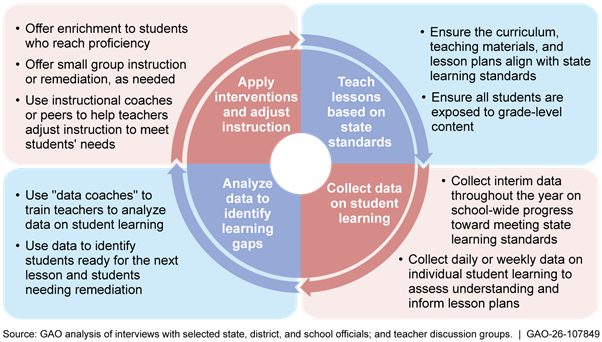
Educators GAO interviewed commonly identified six strategies as key to exiting CSI, with effective leadership critical to all of them (see figure). Many of these strategies are interrelated. For example, schools can use data to measure changes in school culture and monitor sustained improvements. Educators GAO interviewed also described various ways to sustain improvements. For example, in an elementary school that had recently exited CSI, school leaders said they continued to observe and provide feedback to teachers even though this type of monitoring was no longer required. Educators also described persistent challenges to exiting CSI related to student attendance and teacher shortages and turnover.

Why GAO Did This Study
Decades of educational reforms have demonstrated that turning around the lowest-performing schools in the U.S. remains a complex challenge. Schools identified for CSI must include (1) not fewer than the lowest-performing 5 percent of all Title I schools in the state, (2) all public high schools failing to graduate a third or more of their students, and (3) Title I schools previously identified as needing additional targeted support that have not improved within a state-determined number of years. Senate Report 115-289 includes a provision for GAO to review school improvement activities.
This report examines (1) the national landscape of school improvement, such as characteristics associated with schools identified for and exiting CSI; and (2) strategies that helped schools exit CSI and challenges faced, according to selected educators.
To describe the national landscape of school improvement, GAO used SY 2019–20 and SY 2022–23 Department of Education data (the most recent available). GAO used these data to estimate which school characteristics increased or decreased a school’s chances of being identified for and exiting CSI status. GAO also interviewed Education officials and reviewed relevant federal laws and state documents. To identify strategies that helped selected schools exit improvement status, GAO analyzed responses from interviews with educators in three states, eight districts, and 14 schools and held five discussion groups with teachers in selected schools. GAO selected (1) states and districts to reflect variation in approaches to school improvement and (2) schools to provide a mix of current and exited CSI schools in urban, rural, and suburban locations.
Abbreviations
ATSI additional targeted support and improvement
CCD Common Core of Data
CI confidence interval
CRDC Civil Rights Data Collection
CSI comprehensive support and improvement
ESEA Elementary and Secondary Education Act of 1965
FRPL free or reduced-priced lunch
MEPS Model Estimates of Poverty in Schools
NCES National Center for Education Statistics
SAIPE Small Area Income and Poverty Estimates
SY school year
Title I Title I,
Part A of the Elementary and Secondary Education
Act of 1965
TSI targeted support and improvement
This is a work of the U.S. government and is not subject to copyright protection in the United States. The published product may be reproduced and distributed in its entirety without further permission from GAO. However, because this work may contain copyrighted images or other material, permission from the copyright holder may be necessary if you wish to reproduce this material separately.
March 12, 2026
The Honorable Shelley Moore Capito
Chair
The Honorable Tammy Baldwin
Ranking Member
Subcommittee on Labor, Health and Human Services, Education, and
Related Agencies
Committee on Appropriations
United States Senate
The Honorable Robert Aderholt
Chairman
The Honorable Rosa DeLauro
Ranking Member
Subcommittee on Labor, Health and Human Services, Education, and
Related Agencies
Committee on Appropriations
House of Representatives
Decades of educational reforms have demonstrated that turning around the lowest-performing schools in the U.S. remains a complex challenge. Title I, Part A (Title I) of the Elementary and Secondary Education Act of 1965, as reauthorized and amended by the Every Student Succeeds Act in 2015 (ESEA), requires that states measure the performance of their public schools and identify low-performing schools for support and improvement.[1] In fiscal year 2024, states allotted an estimated $1.29 billion of Title I funds to support schools identified for support and improvement. Once identified, schools must develop and implement plans to improve student outcomes. Researchers continue to examine national data and trends related to these schools and their efforts to achieve one of ESEA’s goals of providing a high-quality education to all children.
Senate Report 115-289 accompanying the Departments of Labor, Health and Human Services, and Education, and Related Agencies Appropriations Bill, 2019, and a joint explanatory statement accompanying the Further Consolidated Appropriations Act, 2024, include provisions for us to review school improvement activities undertaken with federal funding provided under Title I of ESEA. This report is the third in a series on school improvement.[2] This report describes (1) the national landscape of school improvement, such as characteristics associated with schools identified for and exiting comprehensive support and improvement (CSI); and (2) strategies that helped schools exit support and improvement and challenges faced, according to selected educators.
To describe the national landscape of school improvement, we analyzed federal data from the U.S. Department of Education’s EDFacts, Common Core of Data (CCD), and Civil Rights Data Collection (CRDC) datasets and the Urban Institute’s Model Estimates of Poverty in Schools (MEPS).[3] Specifically:
· We used EDFacts’ school year (SY) 2022–23 data, the most recent available at the time of our analysis, to determine which schools states had identified for CSI. We compared these to SY 2019–20 data, the last year of data prior to the COVID-19 pandemic, to identify schools that had previously been identified for and later exited CSI. We merged EDFacts data–including data on the school-wide percentage of students in CSI and non-CSI schools scoring proficient on required state assessments–with SY 2019–20 and SY 2022–23 data from the CCD on school characteristics, such as student demographics, school type (e.g., traditional public school, charter school), and ratios of students to teachers in schools.[4] We also merged the EDFacts data with CRDC data for SY 2017–18 and SY 2021–22 on students with disabilities and English learners. The CRDC data are older than CCD and EDFacts data. For our purposes, they are the best source of these school-level variables that are not present in EDFacts or CCD.
· To describe school-level poverty, we used two different measures. First, we used CCD data to analyze the percentage of students eligible for free or reduced-priced lunch (FRPL). FRPL identifies students with household incomes up to 130 percent of the federal poverty level (students eligible for free meals) and students with household incomes from 131 to 185 percent (students eligible for reduced-price meals). For years, policymakers and researchers have used FRPL as a proxy for the share of students from low-income households at a school. However, changes in how states provide FRPL to schools have made it difficult to consistently measure student poverty within and across states. To mitigate this challenge, we also estimated student poverty using the MEPS dataset.
MEPS estimates the percentage of students in a school with household incomes up to 100 percent of the federal poverty level. To do so, it incorporates data from three other datasets: (1) school-level data from the CCD, (2) National Center for Education Statistics (NCES) Education Demographic and Geographic Estimates, and (3) district-level data from the U.S. Census Bureau’s Small Area Income and Poverty Estimates.
In addition to generating descriptive statistics with data from these four datasets, we ran logistic regression models to determine which school characteristics are associated with a school being identified for and exiting support and improvement.[5] For more details on our regression methodologies, see appendix I.
To identify strategies selected schools used to exit CSI, we interviewed state-level education officials from Georgia, Ohio, and Virginia. We selected these states for variation in their approaches to school improvement, as well as in the number of students, districts, and schools overall and the number of schools identified for support and improvement. Within these states, we interviewed officials from a total of eight districts and 14 schools within those districts. We selected districts to provide a mix of current and exited schools identified for CSI in urban, rural, and suburban locations. Within districts, we selected schools that varied by grade levels (elementary, middle, and high), school type (traditional, charter, and alternative), and student characteristics (e.g., percentage of students with disabilities).[6] We interviewed educators from a total of 25 organizations (three state educational agencies, eight school districts, and 14 schools) both about the strategies and challenges that help schools exit CSI status. We analyzed responses from these interviews to identify key school improvement strategies and challenges. In this report, the strategies or topics described as “commonly” identified were noted by educators in 13 or more of the 25 organizations we interviewed. In addition, we held five discussion groups with a total of 19 teachers at five of the selected schools. Information from interviews with state, district, and school officials and teachers is nongeneralizable and not representative of all CSI schools.
We conducted this performance audit from October 2024 to March 2026 in accordance with generally accepted government auditing standards. Those standards require that we plan and perform the audit to obtain sufficient, appropriate evidence to provide a reasonable basis for our findings and conclusions based on our audit objectives. We believe that the evidence obtained provides a reasonable basis for our findings and conclusions based on our audit objectives.
Background
Requirements for Identifying Schools for Support and Improvement and Associated Exit Criteria
Under ESEA, states must identify schools in three categories of support and improvement. For two of the categories, states must establish criteria that schools must meet to exit school improvement status (see table 1).
Table 1: School Support and Improvement Identification Requirements and Exit Criteria in the Elementary and Secondary Education Act of 1965, as Amended (ESEA)
|
|
Comprehensive support and improvement (CSI) |
Additional targeted support and improvement (ATSI) |
Targeted support and improvement (TSI) |
|
Criteria for identification |
Not less than the lowest-performing 5 percent of all Title I, Part A, of the ESEA (Title I) schools in the state. All public high schools in the state failing to graduate one third or more of their students. Title I schools previously identified for ATSI that have not improved within a certain number of years as determined by the state. |
All public schools with one or more student subgroups—economically disadvantaged students, students from major racial and ethnic groups, children with disabilities, and English learners—performing at or below the lowest-performing Title I schools identified for CSI. |
All public schools with one or more student subgroups—economically disadvantaged students, students from major racial and ethnic groups, children with disabilities, and English learners—that meet the state’s definition of “consistently underperforming.” |
|
Criteria for exiting |
To ensure continued progress to improve student academic achievement and school success in the state, states must establish exit criteria for CSI schools. A CSI school exits when it meets its state’s exit criteria. If a CSI school does not meet the exit criteria within a state-determined number of years (not to exceed four), more rigorous state-determined action (e.g., additional or more intensive interventions) is required in that school. |
To ensure continued progress to improve student academic achievement and school success in the state, states must establish exit criteria for ATSI schools. An ATSI school exits when it meets its state’s exit criteria. If a Title I ATSI school does not meet the exit criteria within a state-determined number of years, the state shall identify that school as a CSI school. |
ESEA does not require states to establish exit criteria for TSI schools. |
Source: 20 U.S.C. § 6311. | GAO‑26‑107849
States identify schools for targeted support and improvement (TSI) or additional targeted support and improvement (ATSI) based on the performance of any of four student subgroups identified in ESEA: economically disadvantaged students, students from major racial and ethnic groups, children with disabilities, and English learners. As a result, a school may be identified in multiple school improvement categories. For example, a school may be identified for CSI overall, ATSI based on the performance of children with disabilities, and TSI based on the performance of economically disadvantaged students. As we previously reported, states determine the type and amount of support provided for each school improvement category.[7]
Impact of COVID-19 on States’ School Improvement Activities
Due to the COVID-19 pandemic, Education allowed states to apply for waivers from accountability and school identification requirements for CSI, ATSI, and TSI schools for SY 2019–20 and SY 2020–21.[8] States with waivers also had the discretion to not count SY 2019–20 and/or SY 2020–21 toward the state-determined number of years required to exit support and improvement.[9] SY 2022–23 was the first year all states were required to identify schools after receiving pandemic waivers.[10]
The Number of CSI Schools Increased Between School Years 2019–20 and 2022–23, and Certain Characteristics Raised the Likelihood of Exiting CSI
The Number of CSI Schools Grew from School Year 2019–20 to 2022–23, and More Schools Were Identified for Low Performance for Multiple Reasons
The number of schools identified for CSI increased between SY 2019–20 and SY 2022–23. In SY 2019–20, over 5,700 schools (or 6.5 percent of all public schools) were identified for CSI.[11] In SY 2022–23, over 6,900 schools (or 7.3 percent of all public schools) were identified for CSI. The majority of this increase was due to ATSI schools that did not exit that
|
Additional Targeted Support and Improvement (ATSI) Schools: An Early Warning in School Improvement
Title I schools that do not exit ATSI status within the state-determined time frame must be identified as a comprehensive support and improvement (CSI) school. States have the discretion to also apply this requirement to non-Title I schools. While the exit timeframes for CSI schools must not exceed 4 years, states have discretion to determine the exit time frames for ATSI schools. For example, Wisconsin gives ATSI schools 6 years to exit while Minnesota gives ATSI schools 3 years to exit. These state-level differences impacted the number of ATSI schools that became CSI schools in school year (SY) 2022–23. By SY 2022–23, none of Wisconsin’s 88 CSI schools were identified because the state’s deadline to exit ATSI status had not passed. In contrast, 47 of Minnesota’s 234 CSI schools were identified because they had not exited ATSI status by the state-determined deadline. Source: 20 U.S.C. § 6311, and GAO review of state accountability plans. Fokasu Art//stock.adobe.com. | GAO‑26‑107849 |

status becoming CSI schools.[12] Education’s data show that in SY 2022–23, 17 states identified 1,061 schools that did not exit ATSI by state-determined deadlines as CSI schools. This category of CSI schools was new in SY 2022–23.
Compared to SY 2019–20, more CSI schools had multiple reasons for being identified in SY 2022–23 (see fig. 1). Overall, 7.2 percent of CSI schools in SY 2022–23 were identified for more than one reason, a 41 percent increase from SY 2019–20. For example, in SY 2022–23, 333 CSI schools were identified for both low performance and a low graduation rate (compared to less than 300 CSI schools in SY 2019–20). In addition, in SY 2022–23, 165 CSI schools were identified for not exiting ATSI status within the number of years determined by their state and also for low performance (see fig. 1).
Figure 1: Reasons Schools Were Identified for Comprehensive Support and Improvement (CSI), School Years (SY) 2019–20 and 2022–23
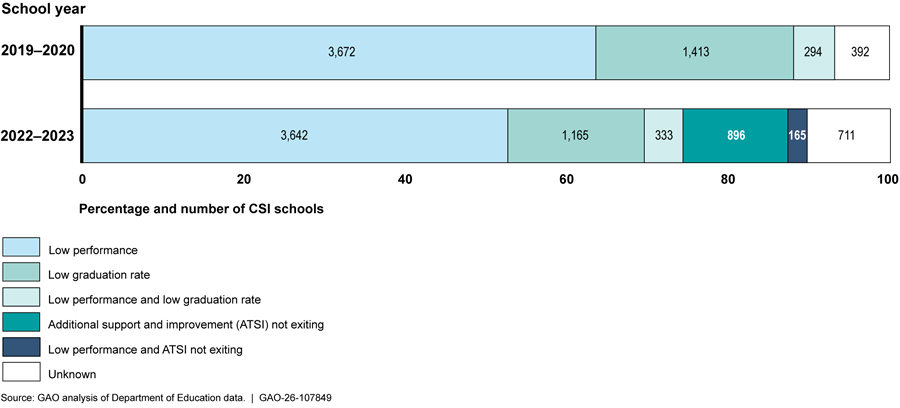
Note: The “ATSI not exiting” category was not a reason for CSI identification in SY 2019–20. The unknown category includes schools with missing data or schools for which the reason for identification is likely an error, such as schools identified for a low graduation rate that did not serve grade 12. See appendix I for more information about our data reliability process.
CSI schools in SY 2022–23 were also more academically challenged and economically disadvantaged than non-CSI schools and CSI schools identified before the COVID-19 pandemic. While all school types (CSI and non-CSI) experienced declines in average proficiency rates after the pandemic, the relative declines for CSI schools were much greater than for non-CSI schools. Specifically, average proficiency rates for CSI schools declined by 23 percent on math assessments and 11 percent on reading/language arts assessments between SY 2019–20 and SY 2022–23. By comparison, non-CSI schools saw smaller declines in math and reading/language arts proficiency—13 percent and 7 percent, respectively. CSI schools in SY 2022–23 also had more students eligible for FRPL and more students experiencing deep poverty (as measured by MEPS) than CSI schools in SY 2019–20. Consistent with findings in our prior report, CSI schools in SY 2022–23 serve higher proportions of economically disadvantaged students than non-CSI schools, and this was consistent across the two measures of student poverty.[13]
Factors Associated with CSI Identification in SY 2022–23
Using a logistic regression analysis, we found that a number of characteristics influenced a school’s odds of being identified for CSI, controlling for other factors. For example, schools with a higher proportion of students living in poverty had greater odds of being identified for CSI. We estimated that a 5 percent increase in the percentage of students living at or below the poverty level increased a school’s odds of being identified by 42 percent (see fig. 2).[14]
Figure 2: School Characteristics Associated with Comprehensive Support and Improvement (CSI) Identification, Holding Other Characteristics Constant
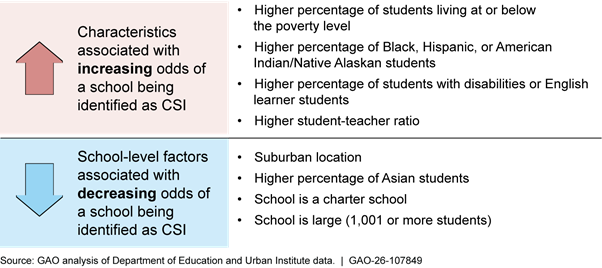
Note: Characteristics listed were statistically significant at the 95 percent confidence level. For more information, including all variables contained in the regression analysis, see appendix I.
School location, size, and type. Several school characteristics influenced a school’s odds of being identified for CSI, according to our regression analysis. For example, the odds of a suburban school being identified for CSI were 24 percent lower than the odds of an urban school, controlling for all other variables in the model. In addition, the odds of a large school being identified for CSI were 46 percent lower than the odds of a small school. An increase in a school’s student-to-teacher ratio by five (five additional students per teacher) was associated with a 2 percent increase in the odds of a school being identified for CSI.
Although charter schools were overrepresented as a proportion of CSI schools in SY 2022–23,[15] when we controlled for other student and school characteristics, we found that a charter school’s odds of being identified for CSI were 28 percent lower than that of a non-charter school. A possible explanation for this overrepresentation is that many of the characteristics associated with CSI schools are also associated with charter schools. For example, charter schools enroll more students in poverty than non-charter schools. Charter schools also enroll higher proportions of Black and Hispanic students and lower proportions of White and Asian students, on average. Charter schools are more often high schools or alternative schools and located in urban settings.
Due to the low prevalence of alternative schools and their distinct purpose and characteristics compared to public schools in general, we excluded alternative schools from the final regression model. Similarly, due to the low prevalence of virtual schools and their uneven distribution across states, we excluded virtual schools from the regression model. However, additional data analyses showed that these schools are also overrepresented in CSI schools. Alternative schools were the school type most likely to be identified for CSI in SY 2022–23. Over 17 percent of CSI schools in SY 2022–23 were alternative schools although these schools only represent 4 percent of public schools overall.[16] Virtual schools were also overrepresented among CSI schools; almost 4 percent of CSI schools were virtual schools in SY 2022–23, more than double the national proportion of virtual schools (1.5 percent of schools in the U.S.).
Almost Half of CSI Schools That States Identified in SY 2019–20 Had Exited by SY 2022–23, and Some Characteristics Increased a School’s Odds of Exiting
Forty-six percent (2,535) of 5,464 schools identified nationwide for CSI in SY 2019–20 had exited CSI by SY 2022–23.[17] The percentage of schools exiting ranged from 93 percent in Vermont to 1 percent in Ohio (see fig. 3).
Figure 3: Percentage of Schools Identified for Comprehensive Support and Improvement (CSI) in School Year 2019–20 Exiting CSI by School Year 2022–23, by State
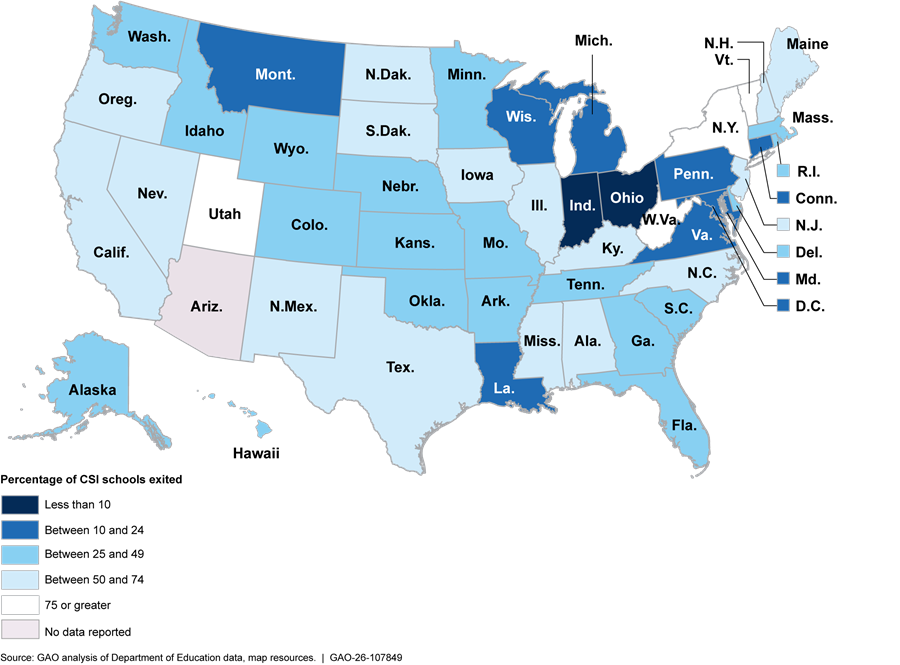
Note: Arizona did not report any schools as identified for CSI in SY 2019–20, so we had insufficient data to calculate the percentage of Arizona schools exiting CSI by SY 2022–23.
Cross-state differences in the level of improvement required to exit CSI likely contribute significantly to this variation. For instance, Vermont permits schools to exit CSI once they no longer meet identification criteria and demonstrate significant improvement according to state-determined thresholds. In Ohio, schools must meet exit criteria (perform better than the bottom 5 percent of Title I schools or achieve a 4-year graduation rate above 67 percent) for 2 consecutive years.[18] In addition, because COVID-19 waivers changed exit time frames in some states, schools in those states may not have been eligible to exit in SY 2022–23.
Characteristics Associated with Schools’ Odds of Exiting CSI
Our regression analysis of the ability of CSI schools in SY 2019–20 to exit CSI by SY 2022–23 suggested that a school’s location, size, and student characteristics influenced its odds of exiting CSI, controlling for all other variables in the model.[19] High student poverty rates, in particular, appeared to negatively affect a school’s improvement odds. Specifically, we estimated that a 5 percent increase in the percentage of students living at or below the poverty level decreased a school’s odds of exiting CSI by 12 percent (see fig. 4).
Additionally, small schools were less likely to exit CSI than large- and medium-sized schools.[20] A possible explanation for this is that small schools may experience an outsized effect on overall performance if even a small number of students fail state tests. In addition, it can be difficult for small schools to hire and retain staff, including those providing interventions and services to students who struggle academically. For example, officials from one small, rural school described challenges with hiring specialists and coaches needed to improve achievement. These observations are consistent with our work on teacher shortages, which found that shortages were more prevalent in rural areas.[21]
Figure 4: School Characteristics Associated with Comprehensive Support and Improvement (CSI) Exit, Holding Other Characteristics Constant
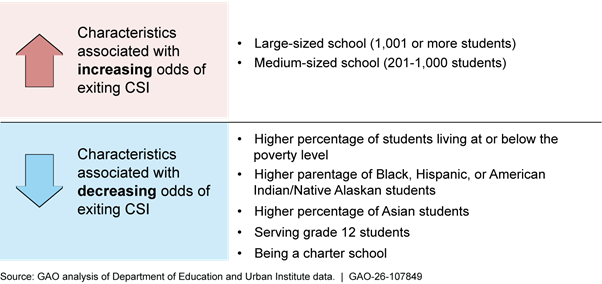
Note: Characteristics listed were statistically significant at least at the 95th percentile for each type of factor. For more information, including all variables contained in the regression analysis, see appendix I.
Reasons for CSI identification. The reason a school was identified for CSI appeared to affect its ability to improve enough to exit. Over half (51 percent) of CSI schools identified for low performance in SY 2019–20 exited by SY 2022–23. More than a third (35 percent) of CSI schools identified for a low graduation rate were able to raise their graduation rate enough to exit during this time period. However, less than a quarter (18 percent) of schools identified for both low performance and a low graduation rate managed to improve sufficiently to exit CSI by SY 2022–23.
School type. We found that charter schools had lower odds of reaching the improvement thresholds required to exit CSI compared to non-charter schools, controlling for all other variables in the model. A possible explanation for this pattern may lie in the reasons why charter schools were first identified for CSI. We found that in SY 2019–20, charter schools were less likely to have been identified for CSI due to low performance alone (43 percent) than non-charter schools (68 percent), and more likely to have been identified due to a low graduation rate (43 percent and 21 percent, respectively). Charter schools were almost three times as likely to be identified for CSI due to both low performance and a low graduation rate (11 percent) than non-charter schools (4 percent).
|
Schools Identified for More Rigorous State Action
Comprehensive support and improvement (CSI) schools that do not exit within a state-determined deadline (not to exceed 4 years) must face more rigorous state action. The state’s action must be more rigorous than the interventions previously implemented by the school and may include making changes to school operations. Examples of state actions include making significant staffing changes at the school, replacing leadership, establishing external management partnerships, converting to a charter school, closing the school, and allowing students to attend other schools. Source: GAO summary of Education guidance. WavebreakMediaMicro/stock.adobe.com. | GAO‑26‑107849 |

Other nontraditional schools were also less likely to experience enough improvement to qualify for exit from CSI. Less than a third of alternative schools (31 percent) identified in SY 2019–20 had exited by SY 2022–23. About a third of virtual schools (34 percent) had exited.
In SY 2022–23, 21 states collectively identified 747 CSI schools from SY 2019–20 that had not exited CSI by state-determined deadlines and became subject to more rigorous state action.[22] On average, these schools had lower proficiency rates on annual state assessments than other CSI schools in SY 2022–23. Specifically, these schools had average proficiency rates of 20.7 percent on reading/language arts assessments and 10.2 percent on math assessments compared to 24.0 percent and 16.1 percent, respectively, for all other CSI schools in the same 21 states.
We also found that a larger percentage of nontraditional schools identified for CSI in SY 2022–23 had not exited CSI by state-determined deadlines in the 21 states. Specifically, the percentage of alternative CSI schools subject to more rigorous action was more than double that of traditional schools (49 percent compared to 19 percent). Similarly, the percentage of virtual schools subject to more rigorous action was almost double the percentage of traditional schools (36 percent compared to 19 percent).
Selected Educators Commonly Identified Key Strategies and Persistent Challenges to Exiting CSI
Educators Commonly Identified Six Strategies, Including Addressing School Culture and Expectations and Using Data to Monitor Progress, as Key to Exiting CSI
While many schools face an uphill battle when attempting to exit CSI, educators we interviewed from three state educational agencies, eight school districts, and 14 schools commonly identified six strategies as key to a school’s ability to exit (see fig. 5).[23] These strategies are (1) communicate mission and achieve buy-in, (2) change school culture and expectations, (3) foster staff collaboration, (4) use data to monitor progress and adjust instruction, (5) target professional development, and (6) sustain improvements.
Figure 5: Key Strategies Educators Identified to Help Comprehensive Support and Improvement Schools Exit
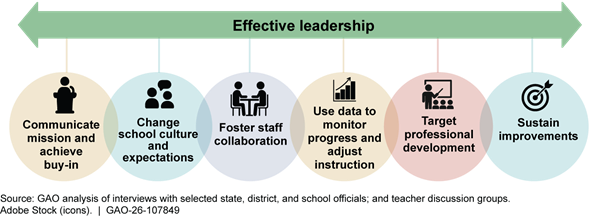
Many of these strategies are interrelated. For example, schools can use data (strategy 4) to measure changes in school culture and expectations regarding student behavior, attendance, and academic performance (strategy 2) and monitor sustained improvements (strategy 6). Targeted professional development (strategy 5) can help change school culture and expectations (strategy 2) and foster staff collaboration (strategy 3). Moreover, effective leadership at multiple levels was commonly noted as critical to successfully implementing these strategies. This is consistent with our past reporting that organizational transformations should be led by a dedicated team of high-performing leaders.[24]
Strategy #1: Communicate mission and achieve buy-in. Educators we interviewed emphasized the importance of developing and communicating a mission about school improvement to the school community and working to achieve buy-in of school staff on improvement reforms.
|
School districts are required to conduct a comprehensive needs assessment for schools identified for comprehensive support and improvement. The purpose of a needs assessment is to help districts and schools (1) identify and prioritize performance gaps (or “needs”), (2) isolate root causes of prioritized needs, and (3) select appropriate strategies to address those root causes, among other things. Source: GAO summary of Education guidance. |

Communicate mission. Educators we interviewed commonly described developing and communicating a clear mission or motto to orient the school community around improvement goals. For example, a middle school principal began school improvement efforts by developing a motto that focused on core values of trust, respect, and responsibility. This motto was intended to unify the staff behind a mission and a vision of creating high school-ready students. Another district’s official said CSI schools needed strong and focused leadership that can communicate to staff and families why the school is in the CSI status and engage families as partners in the improvement process.
Educators we interviewed also commonly noted that the process of completing a needs assessment helped schools identify critical actions. An intermediate school principal said that the needs assessment is like a lighthouse that provides direction to help the school community achieve its goals. This observation is consistent with our past work on school improvement, in which we noted that when done well, a needs assessment can help a district and school understand how pieces of a complex educational system interact, uncover a school’s strengths and challenges, and develop strategies to address challenges.[25]
Achieve buy-in. Educators we interviewed commonly described the importance of getting teacher and staff buy-in on school improvement goals. For example, the principal of a CSI elementary school said achieving this buy-in was deemed so critical that at least 70 percent of instructional staff were required to approve the school’s academic improvement plan. If a school could not achieve this goal, the district would take over the creation of the plan, and the school would lose some autonomy. The principal described challenges meeting this requirement because some staff were reluctant to buy into the school’s mission and vision. Educators even noted that in extreme cases, they needed to replace staff members who would not buy into the school’s mission despite having received repeated coaching and encouragement (see fig. 6).
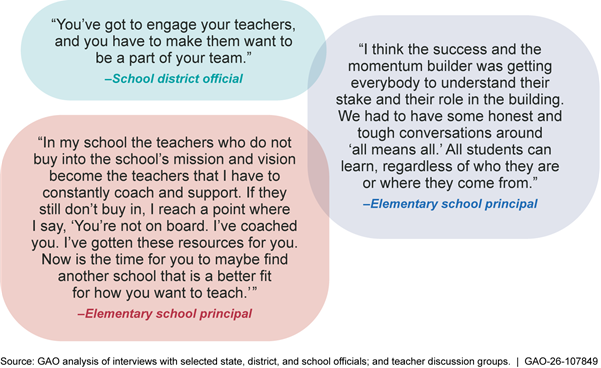
Note: The selected comments reflect themes discussed by district and school officials in GAO interviews and are not generalizable.
Strategy #2: Change school culture and expectations. Educators we interviewed described efforts to change school culture and raise the academic and behavioral expectations of staff and students to help schools exit CSI.
Change school culture. Educators we interviewed commonly described their efforts to change or raise expectations in schools. For example, a high school principal described making progress in shifting teacher mindsets from defeatist and lacking ownership for student success to a schoolwide culture of collective responsibility for helping students succeed. Similarly, the principal of a middle school reported that shifting the school culture to one where teachers communicated with each other using a nonjudgmental, student-centered approach helped the school achieve a 96 percent staff retention rate (see fig. 7).
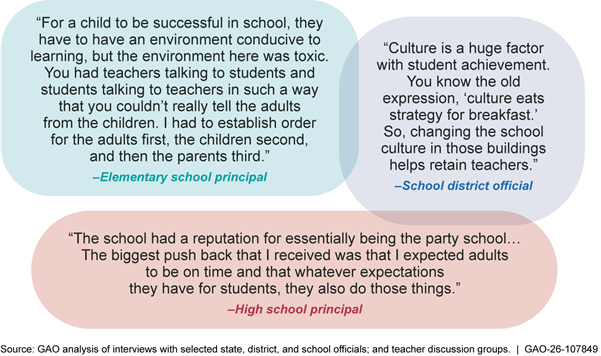
Note: The selected comments reflect themes discussed by district and school officials in GAO interviews and are not generalizable.
We also heard examples from educators in three schools about teacher or staff absenteeism that had initially hindered school improvement efforts. For example, a middle school principal said he observed some of the newer teachers using sick leave days for errands during the school day, and another principal in the same district noted that some of the teachers in the CSI school were chronically absent, which hindered school improvement efforts. Both principals worked to communicate to teachers the importance of their continuous presence for students.
Change expectations for providing grade-level instruction. Educators we interviewed commonly described raising the academic expectations for teaching grade-level content to all students. For example, teachers in an elementary school used to slow the pace of teaching as soon as some students showed a lack of understanding, according to district officials. State or regional educational service agency specialists provided professional development to help teachers support students who needed extra help while ensuring they taught the grade-level learning standards. Officials from a different district said changing the culture to one where teachers are focused on providing grade-level instruction despite factors beyond their control—including students living in poverty and chronic absenteeism—has been transformational. A middle school principal received help from district staff to ensure teachers’ lesson plans used high-quality instructional materials and aligned with grade-level learning standards. Each week, district and school leaders reviewed lesson plans and provided feedback, encouraging teachers to think strategically and intentionally about how to meet annual learning goals.
Change expectations for student behavior. In addition to changing academic expectations, educators we interviewed commonly described raising expectations for student behavior. For example, a new high school principal described actions to change the school culture and address safety concerns related to drugs and weapons on school grounds. At the same time, the principal provided incentives for students who met expectations for behavior, attendance, and grades by creating positive events such as pep rallies or food trucks. As a result of these efforts, the principal reported that the school had lowered its rate of discipline reports and increased student attendance from “below 80 percent to 92 percent” in the year since the principal implemented changes.
Strategy #3: Foster staff collaboration. Educators we interviewed identified fostering staff collaboration and building teams among teachers as an important strategy to help schools exit CSI.
Educators we interviewed commonly described fostering staff collaboration by building grade-level or content-area teams in which teachers worked together to plan lessons and discuss teaching strategies. For example, at one elementary school, the teachers were grouped into grade-level teams that met with instructional coaches for literacy, math, and science once a week to plan lessons and review student performance data. The principal of a different elementary school explained that collaboration helped teachers learn from one another. Educators also described teachers using peer observation to improve their instruction. For example, middle school teachers used their planning period to walk around the building and observe instruction in other classrooms. The principal said that when doing so, teachers learned techniques they wanted to adopt for their classroom (see fig. 8).
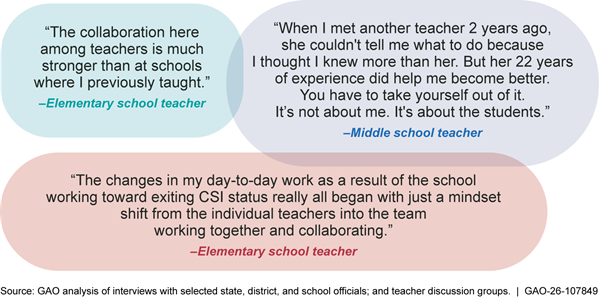
Note: The selected comments reflect themes discussed by teachers in GAO discussion groups and are not generalizable.
Strategy #4: Use data to monitor progress and adjust instruction. Educators we interviewed said they used data to assess student progress and adjust their teaching strategies. They described using both qualitative and quantitative data collected at state, district, and school levels.
Use student performance data to monitor progress and adjust instruction. Educators we interviewed commonly described efforts to consciously and consistently use student data to monitor progress. This effort generally involved schools collecting more interim data throughout the year to help teachers identify when they needed to reteach a lesson or provide additional support for individual students (see fig. 9). For example, educators we interviewed in a number of schools described using data coaches to help educators feel more comfortable interpreting student performance data and incorporating it into their teaching practice. In an intermediate school, the principal created “data boot camps” to help educators interpret and use data.
Figure 9: Illustration of How Teachers Use Student Performance Data to Monitor Progress and Adjust Instruction
Once school staff are comfortable interpreting data, they can use it to tailor instruction and interventions for students. For example, in one district, an educator said that all schools included a daily class period for students to receive either remediation or enrichment based on what the data show they need. If a student needs more support than can be provided through the standard remediation, the school provides “double dosing” in which the student attends a class to preview the material that will be taught to them at a later date. Students who need even more support are invited to attend Saturday school to address specific gaps in their learning. An elementary school teacher in a different district explained if data show that a small portion of students did not learn a lesson, the teacher reteaches the material in a small group while other students have enrichment. If the data show that a larger group of students did not progress as expected, the teacher re-examines the teaching strategy used and, if needed, seeks advice from an instructional coach or another teacher (see fig. 10).
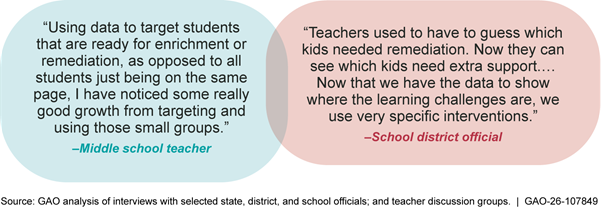
Note: The selected comments reflect themes discussed by district officials in GAO interviews and teachers in GAO discussion groups and are not generalizable.
Share data to motivate students. We heard instances of educators sharing performance data to motivate students. For example, a high school teacher said sharing data on students’ academic performance with them had been one of the most effective ways to motivate them to improve. The teacher credited the school testing coordinator and colleagues with encouraging more students to participate in state tests that assess grade-level learning standards (see fig. 11).
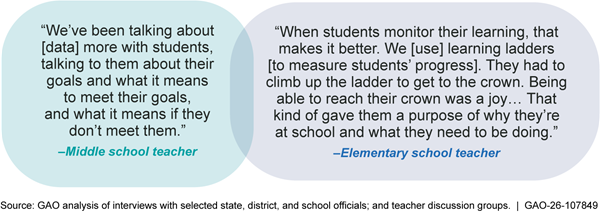
Note: The selected comments reflect themes discussed by teachers in GAO discussion groups and are not generalizable.
Strategy #5: Target professional development. Educators we interviewed identified targeting professional development to address specific needs of school staff as particularly important in helping schools exit CSI.
Observe instruction. Educators we interviewed commonly described building-level, district, or regional school leaders visiting classrooms to observe teaching in progress. This practice helps determine whether the class is on pace to meet grade-level learning standards and if teachers are using strategies such as small group instruction to address different learning needs, among other things. For example, in one district, officials observed instruction in elementary school literacy classes and found that some instruction was taking too long. A lesson that should have taken 3 minutes to teach was taking 20 minutes which, over time, meant that students would not receive instruction on all grade-level learning standards by the end of the year.
Some of these observations involved using checklists. For example, an elementary school principal reported that school leaders used a checklist to guide classroom observations and then provide feedback to teachers. Educators in a different elementary school said that they use a checklist to observe each teacher for 20 minutes every week. They use these observations to decide which teachers need individual coaching and what type of professional development the whole school needs.
Use instructional coaches. Educators we interviewed commonly described using instructional coaches to help teachers improve. For example, an elementary school principal said coaches checked in with teachers every day to ensure that their instruction addressed the grade-level learning standards and used district-approved teaching materials. A middle school principal in the same district said their coaches could model instruction for teachers who were having difficulty implementing lessons as planned. A middle school principal in a different district said coaches have helped teachers improve student proficiency scores and have increased student engagement.
Provide targeted training. Educators we interviewed commonly described providing professional development to help school staff reach improvement goals. For example, one district trained elementary school teachers on how to effectively use small group instruction to help a group of students who need extra support while keeping the rest of the class engaged in learning. In addition, this district also allowed schools to target training based on teachers’ needs. Rather than having all middle school teachers attend a district-led workshop on classroom management techniques, the principal said it was only required for a few selected teachers.
Strategy #6: Sustain improvements. Educators we interviewed commonly described various ways they planned to sustain the improvements their schools had made to either exit CSI or remain off the CSI list after they exit. For example, in one elementary school that had recently exited CSI, the school leaders said they would continue observing teaching and providing feedback to teachers even though this type of monitoring was no longer required. The school leader emphasized the importance of teachers continuing the routines they had adopted, such as collaborative lesson planning. A teacher at this school explained that having these routines made it easier for new teachers to adapt to the school’s culture and expectations for student achievement.
In another district, a middle school leader said that to stay off of the CSI list, they remained focused on teaching the grade-level learning standards and adjusted a few key practices compared to prior years. For example, they began offering tutoring to students 3 months earlier in the year than they had offered it the previous year. In one state, leaders of CSI schools created a plan for both exiting CSI and sustaining improvements in the future. When a school in this state exits CSI after 2 years, the school is required to continue implementing the strategies that helped it exit CSI for a third year.
Educators Identified Persistent Challenges Schools Faced in Exiting CSI and Efforts to Address These Challenges
Educators we interviewed described persistent challenges that schools faced in exiting CSI related to student attendance as well as teacher shortages and turnover.
Chronically absent and transient students. Educators we interviewed commonly noted challenges related to student chronic absenteeism. One district official said as many as one-third of the district’s students were chronically absent. Two high school teachers explained that when students are habitually absent or late, it affects teachers’ ability to plan lessons and assess student progress.
Schools are addressing chronic absenteeism in a variety of ways, including communicating the importance of school attendance to students and parents and providing incentives. For example, a district official said they routinely send messages to parents about the importance of attending school. They also said the district funded quarterly attendance incentives for schools. For example, a middle school in this district took students who had only one unexcused absence for the semester to a children’s entertainment center and took students who had fewer than five unexcused absences ice skating. Once students started seeing the public recognition they received for good attendance, the school’s attendance rate increased. An official from a different district reported offering a sports program at elementary schools, which district leaders said had a positive impact on attendance. At an elementary school where pre-kindergarten through 1stt grade students have the highest number of absences, the principal said they addressed the problem by developing a relationship with those children’s families to identify the reasons the children were not coming to school consistently.
Educators we interviewed also described having a high percentage of transient students as an obstacle to exiting CSI. One elementary school principal said that it was common for up to half of the student population to transfer in or out of the school before the end of the year. The principal explained that having new students enroll throughout the school year took time away from teaching lessons because teachers had to continually dedicate time to reestablishing classroom routines and expectations. The superintendent of another district said that CSI schools, in particular, had a high rate of students changing schools within the district, often because students’ families were seeking more affordable or stable housing.
Teacher shortages and turnover. Educators we interviewed commonly described teacher shortages or recruiting and retaining qualified teachers as a challenge. For example, some of the educators we interviewed said that it was difficult to recruit staff with a teaching certification to work in CSI schools. Educators noted that they addressed teacher shortages by hiring staff who were in the process of obtaining certification.[26] One school official said they have observed an overall decrease in the candidate pool for teachers in the past 5 years.
We heard examples from educators on difficulty retaining teachers, in part because the work was difficult and not a good fit for everyone. One superintendent we spoke with acknowledged that the challenge of working in CSI schools could lead to teacher burn-out. His district established a new program to hire and train teachers to work in CSI schools for a time-limited period of 5 years. Principals from several schools we interviewed reported challenges getting some teachers to adapt to new expectations they implemented to help the school exit CSI, which resulted in teachers opting to work at a different school the next year. An elementary school principal said that having a high teacher turnover rate felt like the school was starting over every year.
Educators we interviewed described efforts to increase teacher retention. For example, a middle school principal said that the positive changes in the school had led to an increase in teacher retention from 51 percent in 2023 to an estimated 90 percent in 2025. District and school leaders credited a variety of factors—including positive changes in school culture, teacher recognition initiatives, professional development, and mentoring for new teachers—as motivating teachers to stay.
Agency Comments
We provided a draft of this report to the Department of Education for review and comment. Education provided a technical comment, which we incorporated.
We are sending copies of this report to the appropriate congressional committees, the Secretary of Education, and other interested parties. In addition, the report is available at no charge on the GAO website at https://www.gao.gov.
If you or your staff have any questions about this report, please contact me at nowickij@gao.gov. Contact points for our Offices of Congressional Relations and Media Relations may be found on the last page of this report. GAO staff who made key contributions to this report are listed in appendix II.

Jacqueline M. Nowicki, Director
Education, Workforce, and Income Security
Data Analysis Objectives and Sources
To determine public schools identified for comprehensive support and improvement (CSI), additional targeted support and improvement (ATSI), and targeted support and improvement (TSI) for school years (SY) 2019–20 and 2022–23, we used data from the U.S. Department of Education’s EDFacts. For the purpose of our analysis, we refer to “CSI exited schools” as schools that were identified for CSI in SY 2019–20 but not identified for CSI in SY 2022–23. We also used EDFacts to identify student proficiency rates on standardized assessments. EDFacts data include the percentage of students scoring “proficient” out of all students who took the state assessments, separately for math and for reading/language arts.
When analyzing the reasons for CSI identification, we identified some data anomalies, such as CSI schools identified due to failure to exit ATSI before schools were eligible for such designation and elementary schools designated for low high school graduation rates. When asked about these anomalies, Education informed us that they were possible data errors. Using the data notes from Education, we recoded the reasons for identification variable as follows:
· When the data notes indicated a correction to a particular school’s reason for identification as identified by its National Center for Education Statistics (NCES) school identifier (ID), we recoded the data to align with that correction.
· When no correction was available, we recoded the following data as “unknown”: (1) schools that were identified for CSI in SY 2019–20 for “ATSI school failing to exit such status” because this determination did not yet apply in SY 2019–20, and (2) schools that were identified for CSI in SY 2019–20 for a “low graduation rate” yet did not serve grade 12.
To analyze characteristics associated with schools identified for CSI, we merged the EDFacts data with other federal data sources: Education’s Common Core of Data (CCD) and Civil Rights Data Collection (CRDC). We supplemented the federal data with the Urban Institute’s Model Estimates of Poverty in Schools (MEPS).
The NCES administers the CCD survey annually to collect a range of data from state educational agencies on all public schools and school districts in the nation. These data include information on school characteristics such as school type (e.g., traditional public school, charter school), location (e.g., state and urbanicity), student demographics, and enrollment trends. We used CCD data to examine characteristics of CSI schools and schools not identified for CSI, including schools having exited CSI.
To determine what is known about the enrollment of students with disabilities and English learners, we analyzed CRDC data for SY 2017–2018 and SY 2021–2022, the most recent available at the time of our analysis. The CRDC is a biennial survey that Education requires all public schools and districts in the U.S. to complete. The survey collects data on public schools (early education through grade 12), including disciplinary actions, enrollment, school and student characteristics, and types of school staff.
MEPS, which is created and managed by the Urban Institute, is an alternative model-based estimate of the rate of poverty among students at the school level. The MEPS has computed annual estimates starting with 2013, based on school- and district-level data from the CCD, NCES, and the U.S. Census Bureau’s Small Area Income and Poverty Estimates (SAIPE). Estimates for most public schools in the 50 states and District of Columbia are provided. The MEPS provides school-level poverty data unlike the SAIPE. MEPS also uses a 100 percent federal poverty rate-based threshold. This poverty measure is different from the often-used share of students eligible for free or reduced-price lunch (FRPL) participation.
The MEPS estimates are based on a linear mixed-effects model. It uses a series of district-level characteristics and school-level data as predictors and state-level fixed effects for states to account for the within-state associations in poverty across districts and schools. MEPS aims to capture an estimate with a consistent definition across time and geographic states.
We determined these data were sufficiently reliable for the purposes of our reporting objectives by reviewing relevant documentation; interviewing knowledgeable Education and Urban Institute officials; and testing for missing data, outliers, and other potential errors.
Scope of Data Analysis
We restricted our analysis to public K-12 schools within all 50 states and the District of Columbia, excluding schools in U.S. territories as well as Bureau of Indian Education schools. We excluded schools that served only preschool, ungraded, or adult education students and schools that reported zero enrollments. We also excluded schools that were not operational or that were newly opened and not yet eligible for a CSI determination.
Because data on identified and exited schools were not available for SY 2020–21 and SY 2021–22, when analyzing characteristics of schools that exited CSI status, we included only schools that were operational in SY 2019–20 and SY 2022–23 under the same NCES ID. As such, our analysis excluded schools that were closed or assigned a different NCES ID between SY 2019–20 and SY 2022–23 (about 5 percent of CSI schools in SY 2019–20), such as schools that were assigned to a new school district.
Variables Used in the Analyses
Table 2 shows the variables included in our analyses.
|
Variable |
Description |
Source |
|
Comprehensive support and improvement (CSI) status |
Whether a school was identified for CSI |
EDFacts |
|
CSI reason for identification |
The reasons a school was identified for CSI (e.g., low graduation rate, low proficiency, failure to exit additional targeted support and improvement, or some combination) |
Derived from EDFacts |
|
Math and reading/language arts proficiency |
The percentage of students scoring proficient on state standardized assessments in math and reading/language arts |
EDFacts |
|
Locale |
Categorical variable for school locale: · Urban · Suburban (including town) · Rural |
Derived from Common Core of Data (CCD) |
|
School size |
Categorical variable for student enrollments: · Small (1–200 students) · Medium (201–1,000 students) · Large (greater than 1,000 students) |
Derived from CCD |
|
School level |
Categorical variable for school level: · Elementary school · Middle school · High school (including secondary) · Other · Not reported |
Derived from CCD |
|
School type |
Categorical variable for school type: · Alternative · Career and technical · Special education · Regular school |
CCD |
|
Charter |
Whether school is a charter school |
CCD |
|
Virtual school |
Whether school provides virtual instruction: · Virtual (school is primarily or exclusively virtual) · Not virtual (all other schools) |
Derived from CCD |
|
Serves grade 12 |
Whether school serves grade 12 |
CCD |
|
Student-to-teacher ratio |
The number of students divided by the number of teachers |
Derived from CCD |
|
Race/ethnicity |
The share of students who are: · Black/African American · Hispanic · Asian/Pacific Islander · White · American Indian/Alaska Native |
CCD |
|
Free or reduced-price lunch |
The share of students eligible for free or reduced-price lunch |
CCD |
|
Students in poverty |
The estimated share of students at or below the poverty level |
Model Estimates of Poverty in Schools |
|
English learners |
The share of students that are classified as English learners |
Civil Rights Data Collection (CRDC) |
|
Students with disabilities |
The combined share of students with disabilities served under the Individuals with Disabilities Education Act, Section 504 of the Rehabilitation Act of 1973, or both |
Derived from CRDC |
Source: Department of Education and Urban Institute data. | GAO‑26‑107849
Data Analyses Conducted
First, we conducted a descriptive analysis of the number of CSI schools as well as their reasons for identification. We also analyzed student demographics and proficiency rates for CSI schools compared to other schools. To do this, we supplemented the EDFacts data with data on schools’ racial/ethnic demographics (percentage of students as Black/African American, Hispanic, Asian/Pacific Islander, White, American Indian/Alaska Native, or other race) as reported in the SY 2019–20 and SY 2022–23 CCD. To identify students in poverty, we used FRPL as well as MEPS. We also used data on school type and urbanicity from the CCD. Last, we used the percentage of students with disabilities and English learners from the SY 2017–18 and SY 2021–22 CRDC.
Next, we explored the data diagnostics to examine the merged dataset for appropriateness as inputs for the planned regression model. We reviewed the data to determine completeness and appropriateness to include in subsequent modeling. We performed basic descriptives such as measures of central tendency for numeric variables, QQ-plots, and t-tests. This analysis showed the data were sufficient for use in a nonparametric regression model rather than parametric modeling.
Finally, using two separate logistic regression models, we analyzed associations between schools’ characteristics and schools’ odds of (1) being identified for CSI in SY 2022–23 and (2) exiting CSI in SY 2022–23 after being identified for CSI in SY 2019–20. The analysis dataset for both models included additional scoping decisions. Specifically, we excluded schools with zero teachers or students, schools on tribal lands, and alternative schools. For the second model, only schools identified for CSI in SY 2019–20 were in-scope. We removed alternative schools for both analyses due to the concern of substantial differences in the associations between the characteristics of interest and odds of CSI identification/exiting. This concern was a result of alternative schools serving different subgroups of the student population by design. As a result, we considered them as a separate analysis population compared to general K-12 schools. Therefore, our regression analyses focus on nonalternative schools for greater clarity on understanding the associations which were analyzed.
Logistic Regression Models
Regression Model 1: CSI Identification
The first logistic regression model included CSI status in SY 2022–23 as the outcome variable (CSI or not CSI) with the following covariates:
· state the school is located in,
· share of students of a specific racial or ethnic group,
· if the school is a charter,
· if the school serves grade 12 students,
· if the school is in a rural or suburban location (urban is reference group),
· share of students at the school who are from a household under the poverty level (poverty level defined by the Modified MEPS),
· share of students who are English learners,
· share of students who have a disability (Individuals with Disabilities Education Act, Section 504 of the Rehabilitation Act of 1973 or both),
· school size (small is reference group, and
· student-to-teacher ratio.
These variables are for SY 2022–23, except for the racial or ethnic group share variables, which are for SY 2021–22 (the CRDC was not reported in SY 2022–23). Any schools with a missing value for any covariates were removed from the analysis dataset. Numeric variables used in the modeling were converted into units representing changes of 5 to reflect meaningful changes in the variables (e.g., a change of 5 percent for share of students at a school who are from a household under the poverty level). Since state is used as a covariate, all states included in the data for the modeling must have at least one CSI and one non-CSI school for the model to converge (otherwise perfect separation would result). As a result, states with no CSI schools after removing observations with data reliability issues (e.g., missing data) were checked for and also removed from the analysis dataset.
Regression Model 2: CSI Exit
The second logistic regression model included exiting CSI status in SY 2022–23 as the outcome variable (exited CSI or remained CSI compared to SY 2019–20 identification) with the following covariates:
· state the school is located in,
· share of students of a specific racial or ethnic group,
· if the school is a charter,
· if the school serves grade 12 students,
· if the school is in a rural or suburban location (urban is reference group),
· share of students at the school who are from a household under the poverty level (poverty level defined by the Modified MEPS),
· school size (small is reference group), and
· student-to-teacher ratio.
These variables are for SY 2019–20.
Differences in the numeric covariates compared to SY 2022–23 were also included as covariates. The share of students who are English learners and share of students who have a disability were not included due to their high degree of missingness in schools identified for CSI in SY 2021–22. Any schools which had a missing value for any covariates were removed from the analysis dataset. Numeric variables (excluding the difference variables) used in the modeling were converted into units representing changes of 5 to reflect meaningful changes in these variables (e.g., a change of 5 percent for share of students at a school who are from a household under the poverty level). Since state is used as a covariate, all states included in the data for the modeling must have at least one exiting CSI and one non-exiting CSI school for the model to converge. As a result, states with no exiting CSI schools were checked for and also removed from the analysis dataset.
For both models, point estimates and 95 percent confidence intervals (CI) were tabulated for all model parameters of interest after being exponentiated to reflect odds ratios. Parameters with CIs which did not overlap with 1 or had a p-value < 0.05 were considered statistically significant. All parameters are interpreted as odds ratios after increasing the relevant covariate (e.g., the change in the odds after increasing the share of students at a school who are from a household under the poverty level by 5 percent) or comparing one group to the reference group (e.g., the change in odds comparing rural to urban schools). For the first model, these odds ratios reflect odds of being identified for CSI in SY 2022–23 (higher odds imply higher probability of being identified for CSI). For the second model, these odds ratios reflect odds of exiting CSI status in SY 2022–23 (higher odds imply higher probability of exiting). As a result, for both models, an odds ratio of 1 means no change in the odds and no association with being identified for or exiting CSI.
Logistic Models Results
Regression Model 1: CSI Identification
Based on the first modeling analyses, the following school characteristics were associated with higher odds of a school being identified for CSI in SY 2022–23, controlling for all other variables in the model:
· a larger student-to-teacher ratio,
· a larger share of students with a disability,
· a larger share of students who are English learners,
· a larger share of households in poverty, and
· a larger share of Black/African American, Hispanic, or American Indian/Alaska Native students.
The following characteristics were associated with lower odds of being identified for CSI in SY 2022–23 controlling for all other variables in the model:
· being a large-sized school (compared to small),
· being a charter school,
· being a suburban school (compared to urban), and
· a larger share of Asian/Pacific Islander students.
These associations were considered statistically significant based on the corresponding parameter’s CI not containing 1 or having a p-value < 0.05. The parameter estimates and 95 percent CIs from the model are provided in table 3. Estimates represent odds ratios for each variable in comparison to its reference level or odds ratios associated with a 5 percent change in share of students.
|
Covariate |
Estimate and 95 percent confidence Interval |
|
Student-to-teacher ratio (in units of 5:1) |
1.02 (1, 1.04) |
|
Large-sized school (compared to small-sized school) |
0.54 (0.35, 0.86) |
|
Medium-sized school (compared to small-sized school) |
0.67 (0.45, 1.03) |
|
Share of students with disability (5 percent change in share of students) |
1.26 (1.2, 1.32) |
|
Share of English learners (5 percent change in share of students) |
1.06 (1.03, 1.08) |
|
Modified poverty rate (5 percent change in share of students) |
1.42 (1.37, 1.48) |
|
Suburban school (compared to urban school) |
0.76 (0.66, 0.87) |
|
Rural school (compared to urban school) |
0.97 (0.82, 1.14) |
|
School offers grade 12 |
0.98 (0.83, 1.15) |
|
Charter school |
0.72 (0.59, 0.89) |
|
Share of Asian/Pacific Islander students (5 percent change in share of students) |
0.82 (0.77, 0.87) |
|
Share of other students (5 percent change in share of students) |
1.25 (1.13, 1.38) |
|
Share of American Indian/Alaska Native students (5 percent change in share of students) |
1.2 (1.09, 1.31) |
|
Share of Hispanic students (5 percent change in share of students) |
1.1 (1.07, 1.12) |
|
Share of Black/African American students (5 percent change in share of students) |
1.19 (1.17, 1.22) |
Source: GAO analysis of Department of Education and Urban Institute data. | GAO‑26‑107849
Note: Certain numeric variables used in the modeling are converted in units representing changes of 5 to reflect meaningful changes in these variables (e.g., a change of 5 percent for share of students at a school who are from a household under the poverty level).
Regression Model 2: CSI Exit
Based on the second modeling analyses, the following school characteristics were associated with higher odds of a school exiting CSI status in SY 2022–23 after being identified for CSI in SY 2019–20: large- and medium-sized school (compared to small). The following characteristics were associated with lower odds of exiting controlling for all other variables in the model:
· a larger share of households in poverty,
· serving grade 12 students,
· being a charter school, and
· a larger share of Asian/Pacific Islander, Black/African American, Hispanic, or American Indian /Alaska Native students.
These associations were considered statistically significant based on the corresponding parameter’s CI not containing 1. The parameter estimates and 95 percent CIs from the model are provided in table 4.
|
Covariate |
Estimate and 95 percent confidence interval |
|
Modified poverty rate (5 percent change in share of students) |
0.88 (0.81, 0.95) |
|
Share of Asian/Pacific Islander students (5 percent change in share of students) |
0.88 (0.78, 0.98) |
|
Share of Black/African American students (5 percent change in share of students) |
0.95 (0.92, 0.98) |
|
Share of Hispanic students (5 percent change in share of students) |
0.93 (0.9, 0.96) |
|
Share of American Indian/Alaska Native students (5 percent change in share of students) |
0.9 (0.86, 0.94) |
|
Share of other students (5 percent change in share of students) |
0.72 (0.61, 0.85) |
|
Student-to-teacher ratio (in units of 5:1) |
1.01 (0.94, 1.08) |
|
Charter school |
0.67 (0.48, 0.95) |
|
Large-sized school (compared to small-sized school) |
2.65 (1.67, 4.23) |
|
Medium-sized school (compared to small-sized school) |
1.72 (1.26, 2.36) |
|
Rural school (compared to urban school) |
1.32 (0.97, 1.8) |
|
School offers grade 12 |
0.73 (0.56, 0.95) |
|
Suburban school (compared to urban school) |
1.07 (0.81, 1.42) |
Source: GAO analysis of Department of Education and Urban Institute data. | GAO‑26‑107849
Note: Certain numeric variables used in the modeling are converted in units representing changes of 5 to reflect meaningful changes in these variables (e.g., a change of 5 percent for share of students at a school who are from a household under the poverty level).
Limitations of the Logistic Regression Models
For the regression model-based analyses, there are a number of limitations. The conclusions using these models do not represent causal relationships. The data used in these analyses is observational in design and contains no source of experimental or quasi-experimental traits to use to test causal relationships between the variables. Further, while the regression models attempt to isolate the associations from variables of interest by controlling for potential confounders, many of these variables are strongly correlated and thus challenging to completely control for in an observational design. In both models, while we included the state a school was in to control for state-to-state variation not accounted for elsewhere in the model, two states had a limited number of schools with complete data. One state’s (Wyoming in the first model and Mississippi in the second model) data had to be removed from each model due to a lack of variation in CSI status when considering complete data. These data issues limited the degree of generalizability of the results to all states. There was also a larger degree of missingness in some variables, particularly shares of students with disabilities and those who are English learners. This missingness forced the removal of these variables from the second model. Without these variables, we were unable to estimate these associations and control for these variables in the model. These issues further limit the generalizability of the results.
GAO Contact
Jacqueline M. Nowicki, Director, NowickiJ@gao.gov
Staff Acknowledgments
In addition to the contact named above, Alison Grantham (Assistant Director), Cheryl Jones (Analyst in Charge), and Jennifer Cook made key contributions to this report. Also contributing to this report were John Bornmann, Charlotte Cable, Elizabeth Calderon, Denise N. Cook, Sara Daleski, Kevin Donovan, Hedieh Fusfield, Abigail Loxton-Daun, Brittni Milam, John Mingus, Mimi Nguyen, David Watsula, and Adam Wendel.
The Government Accountability Office, the audit, evaluation, and investigative arm of Congress, exists to support Congress in meeting its constitutional responsibilities and to help improve the performance and accountability of the federal government for the American people. GAO examines the use of public funds; evaluates federal programs and policies; and provides analyses, recommendations, and other assistance to help Congress make informed oversight, policy, and funding decisions. GAO’s commitment to good government is reflected in its core values of accountability, integrity, and reliability.
Obtaining Copies of GAO Reports and Testimony
The fastest and easiest way to obtain copies of GAO documents at no cost is through our website. Each weekday afternoon, GAO posts on its website newly released reports, testimony, and correspondence. You can also subscribe to GAO’s email updates to receive notification of newly posted products.
Order by Phone
The price of each GAO publication reflects GAO’s actual cost of production and distribution and depends on the number of pages in the publication and whether the publication is printed in color or black and white. Pricing and ordering information is posted on GAO’s website, https://www.gao.gov/ordering.htm.
Place orders by calling (202) 512-6000, toll free (866) 801-7077,
or
TDD (202) 512-2537.
Orders may be paid for using American Express, Discover Card, MasterCard, Visa, check, or money order. Call for additional information.
Connect with GAO
Connect with GAO on X,
LinkedIn, Instagram, and YouTube.
Subscribe to our Email Updates. Listen to our Podcasts.
Visit GAO on the web at https://www.gao.gov.
To Report Fraud, Waste, and Abuse in Federal Programs
Contact FraudNet:
Website: https://www.gao.gov/about/what-gao-does/fraudnet
Automated answering system: (800) 424-5454
Media Relations
Sarah Kaczmarek, Managing Director, Media@gao.gov
Congressional Relations
David A. Powner, Acting Managing Director, CongRel@gao.gov
General Inquiries
[1]Title I authorizes financial assistance to school districts and schools with high numbers or high percentages of children from low-income families to help ensure that all children meet challenging state academic standards.
[2]GAO, K‑12 Education: Education Could Enhance Oversight of School Improvement Activities, GAO‑24‑105648 (Washington, D.C.: Jan. 30, 2024) and K-12 Education: Observations on States’ School Improvement Efforts, GAO‑21‑199 (Washington, D.C.: Jan. 11, 2021).
[3]EDFacts centralizes data provided by states, including performance data on public schools (pre-K through grade 12), and financial grant information. Education administers the CCD survey annually to collect a range of data on the characteristics of all public schools and school districts in the nation. Education has typically administered the CRDC survey biennially to collect data related to students’ access and barriers to educational opportunity, early education through grade 12.
[4]We were unable to conduct similar analyses of schools identified for targeted support and improvement or additional targeted support and improvement because the identification data for these schools were unreliable.
[5]We assessed the reliability of all four data sources by reviewing documentation about the data, conducting our own electronic data tests, and interviewing federal and Urban Institute officials knowledgeable about the datasets we used. We determined that the data were sufficiently reliable for our purposes.
[6]For the purposes of this report, school type includes traditional brick-and-mortar schools, as well as charter schools (publicly funded, semi-autonomous schools of choice), alternative schools (public schools serving students whose needs cannot be met in a regular school program), and virtual schools (schools that operate entirely or mostly online).
[8]With the waivers, Education allowed states to not administer their statewide assessments to all students (in only the 2019-2020 school year), make annual accountability determinations, identify schools for support and improvement, or provide related data on their state and local report cards.
[9]States granted a waiver for SY 2020–21 could exit schools following SY 2021–22. The waivers did not waive the requirement to calculate and report adjusted cohort graduation rates for SY 2019–20 or SY 2020–21. Therefore, a state could exit a school identified for CSI based on the graduation rate during SY 2021–22 if the school met the state’s exit criteria for such schools.
[10]States were required to use data from SY 2021–22 to make identifications.
[11]SY 2019–20 was the last year schools were identified for support and improvement before the COVID-19 pandemic.
[12]Due to the COVID-19 pandemic, Education granted states waivers from identification requirements for CSI, ATSI, and TSI schools for SY 2020–21 and SY 2021–22. States were required to resume identifying schools beginning SY 2022–23.
[14]See app. I for additional estimates and confidence intervals and more information on the regression analysis and characteristics included in the model.
[15]The percentage of CSI schools that were charter schools (15 percent) was almost twice the percentage of all public schools that were charter schools (8 percent) in SY 2022–23.
[16]We have previously reported that alternative schools serve students that are among the most vulnerable because they are often at risk of dropping out, are incarcerated, or were expelled or suspended from nonalternative schools. Additionally, Black and Hispanic students were overrepresented in alternative school enrollment compared to nonalternative schools. GAO, K‑12 Education: Certain Groups of Students Attend Alternative Schools in Greater Proportions Than They Do Other Schools, GAO‑19‑373 (Washington, D.C.: June 13, 2019).
[17]We excluded schools that closed or were redistricted after being identified in SY 2019–20 (approximately 7 percent of schools) from our analysis of exited schools.
[18]Exit criteria are set by the state, but they must ensure continued progress to improve student academic achievement and school success, as described in 20 U.S.C. § 6311(d)(3)(A)(i). Education’s guidance strongly encourages states to examine at least 2 years of data to determine if a school has made continued progress.
[19]See app. I for more information on the regression analysis and characteristics included in the model.
[20]We define large schools as schools that enroll at least 1,001 students, medium-sized schools as schools that enroll between 201 and 1,000 students, and small schools as schools that enroll 200 or fewer students.
[21]GAO, K‑12 Education: Education Should Assess Its Efforts to Address Teacher Shortages, GAO‑23‑105180 (Washington, D.C.: Oct. 27, 2022).
[22]In SY 2022–23, 30 states did not report any schools not exiting CSI by the state-determined deadline. Because of accountability and school identification waivers given to states in SY 2019–20 due to COVID-19, most schools would not be required to exit CSI until SY 2023–24.
[23]In this report, we use the term “commonly” to note strategies or topics identified by educators in 13 or more of the 25 organizations we interviewed.
[24]GAO, Government Reorganization: Key Questions to Assess Agency Reform Efforts, GAO‑18‑427 (Washington, D.C.: June 13, 2018).
[25]See GAO‑24‑105648.
[26]We previously reported on the teacher shortage in the U.S., a problem that worsened during the COVID-19 pandemic. We found that negative perception of the teaching profession and perceived lack of support for current teachers are cited among key recruitment and retention challenges. See GAO‑23‑105180.