HOMEOWNERS INSURANCE
Premiums Generally Tracked Inflation but Rose More in Disaster-Prone Areas
Report to the
Ranking Member
Senate Committee on Banking, Housing, and Urban Affairs
United States Government Accountability Office
A report to the Ranking Member, Senate Committee on Banking, Housing, and Urban Affairs.
For more information, contact: Alicia Puente Cackley at CackleyA@gao.gov
What GAO Found
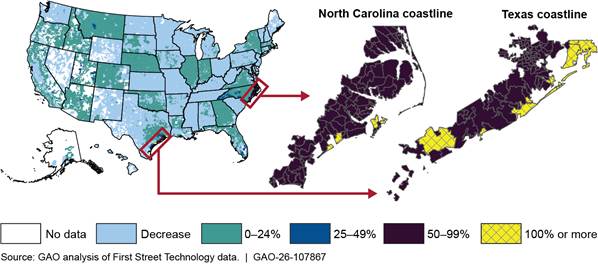
In recent years, while homeowners insurance premiums increased slightly nationwide, premiums grew more rapidly in certain areas of the country. Premiums as a percentage of 2023 median household income were highest in Florida, Louisiana, and Oklahoma. The average U.S. homeowners insurance premium rose 3 percent in 2019–2024, after adjusting for inflation. But rates in parts of certain states, particularly southern coastal areas at high risk of wind damage, increased 25 percent or more.
Estimated Total Change in Homeowners Insurance Premiums After Inflation, 2019–2024
The risk of different types of natural disasters can affect premiums to varying degrees. For example, GAO found that homes in areas with a high risk of wind damage had premiums about 58 percent higher than similar homes in areas with a medium level of wind risk. Moving from a medium to high level of wildfire risk was associated with an 8 percent increase in premiums. Increased risk of natural disasters also can reduce the availability of homeowners insurance.
Insurance is state-regulated. The time state regulators take to review requests to raise premiums varies, reflecting differences in regulations and regulator priorities. In 2020–2024, the longest median approval times were in Colorado (331 days) and California (305 days). Some homeowners in states in which regulators take longer to approve premium changes tend to have more difficulty obtaining insurance than in other states.
Some states have undertaken efforts to improve the availability and affordability of homeowners insurance, and legislation was introduced in Congress to support these efforts. GAO identified federal policy options that could improve the availability or affordability of the insurance. Stakeholders GAO surveyed expressed the strongest support for options that encourage mitigation, such as tax deductions or credits for building or upgrading homes to better withstand natural disasters. Stakeholders expressed mixed views on direct federal insurance or reinsurance programs and had concerns about federal costs and private market effects.
Why GAO Did This Study
Homeowners insurance plays a critical role in helping Americans recover from natural disasters, such as hurricanes and wildfires. But insurers have experienced rising losses from such disasters and homeowners in some areas experienced reduced affordability and availability of insurance. That is, insurance prices were greater than some homeowners could afford, and some were not able to obtain insurance.
GAO was asked to review issues related to homeowners insurance. This report examines trends in insurance availability and affordability, how insurance is priced and regulated, and views on federal policy options to increase availability and affordability.
GAO analyzed 2019–2024 data on private homeowners insurance and 2014–2023 information on insurers of last resort. GAO reviewed reports from government agencies, insurance industry groups, and consumer advocacy organizations. GAO interviewed representatives of the Federal Insurance Office, four insurance industry groups, three consumer advocacy organizations, and four state insurance regulators. GAO also sent a structured questionnaire on proposed policy options to 15 organizations, selected to obtain a range of views. GAO received responses from four industry associations, three consumer organizations, and three state regulators, for a 67 percent response rate. GAO also visited four states to speak with regulators and other stakeholders.
|
Abbreviations |
|
|
|
|
|
FAIR plan |
Fair Access to Insurance Requirements plan |
|
FEMA |
Federal Emergency Management Agency |
|
NAIC |
National Association of Insurance Commissioners |
This is a work of the U.S. government and is not subject to copyright protection in the United States. The published product may be reproduced and distributed in its entirety without further permission from GAO. However, because this work may contain copyrighted images or other material, permission from the copyright holder may be necessary if you wish to reproduce this material separately.
February 27, 2026
The Honorable Elizabeth Warren
Ranking Member
Committee on Banking, Housing, and Urban Affairs
United States Senate
Dear Ranking Member Warren:
U.S. homeowners can be exposed to a wide range of disasters, including hurricanes, earthquakes, and wildfires. Homeowners insurance helps protect against the financial consequences of such events. For example, the Los Angeles area wildfires in January 2025 caused tens of billions of dollars in insured property losses, according to industry and academic estimates. As losses have grown, some U.S. regions reported experiencing increasing premiums and decreasing access to homeowners insurance. Members of Congress, federal agencies, consumer advocates and the insurance industry have expressed interest in these issues.
In light of these developments, you asked us to review issues related to the availability and affordability of homeowners insurance.[1] This report examines (1) how homeowners insurance is priced and regulated; (2) trends in availability, affordability, and profitability; and (3) state policy responses and federal options to increase insurance availability and affordability.
For the first objective, we reviewed a nongeneralizable sample of 18 filings of proposed insurance rates, including rate manuals demonstrating how individual premiums are derived, from 12 insurers in six states.[2] We selected these states to reflect a range of geographies and regulatory environments, levels of affordability of homeowners insurance, and disaster risk. The rate filings we reviewed (three for each state) represented the largest insurers in each state in 2024.[3] We also analyzed data from about 13,000 insurers’ rate filings submitted to all 50 states and the District of Columbia from 2020 through 2024, to understand how state regulatory environments can influence approval times.[4]
For the second objective, we developed two econometric models: one estimating the cost of homeowners insurance premiums, and the other estimating the market share of state residual insurance plans (insurers of last resort) as a proxy for the availability of private insurance. For the models, we used 2019–2024 data on estimated homeowners insurance premiums from First Street Technology, a climate risk financial modeling, data, and analytics company.[5] To assess the profitability of homeowners insurance, we analyzed data from A.M. Best, a data analytics provider specializing in the insurance industry.
For the third objective, we reviewed state reports to better understand how states regulate insurance and interviewed four state insurance regulators. We also reviewed federal reports, including our own prior work; legislative proposals; and reports from insurance industry associations and consumer advocacy groups. We invited state regulators, insurance industry associations, and consumer advocacy organizations to complete a structured questionnaire assessing potential policy options.[6]
For all objectives, we interviewed representatives of the Federal Insurance Office (a division of Treasury with the authority to monitor the insurance sector), four state insurance regulators, two insurers, four insurance industry associations, three managers of state residual insurance plans, and three consumer advocacy groups to gather additional perspectives. We visited Alabama, California, Illinois, and Washington to speak to regulators and other stakeholders, and visited the Insurance Institute for Building and Home Safety in South Carolina to learn about ways homeowners can mitigate damage from catastrophic storms. For more detailed information on our scope and methodology, see appendix I.
We conducted this performance audit from October 2024 to February 2026 in accordance with generally accepted government auditing standards. Those standards require that we plan and perform the audit to obtain sufficient, appropriate evidence to provide a reasonable basis for our findings and conclusions based on our audit objectives. We believe that the evidence obtained provides a reasonable basis for our findings and conclusions based on our audit objectives.
Background
Risk Management by Insurers
Insurance is the business of bearing and managing risk for policyholders in exchange for a premium. To ensure financial solvency, sustain profitability, offer competitive pricing, and respond to regulatory demands, insurers actively manage their exposure to risk. For example, they establish underwriting guidelines that define their criteria for accepting or rejecting applications for coverage. Insurers also may limit their concentration of risk by geography or by peril (such as wildfire or wind) to avoid overexposure to a single type of peril. In addition, they may transfer some of their risk to other entities through reinsurance—insurance for insurance companies—or by issuing catastrophe bonds or using other financial tools designed to help cover catastrophic losses.
A critical risk-management tool for insurers is risk-based pricing, which enables them to align premiums collected to the underlying risks. Property and casualty insurers typically determine a total premium needed at the state level to cover anticipated claims and other expenses while maintaining profitability. They then allocate that total across individual policyholders in each state based on the risks (in the case of homeowners insurance, of each policyholder’s property).
However, losses from natural disasters, such as hurricanes and wildfires, pose unique challenges because they are severe, unpredictable, and capable of causing losses that can deplete insurers’ and reinsurers’ capital. Conversely, when losses are lower than expected, insurers’ profits are higher.
Insurers use catastrophe modeling to estimate expected average annual losses based on the estimated distribution of a range of possible losses, and to manage risks. Catastrophe models are actuarial, statistical, and scientific models that allow insurers to estimate the losses from rare but highly destructive events, such as hurricanes and wildfires. Where the risk of loss is unacceptably high and insurers cannot charge the premium necessary to cover expected losses, they may limit coverage or withdraw from the market entirely.
Regulation of Homeowners Insurance
Insurance in the United States is primarily regulated at the state level.[7] State insurance regulators are responsible for enforcing state insurance laws and regulations, including through the licensing of agents, review of insurance products and premium rates, and examination of insurers’ financial solvency and market conduct.
The insurance regulators of the 50 states, District of Columbia, and U.S. territories created and govern the National Association of Insurance Commissioners (NAIC). Through NAIC, state insurance regulators establish model laws, standards, and best practices; and coordinate their regulatory oversight. NAIC represents the collective views of state regulators domestically and internationally. Together, NAIC members and staff support the national system of state-based regulation in the United States.
State regulation of rates charged by insurers generally can be divided into three main categories:
· Prior approval states require insurers to wait for a state regulator to approve a rate change request before charging the new rate.
· File-and-use states require an insurer to file a rate request with the state regulator, which has a fixed number of days to review the request and approve, disapprove, or object to a specific part of it and allow the insurer to respond to the objection. In some file-and-use states, if the state regulator takes no action in that period, the insurer may implement the new rate at the end of the required review period. However, associations representing regulators and insurers told us that even where it would be legal to do so, insurers rarely implement a new rate until the regulator approves it, in part because it would be very difficult to retroactively refund the additional premiums charged to policyholders if the rate were later modified or rejected.
· Use-and-file states allow an insurer to charge a new rate immediately, while at the same time submitting a rate filing with the state regulator. The regulator has a set number of days to object. If no objection is made, the insurer may continue to use the new rate.[8]
According to the Federal Insurance Office, from 2018 through 2022, 23 states and the District of Columbia were classified as file-and-use, 15 states as prior approval, 10 as use-and-file, and two (Alaska and Wyoming) did not fall into any of the three categories (see fig. 1).[9]
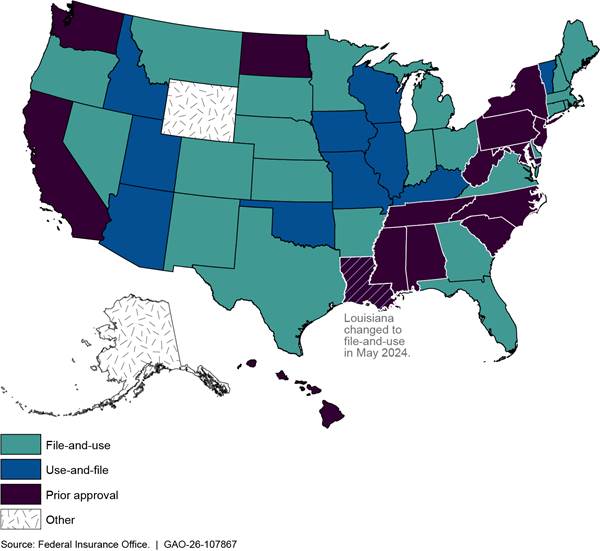
Note: GAO did not conduct an independent review of state statutes.
Surplus Lines Insurers and Insurers of Last Resort
Sometimes a homeowner is unable to obtain homeowners insurance from a traditional private insurer regulated by their state. This may be because the property’s risk is too high for any insurer to accept at a rate allowed by the state regulator.
In such cases, the homeowner may be able to obtain insurance through one of two alternatives:
Surplus insurance market. Under some circumstances, insurers licensed in one state can also sell insurance in another state in which they are not licensed. These “surplus” policies are generally not subject to price regulation by the state where the coverage is sold. According to one industry association, homeowners generally purchase surplus lines coverage when they are unable to obtain coverage from insurers licensed by their state and return to those home state insurers when coverage becomes available.[10]
Residual markets (FAIR or beach plans). As of August 2025, 35 states operate insurance plans designed to provide coverage to homeowners unable to obtain it in the private market, according to an association of these plans. These plans, considered plans of last resort, are known as Fair Access to Insurance Requirements (FAIR) plans (which are generally available throughout a state) or “beach plans” (which are generally available only in coastal areas). They generally offer less coverage than private policies. For example, the California FAIR Plan predominantly covers only wildfire risk, while the Texas Windstorm Insurance Association, a beach plan, focuses specifically on wind and hail risk. If these types of plans experience a large deficit, they can levy an assessment on the state’s private insurers to fund the plan.
How Homeowners Insurance Is Priced and Regulated
How Do Insurers Calculate Individual Homeowners Insurance Premiums?
Insurers calculate premiums based on the risk of loss posed by certain characteristics of a given property and the type and amount of coverage a homeowner chooses.[11] Insurers typically calculate the premium starting with a base rate, which they then adjust up or down using rating factors. Such factors might include the home’s location or building material, maximum coverage amount on the home, and the deductible selected.
Our analysis of 18 rate manuals filed with state regulators by 12 insurers across six states indicated that these rating factors can vary among companies and states.[12] For example, some insurers offered a premium discount for homes constructed with fire-resistive materials, such as masonry, or increased fire premiums for homes made with wood-frame construction. However, companies differ in how they weigh risk factors.
For example, one California rate manual we reviewed had a base rate of about $492 for fire damage (excluding wildfires). This insurer lowered the nonwildfire premium by about 11 percent for a 20-year-old home and by about 32 percent for a 10-year-old home, resulting in premiums of about $439 and $336 respectively, independent of other factors. Another insurer’s rate manual in the same state, with a base rate of about $159, increased the nonwildfire premium by about 2 percent for a 20-year-old home and decreased it by about 30 percent for a 10-year-old home, resulting in premiums of about $162 and $111, respectively (see fig. 2).
Figure 2: Example of How Two Companies Arrive at Different Premiums by Weighting Rating Factors Differently
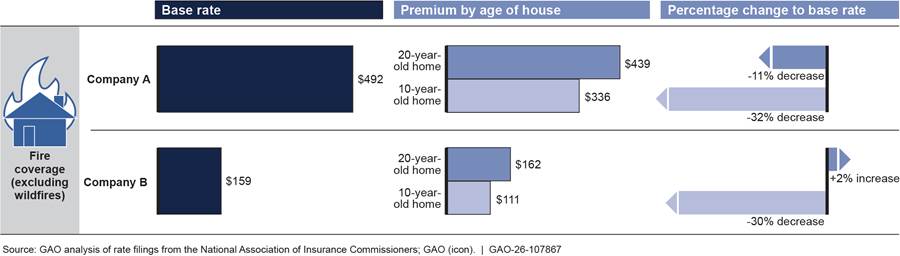
Additionally, an insurance company that operates in multiple states may calculate premiums differently depending on where the policy is written. For example, a company that operates in California and Louisiana offered wildfire mitigation discounts in California, where wildfire risk is higher, but not in Louisiana.[13] The differences in rating factors and how they are weighted among states and companies can lead to differing premiums.[14]
In certain states, some insurers offer discounts for homes that meet certain criteria, such as being built to specified building standards or located within a certain distance of a fire department. By imposing stronger building standards or increasing resilience to wildfire, communities may reduce the risk of damage to homes and therefore reduce insurance premiums for residents, according to an insurance services company we interviewed.
Some insurers have reduced the coverage they offer in response to certain risks, according to consumer advocacy organizations and an insurance services company we interviewed. For example, insurers may cover the depreciated value of older roofs rather than the total replacement cost. Alternatively, they may require a “split deductible,” where there is a deductible for roof damage in addition to the deductible for damage on the rest of the property. One insurer we interviewed offered a discount to policyholders who agreed to accept a lower claim payment for roof damage. The insurer noted that this approach was necessary in areas with higher risk of heavy hail (such as Oklahoma), which often caused roofs to fail prematurely. The insurer stated that without this option, it would not be able to charge a competitive premium and retain policyholders.
Premiums also can change if homeowners have additional coverage. For example, premiums may be higher if homeowners include coverage for detached structures, such as sheds and garages, or for personal property, such as jewelry or art.
How Do States Review Requests for Premium Increases?
State regulators follow state-specific processes for reviewing an insurance company’s rate filings.[15] State processes vary in terms of when rate filings are reviewed and approved or disapproved (see fig. 3). The rate filing reviews are intended to ensure that premiums are not excessive, inadequate, or unfairly discriminatory.
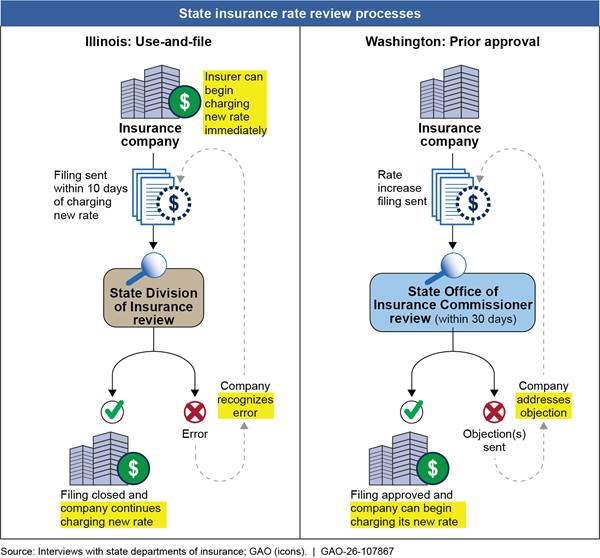
Note: Each state’s rate review process differs depending on its needs and market conditions. Illinois does not have the authority to approve or deny rates like other use-and-file states. In Washington, the 30-day review period applies only to the initial filing, not to any responses to objections by the Office of the Insurance Commissioner. The review period can be extended to 45 days with notification to the filer, according to the Office of the Insurance Commissioner.
Some states require insurers to provide actuarial analyses in their rate filings to justify premium increases. These analyses must show that the insurer’s expected statewide costs, such as claim payments and operating costs, are projected to exceed revenues from current total premiums, investment income, and reasonable profits within the state, among other information.[16]
In some states, different regulatory review standards may apply, depending on the size of the proposed rate change. For example, in South Carolina, any rate filing between minus 7 percent and 7 percent can be filed and used without prior approval, whereas larger changes require prior approval.
According to our analysis of 18 rate filings, insurers generally include the following elements to justify premium increase requests:
· Rate indication analysis. The insurer provides actuarial analyses showing how much it should charge and why it believes current premiums will be insufficient. Reasons for requesting higher premiums generally include increases in the insurer’s expected catastrophic and noncatastrophic losses, higher reinsurance costs, and the need to maintain a certain profit margin.[17]
· Changes to rating variables. The insurer identifies any changes to risk factors (such as location or building materials) approved in prior filings. For example, one rate filing we reviewed proposed a 14 percent statewide increase, which was the combined impact of various rating factors, including a 3.4 percent increase in the base rate and changes in other rating factors that ranged from a 3.1 percent decrease to an 8.2 percent increase.
· Impact on policyholders. The insurer demonstrates how premium increases would affect its policyholders, such as how many would see premiums rise and by how much.
Regulators then review submitted rate filings for actuarial soundness and compliance with state law.[18] Specific requirements differ from state to state, with some states requiring more documentation than others. For example, California requires insurers to file an authorization for disclosure of their financial records, while Illinois does not.
State regulators may object to premium change requests for several reasons, including the following:
· Missing or incomplete data. For example, one insurer whose rate filing we reviewed did not provide complete data showing how many of its claims came from fire, water loss from plumbing, and additional living expenses.
· Errors in the filing. For instance, one filing we reviewed requested a proposed profit over 11 percent, which was illegal under state law.
· Need for clarification. Regulators may request clarification of why or how a particular variable was used.
· Lack of actuarial justification. For example, representatives of one state regulator told us they rejected a filing because the insurer wanted to use a tenant’s criminal history as a proxy for risk in a renter’s insurance policy. The regulator rejected the filing because it did not believe criminal history was related to property risk, such as the likelihood of wind damage.
Some states have additional oversight mechanisms. For example, California allows public third parties (called “intervenors”) to provide their own analyses of insurer rate filings, which it considers when assessing the appropriateness of a premium increase. This process is intended to help ensure fair insurance rates. Additionally, if an insurer proposes a premium increase of more than 7 percent, intervenors may request a mandatory public hearing, which may have reduced California homeowners premiums by as much as $2.25 billion dollars in 2002–2023, according to a report by a consumer advocacy group.[19] According to a 2020 hearing held by the California Department of Insurance, such requests increased the average approval time by about 111 percent.[20]
One department of insurance we interviewed also conducts audits to ensure that insurers follow their approved rate manuals. The department reported that these audits commonly find errors in how individual premiums were determined or reveal that insurers used methods that were not filed with the state, according to officials of this department.
How Long Must Insurers Wait Before Charging New Premiums?
The amount of time insurers must wait before charging new premiums varies by state, depending on regulatory standards, filing requirements, and other factors, according to a report by an actuarial services company.[21] From 2020 through 2024, median approval times were longest in Colorado and California—331 and 305 days, respectively—followed by Hawaii, Florida, and New Jersey (see fig. 4).
This map displays median time (in calendar days) from insurersubmission of a rate filing to regulatory approval across states
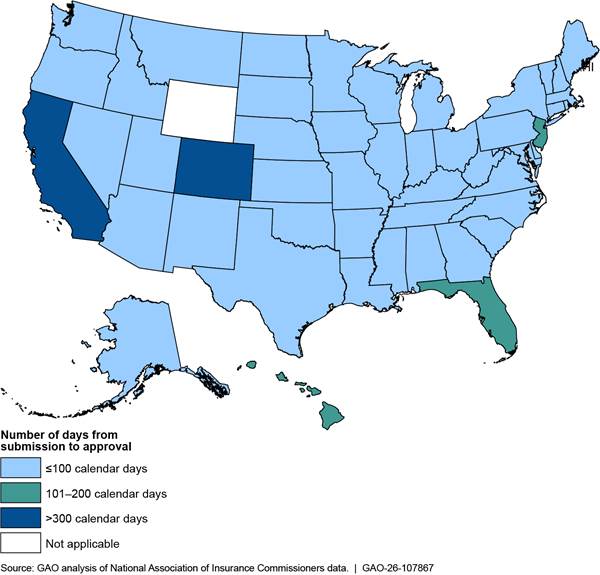
Note: Wyoming is labeled as “not applicable” because their insurance regulator does not review filings.
The time it takes for a state to approve filings may depend on state-specific regulations and the resources of the regulator. For example, one state regulator told us approval times had increased because filings had become more complex, which required increased resources (such as for manual verification of some filing sections). In contrast, another regulator said filings in their state generally were approved quickly and infrequently rejected because the high cost of refiling discouraged unsupported rate increase requests.
State regulators also may follow different review approaches. Representatives of one prior-approval state told us their process aims to ensure that insurers do not charge excessive rates and remain financially sound. By comparison, representatives of a use-and-file state told us their review of rate filings was less comprehensive and relied more on market competition to ensure reasonable premiums.
These differences can influence approval times, and objections can delay an insurer’s ability to charge new premiums.[22] Of the three filings we reviewed for Illinois, a use-and-file state, the regulator made two objections in total. In contrast, the three filings we reviewed for California, a prior approval state, had a total of 55 objections.
Trends in Availability, Affordability, and Profitability
How Have Homeowners Insurance Premiums Changed in Recent Years?
From 2019 through 2024, when adjusted for inflation, the average premium for the United States as a whole rose about 3 percent, according to our analysis of estimated property-level premiums for homeowners insurance. However, in some regions, particularly in the South, premiums increased more than 25 percent above inflation. The highest percentage increases in estimated average premiums occurred in parts of North Carolina, Texas, Utah, Florida, and California.[23]
Without adjusting for inflation, the average premium increased by about 27 percent nationwide—from $2,235 in 2019 to $2,829 in 2024 (see fig. 5). Over this period, the average premium was consistently higher in the South than in other U.S. regions.
Figure 5: Estimated Premiums (Non-Inflation-Adjusted) for Homeowners Insurance Were Highest in the South, 2019–2024
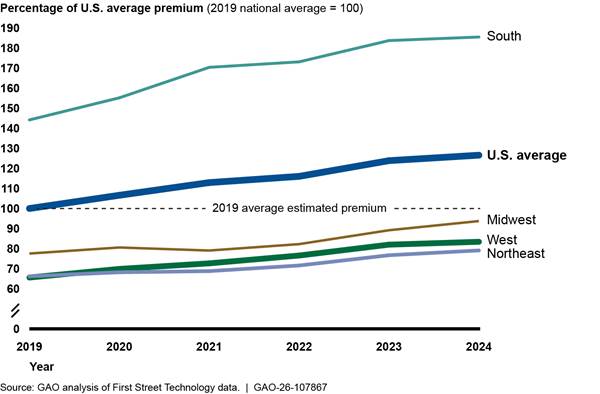
Note: First Street data on premiums are estimates based on state rate filings and adjusted to reflect each structure’s replacement cost and year built. First Street Technology is a climate risk financial modeling, data, and analytics company.
Average premiums generally appear to have tracked inflation over this period (see fig. 6). For example, in 2024 dollars, the U.S. average premium rose from $2,743 in 2019 to $2,829 in 2024—about a 3 percent increase.
Figure 6: Estimated Premiums (Inflation-Adjusted) for Homeowners Insurance Changed Little Nationwide, 2019–2024
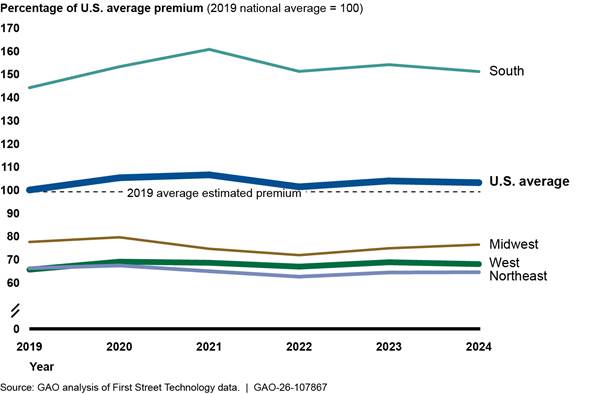
Note: Premiums are in 2024 dollars. First Street data on premiums are estimates based on state rate filings and adjusted to reflect each structure’s replacement cost and year built. First Street Technology is a climate risk financial modeling, data, and analytics company.
Zip code-level data show that certain smaller areas of the country saw annual premium increases that substantially exceeded inflation over this period. For instance, during 2019–2024, at least 10 zip codes in North Carolina, Texas, Utah, Florida, and California experienced increases of more than 25 percent after adjusting for inflation. Many coastal areas of North Carolina and Texas saw increases above 50 percent in real terms after adjusting for inflation (see fig. 7).[24]
Figure 7: Premiums (Inflation-Adjusted) for Homeowners Insurance Rose Sharply in Some Coastal Areas, 2019–2024
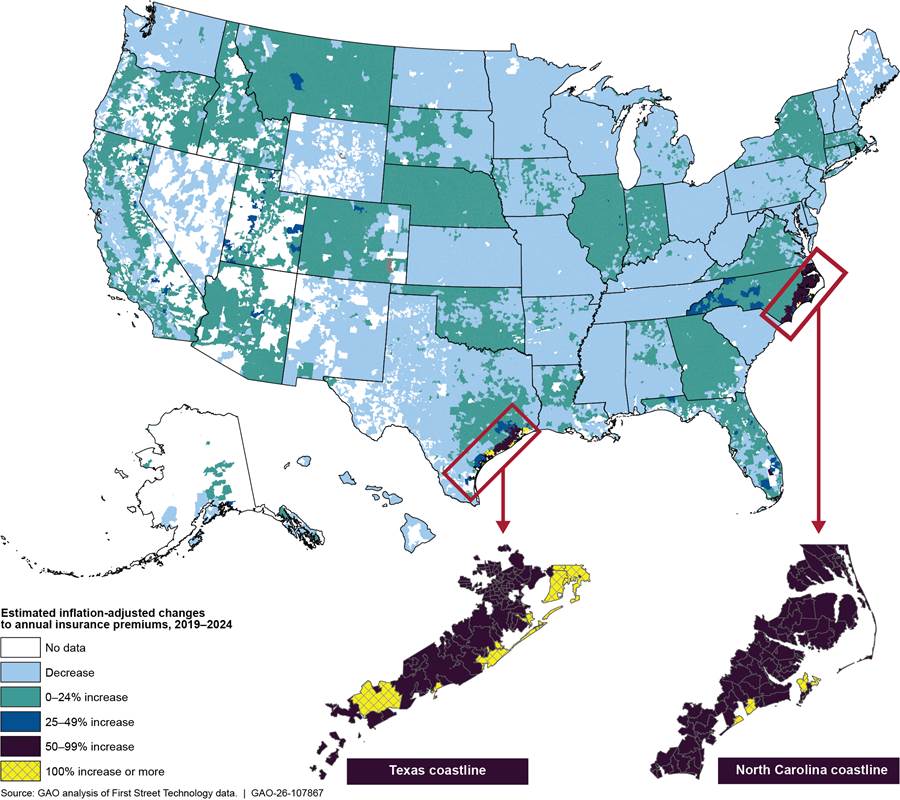
Note: First Street data on premiums are estimates based on state rate filings and adjusted to reflect each structure’s replacement cost and year built. First Street Technology is a climate risk financial modeling, data, and analytics company.
Some homeowners in high-risk areas may be less able to afford higher insurance premiums because they have lower incomes. When premiums account for a higher share of median income in a given area, they are less affordable for typical homeowners. Based on 2023 state-level data, state average premiums as a percentage of median household income were highest in Florida, Louisiana, and Oklahoma.[25] In 2023, affordability was at medium levels—defined in our analysis as from about 4 percent to 7.3 percent of median income—in several Southern and Midwestern states (see fig. 8).
Figure 8: 2023 Estimated Premiums for Homeowners Insurance Were Highest as a Share of Median Household Income in Florida, Louisiana, and Oklahoma
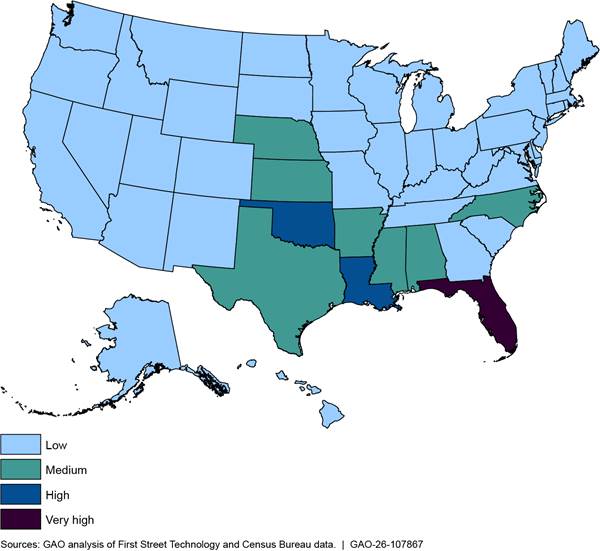
Note: We categorized states into four equal ranges according to premiums as a percentage of median income. We defined a low share as less than 4.01 percent of median income, a medium share as from 4.01 percent to 7.31 percent, a high share as from 7.32 percent to 10.6 percent, and a very high share as more than 10.6 percent.
What Factors Were Associated with Higher Homeowners Insurance Premiums?
Our analysis found that homeowners insurance premiums were significantly associated with factors that reflect the insurers’ estimated risk of catastrophic losses. Specifically, higher premiums were significantly associated with the following:
· Higher risk of natural disaster from wind and wildfire
· Higher economic damages from recent natural disasters
Our analysis also included other variables that could be correlated with premiums, such as annual hourly wage in the home building industry of a state, median approval time of insurer rate change requests, and median household income and population of a zip code. We also found small positive and statistically significant associations between premiums and longer approval times, higher median household income, and population size. Our regression was not designed to control for all possible factors influencing premiums and therefore does not imply that these factors caused the increase in premiums.
Higher risk of natural disasters from wind and wildfire. The risk of wildfire and wind damage—the primary catastrophic risks covered by homeowners insurance—varies throughout the United States (see fig. 9).[26] For example, severe or extreme risk for wind damage is concentrated in the Southeast.
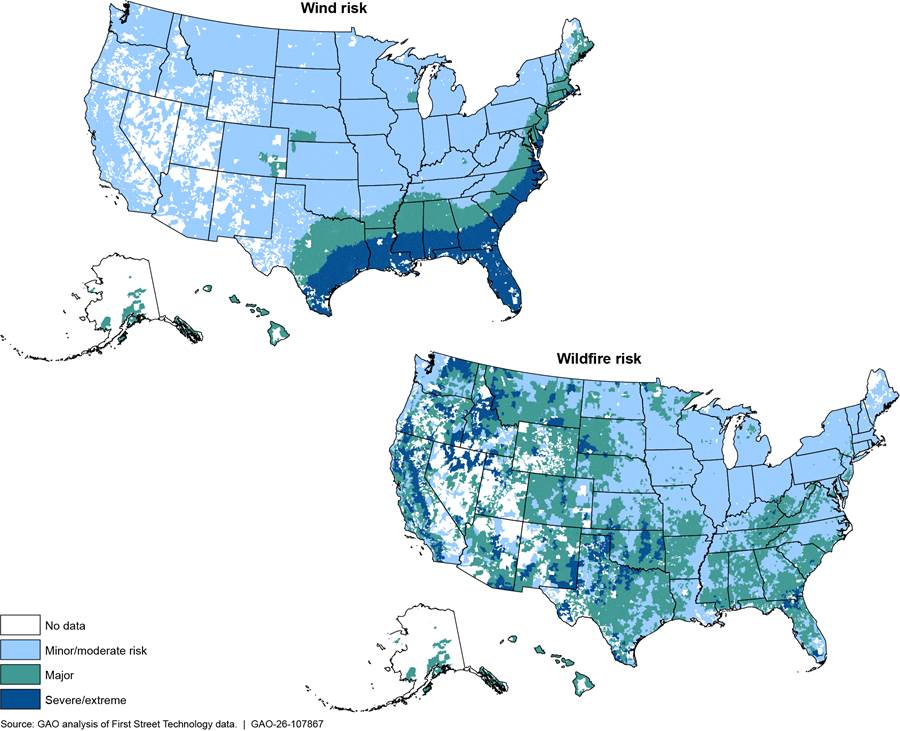
Note: This figure is based on catastrophe model data (as of June 2024) and risk-level categories of First Street Technology, a climate risk financial modeling, data, and analytics company.
Areas with severe or extreme risk of wind or wildfire damage tended to have higher average insurance premiums than areas with lower risks, holding other explanatory variables equal.[27] And increases in wind risk were associated with larger premium increases than increases in wildfire risks (see fig. 10).[28] More specifically, homes in areas with severe or extreme wind risk had premiums approximately 58 percent higher on average—or about $1,294 more per year—than similar homes in areas with major wind risk (the next lower risk level). Homes in areas with severe or extreme wildfire risk had premiums approximately 8 percent higher—or about $181 more per year—than homes with major wildfire risk.
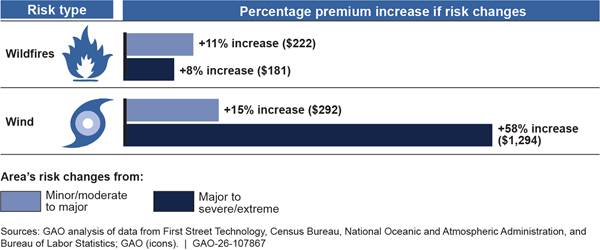
Notes: We estimated premiums in our regression by varying the level of risks while holding all other explanatory variables equal. For details on the model’s estimates and variables used, see appendix II.
Additionally, we estimated the effects of risk on premium growth from 2019 through 2024. Premiums in areas at severe or extreme risk for wind and wildfire grew faster than premiums in areas at major risk. For example, for each year since 2021, premiums in zip codes with severe or extreme risk for wind or wildfire grew by 6–10 percent on average, and premiums for zip codes with major risk grew by 1–4 percent.
Greater economic damages from recent natural disasters. States with higher recent costs of natural disasters tended to have higher premiums. For example, an increase from $25 billion to $35 billion in average disaster-related costs affecting a state from 2018 to 2023 was associated with an 8 percent increase in premiums—about $170 more per year. Although not all economic damage from disasters is covered by homeowners insurance, insurers may adjust their expectations for future losses in states that experience above-average damages.[29] For example, one insurer told us the industry increased its estimate of the wildfire risk in California following major wildfires in 2017 and 2018.
What Factors Were Associated with Lower Availability of Homeowners Insurance?
Lower availability of homeowners insurance was significantly associated with the following:
· Higher economic damages from recent natural disasters
· Longer regulatory approval times for insurer premium change requests
· Higher risk of wildfire
Overall, availability of homeowners insurance appears to have declined over the past few years. According to the Property Insurance Plans Service Office—an association of FAIR and beach plans—the total U.S. market share of FAIR and beach plans rose from about 1.4 percent in 2019 to about 2.5 percent in 2023. According to industry representatives, this is due to unexpectedly high losses from natural disasters in recent years, which reduced the availability of private homeowners insurance. Insurance availability tends to be cyclical, as insurers become more selective in the risks they will insure during times of lower profitability.[30] If insurer profitability recovers from recent losses, industry representatives said they expected insurance companies to be willing to accept more risk and for availability to increase.
To understand how often homeowners were unable to obtain coverage from private insurers, we analyzed the market share of FAIR and beach plans—state-instituted insurance plans of last resort generally open to homeowners unable to obtain insurance in the private market.[31] Because homeowners generally use these plans only when no private insurers will offer coverage, a higher market share of these plans suggests reduced availability of private insurance.
In 2023, the FAIR plans in Florida and Louisiana had the highest market share among states with such plans, and beach plans in North Carolina had the highest market share among state beach plans, suggesting lower availability of private insurance in these states (see fig. 11).
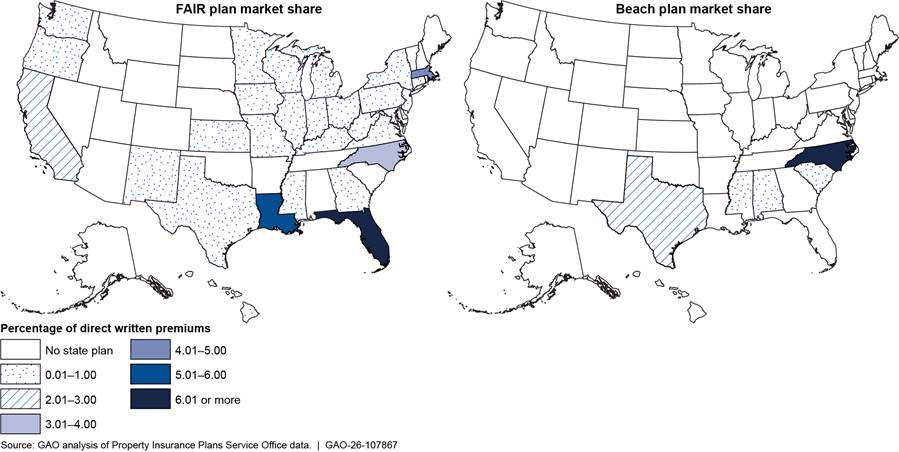
Notes: Fair Access to Insurance Requirements (FAIR) and beach plans are state-run insurance programs that serve as a last resort for homeowners unable to obtain coverage in the private market. FAIR plans may cover multiple risks; beach plans focus on risks in coastal areas. Colorado’s FAIR plan was not operational in 2023, the last year of data available. Direct premium written is the total amount of an insurer’s premiums written, not including amounts ceded to reinsurers.
Using state-level data, we found the following factors were associated with lower availability of private insurance, as measured by market share of FAIR or beach plans:[32]
Higher damages from recent natural disasters. States with higher economic costs of recent natural disasters tended to have lower availability of private insurance.[33] Specifically, using state-level data, we found that a $10 billion increase in a state’s average disaster costs from 2014 to 2023 was associated with an approximately 0.6 percentage point increase in market share of FAIR or beach plans. Insurers may be more cautious about providing coverage to homeowners in states with higher costs from prior disasters. According to industry representatives, large disaster events can change insurer expectations of future losses.
Longer wait times for insurer premium change requests. States with longer approval times for rate changes tended to have lower availability of private insurance. An increase of 60 days in the average approval time was associated with an approximately 0.5 percentage point increase in the state’s market share of FAIR or beach plans. According to industry representatives, when insurers cannot adjust rates quickly, they may cover fewer homes in risky areas where expected losses and other costs may exceed premiums approved by state regulators.
In addition, using 2020–2023 zip-code level data from California, we found that the zip codes with higher disaster risk due to wildfire had lower availability of private insurance, as measured by the share of properties insured by the California FAIR plan.[34] Zip codes at severe or extreme wildfire risk were associated with a higher share of such properties (approximately 12 percentage points) than zip codes with minor-to-moderate wildfire risk. Use of the FAIR plan grew rapidly from 2020 to 2024, from about 200,000 residential policies in 2020 to approximately 450,000 in 2024. Most of this growth (about 78 percent) occurred in areas with major or severe or extreme risk for fire damage, indicating that lack of private insurance was primarily in higher-risk areas, but not entirely limited to these areas.
Was Homeowners Insurance Profitable in Recent Decades?
Insurers’ claim losses and expenses for homeowners policies exceeded premium income in 22 of the 30 years from 1995 through 2024. The relationship of insurer claim losses and expenses to premium income is known as “underwriting profitability,” and it excludes taxes as well as investment income and capital gains and losses. Therefore, insurers may be profitable despite losing money on claims if they earn sufficient investment income. Moreover, many insurers operate multiple lines of business. Thus, they may have been profitable overall despite losing money on homeowners insurance if other lines of business were sufficiently profitable.
Over this period, the homeowners insurance line of business experienced an average underwriting loss of 4.2 percent. In years in which insured catastrophic losses were high (relative to total industry claims losses), insurers were more likely to experience aggregate net underwriting losses of more than 1 percent than in years of more moderate or low catastrophic losses (see fig. 12).[35] For example, some of the lowest underwriting profitability was in years with major natural disasters, such as Hurricanes Fran (1996), Ike (2008), Irene (2011), Sandy (2012), and Harvey, Irma, and Maria (2017); severe convective storms such as tornadoes and hailstorms throughout the United States; and the Maui, Hawaii wildfires (2023). However, factors other than named catastrophic storms can contribute positively or negatively to underwriting profitability during a year, such as the cyclical nature of insurance, inflationary pressures, insurers’ ability to obtain timely approval for adequate rate increases from regulators, and the availability and pricing of reinsurance.[36]
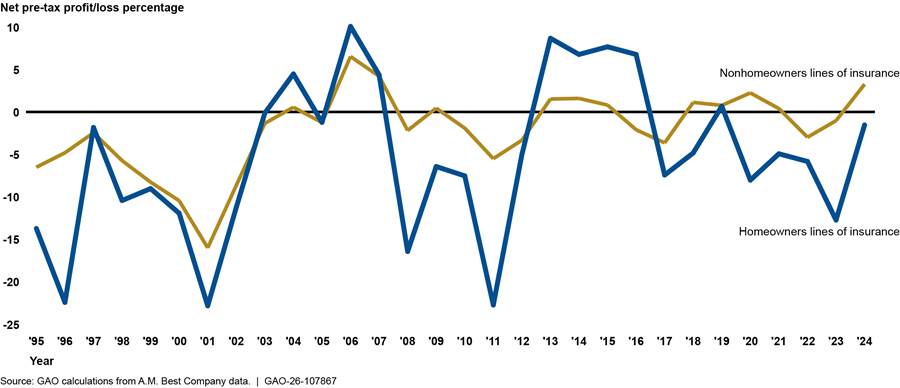
Note: Pre-tax underwriting profit and loss does not include investment income or losses.
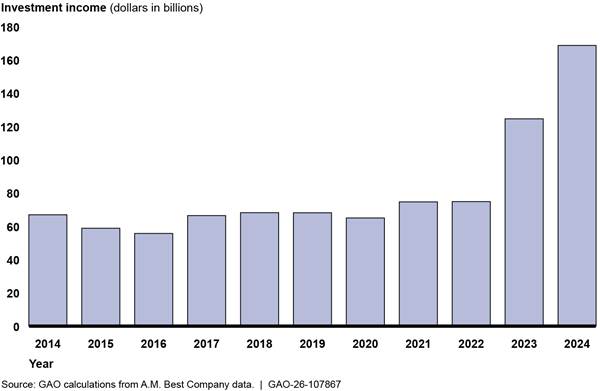
Investment income earned by insurers also can contribute to homeowners insurers’ profitability. As of the end of 2024, property and casualty insurers had cash and invested assets of approximately $2.6 trillion. Of this, 55 percent was invested in bonds, 24 percent in stocks, and 12 percent in cash and other short-term cash equivalent investments. These invested assets earned $168.5 billion in investment income and gains (net of taxes) in 2024—more than six times the $25.7 billion in underwriting gains. Also in 2024, insurers allocated $8.8 billion in investment income and gains (before taxes) to the homeowners line of business, thereby turning a $1.8 billion underwriting loss for the line into a total profit of $6.9 billion.[37] However, the amount of investment income can vary from year to year (see fig. 13).
Some insurers sell other property and casualty products in addition to homeowners insurance, which can help diversify their risk exposure and contribute to overall profitability. Over the same 30-year period, the property and casualty industry as a whole had an average underwriting loss of 1.8 percent of premium income, with some lines experiencing underwriting gains, such as commercial fire (7.4 percent), auto damage (2.4 percent), and fidelity and surety (18.6 percent).[38] Other property and casualty lines of business were more regularly profitable than homeowners insurance in the past decade, such as workers’ compensation insurance.
In addition to writing multiple lines of business, insurers may diversify geographically. For example, representatives of one insurer told us they manage risks by writing policies in different parts of the country, which have different natural hazards and varying levels of profitability for homeowners insurance.
State Policy Responses and Federal Options to Improve Availability and Affordability of Homeowners Insurance
What Have States Been Doing to Improve the Availability and Affordability of Homeowners Insurance?
Several states have been taking steps to improve the availability and affordability of homeowners insurance by funding mitigation programs, reforming insurance regulations, and implementing legal reform. The following are selected examples of these strategies:
Mitigation
Mitigation refers to building or upgrading homes to better withstand natural disasters, and several states have taken steps to encourage homeowners to make such changes. For example, in 2011, Alabama created the Strengthen Alabama Homes program, which provides grants to eligible homeowners to upgrade their homes against damage from natural disasters. As of June 2025, the Alabama Department of Insurance had provided grants to about 10,000 homeowners to upgrade their roofs, according to the Alabama Department of Insurance. An additional 45,000 homeowners in Alabama had built or upgraded to FORTIFIED standards without state grants.[39] The state requires insurers to provide discounts on the wind portion of homeowners insurance premiums if homeowners meet the FORTIFIED standard (see example in fig. 14).[40]
Figure 14: A Home in Louisiana with a Sealed Roof Deck—A Required Feature for Roofs Built to the FORTIFIED Construction Standard
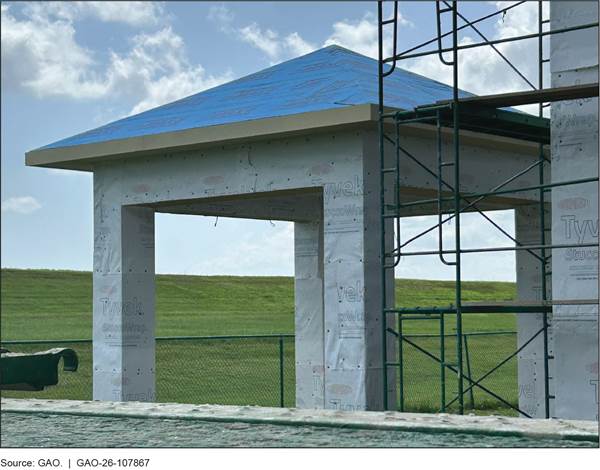
Evidence suggests that FORTIFIED roofs are an effective mitigation method. One study found that FORTIFIED roofs sustained fewer and less severe insurance losses than non-FORTIFIED homes after Hurricane Sally struck the Alabama coast in 2020, although the FORTIFIED homes encountered higher average wind speeds.[41] These homes also had lower insurance premiums on average, despite having slightly higher replacement costs. Additionally, a study by the National Institute for Building Sciences found that the benefits of FORTIFIED roofs exceeded the costs in all hurricane-prone areas along the Atlantic and Gulf coasts by at least 50 percent. In areas with higher wind speeds, the study estimated that benefits exceeded costs by up to a factor of 28.[42]
According to Smart Home America, a nonprofit organization that provides technical assistance on resilience to developers and state and local governments, 33 states have been considering or implementing similar grant programs to help homeowners upgrade their homes against natural disasters. For example, in 2024 Oklahoma established a similar program as part of the Strengthen Oklahoma Homes Act.
Regulatory Reform
Some states also have sought to improve insurance availability and affordability by reforming their regulatory frameworks. For example, California announced a strategy to reform its regulation of the insurance industry in response to insurers withdrawing from the California market or reducing their underwriting activity due to large wildfire-related losses and the state’s regulatory environment (see fig. 15). The California FAIR Plan has provided more insurance as more homeowners have been unable to obtain insurance in the private market.
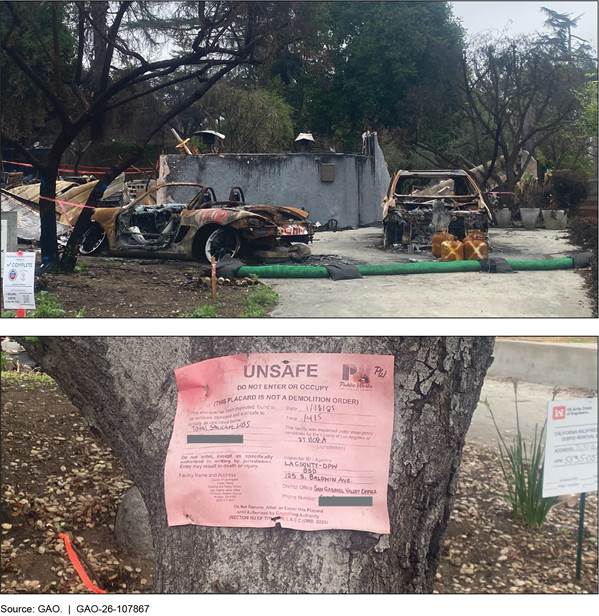
In response, the California Department of Insurance announced the Sustainable Insurance Strategy in September 2023. This package of reforms will allow insurance companies to use catastrophe models (which assess potential financial losses from major disasters) in the underwriting process and to pass the net cost of reinsurance to consumers. These practices previously were not permitted in the state, although they were allowed in most other states. In return, insurers must agree to underwrite a certain share of policies in areas at high risk for wildfire designated by the state’s insurance commissioner. As of September 2025, the reforms had not been fully implemented, so their impact remains unknown.
Litigation Reform
Some states also have tried to help insurers curb what they perceive as excessive legal costs resulting from lawsuits filed against insurers. Such lawsuits, backed by third-party financing, can raise premiums by increasing insurers’ costs.[43]
For example, in 2022, Florida enacted reforms aimed at reducing legal costs.[44] These included limiting attorneys’ ability to collect fees double or triple their standard hourly rate in successful cases. The state also addressed a common arrangement in which contractors pressured homeowners to assign their insurance benefits to the contractor, allowing the contractor to sue insurers directly.[45] Insurance prices in Florida continued to rise in 2023 and 2024 (the most recent available state data), but property insurers’ underwriting losses appeared to decline significantly.
What Options Exist for the Federal Government to Improve the Availability and Affordability of Homeowners Insurance?
The legal responsibility for ensuring that insurance rates are not excessive and insurers remain solvent generally rests with state regulators. As discussed previously, some states have undertaken their own reform and mitigation efforts. The federal government also might help improve the availability or affordability of homeowners insurance by supporting state mitigation programs, offering financial incentives, or exploring other policy options. In the past few years, a number of congressional bills were introduced that could affect the availability or affordability of homeowners insurance.
In the discussion that follows, we identify some of the options that the federal government might take, present the results of a questionnaire distributed to stakeholder groups with a range of views, and provide examples of how GAO’s prior work may provide guidance or context for the implementation of these options. This is not a comprehensive list of all possible options. Moreover, the options below reflect a range of priorities, advantages, disadvantages, trade-offs, taxpayer costs, and potential effectiveness, and as such, we do not take a position on any of them.
We identified eight options the federal government could consider to improve the availability and affordability of homeowners insurance (see table 1). We identified these options through our review of industry and government reports (including our own work); interviews with state regulators, consumer advocacy organizations, and insurance industry associations; and our analysis of recently introduced legislation.
Table 1: Federal Policy Options That May Improve the Availability and Affordability of Homeowners Insurance
|
Option |
Description |
|
1. Means-based federal tax deduction for homeowners insurance premiums |
Congress could pass a bill allowing homeowners who meet certain income thresholds to deduct all or part of their homeowners insurance premium from their federal gross income. |
|
2. Means-based federal tax deduction or tax credit for mitigation expenses |
Congress could pass a bill allowing homeowners who meet certain income thresholds to deduct all or part of certain allowable expenses to mitigate their homes against disaster from their federal gross income. For example, Congress might create a tax credit or a catastrophe savings account. |
|
3. Federal government reinsurance programa |
Congress could pass a bill creating a federal reinsurance program and allowing insurance companies to purchase reinsurance at actuarially sound rates. |
|
4. Parametric community-based catastrophe insuranceb |
The federal government could pay for a fixed share of community-based catastrophe insurance policies that communities at high risk could purchase. These policies would pay out to the community based on parametric criteria and could be used to provide additional funds for disaster relief and rebuilding. |
|
5. Improving infrastructure |
The federal government could provide additional funding for infrastructure projects that could reduce the likelihood or extent of damage from a catastrophe in vulnerable areas. |
|
6. Federal government property and casualty insurance program |
Congress could authorize a program similar to the National Flood Insurance Program.d Insurers would write policies and pass the premiums to the government. Insurers would bear no risk and the government would pay claims. |
|
7. Subsidizing improvements to building codes, risk mapping, and land use planning |
The federal government could provide block grants to states which they would distribute to local communities to adopt and enforce building codes, pay for risk mapping, or improve land use planning. |
|
8. Changing federal tax treatment of private insurers’ reservesc |
The federal government could allow insurers to deduct from their taxable incomes premiums set aside as reserves against claims from future catastrophic events. |
Sources: GAO analysis of industry and government reports (including our own work); interviews with state regulators, consumer advocacy organizations, and insurance industry associations; and recently introduced legislation. | GAO‑26‑107867
aReinsurance is insurance for insurance companies.
bParametric insurance is property insurance that pays a sum when certain catastrophe-related criteria in a region are met, regardless of actual damage to a particular area or structures.
cUnder the current tax code, companies can only deduct reserves after a loss is incurred, not when they are set aside.
dThe National Flood Insurance Program is operated by the Federal Emergency Management Agency and provides flood insurance to residential and commercial customers in participating communities.
What Are Stakeholders’ Views on These Federal Policy Options?
Stakeholders we surveyed expressed the strongest support for options that promote mitigation, but held mixed or less favorable views of options involving direct federal insurance programs or changes to tax policy.
To gather these views, we sent questionnaires to entities in four stakeholder groups. We received replies from 10 stakeholders—three state insurance regulators, four insurance industry associations, and three consumer advocacy organizations, for a 67 percent response rate.[46]
We asked the stakeholders to assess the eight federal policy options described in table 1, using the following five criteria.
1. Will the action increase the availability of homeowners insurance?
2. Will the action improve the cost/affordability of homeowners insurance?
3. Will the action result in a homeowner premium that reflects the risk of loss?
4. Will the action encourage equitable participation in the homeowners insurance market?
5. Will the action limit costs to the federal government?[47]
Support for Mitigation-Focused Financial Tools
As noted earlier, some states have been helping homeowners make their properties more resilient or are considering doing so. Three of the financial tools also would add federal mitigation options:
· A means-based federal tax deduction or tax credit for mitigation expenses (option 2)
· Additional federal funding for infrastructure improvement projects that could reduce the likelihood or extent of damage from disasters (option 5)
· Federal block grants to states to subsidize community updates to building codes, conduct risk mapping, or improve land use planning (option 7)
Respondents across all three groups generally agreed that these mitigation-focused options could improve the availability and affordability of homeowners insurance, promote equitable access to insurance, and potentially reduce future federal disaster costs (see fig. 16).
Stakeholder opinions on whether mitigation-focused federal options could improve availability or affordability of homeowners insurance
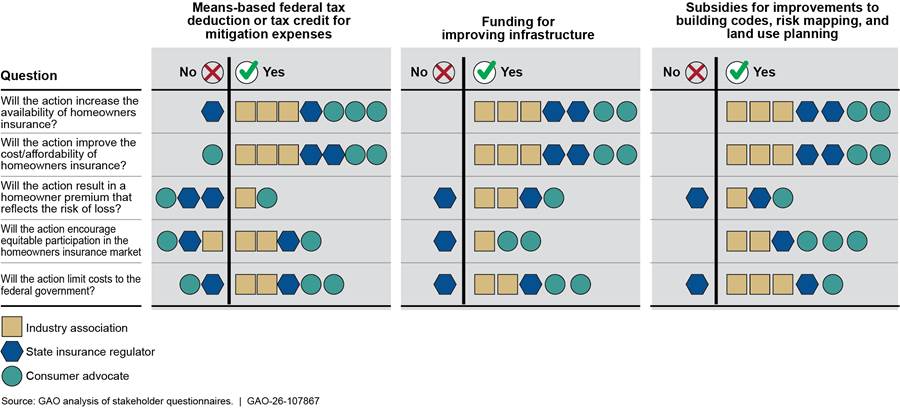
Note: Responses indicating a policy “probably would” or “possibly would” have this effect are coded “yes,” and responses indicating a policy “probably would not” or “possibly would not” have this effect are coded “no.” Not all of the 10 respondents expressed an opinion on all policies or all criteria.
Respondents generally agreed that mitigation-focused financial tools and options might lower federal disaster response costs in future. Some offered suggestions for strengthening these options.
· Insurer discounts for mitigated properties: Consumer advocacy organizations and one state regulator recommended legally requiring insurers to provide discounts on mitigated properties, as Alabama does. Another regulator observed that premiums largely reflect insurers’ projection of future claims across an entire state, which may not capture mitigation actions taken at individual properties.
· Tax credit versus deduction: An insurance industry association suggested that a tax credit would be more equitable than a deduction, because it would benefit taxpayers whether or not they itemized. But the same association and a state regulator noted that the need to pay for mitigation improvements up front might deter some low- and middle-income homeowners from taking advantage of such a tax credit.
· Infrastructure investments: One insurance industry association said the federal government would need to carefully select which infrastructure projects to fund based on disaster risk to improve insurance availability. Another insurance industry association suggested that it would be more effective to prioritize communities with higher risk of natural disaster and lower capacity to make the improvements themselves.
Mixed Views on Direct Federal Insurance and Reinsurance Programs
Consumer advocates and some state departments of insurance indicated that the two options that involved the federal government directly providing insurance or reinsurance products (options 3 and 6) could increase availability and affordability (see fig. 17). However, insurance industry associations disagreed. Insurance industry associations and state regulators felt such programs could impose costs on the federal government.
Stakeholder opinions of whether federal insurance programs could improve availability or affordability of homeowners insurance
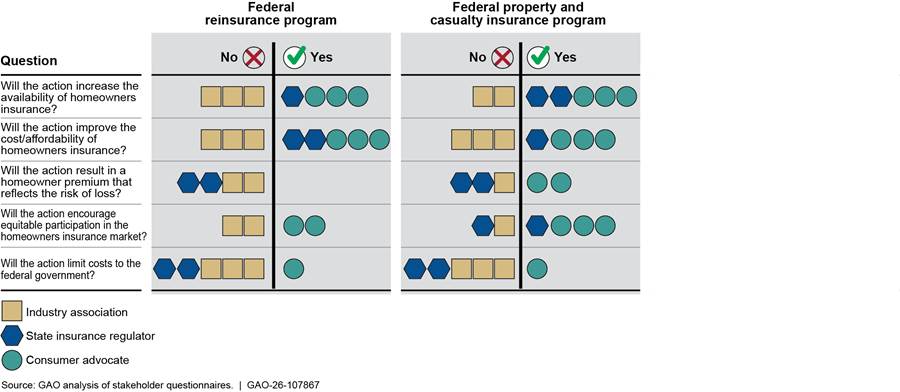
Note: Responses indicating a policy “probably would” or “possibly would” have this effect are coded “yes,” and responses indicating a policy “probably would not” or “possibly would not” have this effect are coded “no.” Not all of the 10 respondents expressed an opinion on all policies or all criteria.
Some stakeholders provided more details on the reasons that caused them to approve or disapprove of these programs.
· Similarities to the National Flood Insurance Program: One state regulator, two consumer advocacy organizations and two insurance industry associations said a federal property and casualty program should not be structured like the National Flood Insurance Program, although for different reasons. The regulator and one association said such a program was likely to result in large costs for the federal government. The consumer advocacy organizations noted that the program pays commissions to insurers and independent adjusters and said this reduces the efficiency of the program. One insurance industry association agreed that this layer of administrative costs is not efficient. Two insurance industry associations said that political pressure to keep rates low in such a program might undercut the private market.
· A government program might reduce prices: A regulator noted that because the government would not have to make a profit, it might price reinsurance at lower rates than the private market. A consumer advocacy organization agreed, stating that these lower costs could be passed on to consumers and that access to such reinsurance could be conditioned on insurers agreeing to underwrite more policies in riskier areas. Another state regulator further noted that reinsurance cost is a potential rating factor in their state and a federal reinsurance program might lower consumers’ premiums.
· Reinsurance is currently available: One state regulator and one insurance industry association said that federal insurance programs should be a last resort—used only when private insurers were unwilling or unable to provide insurance. The regulator did not believe that to be the case with reinsurance in their state. Three insurance industry associations and one state insurance regulator stated that reinsurance is already available at actuarially sound rates.
· No offsetting global risk: However, one insurance industry association cautioned that because a majority of catastrophic losses worldwide occur in the United States, creating a federal reinsurance program based only on U.S. risk rather than global risk would not improve affordability, because it would not be able to offset U.S. losses with premium revenue from outside the United States, the way global reinsurers do.
Limited Support for Other Financial Tools
Respondents had more mixed responses to the remaining financial tools—a tax deduction for insurance premiums, parametric insurance policies, and changes to tax treatment for insurer reserves (options 1, 4, and 8). For instance, respondents generally believed a means-based federal tax deduction for homeowners insurance premiums would improve the affordability of homeowners insurance premiums, but they did not think it would increase availability (see fig. 18).
Stakeholder opinions of whether other federal policy options could improve availability or affordability of homeowners insurance
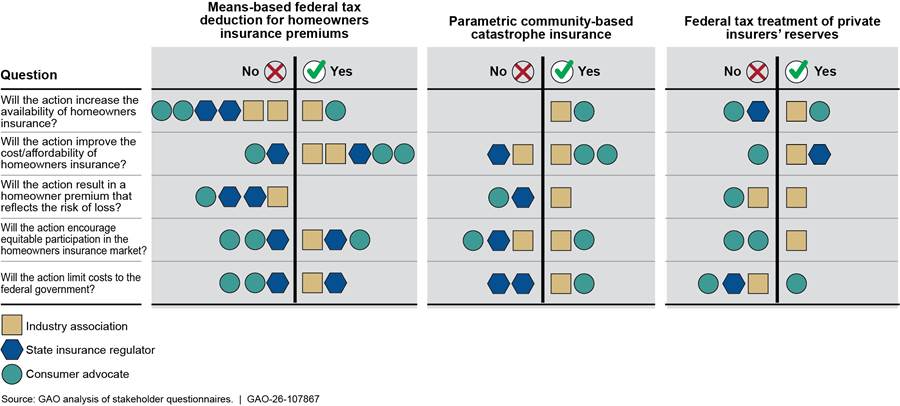
Notes: Responses indicating a policy “probably would” or “possibly would” have this effect are coded “yes,” and responses indicating a policy “probably would not” or “possibly would not” have this effect are coded “no.” Not all of the 10 respondents expressed an opinion on all policies or all criteria.
· Tax deduction for premiums. Most respondents said a tax deduction for homeowners insurance premiums might improve affordability. But they also said it would not increase availability. One state regulator said such a deduction might discourage homeowners from taking measures to prevent losses to their property. A consumer advocacy organization stated that it would effectively function as a subsidy to insurance companies and create an incentive for them to overcharge.
· Parametric insurance. Some respondents did not express any opinion on parametric insurance. Those who did generally stated that parametric insurance provided to communities would improve the availability and affordability of homeowners insurance. In addition, one state regulator and one consumer advocacy organization said that it could improve the ability of communities to recover from natural disasters.
· Tax treatment of reserves. One state regulator said that reducing insurers’ tax liability by changing the tax treatment of their reserves could improve affordability. However, they agreed a change would have little impact on availability. Two insurance industry associations said that insurers might choose to use these reserves for purposes other than increasing availability and affordability, such as increasing profits.
What Does Prior GAO Work Say About These Options?
GAO’s prior work offers some insights into these options. In general, while mitigation-focused approaches can provide benefits that exceed their costs, they should be carefully implemented to ensure they are efficient. Federal insurance programs can improve availability of coverage when the private market is unable to do so, but they should be designed to limit federal financial exposure. Finally, as with all tax expenditures, these options should be carefully examined to ensure they achieve their intended purpose, are equitable, and are rigorously evaluated.
Mitigation-Focused Financial Tools
The federal government has provided a wide variety of mitigation grants through agencies such as the Federal Emergency Management Agency (FEMA) and the Department of Housing and Urban Development. These programs require up-front costs, but they may accrue benefits over time that exceed those initial expenditures, according to GAO’s Disaster Resilience Framework.[48]
Mitigation grants also may reduce federal disaster spending. During fiscal years 2015–2024, the federal government appropriated at least $448 billion for disaster assistance. In 2025, GAO added improving the delivery of federal disaster assistance to its High Risk List.[49] Increasing the resilience of homes and communities could reduce future federal disaster costs, although the potential savings are difficult to quantify.
However, federal mitigation grant processes can be inefficient. For example, our 2021 review of four FEMA grant programs for hazard mitigation found that state and local officials reported challenges with complex and lengthy application processes.[50] We recommended that FEMA develop a plan to assess and streamline grant processes in these programs and create a centralized inventory of resources. FEMA implemented these and four other related recommendations in 2022.
Direct Federal Insurance Programs
The federal government has, at times, created insurance programs when private insurers were unable or unwilling to cover certain risks. As we previously reported, direct federal insurance programs offer both opportunities and challenges.
For instance, in 1968, the government created the National Flood Insurance Program after determining that the catastrophic nature of flooding made it unprofitable for private insurers to profitably provide flood insurance at affordable rates. Similarly, after the terrorist attacks of September 11, 2001, insurers generally stopped covering losses resulting from terrorist attacks. In response, Congress established the Terrorism Risk Insurance Act Program to ensure continued availability and affordability of such coverage.
However, these programs can struggle to operate in a financially sound manner. For example, the National Flood Insurance Program has been on our High Risk List since 2006, in part because it has been unable to balance the goals of affordability and actuarial soundness. Because the program historically charged rates that do not reflect the true risk of flood loss, it has had to borrow repeatedly from Treasury to pay claims. We have stated that the program is unlikely to be able to repay the debt it has incurred and made several recommendations to Congress to address this issue.[51]
In the case of the terrorism insurance program, the federal government gradually reduced its fiscal exposure—for instance, by increasing the threshold that triggers federal loss sharing.[52]
Other Financial Tools
Tax expenditures—such as the deduction proposed in option 1 and the change in tax treatment of insurers’ reserves proposed in option 8—can incentivize taxpayers to undertake particular activities, but they represent a substantial financial commitment. We previously observed that policymakers should assess tax expenditures based on several criteria, including whether the expenditure achieves its purpose, whether it is equitable, its consequences for the federal budget, and how it can be evaluated.[53]
Parametric insurance is a relatively new concept compared to traditional homeowners insurance. Payment on a parametric policy is triggered by the occurrence of a defined event, such as a flood or hurricane, and the amount of the payment is predetermined. This allows for fast payouts, but because the payment is not based on actual losses, it may not fully compensate for them.
Some U.S. jurisdictions have begun to experiment with parametric insurance for natural disasters. For example, in 2023, New York City created a pilot program providing up to $15,000 in parametric-based assistance to eligible households following a qualifying flood event. This pilot was funded by the National Science Foundation and Department of Homeland Security.
While we have not previously reported on the potential advantages and disadvantages of parametric policies in the context of natural disasters, we examined their potential use for pandemic insurance.[54] We found that many stakeholders agreed that parametric insurance policies could be appropriate in the context of pandemic insurance, because pandemics, like natural disasters, can affect large numbers of people at the same time.
However, stakeholders also identified challenges, including the following:
· Creating independent, objectively measurable parametric triggers could be difficult.
· Processing large numbers of claims simultaneously could exceed insurer capacity or expose insurers to significant legal or reputational risks.
Finally, availability and affordability challenges faced by many homeowners underscore the importance of exploring tools that could improve the affordability and increase the supply of homeowners coverage. Our prior work, as outlined above, provides criteria for assessing such efforts and can help anticipate challenges future programs may face, including the need to limit costs to the federal government and deliver funds efficiently.
Agency Comments
We provided a draft of this report to the Federal Insurance Office for review and comment. The Federal Insurance Office provided technical comments, which we incorporated as appropriate.
As agreed with your office, unless you publicly announce the contents of this report earlier, we plan no further distribution until 30 days from the report date. At that time, we will send copies to interested congressional committees and the Director of the Federal Insurance Office. In addition, the report will be available at no charge on the GAO website at www.gao.gov.
If you or your staff have any questions about this report, please contact me at CackleyA@gao.gov. Contact points for our Offices of Congressional Relations and Public Affairs may be found on the last page of this report. GAO staff who made key contributions to this report are listed in appendix V.
Sincerely,

Alicia Puente Cackley
Director, Financial Markets and Community Investment
This report examines (1) how homeowners insurance is priced and regulated; (2) trends in availability, affordability, and profitability; and (3) state policy responses and federal options to increase insurance availability and affordability.
To assess how insurers calculate premiums and how states regulate them, we reviewed a nongeneralizable sample of 18 rate filings, including rate manuals demonstrating how individual premiums are derived, from 12 insurers in six states (California, Illinois, Louisiana, Maine, Missouri, and South Carolina). We selected these states to reflect a range of geographies, regulatory environments, levels of affordability of homeowners insurance, and disaster risks. The rate filings we reviewed represented the largest insurers in each state by amount of direct written premium, the total amount of an insurer’s premiums written, not including amounts ceded to reinsurers, in 2024. Together, they comprised at least 50 percent of direct written premium of the top 10 insurers in each state.
In a separate analysis, we downloaded 12,999 rate filings from 2020 through 2024 from the A.M. Best platform, which offers rate filings for property and casualty policies and credit ratings for insurance companies, among other information.[55] Together, these represented every unique rate filing during that period that requested a rate change, for all 50 states and the District of Columbia. We analyzed these filings to examine how state regulatory environments can influence time to approval. To assess the reliability of these data, we checked submission and disposition dates for outliers, obvious errors, and missing values. We found these data to be sufficiently reliable for analyzing the time to approve insurer rate filings across states.
To assess trends in availability and affordability of homeowners insurance, we analyzed estimated premium data from First Street Technology.[56] This national dataset estimates premiums at the property level using insurer rate filings, adjusted for year built and replacement cost. These data cover all 50 states and the District of Columbia and 29,882 zip codes, and span from 2019 through 2024.
To validate these data, we compared them to actual insurance premiums in Freddie Mac and Fannie Mae’s Uniform Closing Database, data from the National Association of Insurance Commissioners’ (NAIC) Property and Casualty Market Intelligence Data Call, and data from the State of California. We also checked these data for outliers, obvious errors, and missing values.[57] We found these data to be sufficiently reliable for analyzing trends in homeowners insurance prices over time and across states and zip codes. The conclusions drawn from the First Street data are our own and do not reflect the views of First Street Technology. First Street Technology is not responsible for and was not involved in analyzing and preparing the results reported herein.
Using these data, we developed two econometric models: one estimating the cost of homeowners insurance premiums, and another estimating the market share of state insurers of last resort as a proxy for the availability of private insurance. For more information on these models, see appendixes II and III.
To assess the profitability of homeowners insurance, we analyzed data from A.M. Best. Specifically, we used A.M. Best’s Aggregates & Averages premium data and loss, expense, and policyholder dividend ratios to calculate annual line of business underwriting profitability for 1995–2024. Our calculation of underwriting profitability excluded other income and expenses, which had a negligible effect on our calculations, and excluded federal flood line reporting by insurers that participate in the National Flood Insurance Program’s Write Your Own program. To assess the reliability of these data and our calculations, we identified and analyzed the significance of any differences in our calculated loss and loss adjustment expense, underwriting expense, and policyholder dividend ratios and those reported in A.M. Best’s Market Segment Reports for the homeowners multiperil line. We obtained 2024 investment holdings, investment income and gains, and underwriting profitability from A.M. Best’s Aggregates & Averages Annual Statement and Insurance Expense Exhibit. We also interviewed NAIC and A.M. Best officials and reviewed documentation on their data validation processes over insurer financial data. We found these data to be sufficiently reliable for analyzing trends in insurer profitability over the past 30 years.
To identify state policy responses, we reviewed state reports, including reports from state insurance regulators, to better understand how states regulate insurance. We also interviewed insurance regulators in Alabama, California, Illinois, and Washington, as well as representatives of three residual insurance plans—the California Fair Access to Insurance Requirements (FAIR) Plan, the North Carolina Joint Underwriting Association and North Carolina Insurance Underwriting Association, and the Illinois FAIR Plan Association. We selected these regulators and plans to represent a variety of geographic areas and regulatory regimes.
To identify potential federal policy options, we reviewed federal reports, including our own work and reports by the Congressional Budget Office and Congressional Research Service; legislative proposals introduced in the 117th, 118th and 119th Congresses through April 2025 mentioning homeowners insurance; and reports from insurance industry associations and consumer advocacy groups.[58] We included in our analysis options that were mentioned in at least two separate sources, such as a bill introduced in Congress and an industry association report.
In addition to the interviews noted above, we interviewed officials of the Federal Insurance Office (a division of Treasury with the authority to monitor the insurance sector), and two insurance companies, Liberty Mutual and Mercury Insurance. We also interviewed representatives of NAIC, three consumer advocacy organizations (Consumer Federation of America, Consumer Watchdog, and United Policyholders), and four insurance industry associations (American Property Casualty Insurers Association, National Association of Mutual Insurance Companies, Wholesale and Surplus Insurers Association, and the Reinsurance Association of America). We selected the consumer and insurance organizations because they had issued prominent reports on homeowners insurance or previously provided GAO with perspectives on insurance. We conducted site visits to four states: Alabama, California, Illinois, and Washington. We visited those states to interview state departments of insurance and other stakeholders. We chose those states because either affordability or availability in those states was impacted, and because they face a variety of natural hazards. We also visited the Insurance Institute for Business & Home Safety in South Carolina to learn about ways homeowners can mitigate damage from catastrophic storms.
We invited NAIC, state regulators, residual insurance plans, insurance industry associations, and consumer advocacy organizations to respond to a structured questionnaire about policy options to improve the availability and affordability of homeowners insurance. Of the 15 questionnaires sent, we received 10 responses—from three state regulators, four insurance industry associations, and three consumer advocacy organizations—for a response rate of 67 percent.
We conducted two pretests of our draft questionnaire with officials at the Washington State Office of the Insurance Commissioner and the American Property Casualty Insurance Association. We used these pretests to help clarify and refine our questions, develop new questions, and identify any potentially biased questions, and revised the questionnaire accordingly. The responses represent the views only of the organizations that participated and are not generalizable to all insurance industry stakeholders.
We conducted this performance audit from October 2024 to February 2026 in accordance with generally accepted government auditing standards. Those standards require that we plan and perform the audit to obtain sufficient, appropriate evidence to provide a reasonable basis for our findings and conclusions based on our audit objectives. We believe that the evidence obtained provides a reasonable basis for our findings and conclusions based on our audit objectives.
This appendix describes the multivariate regressions we used to test the relationship between insurance premiums, the cost and risk of natural disasters, and approval times for insurer premium increases.
Variables
Our dependent variable was the annual average estimated premium at zip-code level from 2019 through 2024, obtained from First Street Technology.[59] We determined that the zip-code level was appropriate for the analysis because insurers often use zip codes in their pricing decisions. We obtained average zip-code level risk scores for wildfire, flood, and wind to approximate the probability and expected severity of natural disasters.[60] We classified these scores into three categories: minor, major, and severe/extreme.[61]
In addition, we included two types of state-level variables that approximate expected probability and severity of disasters:
· The annual economic damages of billion-dollar natural disasters of a state (National Oceanic and Atmospheric Administration, 2018–2024), and
· The annual average loss ratio of the top 10 insurance companies in a state (A.M. Best, 2018–2024).[62]
Because greater economic damages from a disaster tend to increase underwriting losses, we included these variables one at a time as a robustness check. We expected insurers to revise their expectations of the probability and severity of future damages if a state experienced greater economic damages or underwriting losses in the past, which would lead to higher premiums in the future.
Based on our review of rate filings from all 50 states and the District of Columbia for 2020–2024, we calculated the median number of days state regulators took to approve rate changes. We also included the state’s regulatory classification as a robustness check in lieu of this approval-time variable.[63]
Moreover, we included zip-code median household income, population size, and percent of White-only population to control for both the ability of homeowners to afford homeowners insurance and the size of the market, which may be correlated with expected losses. Data for these variables are available as 5-year estimates from the Census Bureau’s American Community Survey (2019–2023).[64]
According to some of our interviews and studies we reviewed, inflation—particularly rising construction costs—also may contribute to premium increases. To account for this, we adjusted annual estimated premiums to calendar year 2024 dollars using the Consumer Price Index for All Urban Consumers and included state annual hourly wage (inflation-adjusted) for the homebuilding industry from 2019 through 2024.
Regression Results
The analysis covered 50 states and the District of Columbia, and approximately 29,882 zip codes for the period 2019–2024.[65] Because we adjusted the premiums from 2019 through 2023 to calendar year 2024 dollars, the percentage increases reported below represent increases above inflation. In addition, our analysis held the level of coverage and deductibles equal to isolate the effects of other factors, using a national dataset of estimated premiums based on insurer rate filings for the similar deductible and level of coverage.
We found that homeowners insurance premiums were significantly associated with anticipated losses from natural disasters (such as hurricanes and wildfires), after accounting for economic factors that included local population size, household income, and inflation.
Main Results
To translate the estimated coefficients into meaningful dollar values, we estimated the marginal effects of each variable. Table 2 summarizes the estimated premiums from our regression analysis when varying the level of each risk one at a time, while holding other covariates constant at their means.
|
|
Increase over preceding level |
||||
|
Type of risk |
Level of risk |
Premium |
Confidence interval (dollars) |
Percent |
Dollars |
|
Wind |
Minor to moderate |
$1,941 |
($1,931, $1,951) |
— |
— |
|
|
Major |
$ 2,233 |
(2,208, 2,258) |
+15% |
+$292 |
|
|
Severe or extreme |
$ 3,527 |
(3,461, 3,593) |
+58 |
1,294 |
|
Wildfire |
Minor to moderate |
$2,074 |
(2,064, 2,085) |
— |
— |
|
|
Major |
$2,296 |
(2,269, 2,323) |
+11 |
+222 |
|
|
Severe or extreme |
$2,477 |
(2,424, 2,530) |
+8 |
+181 |
|
Flood |
Minor to moderate |
$2,113 |
(2,104, 2,122) |
— |
— |
|
|
Major |
$ 2,263 |
(2,183, 2,342) |
+7 |
+149 |
|
|
Severe or extreme |
$ 2,813 |
(2,693, 2,933) |
+24 |
+550 |
— = not applicable
Sources: GAO analysis of data from First Street Technology, Census Bureau, National Oceanic and Atmospheric Administration, A.M. Best, Bureau of Labor Statistics, and National Association of Insurance Commissioners. | GAO‑26‑107867
Notes: The estimated premiums represent the marginal effects from our regression by varying the level of risks while holding all other explanatory variables equal. These variables were (1) state economic damage from billion-dollar disasters, (2) state median days to approve rate filings, (3) state hourly wage in the homebuilding industry, (4) zip code-level variables of population, (5) median household income, (6) zip-code percentage of White-only population, (7) zip-code median year homes were built, and (8) year fixed effects. To control for state-level fixed effects, we included state averages of variables (1) and (3). We also controlled for flood risk in our model, although homeowners insurance generally does not cover flood damage, because hurricanes can cause wind and flood damage.
Table 3 summarizes the estimated premiums from our regression analysis when varying the level of state-level variables one at a time, while holding other variables constant at their means.
Table 3: Estimated Premiums by State-Level Variables on Regulation and Recent Damages from Natural Disasters from Regression
|
|
Increase over preceding level |
|
||||
|
Type of variables |
Level of variables |
Premium |
Confidence
interval |
Percent |
Dollars |
|
|
Median approval time |
30 days |
$2,098 |
($2,088, $2,107) |
— |
— |
|
|
|
60 days |
$2,131 |
(2,122, 2,140) |
2% |
$33 |
|
|
|
90 days |
$2,164 |
(2,153, 2,175) |
2% |
$33 |
|
|
Recent economic damages from natural disaster |
19 billion |
$1,973 |
(1,964, 1,983) |
— |
— |
|
|
|
25 billion |
$2,069 |
(2,061, 2,078) |
5% |
$96 |
|
|
|
35 billion |
$2,239 |
(2,227, 2,252) |
8% |
$170 |
|
|
Average loss ratioa |
0.65 |
$2,097 |
(2,087, 2,106) |
— |
— |
|
|
|
0.73 |
$2,170 |
(2,161, 2,180) |
4% |
$74 |
|
|
|
0.90 |
$2,336 |
(2,320, 2,351) |
8% |
$165 |
|
— = not applicable
Sources: GAO analysis of data from First Street Technology, Census Bureau, National Oceanic and Atmospheric Administration, A.M. Best, Bureau of Labor Statistics, and National Association of Insurance Commissioners. | GAO‑26‑107867
aAverage loss ratio was used in lieu of recent economic damage from natural disaster as a robustness check
Other Socioeconomic Characteristics
We also included the following variables in our regression: annual hourly wage in the home building industry, median household income, population, percent of White-only population, and median age of home construction. We found statistically significant and positive associations between premium and higher median household income and greater population size. For example, a 10 percent increase in median household income is associated with about an 0.9 percent increase in premium, and a 10 percent increase in population size is associated with an 0.3 percent increase in premium.
Robustness Check
We estimated several variations of the models. Our main findings about the effects of risk remained consistent across different models. For example, we estimated the additional effect of risk for each year and found that zip codes with extreme risk for wind and wildfire had a consistently greater rate of increase in premiums than zip codes with major risk (the next lower category) for these perils each year.
We also used a binary variable to indicate a state that requires prior approval for insurance rate increases in lieu of regulatory approval time. We found that a prior approval state had lower premiums on average than a state without prior approval holding other variables constant.
Limitations of the Regression Analysis
Our findings have several limitations. First, we did not observe either actual premiums or actual quotes generated from insurers. Instead, our results reflect associations based on estimated premiums for a standardized homeowners insurance policy across the nation, using similar deductible and coverage levels. Although the estimated premiums we used were different from the average premium per policy collected for 2018-2022 through the National Association of Insurance Commissioners Property and Casualty Market Intelligence Data Call (as summarized and published by the Federal Insurance Office), their correlation coefficient was 0.66.
Second, insurers consider a detailed list of property-specific rating factors, and some companies also may consider characteristics of property owners in some states. But our analysis focused on zip-code level variables related to those rating factors.
Third, our multivariate regression analysis revealed statistical associations between premiums and explanatory variables, but it was not designed to estimate causal relationships.
This appendix describes our methods for analyzing the relationship between Fair Access to Insurance Requirements (FAIR) and beach plan market share and three factors: (1) the economic costs of recent natural disasters, (2) the risk of natural disasters due to wildfire, and (3) approval times for insurer premium change requests. To conduct this analysis, we used state-level data on FAIR and beach plan market share in 32 states that operate one or both of these insurance programs. In addition, we used zip-code level data on FAIR plan policies in California from 2020 through 2023, because California provides more granular data on FAIR plan use. The following sections describe our definitions, data sources, and methodology.
State-Level Regression
We ran a multivariate regression with FAIR or beach plan market share as the dependent variable. These data come from the Property Insurance Plans Service Office, an association representing FAIR and beach plans, for 2014–2023, the most recent years available. The data measure the sum of earned premiums for FAIR or beach plans, divided by the sum of earned premiums for all relevant plans, adjusted by the association for accurate comparison.
Some states (Mississippi, North Carolina, and Texas) have both FAIR and beach plans. For these states, we used market share of beach plans only, which was always higher than market share of FAIR plans. For this reason, our data underestimate total plan usage in these states. The data are not restricted to homeowners insurance. Instead, they reflect the combined market share of homeowners insurance, commercial multiperil insurance, and fire and allied lines of insurance.
We included annual economic damages of billion-dollar natural disasters of a state as an explanatory variable in this regression. These data come from the National Oceanic and Atmospheric Administration. We used the state-level average economic cost of these disasters, from 2014 through 2023. In addition, based on our review of 2020–2024 rate filings, we calculated the median duration (number of days) that it took for a state regulator to approve rate increases. For a robustness check, we substituted the state regulatory classification for this approval-time variable.
Our results are shown in table 4.
Table 4: Results of Multivariate Regression Analysis of State FAIR or Beach Plan Market Share, 2014–2023
This map displays median time (in calendar days) from insurer submission of a rate filing to regulatory approval across states
|
Characteristics |
Market share
of FAIR or |
|
Average cost of natural disasters, 2014–2023 |
0.597*** (0.061) |
|
Median approval time (60 days) |
0.511*** (0.097) |
|
Year |
-0.184 (0.141) |
|
Year2 |
0.013 (0.012) |
|
Constant |
-0.289 (0.381) |
|
Observations |
320 |
|
R-squared |
0.272 |
Sources: GAO analysis of data from the Property Insurance Plans Service Office, National Oceanic and Atmospheric Administration, and GAO analysis of insurer rate filings. | GAO‑26‑107867
Note: Statistical significance is denoted by the following significance levels: *** p<0.01, ** p<0.05, and * p<0.1. Standard errors are in parentheses. Market share of Fair Access to Insurance Requirements (FAIR) or beach plans represents the sum of earned premiums for FAIR or beach plans, divided by the sum of earned premiums for all relevant plans, adjusted by the Property Insurance Plans Service Office for accurate comparison.
Zip Code-Level Regression
We also ran a multivariate regression with California zip-code share of housing units on the FAIR plan as the dependent variable. The California FAIR Plan Association provides data on the number of residential policies enrolled in the plan for each zip code. We combined these data with American Community Survey data on the number of housing units per zip-code tabulation area, to calculate the share of housing units in the California FAIR plan by zip code. We used American Community Survey data to calculate the share of housing units in each zip code with a mortgage. We included this variable and median home value by zip code, also from the American Community Survey, as control variables in our regression.
We included average zip-code level risk scores for wildfire as an explanatory variable in this regression. These data come from First Street Technology. We categorized the risk scores as minor, major, or severe/extreme.[66] In addition, we included zip-code level flood risk data, also from First Street Technology.
Our results are shown in table 5.
Table 5: Results of Multivariate Regression Analysis of California Share of Housing on FAIR Plan, 2020–2023
|
Characteristics |
Share of housing units on FAIR plan |
|
Major fire risk |
0.029*** (0.003) |
|
Severe or extreme fire risk |
0.116*** (0.003) |
|
Median home value (hundred thousand $) |
0.001*** (0.0003) |
|
Major flood risk |
0.025*** (0.008) |
|
Severe or extreme flood risk |
0.041*** (0.012) |
|
Percent of housing units with mortgage |
-0.116*** (0.008) |
|
Year |
0.008*** (0.001) |
|
Constant |
-15.484*** (2.102) |
|
Observations |
6,259 |
|
R-squared |
0.234 |
Sources: GAO analysis of data from California FAIR Plan Association, First Street Technology, and American Community Survey. | GAO‑26‑107867
Note: Statistical significance is denoted by the following significance levels: *** p<0.01, ** p<0.05, and * p<0.1. Standard errors are in parentheses. We estimated the share of housing units on the Fair Access to Insurance Requirements (FAIR) plan by combining California FAIR Plan Association data on the number of residential policies enrolled in the FAIR plan in each zip code with American Community Survey data on the number of housing units per zip code tabulation area. We used First Street data on property-level risk to calculate average risk scores for each zip code and reclassify zip codes into three categories: 1-4, minor to moderate risk; 5–6, major risk; and 7–10, severe or extreme risk.
Data and Model Limitations
Although the data quality is sufficiently reliable for the purposes of our analysis, there are some limitations:
Market share data. Property Insurance Plans Service Office data on FAIR and beach plan market share combine homeowners insurance, commercial multiperil insurance, and fire and allied lines of insurance. As a result, it is possible that there are trends in the commercial multiperil, fire, or allied insurance markets that affect our results. Because our data underestimate total residual insurance plan usage in states with both FAIR and beach plans, we may be underestimating the association between FAIR or beach plan usage and natural disasters or approval times. In addition, a number of states do not have FAIR or beach plans, and so these states were not included in our analysis.
Natural disaster data. The National Oceanic and Atmospheric Administration billion-dollar disaster data we use only cover natural disasters with an estimated cost of $1 billion or more. Therefore, our results should be interpreted as the association between more costly natural disasters and insurance availability, not the association between all disasters and insurance availability.
Approval-time data. Our data on approval times cover 2020–2024 and do not capture the full period of our state-level analysis. It is possible that approval wait times before 2020 may differ from those in later years and thus are not fully reflected in our explanatory variable.
Share of housing units on the California FAIR plan. The California FAIR Plan Association provides the number of residential policies enrolled in the plan. To compare across zip codes, we normalized these data using American Community Survey data on the number of housing units per zip-code tabulation area. Therefore, our metric is an estimate and not an exact measure of the percent of eligible properties on the FAIR plan.
Model specification. Our models are not able to identify causal relationships between the variables in our analysis. In addition, because some variables we include are at the state or zip-code level, we could not include state or zip-code fixed effects in our models. As a result, our models may not capture some state- or zip-code-level differences.
Appendix IV: Determination of Homeowners Insurance Premiums and Review by State Insurance Regulators
This appendix provides information on how insurers determine premiums for homeowners insurance policies and the actuarial justifications they provide to state insurance regulators when requesting a premium increase. It also provides additional information on factors that drive premium increases, based on our review of insurer rate filings across several states.
Homeowners Insurance Premiums Are Required to Be Actuarially Sound
The National Association of Insurance Commissioners (NAIC) model law on ratemaking requires insurers to provide actuarial support for the premiums they charge.[67] The specific methodologies and processes insurers use to determine homeowners insurance premiums generally reflect both state regulatory requirements and relevant actuarial principles and standards.[68]
According to actuarial principles, an actuarially sound premium is a reasonable estimate of the expected future costs of transferring the relevant risk from the individual to the insurer.[69] These expected costs include insurance claims, claims-related expenses, commissions, operational expenses, reinsurance costs, and a provision for profit and risk. NAIC’s model law also states that premiums should not be excessive, inadequate, or unfairly discriminatory.
For homeowners insurance, the portion of the premium intended to cover claims typically has two components: claims from normal losses and claims from catastrophic losses (such as hurricanes and wildfires). To determine the portion related to normal losses, actuaries estimate average annual losses based on the expected frequency and severity of claims, using historical data, trend development, and other characteristics of the insurer’s existing policies. To determine the portion related to catastrophic losses, insurers use peril-specific catastrophe models to estimate the average annual losses, based on the estimated probability distribution of a wide range of possible losses that take into account the complex nature of potential damages from different types of catastrophic events.[70] States also generally allow the net cost of reinsurance to be passed to policyholders and included in premiums.[71]
In addition, insurers are allowed to include in the premium a provision for profit and risk/contingency (also known as the profit/contingency load) to provide an adequate return on capital and to protect insurer solvency.[72] Insurers may set the profit/contingency load as a percentage of premium or as an overall return on equity.[73] As part of their review of insurers’ premium requests, state insurance regulators evaluate the reasonableness of an insurer’s target profit/contingency load. Insurers operating in areas of higher risk may set greater profitability targets to compensate for putting their capital at greater risk. Some states—such as California, South Carolina, and Louisiana—set a maximum allowable target profit/contingency load.
To help insurers determine risk-based individual policyholder premiums that are fair, actuaries develop models that take into account specific characteristics of the properties they insure and the coverages they provide. These characteristics, also called rating factors, have been shown through actuarial analysis to correlate with the frequency and severity of losses. While insurers might use different combinations of rating factors depending on the type and the complexity of actuarial models, most insurers use some combination of the following rating factors.
· Location: Geographic risk factors such as exposure to wind, wildfire, or crime, and distance to fire stations or hydrants.
· Coverage: The amount of insurance, optional coverages, and coverage limits.
· Property characteristics: Construction type (such as brick or wood), age and condition of the home, roof type and age, square footage and replacement cost of the home, and use (primary residence or rental).
· Risk-mitigation features: Measures such as storm shutters, fire-resistant materials, and sprinkler systems.
· Policyholder characteristics: Claim history and, in states that allow it, the insurance score.[74]
Insurers must provide state insurance regulators with actuarial justification of their rating factor use—including both the choice of factors and the magnitude of their effect on premium. They also must demonstrate that each rating variable has a meaningful effect on risk, as well as the interactions among the variables. For example, they would need to show how homes in wildfire-prone areas have higher-than-average claims (justifying a wildfire surcharge) or that homes with mitigation features have lower-than-average losses (justifying a premium discount).
Insurers Must Provide Actuarial Justification for Premium Increases
When an insurer wants to increase premiums for an existing homeowners product, it must provide actuarial justification to the state insurance regulator in each state in which it sells the product. As noted earlier in this report, state regulatory systems vary in when and whether such justifications are reviewed. In these justifications, insurers must demonstrate both that (1) the expected cost of providing coverage (including the provision for profit) is projected exceed revenues from current total premiums, investment income, and reasonable profits from within the state, among other information, and (2) the requested increase is actuarially justified.[75]
Generally, the actuarial justification starts with an aggregate risk analysis at the state level. Insurers evaluate premium changes needed to cover projected homeowners claims and other estimated expected expenses, along with a target profit and calculation of required capital. The result of the analysis is referred to as the indicated rate, an average percentage increase in premium per policy for all the policies written in the state. An actuarially justified indicated rate is the highest premium increase the insurer could request.
More specifically, the indicated rate can be calculated using the formula shown below.

where
![]() is
the loss include allocated loss adjustment expenses (ALAE),
is
the loss include allocated loss adjustment expenses (ALAE), ![]() is
the premium,
is
the premium,
![]() is the weighted projected loss
ratio on the current premium basis, by peril,
is the weighted projected loss
ratio on the current premium basis, by peril,
![]() is the catastrophe loss ratio
(including allocated loss adjustment expenses) on the current premium basis,
is the catastrophe loss ratio
(including allocated loss adjustment expenses) on the current premium basis,
 is the net cost of reinsurance,
allocated to the state per exposure,
is the net cost of reinsurance,
allocated to the state per exposure,
 is the ratio of underwriting
expenses that do not vary directly with the premium volume (such as policy fees
and administrative overhead) to the current premium,
is the ratio of underwriting
expenses that do not vary directly with the premium volume (such as policy fees
and administrative overhead) to the current premium,
 is the ratio of underwriting
expenses that scale with premium (such as commissions and premium taxes) to the
current premium, and
is the ratio of underwriting
expenses that scale with premium (such as commissions and premium taxes) to the
current premium, and
 is the ratio of the target
return for providing insurance coverage (to cover return on capital, unexpected
adverse deviations, or return on surplus) to the current premium.
is the ratio of the target
return for providing insurance coverage (to cover return on capital, unexpected
adverse deviations, or return on surplus) to the current premium.
An overall indicated rate establishes the level of premium increases insurers need on a state average basis. Insurers also need to demonstrate how every rating variable has changed to reflect the changes in individual risk factors. If losses due to hurricanes are one of the primary drivers of the overall indicated rate, rating factors related to location or wind mitigation might change more than other rating factors, such as the distance to the nearest fire station. Insurers calculate the relative changes of all the rating variables based on their contributions to the overall indicated rate increase and to ensure the overall change matches the indicated rate increase.
Many states also require insurers to include a rate impact analysis as part of the actuarial justification. A rate impact analysis shows the range of premium increases for polices, including a distribution of rate increases among policyholders having various policy characteristics (rating factors). It also identifies the factors driving the highest premium increases. Some state regulators also set maximum limits for premium increases.
Insurers Must Demonstrate That Reinsurance Costs Are Actuarially Justified
In states in which insurers can include the cost of reinsurance in the premium determination, insurers must show that their net costs of reinsurance are actuarially supported and appropriate for the state.[76] This requires providing the state insurance regulator with the details of their reinsurance programs and showing how they have allocated reinsurance costs to different lines of business (such as homeowners and auto theft) within the state. When justifying the net cost of reinsurance included in the premium, insurers also need to ensure consistency with the modeled catastrophe losses to avoid over-estimates of premium increases, and to ensure consistency in model selection.
When reinsurance costs increase, homeowners insurance premiums also may increase. For example, South Carolina allows insurers to include the net cost of reinsurance as part of their actuarial justification of premium increases. For insurers with large volumes of policies on the South Carolina coast, where wind and storm surge risks are high, the net cost of reinsurance can account for about 20–30 percent of homeowners insurance premiums charged. In contrast, insurers writing policies inland or excluding wind coverage have lower reinsurance costs, and these costs have less effect on prices.
In California, although wildfire risk makes reinsurance very expensive, until 2025 insurers were prohibited from directly including reinsurance costs in their rate filings. Instead, insurers could justify rates based only on historical loss experience, which left many insurers operating at unsustainable losses and led some to withdraw from or restrict new business in high-risk areas. In 2025, California adopted new regulations allowing insurers to factor reinsurance costs into rate setting and to expand the use of catastrophe modeling. These changes aim to help insurers expand insurance coverage in wildfire-prone areas.
Insurers Must Support the Use of Catastrophe Models in Premium Determinations
Catastrophic events such as wildfires and hurricanes occur less frequently, but generally result in large losses, so past information does not include the full range of plausible events. As a result, loss estimates using actuarial techniques, based solely on historical loss experience, may understate potential losses or overstate future expected losses. To address these limitations, insurers generally estimate expected catastrophic losses using catastrophe models, which provide more comprehensive understanding of potential risks by generating a probability distribution of a wide range of possible losses.
Catastrophe models consider multiple factors, including the underlying physical science of the peril and historical data, to estimate the event frequency, hazard intensity, and geographical distribution of hazard intensity. State insurance regulators require insurers to provide documentation on how they selected models, settings, and validation of the model’s reasonableness.
Insurers must use input data that reflects the actual geographical distribution of their policyholders and their exposure to various perils. They also must make adjustments to their exposure data to reflect future conditions, such as the impact of changes in the exposure to loss (including coverage differences), underlying the portfolio of insured risks; building codes, enforcement of these codes, and building practices; population shifts; costs; and demand surge during both the historical period and the period for which the rate will be in effect. When using catastrophe models for premium justification, insurers are also expected to account for the impact of risk mitigation. For example, California now allows modeled wildfire losses in determining rate segmentation (by territory or wildfire score), but it requires that insurers consider and apply mitigation credits, discounts, or other rate differentials for properties that employ recognized wildfire mitigation.[77]
Insurers are expected to follow relevant actuarial standards in their use of catastrophe models and, where applicable, to use models acceptable to the state.[78]
An Example Illustrates How Actuarial Justifications Are Used in Rate Requests
A requested rate increase is a combination of the changes to the rating factors mentioned above. For example, in one actuarial justification we reviewed, the indicated aggregate rate increase was 18.9 percent. This increase was driven by a 45 percent increase in projected normal losses (as a share of premiums), a 35 percent increase in projected catastrophic losses (as a share of premiums), and a 6 percent increase in the profit/contingency load. Insurers may propose a rate increase less than the indicated rate; in this case, the insurer proposed a 13 percent aggregate statewide increase rather than the full 18.9 percent.
We also assessed how much the indicated rate would increase if we increased one factor by an additional 10 percentage points, while keeping all others constant. If the insurer’s projected catastrophic losses had increased to 38.4 percent instead of 35 percent, the indicated rate would increase to 23.4 percent—an additional 4.5 percentage points. Similarly, if projected normal losses had increased to 50 percent instead of 45 percent, the indicated rate would have increased to 24.7 percent, an additional 5.8 percentage points.
For the same rate-filing, where the insurer requested a 13 percent rate increase, the insurer raised the base rate for all policyholders by 3.7 percent and raised the amount-of-insurance factor by 7.2 percent, due to increases in replacement cost and inflation. The insurer also reduced the relative impact of the claim record (policyholder loss history) factor by 3.1 percent, due to a reduction in losses from policyholders with prior loss histories.
GAO Contact
Alicia Puente Cackley, CackleyA@gao.gov
Staff Acknowledgments
In addition to the contact named above, Patrick Ward (Assistant Director), Matthew Levie (Analyst in Charge), Kyle Abe, Xiang Bi, Lijia Guo, Garrett Hillyer, Jill Lacey, Scott McNulty, Marc Molino, Barbara Roesmann, Jessica Sandler, and Deirdre Sutula made key contributions to this report.
The Government Accountability Office, the audit, evaluation, and investigative arm of Congress, exists to support Congress in meeting its constitutional responsibilities and to help improve the performance and accountability of the federal government for the American people. GAO examines the use of public funds; evaluates federal programs and policies; and provides analyses, recommendations, and other assistance to help Congress make informed oversight, policy, and funding decisions. GAO’s commitment to good government is reflected in its core values of accountability, integrity, and reliability.
Obtaining Copies of GAO Reports and Testimony
The fastest and easiest way to obtain copies of GAO documents at no cost is through our website. Each weekday afternoon, GAO posts on its website newly released reports, testimony, and correspondence. You can also subscribe to GAO’s email updates to receive notification of newly posted products.
Order by Phone
The price of each GAO publication reflects GAO’s actual cost of production and distribution and depends on the number of pages in the publication and whether the publication is printed in color or black and white. Pricing and ordering information is posted on GAO’s website, https://www.gao.gov/ordering.htm.
Place orders by calling (202) 512-6000, toll free (866) 801-7077,
or
TDD (202) 512-2537.
Orders may be paid for using American Express, Discover Card, MasterCard, Visa, check, or money order. Call for additional information.
Connect with GAO
Connect with GAO on X,
LinkedIn, Instagram, and YouTube.
Subscribe to our Email Updates. Listen to our Podcasts.
Visit GAO on the web at https://www.gao.gov.
To Report Fraud, Waste, and Abuse in Federal Programs
Contact FraudNet:
Website: https://www.gao.gov/about/what-gao-does/fraudnet
Automated answering system: (800) 424-5454
Media Relations
Sarah Kaczmarek, Managing Director, Media@gao.gov
Congressional Relations
David A. Powner, Acting Managing Director, CongRel@gao.gov
General Inquiries
[1]We define availability as the ability of homeowners to acquire homeowners insurance, and cost/affordability as the ability of homeowners to acquire homeowners insurance at a price that is a relatively low share of their income.
[2]The states were California, Illinois, Louisiana, Maine, Missouri, and South Carolina.
[3]Rate filings are insurance companies’ documented requests to state regulators to change premiums.
[4]These filings represent all requested rate changes submitted in during this period in all 50 states and the District of Columbia.
[5]These estimates are based on state rate filings and adjusted to reflect each structure’s replacement cost and year built.
[6]Of the 15 questionnaires sent, we received 10 responses—from three state regulators, four insurance industry associations, and three consumer advocacy organizations—for a response rate of 67 percent.
[7]The federal government retains the authority to regulate insurance but has given primary responsibility for insurance regulation to the states in accordance with the McCarran-Ferguson Act. See Pub. L. No. 79-5, ch. 20, 59 Stat. 33 (1945) codified as amended at 15 U.S.C. §§ 1011-1015. See also GAO, Ultimate Effects of McCarran-Ferguson Federal Antitrust Exemption on Insurer Activity Are Unclear, GAO‑05‑816R (Washington, D.C.: July 28, 2005). The federal government remains involved in several insurance-related areas, including operating the National Flood Insurance Program and crop and terrorism insurance programs. In addition, the Board of Governors of the Federal Reserve System supervises insurers designated by the Financial Stability Oversight Council.
[8]According to an association representing insurers, similar to file-and-use states, and for similar reasons, insurers in use-and-file states may not actually raise rates until they can be certain they will be approved.
[9]According to the Federal Insurance Office, Alaska and Wyoming have different classifications, known as flex band and open rating, respectively. In some states, the type of review depends on the size of the requested rate change. For example, South Carolina can be a prior approval state but allows insurers to file and use rate changes of 7 percent or less.
[10]Licensed insurers in a state participate in guaranty funds, which provide for homeowner claims to be paid, subject to certain limits, even if their insurer becomes insolvent. Surplus insurers do not participate in these funds.
[11]In some states, insurers can use personal characteristics of the homeowners, such as age, or an insurance score, which is based on the homeowner’s credit report data. Of the six states we reviewed, one (California) forbids the use of insurance scores in determining premiums, according to a report by a consumer advocacy organization. Of the 15 filings we reviewed in the other five states, six (40 percent) used an insurance score in determining the homeowner’s premium.
[12]Insurers submit the manuals (which outline rates, rules, and procedures used to calculate premiums) to regulators for their approval. These manuals help support compliance with state laws and consumer protection guidelines. Insurers derive rates according to actuarial methods to calculate insurance risks and premiums. For more information on these methods, see appendix IV.
[13]Wildfire risk based on data from the Insurance Information Institute.
[14]For more details on how different factors can affect a premium, see our interactive graphic at www.gao.gov/products/GAO-26-107867.
[15]Rate standards are generally made in accordance with the NAIC Property and Casualty Model Rating Law, and state-specific laws and regulations.
[16]Expected costs also may include the net cost of any reinsurance (insurance for insurers) purchased by the insurer.
[17]Companies’ projections of these losses are generally based on actuarial, statistical, and scientific models that project the average annual claims from both catastrophic and noncatastrophic events. Catastrophic claims arise from large-scale events, such as hurricanes, wildfires, earthquakes, floods, or severe storms, that are expected to result in insured losses above a certain threshold, or create a certain number of deaths, injuries, or damaged homes. Noncatastrophic claims stem from everyday risks or smaller, localized events such as house fires, theft, vandalism, or non-weather-related water damage.
[18]According to actuarial principles, an actuarially sound premium is an estimate of the expected value of future costs of the individual risk transfer. See Casualty Actuarial Society, Statement of Principles Regarding Property and Casualty Ratemaking (Arlington, Va.: May 7, 2021).
[19]Consumer Watchdog, How Citizen Enforcement of Proposition 103 Has Saved Californians $5.5 Billion – and Why the Insurance Industry Hates It (Feb. 1, 2024).
[20]California Department of Insurance, Virtual Investigatory Hearing on Homeowners’ Insurance Availability and Affordability (Oct. 19, 2020).
[21]Other factors that can affect the time it takes to approve rate filings include potential claims fraud, recent catastrophic events, and insurance department staffing.
[22]State regulators can send multiple objection letters and each letter may contain multiple objections.
[23]Our analysis used a national dataset of estimated premiums based on the rate filings submitted by insurers from 2019 through 2024. The analysis included all 50 states and the District of Columbia and covered 29,882 zip codes. First Street data on premiums are estimates based on state rate filings and adjusted to reflect each structure’s replacement cost and year built. First Street Technology is a climate risk financial modeling, data, and analytics company. We verified these estimates against three different sets of actual insurance premiums from Freddie Mac and Fannie Mae, NAIC Property and Casualty Market Intelligence Data Call as summarized and published by the Federal Insurance Office, and the State of California. The First Street estimates correlated very highly with all three datasets.
[24]Two zip codes in South Florida, both in Palm Beach County, also had increases of more than 50 percent after accounting for inflation.
[25]These states also had the lowest affordability in 2019.
[26]For each property, First Street Technology estimated a 1–10 risk score for each type of peril in 2024. A score of 1 indicates minimal risk; 2, minor risk; 3–4, moderate risk; 5–6, major risk; 7–8, severe risk; and 9–10, extreme risk. We then calculated the average risk score for each zip code and grouped zip codes into three categories: 1–4 (minor to moderate risk), 5–6 (major risk), and 7–10 (severe or extreme risk).
[27]Our multivariate regression analysis included all 50 states and the District of Columbia, covered 29,882 zip codes, and used data from 2019 through 2024. Our dependent variable was the estimated average premium for homeowners insurance at the zip-code level. We estimated premiums using insurer rate filings for the same level of deductible and coverage, allowing us to isolate specific variables after accounting for economic factors (which included local population size, household income level, and inflation). Our regression analysis revealed statistical associations between premiums and the included variables, and was not designed to control for all factors that could determine premiums. Thus, the analysis does not imply a causal relationship. For details on the models estimated and limitations, see appendix II.
[28]The estimated increases in percentages and dollars represent increases above inflation.
[29]As an alternative to economic damages, we included the average loss ratio reported by the top 10 insurers in each state. We found that states with higher-than-average loss ratios also tended to have higher premiums. Loss ratio is used to measure the profitability of an insurance company and measures total incurred losses in relation to total earned insurance premiums.
[30]These fluctuations in profitability and availability are generally referred to as the “underwriting cycle.” As the profitability of insurance increases, insurers try to increase market share by increasing availability and lowering premiums. This tends to lead to lower profitability, which insurers respond to by lowering availability and raising premiums, which should drive up profits once again.
[31]As previously mentioned, some states do not have FAIR plans, and beach plans are generally only available in coastal areas.
[32]Our multivariate regression analysis considered 32 states and covered 2014–2023. Our dependent variable was the market share of beach and FAIR plans at the state level. Our regression analysis revealed statistical associations between FAIR plan market share and recent natural disasters and regulatory wait times for insurer premium changes, after controlling for nationwide trends in FAIR and beach market share over time. The analysis does not imply a causal relationship. For details on the models estimated, see appendix III.
[33]We measured the cost of natural disasters using the National Oceanic and Atmospheric Administration’s billion-dollar disaster database, which reports disasters that have caused a billion dollars or more in total damages.
[34]Our multivariate regression analysis considered 1,599 zip codes in California and covered 2020–2023. Our dependent variable was the market share of housing units on the California FAIR plan at the zip-code level. Our regression analysis revealed statistical associations between share of housing units on the FAIR plan and fire risk, after controlling for median home value, percent of homes with a mortgage, flood risk level, and statewide FAIR plan market share trends over time. The analysis does not imply a causal relationship. For details on the models estimated, see appendix III.
[35]The underwriting profit and loss percentages are presented net of the effects of any reinsurance insurers may have purchased to manage the risks of this and other lines of insurance business. Insurers pay reinsurers a premium (net of a ceding commission for acquisition and other costs) to cover a portion of losses on certain insurance policies.
[36]These or other factors contributed, for example, to industry underwriting profitability in 2004 despite significant losses from Hurricanes Ivan, Charley, and Frances, and in 2024 despite losses from Hurricanes Helene, Milton, and Beryl.
[37]For more information on our calculation of investment income and gains, see appendix I.
[38]Fidelity insurance protects organizations against financial losses from forgery, embezzlement, and other employee theft. Surety insurance provides protection for proper and complete performance of contracts in accordance with laws and contract terms.
[39]FORTIFIED is a voluntary construction standard designed to protect homes against severe weather. The Insurance Institute for Business & Home Safety, a nonprofit research and communications organization formed by the insurance industry, created the standard.
[40]One state regulator with whom we spoke was skeptical of mandated discounts and told us that if mandated discounts were not actuarially justified, then homeowners who did not mitigate their homes effectively would be subsidizing homeowners who did.
[41]Alabama Department of Insurance and Center for Risk and Insurance Research (University of Alabama), Performance of IBHS FORTIFIED Home Construction in Hurricane Sally (Tuscaloosa, Ala.: 2025). This study only examined the performance of one type of mitigation in one natural disaster, and its results cannot be generalized to all mitigations or all types of natural disasters.
[42]Multi-Hazard Mitigation Council, Natural Hazard Mitigation Saves: 2019 Report (Washington, D.C.: National Institute of Building Sciences, 2019). The study estimated the benefits of complying with the FORTIFIED Home Hurricane program compared to 2015-I Code requirements for one year of new construction. The benefit-cost ratios ranged from 1.5 to 28, depending on the maximum wind speed. I-Codes are model building safety codes developed by the International Code Council.
[43]National Association of Mutual Insurance Companies, Social Inflation–Legal System Abuse: Observations and Solutions to Support the Right to Fair and Impartial Dispute Resolution (Indianapolis, Ind. and Washington, D.C.: March 2023).
[44]Florida accounts for a disproportionate share of insurance-related lawsuits. According to a January 2025 report by the Florida Office of Insurance Regulation, less than 10 percent of U.S. homeowners insurance claims in 2023 were opened in Florida, but the state accounted for over 70 percent of U.S. homeowners insurance-related lawsuits.
[45]According to two insurance industry associations we interviewed, some contractors abused this arrangement.
[46]We did not receive responses to the questionnaire from two entities in the state regulator category, or any residual insurance plans. Not all respondents expressed views on all options.
[47]We define availability as the ability of homeowners to acquire homeowners insurance; cost/affordability as the ability of homeowners to acquire homeowners insurance at a price that is a relatively low share of their income; and equitable participation as the insurance being available to as many homeowners who need or desire coverage as possible, regardless of their income or where they live.
[48]GAO, Disaster Resilience Framework: Principles for Analyzing Federal Efforts to Facilitate and Promote Resilience to Natural Disasters, GAO‑20‑100SP (Washington, D.C.: Oct. 23, 2019).
[49]The list highlights areas across the federal government that are seriously vulnerable to waste, fraud, abuse, and mismanagement or in need of transformation. See GAO, High-Risk Series: Heightened Attention Could Save Billions More and Improve Government Efficiency and Effectiveness, GAO‑25‑107743 (Washington, D.C.: Feb. 25, 2025).
[50]GAO, Disaster Resilience: FEMA Should Take Additional Steps to Streamline Hazard Mitigation Grants and Assess Program Effects, GAO‑21‑140 (Washington, D.C: Feb. 2, 2021). We analyzed two post-disaster FEMA grant programs—Hazard Mitigation Grant and Public Assistance—and two pre-disaster grant programs—Flood Mitigation Assistance and Pre-Disaster Mitigation. The latter program was replaced in 2020 with the Building Resilient Infrastructure and Communities program. In April 2025, FEMA announced that it was ending the Building Resilient Infrastructure and Communities program. In August 2025, FEMA officials stated that the agency was continuing to evaluate whether to end or revise the program. As of August 2025, our review of the program was ongoing.
[51]GAO, Flood Insurance: FEMA’s New Rate-Setting Methodology Improves Actuarial Soundness but Highlights Need for Broader Program Reform, GAO‑23‑105977 (Washington, D.C.: July 31, 2023). As of August 2025, Congress had not enacted legislation in response to these recommendations. Doing so could help address the National Flood Insurance Program’s long-standing challenges and place it on a path to achieve fiscal solvency while addressing affordability.
[52]GAO, Terrorism Risk Insurance: Program Changes Have Reduced Federal Fiscal Exposure, GAO‑20‑348 (Washington, D.C.: Apr. 20, 2020).
[53]GAO, Tax Expenditures: Background and Evaluation Criteria and Questions, GAO‑13‑167SP (Washington, D.C.: Nov. 29, 2012).
[54]GAO, Pandemic Risk: Federal Insurance Approaches Would Entail Costs to Taxpayers and Businesses Might Not Participate, GAO‑24‑106075 (Washington, D.C.: Dec. 19, 2023).
[55]The A.M. Best company is a global credit agency, news publisher, and data analytics provider specializing in the insurance industry.
[56]First Street Technology is a climate risk financial modeling, data, and analytics company.
[57]We removed the highest 1 percent of insurance premiums from each state, and then removed the bottom 1 percent, to ensure that outliers did not unduly influence the final average premiums.
[58]For example, see GAO, Natural Disasters: Public Policy Options for Changing the Federal Role in Natural Catastrophe Insurance, GAO‑08‑7 (Washington, D.C.: Nov. 26, 2007); American Property Casualty Insurance Association, Factors Influencing the High Cost of Insurance for Consumers (Chicago, Ill. and Washington, D.C.: Nov. 2, 2023); Congressional Budget Office, Climate Change, Disaster Risk, and Homeowner’s Insurance (Washington, D.C.: August 2024); and Bipartisan Policy Center, Rising Property Insurance Costs: Opportunities for Federal Action (Washington, D.C.: February 2025).
[59]Premiums were estimated by First Street Technology based on insurers’ rate filings for the same level of deductible ($1,000) and similar level of coverage (about 70 percent of rebuild costs of a property) for each property. We calculated the average premium at zip-code level from property-level premiums. We compared our estimated zip-code averages and available zip-code premium calculated based on actual premiums. We found the estimated premiums to be highly correlated with actual premiums, with a few exceptions.
[60]Although standard homeowners insurance does not include flood damage, we included flood risk as a control.
[61]For each property, First Street Technology estimated a 1–10 risk score for each type of peril: 1, minimal risk; 2, minor risk; 3–4, moderate risk; 5–6, major risk; 7–8, severe risk; and 9–10, extreme risk. We calculated the average risk scores for each zip code and reclassified the zip codes into three categories: 1–4, low and moderate risk; 5–7, major risk; and 8–10, extreme and severe risk.
[62]Economic damages of billion-dollar natural disasters were obtained from National Oceanic and Atmospheric Administration, National Centers for Environmental Information, U.S. Billion-Dollar Weather and Climate Disasters (2025). Loss ratio is used to measure the profitability of an insurance company. We used the incurred loss ratio, which measures total incurred losses in relation to total earned insurance premiums. We used direct incurred loss ratio (not net of reinsurance) in our analysis.
[63]According to the Federal Insurance Office, state regulatory environments generally fall into four categories: prior approval by regulator, use-and-file, file-and-use, and other approaches.
[64]The American Community Survey measures the changing social, economic, demographic, and housing characteristics of the U.S. population. The survey is sent to a sample of addresses across the 50 states and the District of Columbia on a rolling basis, with approximately 3.5 million addresses sampled annually. The survey data are used to produce 1-year and 5-year population estimates. We used the most recent 5-year population estimates (2019–2023) at the level of zip-code tabulation areas.
[65]The 50 states and Washington, D.C. have about 33,000 residential zip codes.
[66]For each property, First Street Technology estimated a risk score from 1 to 10 for each type of peril: 1, minimal risk; 2, minor risk; 3–4, moderate risk; 5–6, major risk; 7–8, severe risk; and 9–10, extreme risk. We calculated the average risk scores for each zip code and reclassified zip codes into three categories: 1-4, minor to moderate risk; 5–6, major risk; and 7–10, severe or extreme risk.
[67]See National Association of Insurance Commissioners, Property and Casualty Model Rating Law (Prior Approval Version) NAIC GL-1780-1; and Property and Casualty Model Rating Law (File and Use Version), NAIC GL-1775-2. See https://content.naic.org/ model-laws.
[68]Casualty Actuarial Society, Statement of Principles. The Actuarial Standards Board sets standards for appropriate actuarial practice in the United States through the development and promulgation of Actuarial Standards of Practice, which describe the procedures an actuary should follow when performing actuarial services and identify what the actuary should disclose when communicating the results of those services. The Board’s relevant Actuarial Standards of Practice include 12 (Risk Classification for All Practice Areas); 13 (Trending Procedures in Property/Casualty Insurance; 23 (Data Quality); 25 (Credibility Procedures); 29 (Expense Provisions in Property/Casualty Insurance Ratemaking); 30 (Treatment of Profit and Contingency Provisions and the Cost of Capital in Property/Casualty Insurance Ratemaking); 38 (Catastrophe Modeling); 39 (Treatment of Catastrophe Losses in Property/Casualty Insurance Ratemaking); 53 (Estimating Future Costs for Prospective Property/Casualty Risk Transfer and Risk Retention); and 56 (Modeling).
[69]Casualty Actuarial Society, Statement of Principles. According to Actuarial Standard of Practice 1, “actuarial soundness” has different meanings in different contexts and might be dictated or imposed by an outside entity. In rendering actuarial services, if the actuary identifies a process or result as “actuarially sound,” the actuary should define the meaning of “actuarially sound” in that context.
[70]Catastrophic losses pose a special challenge because they are infrequent, highly variable events that can skew historical averages.
[71]The net cost of reinsurance includes the excess of reinsurance premiums paid to the reinsurer over recoveries for claims from the reinsurer.
[72]The cost of capital covers risk exposure that an insurer chooses to cover itself rather than transfer to a third party. This includes both the risk of random variation from expected costs and the risk of systematic underestimation of expected costs.
[73]Return on equity is the ratio of a company’s profit to its average net worth.
[74]An insurance score is a credit-based number predicting the likelihood of filing a claim. Insurers may use it as one factor (alongside driving record, home features, etc.) to calculate premium where permitted by state law.
[75]In most states, expected costs also may include the net cost of any reinsurance (insurance for insurers) purchased by the insurer.
[76]The net cost of reinsurance is calculated by dividing the estimated reinsurance premium net of anticipated recoverable by the written premium for the state. Actuaries estimate state-level net cost of reinsurance by allocating it to line of business by exposure, covered (hurricane, for example) losses and premiums.
[77]Cal. Code Regs. tit. 10 § 2644.9.
[78]The Actuarial Standards Board’s actuarial standards of practice describe the procedures an actuary should follow when performing actuarial services and identify what the actuary should disclose when communicating the results of those services. The relevant standards are 38 (Catastrophe Modeling for All Practice Areas), 39 (Treatment of Catastrophe Losses in Property/Casualty Insurance Ratemaking), and 56 (Modeling).