
Report to the Ranking Member, Special Committee on Aging, U.S. Senate
United States Government Accountability Office
A report to the Ranking Member, Special Committee on Aging, U.S. Senate
For more information contact: Thomas Costa at CostaT@gao.gov or Michael Hoffman at HoffmanME@gao.gov
What GAO Found
Unpaid household work includes domestic tasks, such as cooking and cleaning, as well as caregiving. Studies show that supplementing Gross Domestic Product (GDP) with the value of unpaid household work can provide a better understanding of the U.S. economy than GDP alone. For example, the decline in economic output during the COVID-19 recession was smaller when this value was included. Unpaid household work is not included in GDP because it takes place outside of formal market transactions and requires additional resources to calculate. According to economists GAO interviewed, valuing unpaid work can help inform policies that affect caregivers, such as policies intended to improve caregivers’ financial security in retirement.
In a typical day, most individuals (87.3 percent) spent at least some time on household work—an average of about 3.72 hours, according to GAO’s analysis of 2021–2024 American Time Use Survey (ATUS) data. In addition, GAO estimated that the national market value of unpaid household work was at least $5.6 to 6.0 trillion in 2024 (which was equivalent to at least 19.2 to 20.2 percent of 2024 GDP). This estimated national market value includes the values of various types of unpaid household work, such as:
· Domestic tasks: $4.3 to $4.4 trillion (which was equivalent to 14.7 to 15.1 percent of 2024 GDP); and
· Caregiving (caring for adults or caring for children as a primary activity): $1.1 to $1.4 trillion (which was equivalent to 3.9 to 4.9 percent of 2024 GDP).
These estimated values do not include secondary child care, which is keeping an eye on children while engaged in other activities. Including secondary child care increases the estimated values of caregiving and of all unpaid household work.
GAO found certain groups were overrepresented among those engaged in unpaid household work from 2021-2024. For example, women made up about 53.9 percent of those engaged in this work, but 51.2 percent of the U.S. population. Also, women and married individuals spent more time on child care than men and unmarried individuals. However, women and men who cared for adults spent similar amounts of time doing so, as did married and unmarried individuals.
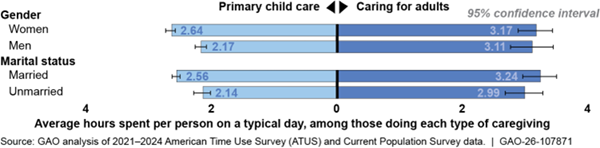
Notes: Primary child care is when the caregiver’s primary focus is helping or caring for a child (e.g., reading to a child), according to ATUS. GAO defined married individuals as living with their spouse or partner and unmarried individuals as not married or not living with their spouse or partner.
Why GAO Did This Study
Millions of people spend time on unpaid household work each day. Unpaid household work is work someone does for their household that someone else could do for pay.
GAO was asked to examine how unpaid household work contributes to the economy and whether a better understanding of this work could help inform policy. This report (1) describes how estimating the time and monetary value of unpaid household work can supplement economic data and inform caregiving policy; (2) estimates the time spent on this work and its monetary value; and (3) determines the characteristics of individuals who do this work.
To inform all objectives, GAO reviewed studies on unpaid household work in the U.S. that had strong research methods; and interviewed economists knowledgeable about estimating the time and value of this work.
To estimate the time spent on unpaid household work, GAO analyzed nationally representative ATUS data from 2021–2024, which were the most recent data available at the time of GAO’s review. GAO estimated the monetary value of this work by multiplying hours from the ATUS by median hourly wages from the 2024 Current Population Survey (CPS). For most types of unpaid work, GAO selected both lower and higher wages to show how the value changes based on the wages used. GAO also analyzed 2021–2024 ATUS and CPS data to describe the characteristics of individuals engaged in this work. Both ATUS and CPS are federally funded surveys.
Abbreviations
ATUS American Time Use Survey
BEA Bureau of Economic Analysis
BLS Bureau of Labor Statistics
CCDF Child Care and Development Fund
COVID-19 Coronavirus disease 2019
CPS Current Population Survey
FMLA Family and Medical Leave Act
GDP Gross Domestic Product
NAICS North American Industry Classification System
SOC Standard Occupational Classification
VA Department of Veterans Affairs
This is a work of the U.S. government and is not subject to copyright protection in the United States. The published product may be reproduced and distributed in its entirety without further permission from GAO. However, because this work may contain copyrighted images or other material, permission from the copyright holder may be necessary if you wish to reproduce this material separately.
September 17, 2026
The Honorable Kirsten Gillibrand
Ranking Member
Special Committee on Aging
United States Senate
Dear Ranking Member Gillibrand:
Every day, millions of people in the U.S. do unpaid household work for themselves or their families. For example, they care for their own children instead of hiring a caregiver, or they fix a leaky faucet instead of hiring a plumber. Unpaid household work is generally defined as work someone does for their own household that a third party could perform for pay.[1] Although economists generally agree on this broad definition, they may disagree on whether some activities should be considered unpaid household work and how to value such work.
You asked us to describe how unpaid household work contributes to the economy and whether a better understanding of such work could help inform policy. For this review, we (1) described how, if at all, estimating the time and monetary value of unpaid household work could supplement data on the economy and inform policies that affect caregivers; (2) estimated the time individuals spent on unpaid household work and calculated the monetary value of this work; and (3) determined the characteristics of individuals who performed unpaid household work and whether these characteristics varied by type of work performed.
For all objectives, we reviewed studies published between 2010 and 2025 that we primarily identified through a literature search. Specifically, we identified U.S. studies that (1) described whether and how studying this work could enhance data or inform policy; (2) estimated the time and monetary value of unpaid household work; or (3) described the characteristics of individuals engaged in this work. All of the studies we selected had strong research methods to appropriately inform one or more of our objectives.[2]
For all objectives, we also interviewed six economists affiliated with universities or think tanks who published studies about the time spent on unpaid household work or that monetarily valued this work.[3] We asked similar questions of each economist. We also interviewed knowledgeable economists at the Department of Commerce’s Bureau of Economic Analysis (BEA) and the Department of Labor’s Bureau of Labor Statistics (BLS).
For the second and third objectives, we analyzed American Time Use Survey (ATUS) and Current Population Survey (CPS) data from 2021 through 2024 to determine (1) the amount of time individuals spend on unpaid household work, in total and by type of work; and (2) the demographic characteristics of these individuals, including their gender, marital status, employment status, age, and family income.[4] We assessed the reliability of these data and determined them to be sufficiently reliable for estimating the time and value of unpaid household work, describing the characteristics of individuals engaging in such work, and comparing unpaid household work hours between different demographic groups. Because the ATUS and CPS are sample surveys, all of the analysis results we present in this report are estimates.[5] Our analysis of ATUS and CPS data is intended to describe patterns in time use, not to explain what factors cause different patterns of time use.
For the second objective, we also estimated the value of the time individuals spent on unpaid household work in total and by type using the replacement wage method. This method values hours spent on unpaid household work using hourly wage rates of paid professionals.[6] See appendix I for more information on our objectives, scope, and methodology.
We conducted this performance audit from October 2024 to September 2026 in accordance with generally accepted government auditing standards. Those standards require that we plan and perform the audit to obtain sufficient, appropriate evidence to provide a reasonable basis for our findings and conclusions based on our audit objectives. We believe that the evidence obtained provides a reasonable basis for our findings and conclusions based on our audit objectives.
Background
Types of Unpaid Household Work
There are many different types of unpaid household work, which can be categorized in various ways. For the purposes of this report, we categorized unpaid household work as either domestic tasks, caregiving, or helping adults (see fig. 1). We further divided caregiving into four types: 1) caring for children as a primary activity, 2) caring for children as a secondary activity, 3) caring for adults, or 4) caring for both children and adults (known as “sandwich” caregiving).
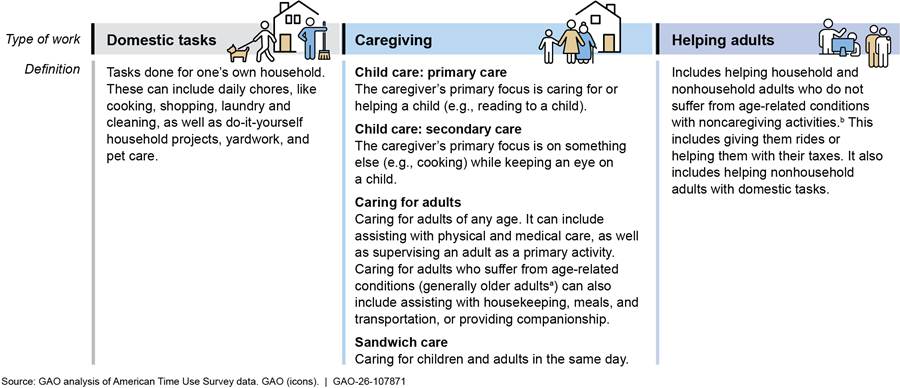
Notes: We developed these definitions using American Time Use Survey (ATUS) data and our review of selected studies.
aIn this report, we define caring for adults as caring for anyone ages 18 and older. When we analyzed the ATUS data, we combined caring for adults of all ages into a single group to generate reliable estimates. Within this combined group, about 71 percent of the caregivers who were caring for adults were providing eldercare. ATUS defines eldercare as providing care to an adult, regardless of age, who suffers from an age-related condition. Although most of these individuals were ages 65 or over, some were younger than 65.
bAdults in this category are ages 18 and older and are not flagged in ATUS as receiving eldercare.
Estimates of the Value of Unpaid Household Work
BEA has calculated government estimates of the value of unpaid household work, which it refers to as household production.[7] While these estimates are not included in Gross Domestic Product (GDP), BEA has produced them so that they are comparable both to GDP and to estimates of unpaid work in other countries.[8] As of May 2026, BEA had produced estimates of the value of unpaid household work from 1965 through 2020.[9] In its estimate for 2020, BEA valued unpaid household work at about $5.3 trillion, which was equivalent to about 25 percent of GDP in that year.[10]
Using Measures of Unpaid Household Work to Supplement Economic Data and Inform Policies
Estimating the time and monetary value of unpaid household work can supplement GDP and household data, and can also inform policies that affect caregivers, according to studies we reviewed and economists we interviewed.[11]
Supplementing GDP
Examining data on the time and monetary value of unpaid household work alongside GDP provides a more comprehensive view of the economy than GDP alone, according to studies we reviewed and four economists.[12] This work is not included in economic measures such as GDP because it takes place outside of formal market transactions and requires additional resources to calculate.
The time and value of unpaid household work can inform research on three topics related to GDP:
· Economic growth. Supplementing GDP with the value of unpaid household work can provide a more nuanced understanding of economic growth. BEA refers to this measure as “adjusted GDP.” Adjusted GDP grew slightly slower than GDP alone—at 6.1 percent versus 6.3 percent per year—from 1965 to 2020, according to BEA’s estimates.[13] In its study, BEA explained that this difference is partly because GDP only captured the increase in paid work when women increased their participation in the labor force, not the corresponding decrease in unpaid household work. Adjusted GDP, on the other hand, reflected both changes.
· Recessions. Estimating the time spent on unpaid household work can improve our understanding of the severity of recessions. For example, BEA found that adjusted GDP showed less of a decline in economic output during the COVID-19 recession in 2020 than GDP alone.[14] This is partly because adjusted GDP reflects how people adjust their time between paid and unpaid work during recessions. For example, economists found that people increased the time they spent on unpaid household work during both the Great Recession (which occurred from late 2007 to mid-2009) and during the COVID-19 recession in 2020. A study about the Great Recession, for example, found that about 45 percent of lost paid work hours were spent on unpaid household work, including child care.[15]
|
What Are Macroeconomic Models? Macroeconomic models are tools economists use to understand how the overall economy performs over time. These models simulate how households, businesses, and governments make economic decisions—such as how much to work, spend, and save—as well as how these decisions interact and affect economic output, employment, and economic growth. Source: GAO summary of Federal Reserve Bank of New York Economic Policy Review, Policy Analysis Using Dynamic Stochastic General Equilibrium Models. | GAO‑26‑107871 |
· Macroeconomic models. Including the time spent on unpaid household work in macroeconomic models can enhance their ability to explain changes in paid work hours and economic performance. According to one study, traditional economic models allocate time only between paid work and leisure, while models that include unpaid household work allocate time among paid work, unpaid household work, and leisure.[16] Models that include unpaid household work can more effectively capture how individuals adjust their use of time in response to economic changes. For example, these models can reflect when individuals might find it economically beneficial to replace paid work hours with unpaid household work hours (such as during an economic downturn). These models can also reflect when individuals may replace unpaid household work with paid work (such as during periods of increased wage growth). As a result, these models can provide a more nuanced understanding of paid work hours than traditional economic models.
Supplementing Existing Data on Households
In addition to providing insight into national economic conditions, estimates of unpaid household work can also supplement existing household-level data on poverty and spending, and the distribution of income across households. According to researchers and BLS officials, including the time and value of unpaid household work in these data can provide a more comprehensive measure of households’ living standards than income or spending alone. This is because (1) households also use goods and services that they produce themselves, which income and spending do not measure, and (2) studies show that including unpaid household work can provide insight into tradeoffs between unpaid caregiving and paid work—such as increases in child care costs when parents start employment.
Studies we reviewed used the time and value of unpaid household work to supplement three types of existing data about households: poverty, spending, and distribution of income.
· Poverty. In analyses of poverty nationwide, estimating the value of unpaid caregiving can supplement poverty measures by better accounting for changes in household income when parents start a paying job. For example, one study described how poverty measures can reflect income increases when a parent starts working, but not the parent’s new child care expenses due to providing less unpaid child care themselves.[17] Valuing caregiving can capture both changes and thereby provide better information on a family’s financial
circumstances when a parent becomes employed.[18]
|
How Consumption is Defined and Measured Consumption is defined as households’ use of goods and services to meet their needs, either purchased or obtained through unpaid household work (e.g., cooking at home). In practice, however, consumption is typically measured only by household spending on durable goods (e.g., appliances), nondurable goods (e.g., food), and services (e.g., healthcare and housing). Because this spending measure relies on market transactions, it excludes goods and services obtained through unpaid household work. Source: GAO summary of U.S. Bureau of Labor Statistics website. | GAO‑26‑107871 |
· Spending. Estimating the value of unpaid household work can supplement spending data to provide a more comprehensive measure of households’ living standards. One study found, for example, that retired individuals spent less on food because they replaced dining out with cooking at home. The study concluded that this could explain why spending on food dramatically declines in retirement, and more broadly suggested that spending alone may be an incomplete measure of consumption (see sidebar).[19] Another study found that households with retired individuals can replace about 12 percent of their overall spending by increasing unpaid household work.[20]
· Distribution of income across households. Estimating the value of unpaid work can also offer insights into how income is distributed across households. For example, adding the value of unpaid household work to income (often referred to as extended income) reduced inequality across all households, according to one study.[21] This occurred because including the value of unpaid household work increased extended income by a larger proportion for low-income households than for high-income households, according to the study.
Informing Policies that Affect Caregivers
Estimating the time and value of unpaid caregiving can help inform policies that affect caregivers, including by more comprehensively assessing the costs and benefits of various policies, according to studies we reviewed and four economists we interviewed. Policies include stipends for veterans’ caregivers, child care subsidies, in-home care covered by Medicaid, policies to improve caregivers’ retirement security, workplace flexibility policies, and tax rates.
· Stipends for veterans’ caregivers. Estimating the value of unpaid caregiving can help determine appropriate stipend amounts for family caregivers of disabled veterans, according to two studies we reviewed and one economist we spoke with.[22] For example, one study found that Department of Veterans Affairs (VA) family caregiver stipends were generally offset by reduced spending on healthcare for veterans whose caregivers received these stipends.[23]
· Child care subsidies. Estimating the value of unpaid care for children can inform evaluations of child care policy options. For example, incorporating the estimated value of unpaid child care into economic models enabled one study to better evaluate the costs and benefits of multiple child care policies. Specifically, the study examined how child care subsidies with and without work requirements affected married women’s participation in the labor force.[24]
· In-home care covered by Medicaid. Estimating the value of unpaid caregiving can also be used to determine how the cost of in-home care compares to the cost of care in a medical institution (e.g., a nursing facility) under Medicaid. According to two economists, such value of unpaid caregiving can help states decide whether to adopt a Medicaid Home and Community-Based Services waiver program. This program pays for certain types of care at home instead of in a medical institution. Participating states are required to show that in-home care costs no more than institutionalized care, among
meeting other requirements.[25]
· Policies to improve caregivers’ retirement security. Estimating the value of unpaid caregiving can inform policies intended to improve caregivers’ retirement security, according to three economists we spoke with. For example, one economist said the estimated value of unpaid caregiving could be used to calculate benefits under a potential Social Security caregiver credits policy.[26] Under such a policy, years an individual spent caregiving—while not in the labor force—would have a value greater than zero in a caregiver’s Social Security retirement benefit calculation (see sidebar).
|
Social Security Retirement Benefits In general, Social Security retirement benefits are calculated using the highest 35 years of earnings. For example, if a caregiver retires after working for 33 years, they would have 2 years of zero income in their benefit calculation, which would result in lower benefits throughout retirement compared to what their benefit would have been if they had a full 35-year earnings history. Source: GAO. | GAO‑26‑107871 |
· Workplace flexibility policies. Estimating the value of unpaid caregiving informs the potential effects of workplace flexibility policies—such as unpaid leave under the Family and Medical Leave Act (FMLA) or working from home—according to three economists we spoke with.[27] Specifically, researchers said such policies may lead unpaid caregivers to increase their labor force participation.[28] For example, when the share of individuals in the U.S. who worked from home increased by 10 percent, mothers’ employment rates increased by nearly 1 percent compared to women without children.[29]
· Tax rates. Estimating the time and value of unpaid household work can help researchers evaluate how individuals shift time between unpaid and paid work in response to policy changes—such as changes in tax rates. One researcher explained that individuals’ ability to switch between paid work and unpaid household work (such as caregiving) directly shaped how they responded to rising or falling tax rates.[30] The researcher elaborated that gender differences help explain why women, who typically have greater unpaid caregiving responsibilities, adjusted their paid work hours more than men in response to increases or decreases in tax rates.
Time Spent on Unpaid Household Work and Its Estimated Market Value in 2024
Time Spent on Unpaid Household Work on a Typical Day
According to our analysis of ATUS data from 2021 through 2024, an estimated 87.3 percent of individuals ages 15 and older performed at least one type of unpaid household work on a typical day, spending about 3.72 hours on these activities.[31] This estimate excludes secondary child care, which is keeping an eye on a child while engaged in something else. When we include secondary child care, the estimated percentage of individuals engaged in at least one type of unpaid household work on a typical day rose slightly, to about 88.4 percent, while the number of hours spent on such work increased to about 4.74 (see table 1).[32]
Table 1: Estimated Percentage of Individuals Engaged in Unpaid Household Work on a Typical Day and Average Daily Hours Spent Per Person, by Type of Work, 2021–2024
|
Type of unpaid household worka |
Percentage of individuals on a typical day |
Average daily hours spent per person, among those engaged in each type of workb |
|
Domestic tasks |
84.0% |
2.93 hours |
|
Caregiving (primary child care or caring for adults; excludes secondary child care) |
25.7% |
2.73 hours |
|
Caregiving (primary child care, secondary child care, or caring for adults)c |
31.2% |
6.48 hoursc |
|
Helping adults |
7.7% |
1.21 hours |
|
All unpaid household work (excludes secondary child care) |
87.3% |
3.72 hours |
|
All unpaid household work (includes secondary child care) |
88.4% |
4.74 hoursb |
Source: GAO analysis of 2021–2024 American Time Use Survey (ATUS) data. | GAO‑26‑107871
Notes: ATUS records how respondents spent their time on a selected day (their “diary day”). We combined 4 years of ATUS data into a single data set to estimate both the percentages of individuals in the U.S. ages 15 and older who engaged in unpaid household work on their diary day, and the average hours they spent on this work. Estimates by type of unpaid household work do not sum to the total because individuals may perform multiple types of work on the same day. All estimates have a margin of error that is no greater than ±10 percent of the estimate at the 95 percent level of confidence.
aDomestic tasks are those done for one’s household (e.g., cooking and cleaning). Primary child care occurs when the caregiver’s primary focus is helping or caring for a child. Secondary child care is when the caregiver’s primary focus is on something else (e.g., cooking) while keeping an eye on a child. Caring for adults of any age can include assisting with physical and medical care, as well as supervising an adult. Caring for adults who suffer from an age-related condition (generally older adults) can include housekeeping, meals, and transportation. Helping adults excludes adults of any age who suffer from an age-related condition. It includes helping adults with noncaregiving activities (e.g., giving rides to adults and helping adults who do not live in their household with domestic tasks).
bAverage daily hours spent on unpaid household work are based on individuals engaged in each activity (i.e., conditional averages). Averages based on the full ATUS population (i.e., unconditional averages) would be lower—particularly for less common activities, such as helping adults. The full ATUS population consists of those who are non-institutionalized, civilian, and at least 15 years of age.
cEstimated caregiving hours (including secondary child care) exceed total unpaid household work hours because each measure is a conditional average calculated for a different group. The caregiving estimate includes only those who perform caregiving activities, whereas the unpaid household work estimates include a broader group performing any unpaid activity. While both may include individuals who report secondary child care, the narrower caregiving group has higher average hours.
Using ATUS data, we also determined if individuals engaged in some types of unpaid household work more than other types. As shown in table 1, we found that on a typical day from 2021 through 2024:
· Domestic tasks were, by far, the most common type of unpaid household work. Among all individuals ages 15 and older, about 84.0 percent engaged in domestic tasks, while about 25.7 percent provided primary child care or adult care and about 7.7 percent provided help to adults.[33]
· Individuals spent the most time on caregiving (6.48 hours per day, on average) and domestic tasks (2.93 hours per day, on average), with secondary child care accounting for more than half of the overall caregiving hours.
We also used 2021 through 2024 ATUS data to estimate the percentage of individuals who cared for children, adults, or both on a typical day, and how many hours they spent on that care. As shown in table 2, we found that:
· Child care. Child care was the most prevalent form of caregiving—regardless of whether we included secondary child care. For example, about 26.3 percent of individuals provided primary child care, secondary child care, or both. These individuals spent, on average, about 6.99 hours per day on such care.
· Adult care. Caring for adults was relatively uncommon, with about 6.2 percent of individuals doing so on a typical day. These individuals spent, on average, about 3.15 hours per day on this care.
· Sandwich care. An estimated 1.3 percent of individuals cared for adults and children on the same day. These individuals spent, on average, about 7.87 hours per day on this care when secondary child care was included.[34]
Table 2: Estimated Percentage of Individuals Providing Unpaid Caregiving on a Typical Day and Average Daily Hours Spent Per Caregiver, 2021–2024
|
Type of unpaid caregivinga |
Percentage of individuals on a typical day |
Average daily hours spent per caregiver, among those providing each type of caregivingb |
|
All child care (primary, secondary, or both)c |
26.3% |
6.99 hours |
|
Child care (primary) |
20.5% |
2.46 hours |
|
Child care (secondary) |
21.5% |
6.23 hours |
|
Adult cared |
6.2% |
3.15 hours |
|
Sandwich caree (excludes secondary child care) |
1.0% |
3.68 hours |
|
Sandwich caree (includes secondary child care) |
1.3% |
7.87 hours |
Source: GAO analysis of 2021–2024 American Time Use Survey (ATUS) data. | GAO‑26‑107871
Notes: ATUS records how respondents spent their time on a random day (their “diary day”). We combined 4 years of ATUS data into a single dataset to estimate both the percentages of individuals in the U.S. ages 15 and older who provided unpaid caregiving on their diary day, and the average hours they spent on it. Estimates generally have a margin of error that is no greater than ±10 percent of the estimate at the 95 percent confidence level. The percentage of individuals who engaged in sandwich care has a margin of error that is ±12 percent of the estimate at the 95 percent confidence level. Individual types of caregiving do not sum to the total because some people provide multiple types of caregiving on the same day.
aCaring for adults of any age can include assisting with physical and medical care, as well as supervising an adult as a primary activity. Caring for adults who suffer from an age-related condition (generally older adults) can also include housekeeping, meals, and transportation. Primary child care is when the caregiver’s primary focus is helping or caring for a child (e.g., reading to a child). Secondary child care is when the caregiver’s primary focus is on something else (e.g., cooking) while keeping an eye on a child.
bAverage daily hours spent on unpaid household work are based on individuals engaged in each activity (i.e., conditional averages). Averages based on the full ATUS population (i.e., unconditional averages) would be lower—particularly for less common activities, such as sandwich care. The full ATUS population consists of those who are non-institutionalized, civilian, and at least 15 years of age.
cThis percentage refers to individuals who provided primary child care, secondary child care, or both. The average hours of primary and secondary child care is among those who engaged in either type.
dATUS flags respondents as eldercare providers who provided eldercare more than one time in the last 3 to 4 months, including respondents who did not provide eldercare on their diary day. If these respondents were included in the estimated percentage of individuals caring for adults, that estimate would increase to 16 percent.
eSandwich care is caring for children and adults on the same day. Individuals providing sandwich care are also reflected in the “adult care” and “all child care” rows of this table.
Factors that Affect Estimated Values of Unpaid Household Work
Estimated values of unpaid household work vary depending on (1) the methods used to value it (valuation methods); (2) whether wages are adjusted to reflect the quality of the work being done; and (3) whether secondary child care is included. Because estimated values of unpaid household work differ based on these methodological decisions, it is important for researchers to be transparent about them.
Valuation Methods
According to studies we reviewed and seven economists, monetary estimates of unpaid household work vary by valuation method. The two primary valuation methods are the “replacement wage method” and the “opportunity cost method”. These methods differ in how they assign hourly wages to unpaid household work. Regardless of the method used, researchers may also adjust wages to reflect work quality.
Replacement wage method. The replacement wage method values the time people spend on unpaid household work using hourly wages of paid professionals. BEA officials said they use this method because it (1) aligns with measurable market wages, (2) is straightforward and recommended by international organizations, and (3) facilitates comparisons of estimates between countries. Two economists we spoke with also recommended this method and one of them said it yields more realistic, consistent valuations than the opportunity cost method.[35]
The replacement wage method is further divided into a “generalist method” or “specialist method”. The generalist method assigns a single hourly wage to all unpaid work hours (e.g., the wage of a housekeeper). The specialist method assigns different hourly wages to different unpaid activities, attempting to more closely approximate the value of different types of unpaid work (e.g., child care or adult care).
Opportunity cost method. In contrast, the opportunity cost method values unpaid work at the hourly wage of the person engaging in the work—that is, what they earn in their paid job.[36] According to researchers, the opportunity cost method can be unclear for those without a wage, such as retirees. This method can also be inconsistent because (1) it assigns higher values to unpaid work done by higher-income individuals than lower-income individuals, and (2) an activity’s value depends more on the individual’s wage than on the activity itself.[37] For instance, this method assigns very different values to the same hour spent cooking by a high-wage lawyer and a low-wage cook.
Even so, two economists said that the opportunity cost method can better reflect how people value their own unpaid household work. For example, a worker with a higher opportunity cost (such as a high-wage lawyer) may choose to spend more time on paid work and less time on unpaid household work. Thus, the opportunity cost method may be more informative than the replacement wage method for assessing certain types of economic impacts, such as how tax policy changes or remote work options affect an individual’s decisions about allocating time between paid work and unpaid household work.
Adjusting Wages for Quality of Work
Regardless of the method used to value unpaid household work, economists may adjust wages to more precisely reflect differences in quality between unpaid and paid household work. For example, the quality of unpaid household work might be lower than that of paid professionals with specialized experience, according to researchers and two economists we interviewed. When valuing unpaid household work, researchers may decrease wages by varying amounts to account for such quality differences.[38]
Including or Excluding Secondary Child Care
Economists estimating the value of unpaid household work must also determine whether to include secondary child care and, if so, which wages to use. Including secondary child care can increase the number of hours, and therefore the value, of unpaid household work. Some studies value this time at lower wages than primary child care, and others exclude it.[39]
The studies we reviewed identify reasons for including secondary child care as well as reasons for excluding it. According to researchers, two reasons for including secondary child care are that it has value for a family and it limits the ability of caregivers to work outside the home.[40] In contrast, a BEA study identified two reasons for excluding secondary child care. First, it is unclear how much the wages used to value primary child care should be reduced in order to reflect the lesser amount of effort needed when providing secondary child care. Second, including secondary child care makes it difficult to analyze trends in unpaid household work because these data have not been consistently collected over time.[41]
Estimated Average Daily Value of Unpaid Domestic Tasks
Our estimate of the average daily value of unpaid domestic tasks (such as cooking and cleaning) was about $53 per person in 2024, among people who engaged in these tasks.[42] To develop this estimate, we used the median hourly wage in the Current Population Survey for workers in the private household sector. See text box and table 3.
|
Our Approach for Estimating the Value of Unpaid Household Work We used the replacement wage method to estimate the value of unpaid household work. This valuation method shows how the value of such work can vary depending on the wage chosen. Our choices of wages also adjust for work quality because they reflect occupations requiring differing skill levels. We estimated the median hourly earnings of full-time workers using 2024 Current Population Survey data. The three types of median wages we used were: · A generalist wage of workers in the private household sector ($18.00 per hour). We refer to this wage as a generalist housekeeper wage and used it to value unpaid household work overall as well as to value each type of unpaid work. · A lower specialist wage for each type of caregiving. For child care, we used the earnings for a child care worker ($17.50 per hour), and for adult care we used the earnings for personal care aides ($17.25 per hour). · An upper specialist wage for each type of caregiving. For child care, we used the earnings for a preschool or kindergarten teacher ($20.00 per hour), and for adult care we used the earnings for a nursing assistant ($19.00 per hour). To show how time spent on secondary child care affects the value of unpaid household work, we estimated our values both with and without this activity. We valued all secondary child care regardless of whether it overlapped with other types of unpaid household work. Our approach builds on the U.S. Bureau of Economic Analysis’s (BEA) methodology but differs in two main respects. First, while BEA uses a generalist wage to value all types of unpaid household work, we also apply specialist wages to caregiving to show a range of values for this type of work. Second, while BEA does not include secondary child care in its estimates of unpaid household work, we include it as a separate child care activity. This allows us to show how estimates of the time and value of unpaid work change when secondary child care is included or excluded. For more information on our valuation method, including the wages we used to value unpaid household work, see appendix I. Source: GAO analysis. | GAO‑26‑107871 |
Table 3: Estimated Average Daily Value of Unpaid Household Work, Per Person among Those Engaged in Each Type of Work, in 2024 Dollars
|
Type of unpaid household worka |
Valuation wage (hourly) |
Estimated average daily value per person |
||
|
|
Low |
High |
Low wage |
High wage |
|
Domestic tasks |
$18b |
$18b |
$52–$53 |
$52–$53 |
|
Caregiving (primary child care or caring for adults; excludes secondary child care)c |
Primary child care: $17.50; |
Primary child care: $20; |
$45–$50 |
$51–$56 |
|
Caregiving (primary child care, secondary child care, or caring for adults)c |
Primary child care: $17.50; Secondary child care: $8.75; Adult care: $17.30 |
Primary child care: $20; Secondary child care: $10; Adult care: $19 |
$74–$79
|
$84–$90 |
|
Helping adults |
$18b |
$18b |
$21–$23 |
$21–$23 |
|
All unpaid household work (excludes secondary child care)c |
Primary child care: $17.50; Domestic tasks / Helping adults: $18 |
Primary child care: $20; Domestic tasks / Helping adults: $18 |
$65–$68 |
$67-$70 |
|
All unpaid household work (includes secondary child care)c |
Primary child care: $17.50; Secondary child care: $8.75; Adult care: $17.25; Domestic tasks / Helping adults: $18 |
Primary child care: $20; Secondary child care: $10; Adult care: $19; Domestic tasks / Helping adults: $18 |
$77–$81 |
$81-$85 |
Source: GAO analysis of 2021–2024 American Time Use Survey (ATUS) data and wages from 2024 Current Population Survey data. | GAO‑26‑107871
Notes: ATUS records how respondents spent their time on a selected day (their “diary day”). We combined 4 years of ATUS data into a single dataset to estimate the average hours individuals spent on types of unpaid household work on their diary day. We then calculated the value of unpaid household work using estimated conditional average daily hours spent on each type of unpaid household work. The estimated daily hours reflect only those individuals engaged in each activity and should not be extrapolated to longer time periods. Analyses of the full ATUS population would be lower—particularly for less common activities, such as helping adults. The full ATUS population consists of those who are non-institutionalized, civilian, and at least 15 years of age. Values reflect the lower and upper bounds of the 95 percent confidence interval around the time-use estimate. Estimates by type of unpaid household work do not sum to the total because individuals may perform multiple types of work on the same day. All estimates have a margin of error that is no greater than ±10 percent of the estimate at the 95 percent level of confidence.
aDomestic tasks are done for one’s household (e.g., cooking and cleaning). Primary child care occurs when the caregiver’s primary focus is helping or caring for a child. Secondary child care is when the caregiver’s primary focus is on something else (e.g., cooking) while keeping an eye on a child. Caring for adults of any age can include assisting with physical and medical care, as well as supervising an adult. Caring for adults who suffer from an age-related condition (generally older adults) can also include housekeeping, meals, and transportation. Helping adults excludes adults of any age who suffer from an age-related condition. It includes helping adults with noncaregiving activities (e.g., giving rides to adults and helping adults living in a different household with domestic tasks).
bWe used a single wage ($18) to value domestic tasks and helping adults.
cTo value caregiving, we used a low and high wage to show how the value varies based on the selected wage. For details, see app. I.
Estimated Average Daily Value of Unpaid Caregiving
As shown in table 3 above, depending on the wages used, we estimated that the average daily value of unpaid caregiving provided to children or adults in 2024 ranged from about $45 to $56 per caregiver when secondary child care was excluded. When secondary child care was included, the value ranged from about $74 to $90 per caregiver.
The value of unpaid caregiving includes two separate estimates: child care and adult care. In addition, some caregivers provided sandwich care (both child care and adult care on the same day), which we present separately. As shown in table 4:
· Child care. The estimated average daily value of primary child care ranged from about $42 to $50 per caregiver, depending on the wage used to value this care. This was less than the estimated average daily value of secondary child care, which ranged from about $54 to $63 per caregiver.
· Adult care. The estimated average daily value of caring for adults ranged from about $51 to $64 per caregiver, depending on the wage used to value this care. This reflects the greater time spent on adult care than primary child care among such caregivers.
· Sandwich care. The estimated average daily value of caring for a child and an adult on the same day ranged from about $65 to $147 per caregiver, depending on the wage used and whether the value included secondary child care.[43]
Table 4: Estimated Average Daily Value of Unpaid Caregiving, Per Caregiver among Those Engaged in Each Type of Caregiving, in 2024 Dollars
|
Type of unpaid caregivinga |
Valuation wage (hourly) |
Estimated average daily value per person |
||
|
|
Low |
High |
Low wage |
High wage |
|
All child care (primary, secondary, or both)b |
Primary: $17.50; |
Primary: $20; |
$76–$80 |
$87–$92 |
|
Child care (primary) |
$17.50 |
$20 |
$42–$44 |
$48–$50 |
|
Child care (secondary) |
$8.75 |
$10 |
$54–$55 |
$61–$63 |
|
Adult care |
$17.25 |
$19 |
$51–$58 |
$56–$64 |
|
Sandwich care |
Primary: $17.50; |
Primary: $20; |
$65–$100 (excluding secondary child care) |
$101-$147 (including secondary child care) |
Source: GAO analysis of 2021–2024 American Time Use Survey (ATUS) data and wages from 2024 Current Population Survey data. | GAO‑26‑107871
Notes: ATUS records how respondents spent their time on a selected day (their “diary day”). We combined 4 years of ATUS data into a single dataset to estimate the average hours individuals spent on types of unpaid caregiving on their diary day. We then calculated the value of this time using the estimated conditional average daily hours spent on each type of unpaid caregiving. The estimated daily hours reflect only those individuals engaged in each activity and should not be extrapolated to longer time periods. Analyses of the full ATUS population would be lower—particularly for less common activities, such as adult care or sandwich care. The full ATUS population consists of those who are non-institutionalized, civilian, and at least 15 years of age. We used a low and high wage to show how the values vary based on the selected wage. For details, see app. I. Estimates in this table generally have a margin of error that is no greater than ±10 percent of the estimate itself at the 95 percent level of confidence. The low and high wage values for sandwich care have margins of error that are about ±21 percent and 19 percent of the estimates, respectively.
aCaring for adults of any age can include assisting with physical and medical care, as well as supervising an adult. Caring for adults who suffer from an age-related condition (generally older adults) can include housekeeping, meals, and transportation. Primary child care occurs when the caregiver’s primary focus is helping or caring for a child (e.g., reading to a child). Secondary child care is when the caregiver’s primary focus is on something else (e.g., cooking) while keeping an eye on a child. Sandwich care is caring for children (including primary or secondary child care) and adults on the same day.
bValues for child care (primary or secondary) do not sum to the total because individuals may perform both types of child care.
Estimated National Annual Market Value of Unpaid Household Work
We estimated that the national annual market value of all unpaid household work was at least $5.6 to $6.0 trillion (in 2024 dollars), depending on the market wages used.[44] This value is the equivalent of about 19.2 to 20.6 percent of GDP in 2024.[45] When secondary child care was included, the value ranged from $6.7 to $7.4 trillion, which was equivalent to about 23.0 to 25.2 percent of GDP in 2024. See table 5.
Table 5: Estimated National Annual Market Value of Unpaid Household Work, in 2024 Dollars and as a Percentage of 2024 Gross Domestic Product
|
Type of unpaid household worka |
Estimated annual market valueb |
Equivalent percentage of 2024 GDP |
|
Domestic tasks |
$4.3–$4.4 trillion |
14.7–15.1% |
|
Caregiving (primary child care or caring for adults; excludes secondary child care) |
$1.1–$1.4 trillionc |
3.9–4.9% |
|
Caregiving (primary child care, secondary child care, or caring for adults) |
$2.3–$2.8 trillionc |
7.8–9.5% |
|
Helping adults |
$157–$176 billion |
0.5–0.6% |
|
All Unpaid Household Work (excludes secondary child care)d |
$5.6–$6.0 trillionc |
19.2–20.6% |
|
All Unpaid Household Work (includes secondary child care)d |
$6.7–$7.4 trillionc |
23.0–25.2% |
|
Secondary child cared |
$1.1–$1.4 trillionc |
3.8–4.6% |
|
Sandwich cared (excludes secondary child care) |
$66.3–$114 billionc |
0.2–0.4% |
|
Sandwich cared (includes secondary child care) |
$111–$183 billionc |
0.4-0.6% |
Source: GAO analysis of 2021–2024 American Time Use Survey (ATUS) data, wages from 2024 Current Population Survey data, and 2024 Gross Domestic Product (GDP) from the U.S. Bureau of Economic Analysis. | GAO‑26‑107871
Notes: We combined 4 years of ATUS data (2021-2024) into a single dataset to estimate the national annual value of unpaid household work. The values of this work reflect the lower and upper bounds of the 95 percent confidence interval around these time-use estimates. In 2024, GDP was about $29.2 trillion (U.S. Bureau of Economic Analysis). Estimates generally have a margin of error that is no greater than ±10 percent of the estimate itself at the 95 percent level of confidence, except sandwich care estimates, which have margins of error that are about ±21 percent of the estimates.
aDomestic tasks are those done for one’s household (e.g., cooking and cleaning). Primary child care occurs when the caregiver’s primary focus is helping or caring for a child. Secondary child care is when the caregiver’s primary focus is on something else (e.g., cooking) while keeping an eye on a child. Caring for adults of any age can include assisting with physical and medical care, as well as supervising an adult as a primary activity. Caring for adults who suffer from an age-related condition (generally older adults) can include housekeeping, meals, and transportation. Helping adults excludes adults of any age who suffers from an age-related condition. It includes helping adults with noncaregiving activities (e.g., giving rides to adults and helping adults living in other households with domestic tasks). Sandwich care is caring for children (primary or secondary child care) and adults on the same day.
bThe estimated national annual market value of unpaid household work is based on the average time the entire ATUS population (i.e., those who are non-institutionalized, civilian, and at least 15 years of age) spent on unpaid household work.
cValues differ depending on the wages used for valuation.
dValues for secondary child care and sandwich care are listed separately but are included in the values for caregiving and all unpaid household work.
BEA uses a similar method to value the time spent on unpaid household work. The agency estimated that this value was similarly equivalent to about 19 percent of GDP in 2020 when excluding the value that consumer durable services provided over time.[46]
Characteristics of Individuals Engaged in Unpaid Household Work
Characteristics of Those Engaged in Unpaid Household Work Compared to the U.S. Population
Using ATUS data from 2021 through 2024 we compared the characteristics of individuals engaged in unpaid household work on a typical day with those of the overall U.S. population.[47] As shown in figure 2, we found that:
· Gender. Women were overrepresented among individuals who engaged in unpaid household work (about 53.9 percent, compared to about 51.2 percent of the U.S. population), while men were underrepresented (about 46.1 percent, compared to about 48.8 percent of the U.S. population).[48]
· Marital status. Married individuals were overrepresented among individuals who engaged in unpaid household work (about 58.4 percent, compared to about 56.5 percent of the U.S. population), while unmarried individuals were underrepresented (about 41.6 percent, compared to about 43.5 percent of the U.S. population).[49]
· Employment status. Employed individuals were represented at similar rates among those engaged in unpaid household work and in the U.S. population (about 63 percent). Individuals who were not employed made up about 37 percent of both of these populations.[50]
· Annual family income. Individuals in each family income group were represented at similar rates among those engaged in unpaid household work and in the U.S. population.[51] For example, about 30.2 percent of individuals engaged in unpaid household work had annual family incomes between $75,000 and $149,999, as did about 30.2 percent of the U.S. population.
Figure 2: Selected Characteristics of Individuals Engaged in Unpaid Household Work on a Typical Day, Compared to the U.S. Population, 2021–2024
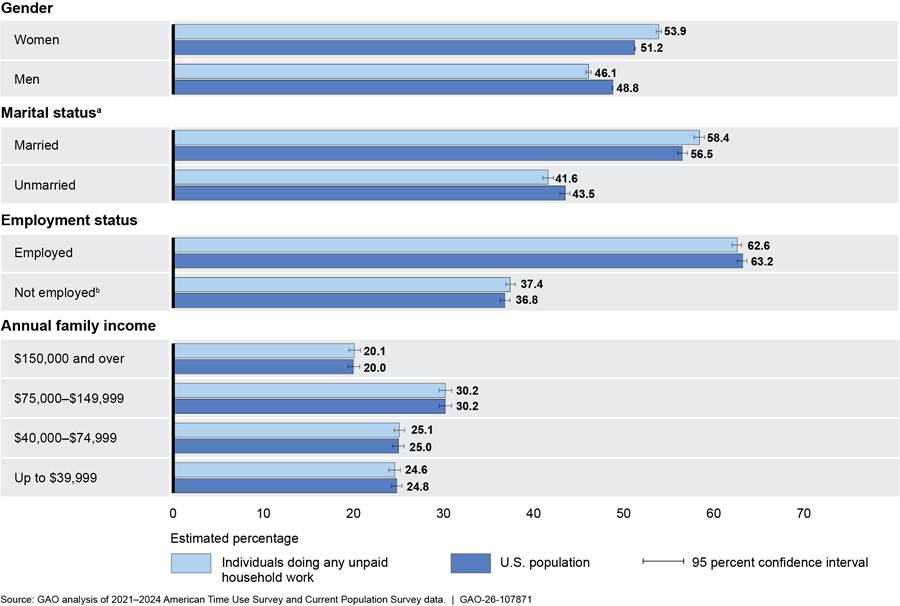
Notes: We combined 4 years of American Time Use Survey data into a single dataset to estimate the percentages of individuals in the U.S. ages 15 and older who engaged in unpaid household work. All estimates in this figure have a margin of error that is no greater than ±15 percent of the estimate itself at the 95 percent level of confidence.
aWe defined married individuals as either married and living with their spouse or not married and living with a partner. We defined unmarried individuals as either not married and not living with a partner or married and their spouse was absent.
bIndividuals who were not employed were either unemployed or not in the labor force.
Time Spent by Different Groups on Unpaid Domestic Tasks
Using ATUS data from 2021 through 2024, we also examined the amount of time that different groups spent on domestic tasks in a typical day.[52]
We found that women, married individuals, individuals who were not employed, and those ages 55 and over spent the most time engaged in unpaid domestic tasks. For example, individuals who were not employed spent about 1 more hour per day on domestic tasks than those who were employed. Individuals with the lowest family income ($39,999 or less) spent about 0.34 hours—or about 20 minutes—more per day engaged in this work than those with the highest income ($150,000 or more). See figure 3.
Figure 3: Average Hours Spent on Unpaid Domestic Tasks on a Typical Day, by Selected Characteristics, 2021–2024
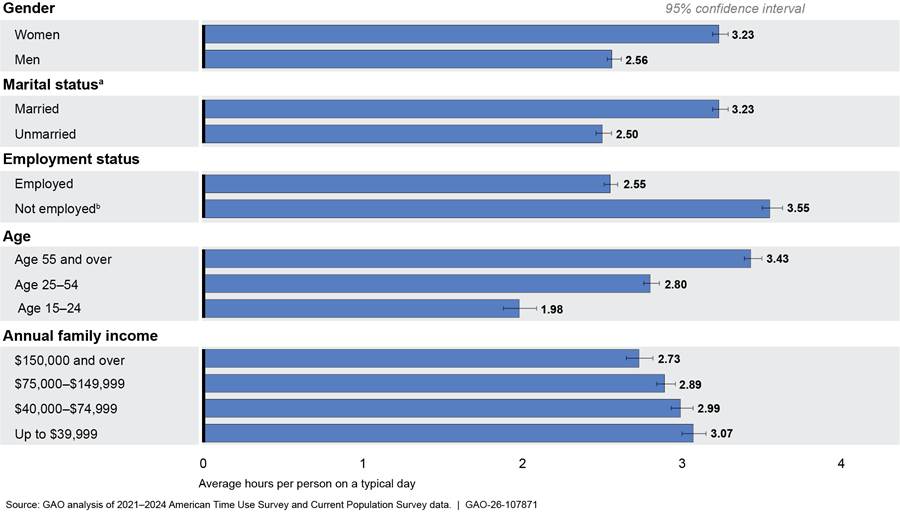
Notes: We combined 4 years of American Time Use Survey data into a single dataset to estimate the average hours that groups (e.g., women vs. men) spent on unpaid household work. Specifically, we estimated average hours for individuals engaged in such work. Domestic tasks are tasks done for one’s own household, such as cooking and cleaning. In general, we report differences between groups in the amount of time spent on unpaid household work when (1) statistical tests indicated a significant difference (p-value is below 0.05) and (2) there was at least a 20-minute (about 0.33 hours) difference in the amount of time the groups spent on the work. All estimates in this figure have a margin of error that is no greater than ± 15 percent of the estimate itself at the 95 percent level of confidence.
aWe defined married individuals as either married and living with their spouse or not married and living with a partner. We defined unmarried individuals as either not married and not living with a partner or married and their spouse was absent.
bIndividuals who were not employed were either unemployed or not in the labor force.
Time Spent by Different Groups on Unpaid Child Care
Similar to domestic tasks, from 2021 through 2024, those spending the most time on either primary or secondary child care on a typical day were women, married individuals, and individuals who were not employed. Also, like domestic tasks, individuals across all family income levels generally spent similar amounts of time on child care. In contrast to domestic tasks, however, older and individuals aged 25 to 54 who provided primary child care spent similar amounts of time doing so. Individuals aged 25 to 54 also spent the most time on secondary child care. Lastly, individuals providing unpaid child care generally spent more than twice as much time on secondary child care as they did on primary child care on a typical day. See figure 4.
Figure 4: Average Hours Spent on Primary and Secondary Child Care on a Typical Day, by Selected Characteristics, 2021–2024
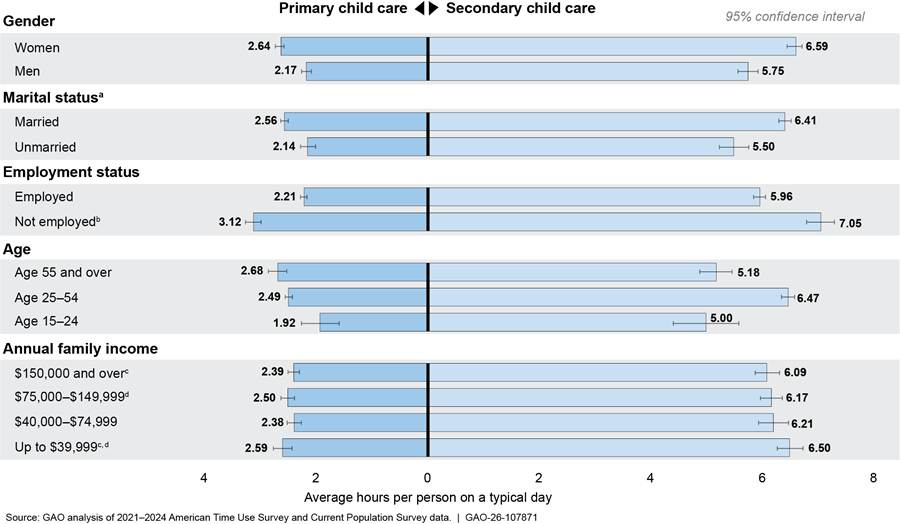
Notes: We combined 4 years of American Time Use Survey data into a single dataset to estimate the average hours that groups (e.g., women vs. men) spent on unpaid caregiving. Specifically, we estimated average hours for individuals engaged in such work. Primary child care is when the caregiver’s focus is caring for or helping a child (e.g., reading to a child). Secondary child care is when the caregiver’s primary focus is on something else (e.g., cooking) while keeping an eye on the child. In general, we report differences between groups in the amount of time spent on unpaid household work when (1) statistical tests indicated a significant difference (p-value is below 0.05) and (2) there was at least a 20-minute (about 0.33 hours) difference in the amount of time the groups spent on the work. We do not conclude that groups spent similar or different amounts of time on unpaid household work when the difference in time was (1) at least 20 minutes and (2) statistically insignificant (p-value is at least 0.05). Estimates in this figure generally have a margin of error that is no greater than ±15 percent of the estimate itself at the 95 percent level of confidence. The hourly primary child care average for individuals ages 15-24 has a margin of error that is about ±18 percent of the estimate itself at the 95 percent level of confidence.
aWe defined married individuals as either married and living with their spouse or not married and living with a partner. We defined unmarried individuals as either not married and not living with a partner or married and their spouse was absent.
bIndividuals who were not employed were either unemployed or not in the labor force.
cWe could not determine whether individuals with family incomes of $150,000 and overspent a similar or different amount of time on secondary child care compared to those with incomes up to $39,999.
dWe could not determine whether individuals with family incomes between $40,000 and $74,999 spent a similar or different amount of time on secondary child care compared to those with incomes up to $39,999.
Time Spent by Different Groups on Unpaid Care and Help for Adults
In contrast to child care, from 2021 through 2024, women and men who cared for adults spent similar amounts of time doing so (about 3.17 and 3.11 hours per day, respectively), as did married and unmarried individuals (about 3.24 and 2.99 hours per day, respectively), according to our analysis of ATUS data. Individuals who spent the most time caring for adults generally were not employed, were older, and had lower annual family incomes.[53] In addition, we examined the characteristics of individuals who helped adults, and found that women and men spent similar amounts of time doing so (about 1.12 to 1.33 hours on a typical day), as did married and unmarried individuals. See figure 5.
Figure 5: Average Hours Spent Caring for and Helping Adults on a Typical Day, by Selected Characteristics, 2021–2024
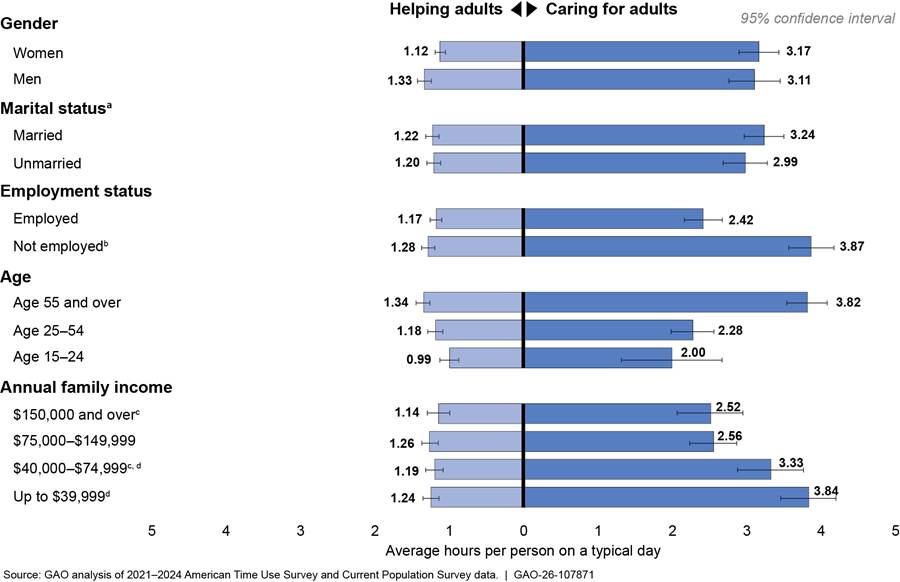
Notes: We combined 4 years of American Time Use Survey data into a single dataset to estimate the average hours that groups (e.g., women vs. men) spent on unpaid caregiving. Specifically, we estimated average hours for individuals engaged in such work. Caring for adults includes caring for individuals ages 18 or older. Care can include assisting with physical and medical care, as well as supervising an adult. About 71 percent of the caregivers provided eldercare. ATUS defines eldercare as providing care to an adult, regardless of age, who suffers from an age-related condition. Eldercare can also include assisting with housekeeping, meals, and transportation, or providing companionship. Helping adults excludes adults of any age who suffer from age-related conditions. It includes helping adults with noncaregiving activities (e.g., giving rides to adults and helping adults who do not live in their household with domestic tasks). In general, we report differences between groups in the amount of time spent on unpaid household work when (1) statistical tests indicated a significant difference (p-value is below 0.05) and (2) there was at least a 20-minute (about 0.33 hours) difference in the amount of time the groups spent on the work. We do not report that groups spent similar or different amounts of time on unpaid household work when the difference in time was (1) at least 20 minutes and (2) statistically insignificant (p-value is at least 0.05). Estimates in this figure generally have a margin of error that is no greater than ±15 percent of the estimate itself at the 95 percent level of confidence. The estimates for average hours of adult care provided by individuals ages 15-24 and by those with a family income of $150,000 and over have margins of error that are about ±34 percent and 18 percent of the estimates themselves, respectively, at the 95 percent level of confidence.
aWe defined married individuals as either married and living with their spouse or not married and living with a partner. We defined unmarried individuals as either not married and not living with a partner or married and their spouse was absent.
bIndividuals who were not employed include those who were unemployed as well as those not in the labor force.
cWe could not determine whether individuals with family incomes of $150,000 and over spent a similar or different amount of time on adult care compared to those with incomes between $40,000 and $74,999.
dWe could not determine whether individuals with family incomes between $40,000 and $74,999 spent a similar or different amount of time on adult care compared to those with incomes up to $39,999.
Agency Comments
We provided a draft of this report to the Department of Labor and the Department of Commerce for review and comment. The Department of Labor did not have any comments. The Department of Commerce indicated that the Bureau of Economic Analysis issued a staff working paper in June 2026 that included updated household production estimates.[54]
We are sending copies of this report to the appropriate congressional committees, the Secretary of Labor, the Secretary of Commerce, and other interested parties. In addition, the report is available at no charge on the GAO website at https://www.gao.gov.
If you or your staff have any questions about this report, please contact us at CostaT@gao.gov or HoffmanME@gao.gov. Contact points for our Offices of Congressional Relations and Media Relations may be found on the last page of this report. GAO staff that made key contributions to the report are listed in appendix IV.
Sincerely,

Thomas Costa, Director
Education, Workforce, and Income Security
Michael Hoffman, Chief Economist
Applied Research and Methods
This report (1) describes how, if at all, estimating the time and monetary value of unpaid household work could supplement data on the economy and inform policies that affect caregivers, (2) estimates the time individuals spent on unpaid household work and calculates monetary value of this work, and (3) determines the characteristics of individuals who performed unpaid household work and whether these characteristics vary by type of work performed.
For all objectives, we conducted a comprehensive literature review and interviewed economists knowledgeable about estimating the time and value of unpaid household work, all of whom were affiliated with universities, think tanks, or federal government agencies.
For our second and third objectives, we also analyzed 2021-2024 American Time Use Survey (ATUS) data and 2024 Current Population Survey (CPS) data, which were the most recent available data at the time of our analysis.[55] The ATUS collects annual information on how individuals in the U.S. spent their time across a wide range of activities, including those related to unpaid household work.[56] It also collects respondents’ demographic information, such as their gender, age, spousal/partner cohabitation status, and labor force status.[57] We selected the ATUS because it allowed us to measure the number of hours individuals spent on unpaid household work and to analyze the characteristics of those who performed this work. The CPS serves as the primary survey for U.S. labor force information, including individuals’ hourly wages, weekly earnings, weekly hours worked, occupation, and industry. We selected the CPS because it collects demographic information that ATUS does not, such as family income and characteristics of household members, and can be linked to ATUS data. In addition, for our second objective, we used ATUS data to estimate the average hours spent on unpaid household work and then multiplied those hours by replacement wages to estimate daily and annual values (see below).[58]
Our analysis of ATUS and CPS data is intended to describe patterns in time use, not to explain what factors cause different patterns of time use. Because the ATUS and CPS are sample surveys, all of the analysis results presented in this report are estimates. The survey respondents represent one of many possible sets of individuals that could have been surveyed. Because different sets of respondents could produce different estimates of a population value—such as the percentage of individuals caring for an adult—we express the precision of the results using a 95 percent confidence interval, which is the estimate plus or minus the margin of error. This interval would contain the true population value for 95 percent of the possible sets of individuals that could have been surveyed. We provide 95 percent confidence intervals throughout the report, including within tables and figures.
Unless otherwise noted, all estimates in the second objective have a margin of error no greater than plus or minus 10 percent of the estimate itself and all estimates in the third objective have a margin of error no greater than plus or minus 15 percent of the estimate itself. Many estimates have a margin of error that is substantially lower than plus or minus 10 or 15 percent of the estimate itself. For example, most percentages (e.g., percentage of individuals engaging in domestic tasks) have a margin of error that is no greater than about plus or minus 5 percent of the estimate itself. Finally, we treated our calculated replacement wage rates as constants and did not report their 95 percent confidence. intervals
Literature Review
We conducted a literature review to better understand how, if at all, estimating the time and value of unpaid household work can enhance economic statistics and inform policies that affect caregivers (objective 1). We also used some of the studies identified in the search to help us make decisions about our methodologies for estimating the time and value of this work (objective 2) and describing the characteristics of individuals engaging in it (objective 3).[59]
We conducted a comprehensive search of the Econolit, Scopus, and Proquest databases, among others, to identify relevant scholarly and peer-reviewed studies published between 2015 and 2025.[60] The search focused on identifying studies that (1) used estimates of the time and value of unpaid household work when discussing U.S. economic performance or social policies; (2) estimated the time spent on all or particular types of unpaid household work, either overall or by demographic group; or (3) discussed methods for valuing the time spent on unpaid household work or monetarily valued this work. Our search identified an initial pool of 156 studies.
Three GAO analysts independently reviewed these 156 studies—by either reviewing the abstracts or the studies themselves—and reached agreement that 28 of them were possibly relevant to our scope. We added nine additional studies recommended by economists we interviewed to these 28 studies, for a total of 37 studies. We then reviewed all 37 of these studies for relevance. A GAO economist or methodologist also reviewed the subset of 25 empirical studies for methodological quality. Reviewers considered, for example, the strengths and limitations of the research methods used in the studies and the extent to which they supported the studies’ findings and conclusions. Reviewers of studies that estimated values of unpaid household work also considered whether such studies included variance estimates and sensitivity analyses. Sensitivity analyses test the impact of changes on key assumptions. As a result of this process, we determined that 33 studies were sufficiently relevant and featured sufficiently strong research methods to provide evidence or context for one or more of our objectives.[61]
Interviews with Economists
For all objectives, we interviewed six economists knowledgeable about estimating the time and value of unpaid household work. We used a semi-structured set of interview questions tailored to the expertise of each economist. We generally selected economists who published one or more studies identified through our literature search or who were referred to us by other economists we interviewed. We also interviewed knowledgeable economists at the U.S. Bureau of Economic Analysis (BEA) and BLS.
We sought to obtain a range of perspectives on valuing unpaid household work. First, we selected economists who had a range of institutional affiliations, such as with universities, government agencies, or think tanks. Second, we selected economists who had published studies on different aspects of unpaid household work, such as valuing all unpaid work from a macroeconomic perspective or examining particular types of unpaid work (e.g., child care or eldercare) across various subfields (e.g., labor economics, health economics, or the economics of aging).
Defining Unpaid Household Work
To define unpaid household work, we reviewed relevant studies that used ATUS data, selected types of unpaid household work that were commonly included in those studies and then categorized ATUS activities within those types of work. As noted above, ATUS collects annual information on how individuals in the U.S. spent their time across a wide range of activities, including those related to unpaid household work. Each ATUS respondent reports on (1) the activities they performed over a 24-hour period (known as the respondent’s diary day), which is assigned to a day of the week, and (2) how much time they spent on each of these activities. However, a limitation of ATUS is that it generally does not capture activities respondents may routinely do that did not fall on their diary day.[62]
ATUS’s design ensures that the days on which respondents report their activities are representative of all days of the week.[63] Therefore, ATUS data provides estimates—such as the average hours individuals in the population spent on activities and the number of individuals doing them—to reflect a typical day.
To determine which activities to include in our definition of unpaid household work, we relied on three prior studies that used ATUS to analyze this work.[64] These studies consistently defined unpaid household work as work that an individual could pay someone else to do if they did not do it themselves. Although these studies differed somewhat in the specific activities they included, they generally agreed that certain activities should be included in unpaid household work. In addition, we consulted knowledgeable government officials and economists, including authors of two of these studies, to determine which activities to include in our definition of unpaid household work. As a result of this process, we defined unpaid household work as including domestic tasks, primary child care, secondary child care, caring for adults (age 18 or older), sandwich care, and helping adults.[65]
Next, we reviewed ATUS’s three-tiered system for categorizing activities, and we sorted our selected activities by type of unpaid household work. First-tier categories include broad sets of activities, such as Caring for and Helping Household Members. Second-tier categories are more specific, including Caring for and Helping Household Children, Caring for Household Adults, and Helping Household Adults.[66] Finally, third-tier categories are even more specific, such as Physical Care for Household Children and Reading to/with Household Children. In addition, ATUS reports the amount of time respondents spent on secondary child care (keeping an eye on a child under age 13 while performing any other activity). It also reports the amount of time respondents spent on eldercare (caregiving for an adult suffering from an age-related condition). Table 6 shows how we categorized the activities we selected as unpaid household work by the type of unpaid work.
|
Type of unpaid household work used |
Included activities from ATUS |
|
Domestic tasksa |
· First-tier categories: Household Activities (e.g., cooking and cleaning), Consumer Purchases (e.g., grocery shopping), and Household Services (e.g., hiring a cleaning service or maid). · Second-tier categories: Financial Services and Banking, Travel Related to Household Activities, Travel Related to Consumer Purchases, and Travel Related to Using Household Services. · Third-tier categories: Telephone Calls to/from Salespeople, Household Services Providers, or Paid Child or Adult Care Providers; and Travel Related to Using Financial Services and Banking. |
|
Primary child careb,c |
· Second-tier categories: Caring for and Helping Household (or non-Household) Children, Activities Related to Household (or non-Household) Children’s Education, Activities Related to Household (or non-Household) Children’s Health. · Third-tier categories: Using Child Care Services (e.g., talking with a child care provider), Travel Related to Caring for and Helping Household (or non-Household) Children, Travel Related to Household Children’s Education, Travel Related to Household (or non-Household) Children’s Health, and Travel Related to Using Child Care Services. |
|
Secondary child careb |
· Any activity where ATUS flags the respondent as providing secondary child care to a child under the age of 13. |
|
Caring for adults (age 18 and older)c,d |
· Second-tier categories: Caring for Household (or non-Household) Adults. · Third-tier categories: Travel Related to Caring for Household (or non-Household) Adults. · Any activity that ATUS flagged as eldercare for household or non-household members. · Any activity that ATUS classified as Helping Household Adults if a person in the room at the time of the activity was flagged as having a disability.e |
|
Sandwich carec,f |
· Activities from Primary Child Care, Secondary Child Care, and Caring for Adults. |
|
Helping adultsc,g |
· Second-tier categories: Helping Household (or non-Household) Adults. · Third-tier categories: Travel Related to Helping Household (or non-Household) Adults. |
Source: GAO summary of ATUS activity categories by type of unpaid household work. | GAO‑26‑107871
Notes: ATUS organizes the activities respondents performed into three categories. First-tier categories include broad sets of activities, second-tier categories are more specific, and third-tier categories are even more specific. ATUS does not capture activities respondents may routinely do that did not occur on the day they were assigned to report their activities (i.e., the diary day).
aDomestic tasks are those done for one’s own household (e.g., cooking, shopping, laundry and cleaning).
bPrimary child care is when the caregiver’s primary focus is on the child (e.g., reading to the child). Secondary child care is when the caregiver’s primary focus is on something else (e.g., cooking) while keeping an eye on a child.
cActivities related to child care, adult care, and helping adults are organized under a broad first-tier category, Caring for and Helping Household (or non-Household) Members. We relied on more specific second-tier categories to distinguish these types of work.
dWe combined care for adults with and without age-related conditions into a single adult care category to ensure that our corresponding estimates were reliable. We estimated that about 71 percent of the individuals providing adult care did so for someone with an age-related condition, which ATUS defines as eldercare. ATUS documentation states, “Eldercare can involve assisting with grooming and feeding, preparing meals, arranging medical care, and providing transportation or companionship”.
eU.S. Bureau of Labor Statistics (BLS) officials said that these activities may reflect cases where the respondent was assisting or caring for someone with a disability. They also noted that the data do not explicitly indicate whether the person who received assistance or care had a disability in cases where multiple household members were in the room with the respondent.
fSandwich care occurs when a survey respondent cared for both a child and an adult on the particular diary day for which the respondent reports their activities.
gHelping adults includes a wide variety of activities that do not necessarily reflect assistance for an adult with an age-related condition. This includes giving them rides or helping them with their taxes. It also includes helping adults living in other households with domestic tasks.
Estimating the Monetary Value of Unpaid Household Work
We used the replacement wage method to estimate the monetary value of unpaid household work, drawing on prior studies, guidance on how to value unpaid household work, and input from knowledgeable economists.[67] We chose this method because it aligns with measurable market wages, is straightforward, and provides realistic and consistent valuations using the same wages across all individuals engaged in unpaid household work.
The replacement wage method values the hours that people spend on unpaid household work using the hourly wage rates of paid professionals. We used two variations of this method: the generalist wage method and the specialist wage method. The generalist method values all unpaid household work hours using a single hourly wage, while the specialist method assigns different wages to different types of unpaid household work, such as primary child care.[68] Replacement wages for both methods can be based on those of workers from occupations or industries that are relevant to unpaid household work activities, such as a child care worker or a worker in the private household industry (e.g., cooks, maids, and nannies).
To identify replacement wages from relevant occupations or industries, we (1) reviewed the occupations and industries used in prior studies, (2) consulted knowledgeable economists, and (3) assessed which occupational and industry classifications in the CPS data aligned with the ATUS activities we categorized under each type of unpaid household work.[69] All the wages we selected met at least two of the three criteria listed above. In addition, we selected both lower- and upper-bound specialist wages for caregiving, as studies note that values of unpaid household work vary with the wages used to value caregiving.[70] Furthermore, we chose the hourly earnings of workers in the private household industry to value all unpaid household work under the generalist method, as well as to value domestic tasks and helping adults under the specialist method.[71] We then used CPS data from 2024 to estimate median hourly earnings of full-time workers in each occupation or industry, which served as our replacement wage rates. (See table 7.)
|
Type of unpaid household worka |
Occupation or industry |
Standard Occupational Classification (SOC) or North American Industry Classification System (NAICS) code |
Median hourly wage rate |
|
Domestic tasks |
Private household industry (workers employed in this industry include nannies & housekeepers)b |
NAICS: 814 |
$18.00 |
|
Helping adults |
|||
|
Primary child carec |
Lower bound wage: Child care worker |
SOC: 39-9011 |
$17.50 |
|
Upper bound wage: Preschool & kindergarten teacher |
SOC: 25-2010 |
$20.00 |
|
|
Secondary child care c,d |
Lower bound wage: Child care worker |
SOC: 39-9011 |
$8.75 |
|
Upper bound wage: Preschool & kindergarten teacher |
SOC: 25-2010 |
$10.00 |
|
|
Caring for adults (age 18 and older)c |
Lower bound wage: Personal care aide |
SOC: 31-1122 |
$17.25 |
|
Upper bound wage: Nursing assistant |
SOC: 31-1131 |
$19.00 |
Source: GAO summary of occupational and industry classifications and analysis of 2024 Current Population Survey (CPS) data. | GAO‑26‑107871
Note: We used CPS data to estimate the median hourly wages for full-time workers within each occupation or industry. These medians serve as our replacement wages. Each occupation and industry is identified by its SOC (occupational) or NAICS (industry) classification code.
aDomestic tasks are those done for one’s own household (e.g., cooking and cleaning). Helping adults includes helping them with noncaregiving activities (e.g., giving adults rides and helping adults living in other households with domestic tasks). It excludes adults of any age who suffer from an age-related condition. Primary child care is when the caregiver’s primary focus is helping or caring for a child (e.g., reading to a child). Secondary child care is when the caregiver’s primary focus is on something else (e.g., cooking) while keeping an eye on a child. Caring for adults who suffer from an age-related condition (generally older adults) can include housekeeping, meals, and transportation.
bThe generalist method values all unpaid household work hours using a single wage of workers in the private household industry, while the specialist method assigns different wages to different types of unpaid household work (such as primary child care). We valued domestic tasks and helping adults with the same wage reflecting an industry, rather than an occupation, because these types of work encompass a wide variety of activities.
cThe three types of unpaid caregiving use lower- and upper- bound wages to reflect that the values of this work vary with the wages used.
dWe valued secondary child care at one-half the wage rates for primary child care to reflect that this type of work is less intensive than primary child care. Studies that value secondary child care tend to do so using a lower wage than for primary child care. See for example, Suh, Jooyeoun, and Nancy Folbre. “Valuing unpaid child care in the U.S.: A Prototype Satellite Account Using the American Time Use Survey.” Review of Income and Wealth 62, no. 4 (2016).
We estimated the (1) average per-person daily value and (2) national annual market value of unpaid household work overall and by type of work. To calculate the average per-person daily value, we first used ATUS data to estimate the average daily hours individuals spent on each type of unpaid household work among those who were engaged in that type of work. Next, we multiplied the averages by the replacement wages we selected to estimate the daily dollar value. To calculate the national annual market value, we estimated the average hours the entire population (i.e., those who are non-institutionalized, civilian, and at least 15 years of age) spent doing each type of unpaid household work.[72] We then multiplied the averages by the replacement wages, the estimated population size, and 365 to obtain the annual dollar value. We also divided these annual values by 2024 GDP to express them as a percentage of national output.[73]
To estimate the value of sandwich care, we aggregated the values for child care and adult care among individuals engaging in both activities on the same day. Child care included primary child care, secondary child care, or both. Also, values for aggregate unpaid household work categories that included secondary child care, such as all unpaid household work, account for all secondary child care hours, regardless of whether they overlapped with hours spent on other types of unpaid household work.[74]
As a methodological check, we used 2017 ATUS data to estimate the value of unpaid household work and compared it with BEA’s 2017 estimate for its Household Production Satellite Account. We found that these estimates were within 3 percent of each other. After discussing the difference with BEA, we determined that it was explained by differences in methodology.[75] As a result, we consider our 2017 estimate to be consistent with BEA’s 2017 estimate.[76]
The replacement wage method for valuing unpaid household work is subject to two limitations. First, estimated monetary values are sensitive to the choice of replacement wages because different wage selections yield different values. Second, the method assumes that the value of time spent on unpaid household work is equivalent to the wages of paid professionals who do such work. However, because the quality or productivity of work done by paid professionals may be higher than similar work done by individuals who are not professionals, using professional wages to value unpaid household work may overstate its value.[77] We mitigate these limitations when valuing unpaid caregiving by using a range of specialist wages to provide upper- and lower-bound estimates. For our other categories of unpaid household work—domestic tasks and helping adults—we use a generalist household industry wage because it encompasses the wide variety of activities included in these categories. BEA uses a similar generalist wage when valuing unpaid household work and has found that this approach results in reasonable lower-bound estimates that are useful in economic analysis.
Describing the Characteristics of Individuals Engaging in Unpaid Household Work
Using ATUS data, we estimated the share of individuals in the U.S. who performed any unpaid household work, as well as the shares of those engaging in each type of work. We also estimated the average number of hours that individuals spent on each type of unpaid household work among those who did that type of work in a typical day. To estimate and report average hours for types of unpaid household work that included secondary child care—such as all child care—we avoided double counting by excluding secondary child care hours that overlapped with the relevant types of unpaid household work (e.g., primary child care).
To describe the demographic characteristics of individuals who engaged in at least one type of unpaid household work, we estimated the percentage of these individuals in each demographic group. Characteristics we analyzed include: gender, age, family income, marital status, and employment status. See table 8.
|
Characteristic |
Group |
|
Gendera |
· Women · Men |
|
Age |
· Ages 15-24 · Ages 25-54 · Ages 55 and over |
|
Annual family income |
· Up to $39,999 · $40,000 to $74,999 · $75,000 to $149,999 · $150,000 and over |
|
Marital statusb |
· Married · Unmarried |
|
Employment statusc |
· Employed · Not employed |
Source: GAO analysis of 2021–2024 ATUS and Current Population Survey (CPS) data. | GAO‑26‑107871
Notes: ATUS records how respondents spent their time on a selected day (their “diary day”). We combined 4 years of ATUS data into a single dataset to estimate both the percentages of individuals in the U.S. ages 15 and older who engaged in unpaid household work on their diary day, and the average hours they spent on this work. All demographic variables in this table came from ATUS, except for annual family income, which came from CPS. All ATUS respondents are randomly selected among individuals who previously participated in the CPS survey. We linked these respondents to information from the CPS on annual family income.
aATUS asks survey respondents to identify their sex (male or female). In this report, we use the term “gender” to refer to these data, and we generally use the terms “men” and “women” to refer to individuals who identified their sex as male or female, respectively.
bWe defined married individuals as those who are married and live with their spouse or those who are unmarried and live with a partner. We defined unmarried individuals as those who are not married or their spouse or partner is absent. We created these groups using a spouse/partner cohabitation variable from ATUS.
cIndividuals who were not employed include those who were unemployed as well as those not in the labor force.
In addition, we assessed whether certain demographic groups were overrepresented among individuals engaging in unpaid household work. Specifically, for each demographic group we analyzed, we compared the percentage of individuals who engaged in unpaid household work with the percentage of individuals in the overall U.S. population.[78] We classified a group as overrepresented if its share of individuals engaging in unpaid household work was greater than its share of the overall population and the 95 percent confidence intervals for the estimates did not overlap. When the confidence intervals for the estimates overlapped, we reported that the percentages were similar.[79]
We also estimated the average number of hours that each demographic group spent on each type of unpaid household work in a typical day. Specifically, for each type of work, we compared the estimates for groups (e.g., women versus men) and conducted statistical tests to determine whether they spent a different or similar amount of time on that type of unpaid household work. In general, we report differences between groups in the amount of time spent on unpaid household work when (1) statistical tests indicated a significant difference and (2) there was at least a 20-minute difference in the amount of time each group spent on the work.[80] We also generally report that groups spent a similar amount of time on unpaid household work when there was less than a 20-minute difference in the amount of time the groups spent on the work, regardless of whether statistical tests indicated a significant difference. We do not report that groups spent similar or different amounts of time on unpaid household work when the difference was (1) at least 20 minutes and (2) statistically insignificant (p-value is at least 0.05).
Data Reliability
To assess the reliability of the ATUS and CPS data, we reviewed documentation, interviewed knowledgeable government officials, and performed electronic data checks. Specifically, we:
· Reviewed technical documentation on the design of ATUS and CPS and the data elements contained in each;
· Interviewed and obtained written responses from BLS and BEA officials who were knowledgeable about these data sources; and
· Conducted electronic tests to assess the accuracy and completeness of the data.
We determined that these data were sufficiently reliable for the purposes of estimating the time and value of unpaid household work, describing the characteristics of individuals engaging in such work, and comparing unpaid household work hours between different demographic groups.
We conducted this performance audit from October 2024 to September 2026 in accordance with generally accepted government auditing standards. Those standards require that we plan and perform the audit to obtain sufficient, appropriate evidence to provide a reasonable basis for our findings and conclusions based on our audit objectives. We believe that the evidence obtained provides a reasonable basis for our findings.
We calculated annual per person values of each type of unpaid household work using estimated unconditional average hours that individuals ages 15 and older spent on each type of unpaid work on a specific day (i.e., their diary day). We did this to be able to multiply daily average hours by 365 days. Because ATUS collects data on how respondents spend their time on a diary day, unconditional averages must be used when estimating annual values of unpaid household work. Doing so, however, results in values that represent the average time spent by non-institutionalized, civilian, U.S. individuals ages 15 or older, regardless of whether they did the unpaid household work being valued.
|
Type of unpaid household worka |
Valuation wage (hourly) |
Estimated average annual values per person |
||
|
|
Low |
High |
Low wage |
High wage |
|
Domestic tasks |
$18b |
$18b |
$15,919–$16,357 |
$15,919–$16,357 |
|
Caregiving (primary child care or caring for adults; excludes secondary child care)c |
Primary child care: $17.50; |
Primary child care: $20; |
$4,264 –$4,648 |
$4,826 –$5,258 |
|
Caregiving (primary child care, secondary child care, or caring for adults)c |
Primary child care: $17.50; |
Primary child care: $20; |
$8,428–$9,033
|
$9,585 –$10,269 |
|
Helping adults |
$18b |
$18b |
$581–$652 |
$581–$652 |
|
All unpaid household work (excludes secondary child care)c |
Primary child care: $17.50; |
Primary child care: $20; |
$20,764 –$21,657 |
$21,326-$22,267 |
|
All unpaid household work (includes secondary child care)c |
Primary child care $17.50; |
Primary child care: $20; |
$24,929–$26,042 |
$26,086-$27,278 |
Source: GAO analysis of 2021–2024 American Time Use Survey (ATUS) data and wages from 2024 Current Population Survey data. | GAO‑26‑107871
Notes: ATUS records how respondents spent their time on a selected day (their “diary day”). We combined 4 years of ATUS data into a single dataset to estimate the average hours spent on types of unpaid household work across diary days. Values reflect the lower and upper bounds of the 95 percent confidence interval around the time-use estimate. The values in this table use estimated unconditional average annual hours spent on each type of unpaid household work. These estimated hours reflect the full ATUS population (i.e., those who are non-institutionalized, civilian, and at least 15 years of age). Analyses of only individuals engaged in each activity—that is, conditional averages—would be higher, particularly for less common activities, such as caring for or helping adults. Estimates by type of unpaid household work do not sum to the total because individuals may perform multiple types of work on the same day. All estimates have a margin of error that is no greater than ±10 percent of the estimate at the 95 percent level of confidence.
aDomestic tasks are done for one’s household (e.g., cooking and cleaning). Primary child care occurs when the caregiver’s primary focus is helping or caring for a child. Secondary child care is when the caregiver’s primary focus is on something else (e.g., cooking) while keeping an eye on a child. Caring for adults of any age can include assisting with physical and medical care, as well as supervising an adult. Caring for adults who suffer from an age-related condition (generally older adults) can also include housekeeping, meals, and transportation. Helping adults excludes adults of any age who suffers from an age-related condition. It includes helping adults with noncaregiving activities (e.g., giving adults rides and helping adults who do not live in their household with domestic tasks)
bWe used a single wage ($18) to value domestic tasks and helping adults.
cTo value caregiving, we used a low and high wage to show how the value varies based on the selected wage. For details, see app. I.
|
Type of unpaid caregivinga |
Valuation wage (hourly) |
Estimated average annual values per Caregiver |
||
|
|
Low |
High |
Low wage |
High wage |
|
All child care (primary, secondary, or both)b |
Primary: $17.50; |
Primary: $20; |
$7,295–$7,720 |
$8,338–$8,823 |
|
Child care (primary) |
$17.50 |
$20 |
$3,131–$3,336 |
$3,578–$3,813 |
|
Child care (secondary) |
$8.75 |
$10 |
$4,165–$4,384 |
$4,760–$5,011 |
|
Adult care |
$17.25 |
$19 |
$1,133–$1,312 |
$1,248–$1,445 |
|
Sandwich care |
Primary: $17.50; |
Primary: $20; |
$246–$376 (excluding secondary child care) |
$465–$678 (including secondary child care) |
Source: GAO analysis of 2021–2024 American Time Use Survey (ATUS) data and wages from 2024 Current Population Survey data. | GAO‑26‑107871
Notes: ATUS records how respondents spent their time on a selected day (their “diary day”). We combined 4 years of ATUS data into a single dataset to estimate the average hours spent on types of caregiving across diary days. We calculated these values using the estimated unconditional average annual hours spent on each type of unpaid caregiving. These estimated hours reflect the full ATUS population (i.e., those who are non-institutionalized, civilian, and at least 15 years of age). Analyses of only individuals engaged in each activity—that is, conditional averages—would be higher, particularly for less common activities, such as adult care or sandwich care. We used a low and high wage to show how the values vary based on the selected wage. For details, see app. I. Estimates in this table generally have a margin of error that is no greater than ±10 percent of the estimate itself at the 95 percent level of confidence. The low and high wage values for sandwich care have margins of error that are about ±21 percent and 19 percent of the estimates, respectively.
aCaring for adults of any age can include assisting with physical and medical care, as well as supervising an adult. Caring for adults who suffer from an age-related condition (generally older adults) can include housekeeping, meals, and transportation. Primary child care occurs when the caregiver’s primary focus is helping or caring for a child (e.g., reading to a child). Secondary child care is when the caregiver’s primary focus is on something else (e.g., cooking) while keeping an eye on a child. Sandwich care is caring for children (including primary or secondary child care) and adults on the same day.
bValues for child care (primary or secondary) do not sum to the total because individuals may perform both types of child care.
Aguiar, Mark, and Erik Hurst. "Consumption versus Expenditure." Journal of Political Economy, vol. 113, no. 5 (2005).
Aguiar, Mark, Erik Hurst, and Loukas Karabarbounis. "Time Use During the Great Recession." American Economic Review, vol. 103, no. 5 (2013).
Been, Jim, Susann Rohwedder, and Michael Hurd. "Households' Joint Consumption Spending and Home Production Responses to Retirement in the U.S." Review of Economics of the Household, vol. 19, no. 4 (2021).
Blundell, Richard, Luigi Pistaferri, and Itay Saporta-Eksten. "Children, Time Allocation, and Consumption Insurance." Journal of Political Economy, vol. 126, no. S1 (2018).
Bridgman, Benjamin. "Accounting for Household Production in the National Accounts: An Update, 1965–2014." Survey of Current Business, vol. 96, no. 2 (2016).
Bridgman, Benjamin. "Home Productivity." Journal of Economic Dynamics and Control, vol. 71 (2016).
Bridgman, Benjamin, Andrew Craig, and Danit Kanal. "Accounting for Household Production in the National Accounts." Survey of Current Business, vol. 102, no. 2 (2022).
Bridgman, Benjamin, Andrew Dugan, Mikhael Lal, Matthew Osborne, and Shaunda Villones. "Accounting for Household Production in the National Accounts: 1965–2010." Survey of Current Business, vol. 92, no. 5 (2012).
Chari, Amalavoyal V., John Engberg, Kristin N. Ray, and Ateev Mehrotra. "The Opportunity Costs of Informal Eldercare in the United States: New Estimates from the American Time Use Survey." Health Services Research, vol. 50, no. 3 (2014).
Dukhovnov, Denys, and Emilio Zagheni. "Who Takes Care of Whom in the United States? Time Transfers by Age and Sex." Population and Development Review, 41, no. 2 (2015): 183-206.
Folbre, Nancy. "Care Provision and the Boundaries of Production." Journal of Economic Perspectives, vol. 38, no. 1 (2024).
Folbre, Nancy, Marta Murray-Close, and Jooyeoun Suh. "Equivalence Scales for Extended Income in the U.S." Review of Economics of the Household, vol. 16 (2018).
Frazis, Harley, and Jay Stewart. "How Does Household Production Affect Measured Income Inequality?" Journal of Population Economics, vol. 24, no. 1 (2011).
Gautham, Leila, and Nancy Folbre. "Household Production Time and Inequality in Extended Income in the U.S., 1965–2018." (2024).
Gautham, Leila, and Nancy Folbre. "Parental Expenditures of Time and Money on Children in the U.S." Review of Income and Wealth, vol. 70, no. 4 (2024).
Gruber, Jonathan, and Kathleen M. McGarry. Long-Term Care in the United States. Working Paper No. 31881. National Bureau of Economic Research, 2023.
Guner, Nezih, Remzi Kaygusuz, and Gustavo Ventura. "Child-related Transfers, Household Labour Supply, and Welfare." Review of Economic Studies, vol. 87, no. 5 (2020).
Guryan, Jonathan, Erik Hurst, and Melissa Kearney. "Parental Education and Parental Time with Children." Journal of Economic Perspectives, vol. 22, no. 3 (2008).
Harrington, Emma, and Matthew E. Kahn. Has the Rise of Work from Home Reduced the Motherhood Penalty in the Labor Market? Working Paper No. 34147. National Bureau of Economic Research, 2025.
Hurst, Erik. "Measuring Time Use in Household Surveys." Journal of Economic and Social Measurement, vol. 40, no. 1–4 (2015).
Jacobs, Josephine C., Jeanie Lo, Courtney H. Van Houtven, and Todd H. Wagner. "The Impact of Informal Caregiving on U.S. Veterans Health Administration Utilization and Expenditures." Social Science & Medicine, vol. 344 (2024).
Jacobs, Josephine C., Courtney H. Van Houtven, Terri Tanielian, and Rajeev Ramchand. "Economic Spillover Effects of Intensive Unpaid Caregiving." Pharmacoeconomics, vol. 37, no. 4 (2019).
Kanal, Danit, and Joseph Ted Kornegay. "Accounting for Household Production in the National Accounts: An Update, 1965–2017." Survey of Current Business, vol. 99, no. 6 (2019).
Krantz-Kent, Rachel. "Measuring Time Spent in Unpaid Household Work: Results from the American Time Use Survey," Monthly Labor Review, vol. 132, no. 7 (2009)
Landefeld, J. Steven, Barbara M. Fraumeni, and Cindy M. Vojtech. "Accounting for Household Production: A Prototype Satellite Account Using the American Time Use Survey." Review of Income and Wealth, vol. 55, no. 2 (2009).
Landefeld, J. Steven, and Stephanie H. McCulla. "Accounting for Nonmarket Household Production within a National Accounts Framework." Review of Income and Wealth, vol. 46, no. 3 (2000).
Leukhina, Oksana, and Zhixiu Yu. "Home production and leisure during the COVID-19 recession." The BE Journal of Macroeconomics 22, no. 1 (2022): 269-306.
Lowen, Aaron, and Paul Sicilian. "An Alternative Valuation Method for Household Production Using American Time Use Survey Data." Journal of Legal Economics, vol. 22 (2015).
Mudrazija, Stipica. "Work-related Opportunity Costs of Providing Unpaid Family Care in 2013 and 2050." Health Affairs, vol. 38, no. 6 (2019): 1003-1010.
National Academies of Sciences, Engineering, and Medicine. An Updated Measure of Poverty: (Re)Drawing the Line. Washington, D.C.: The National Academies Press, 2023.
Shandra, Carrie L. "Nonmarket work among working-age disability beneficiaries: Evidence from the American Time Use Survey." Journal of Disability Policy Studies, vol. 27, no. 2 (2016): 76-85.
Suh, Jooyeoun, and Nancy Folbre. "Valuing Unpaid Child Care in the U.S.: A Prototype Satellite Account Using the American Time Use Survey." Review of Income and Wealth, vol. 62, no. 4 (2016).
Zacharias, Ajit, Fernando Rios-Avila, Nancy Folbre, and Thomas Masterson. "Integrating Nonmarket Consumption into the Bureau of Labor Statistics Consumer Expenditure Survey" (2024), a report prepared at the request of the Bureau of Labor Statistics.
GAO Contacts
Thomas Costa, costat@gao.gov
Michael Hoffman, hoffmanme@gao.gov
Staff Acknowledgments
In addition to the contacts named above, Caitlin Croake (Assistant Director), Nancy Cosentino (Analyst in Charge), Andrew Emmons, Carly McCann, Camille McKenzie, Trevor Osaki, and Rhiannon Patterson made key contributions to this report.
Also contributing to this report were Charlotte Cable, Tangere Hoagland, Kirsten Lauber, Avani Locke, Aaron Olszewski, Lindsay Shapray, Curtia Taylor, Kelly Troutman, and Sarah Wu.
The Government Accountability Office, the audit, evaluation, and investigative arm of Congress, exists to support Congress in meeting its constitutional responsibilities and to help improve the performance and accountability of the federal government for the American people. GAO examines the use of public funds; evaluates federal programs and policies; and provides analyses, recommendations, and other assistance to help Congress make informed oversight, policy, and funding decisions. GAO’s commitment to good government is reflected in its core values of accountability, integrity, and reliability.
Obtaining Copies of GAO Reports and Testimony
The fastest and easiest way to obtain copies of GAO documents at no cost is through our website. Each weekday afternoon, GAO posts on its website newly released reports, testimony, and correspondence. You can also subscribe to GAO’s email updates to receive notification of newly posted products.
Order by Phone
The price of each GAO publication reflects GAO’s actual cost of production and distribution and depends on the number of pages in the publication and whether the publication is printed in color or black and white. Pricing and ordering information is posted on GAO’s website, https://www.gao.gov/ordering.htm.
Place orders by calling (202) 512-6000, toll free (866) 801-7077,
or
TDD (202) 512-2537.
Orders may be paid for using American Express, Discover Card, MasterCard, Visa, check, or money order. Call for additional information.
Connect with GAO
Connect with GAO on X,
LinkedIn, Instagram, and YouTube.
Subscribe to our Email Updates. Listen to our Podcasts.
Visit GAO on the web at https://www.gao.gov.
To Report Fraud, Waste, and Abuse in Federal Programs
Contact FraudNet:
Website: https://www.gao.gov/about/what-gao-does/fraudnet
Automated answering system: (800) 424-5454
Media Relations
Sarah Kaczmarek, Managing Director, Media@gao.gov
Congressional Relations
David A. Powner, Acting Managing Director, CongRel@gao.gov
General Inquiries
[1]We use this definition throughout this report.
[2]For example, we considered whether the studies that valued unpaid household work included sensitivity analyses, which test the impact of changes in key assumptions on results. For more information on our literature review process, see app. I.
[3]See app. I for additional information on how we selected economists to interview.
[4]2024 data were the most recent available data at the time of our analysis. The ATUS is a federally funded survey that captures how individuals in the U.S., ages 15 and above, allocate their time between paid work or school, unpaid household work, leisure, and personal care. ATUS is a nationally representative survey, jointly administered by the BLS and the Census Bureau. ATUS asks survey respondents to identify their sex (male or female). In this report, we use the term “gender” to refer to these data, and we generally use the terms “men” and “women” to refer to individuals who identified their sex as male or female, respectively.
[5]The survey respondents represent one of many possible sets of individuals that could have been surveyed. Because different sets of respondents could produce different estimates of a population value—such as the percentage of individuals caring for an adult—we express the precision of the results using a 95 percent confidence interval, which is the estimate plus or minus the margin of error. This interval would contain the true population value for 95 percent of the possible sets of individuals that could have been surveyed. We provide 95 percent confidence intervals throughout the report, including within tables and figures. Unless otherwise noted, all estimates in the second objective have a margin of error no greater than plus or minus 10 percent of the estimate itself and all estimates in the third objective have a margin of error no greater than plus or minus 15 percent of the estimate itself. Many estimates have a margin of error that is substantially lower than plus or minus 10 or 15 percent of the estimate itself. For example, most percentages (e.g., percentage of individuals engaging in domestic tasks) have a margin of error that is no greater than about plus or minus 5 percent of the estimate itself. Finally, we treated the wages we used to value unpaid household work as constants and did not report their 95 percent confidence intervals.
[6]The second objective of this report discusses methods for valuing unpaid household work, including our choice to use the replacement wage method.
[7]BLS has explored developing estimates of the value of unpaid household work but has not yet produced them. BLS officials said this was part of a larger effort, to more fully estimate the amount of goods and services that households consume, for its Consumer Expenditure Surveys. The Consumer Expenditure Surveys is a nationally representative survey that provides data on consumers’ income, expenditures, and demographics. As of March 2026, BLS officials said they were unsure if the agency will produce a consumption measure that includes valuing unpaid household work due to resource constraints.
[8]GDP measures the market value of all final goods and services produced in a country’s economy and purchased by a consumer, government, or business. International organizations such as the United Nations Economic Commission for Europe and the Organisation for Economic Co-operation and Development have issued guidance on how to calculate the time spent on unpaid household work and monetarily value this time.
[9]See Benjamin Bridgman, Andrew Craig, and Danit Kanal, “Accounting for Household Production in the National Accounts,” Survey of Current Business, vol. 102, no. 2 (2022).
[10]When BEA estimates the value of unpaid household work, it assigns a value to the time spent on this work and treats consumer durables used to do this work as investment—reflecting the services these goods provide over time. In contrast, standard GDP accounting generally classifies consumer durables as consumer expenditures—rather than investment for unpaid household work. Consumer durables are items with long lifespans, such as appliances, vehicles, and computers. Our approach to valuing unpaid household work, which is discussed in the second objective of this report, does not include the value of consumer durables because doing so was outside the scope of our work. Bridgman, Craig, and Kanal. “Accounting for Household Production”.
[11]Throughout this section we discuss how estimates of the value of unpaid household work can supplement GDP or household data. The term “supplement” here includes incorporating estimates of unpaid household work into existing measures or creating additional, complementary measures to inform research.
[12]See app. I for more information on our methods.
[13]Bridgman, Craig, and Kanal. “Accounting for Household Production”.
[14]Specifically, BEA estimated that in 2020, real GDP declined by about 3.5 percent, while real adjusted GDP declined by less than 1 percent. Bridgman, Craig, and Kanal. “Accounting for Household Production”.
[15]See Mark Aguiar, Erik Hurst, and Loukas Karabarbounis, “Time Use During the Great Recession,” American Economic Review, vol.103, no. 5 (2013).
[16]Aguiar, Hurst, and Karabarbounis, “Time Use During the Great Recession,” (2013).
[17]Leila Gautham, and Nancy Folbre, “Parental Expenditures of Time and Money on Children in the U.S.”, Review of Income and Wealth, vol. 70, no. 4 (2024).
[18]A National Academy of Sciences panel recommended that future research explore incorporating unpaid child care into poverty measurement. See National Academies of Sciences, Engineering, and Medicine. 2023. An Updated Measure of Poverty: (Re)Drawing the Line, Washington, D.C.: The National Academies Press.
[19]Mark Aguiar, and Erik Hurst, “Consumption versus Expenditure,” Journal of Political Economy, vol. 113, no. 5 (2005).
[20]This estimate of unpaid household work does not include caregiving. Jim Been, Susann Rohwedder, and Michael Hurd, “Households’ Joint Consumption Spending and Home Production Responses to Retirement in the U.S.”, Review of Economics of the Household, vol. 19, no. 4 (2021).
[21]Harley Frazis, and Jay Stewart, “How Does Household Production Affect Measured Income Inequality?”, Journal of Population Economics, vol. 24, no. 1 (2011).
[22]The Department of Veterans Affairs (VA) has a program providing stipends to veterans’ family caregivers. For details on this program, see: GAO, VA Health Care: Actions Needed to Improve Family Caregiver Program, GAO‑19‑618, (Washington, D.C.: Sep 16, 2019).
[23]This study used caregiving data linked to administrative data on healthcare spending. Josephine Jacobs, Jeanie Lo, Courtney Van Houtven, and Todd Wagner, “The Impact of Informal Caregiving on U.S. Veterans Health Administration Utilization and Expenditures”, Social Science & Medicine, 344 (2024).
[24]This study estimated that expanding payments to families for child care that required recipients to work increased married women’s labor force participation by 10.6 percent. In contrast, they estimated that expanding payments to families with children that did not require recipients to work led to a 2.4 percent decrease in the labor force participation of married women. The authors note that their results informed a potential expansion of the Child Care and Development Fund (CCDF). The CCDF provides funding to states to assist low-income families who are working or participating in education and training by increasing their access to quality child care. See Nezih Guner, Remzi Kaygusuz, and Gustavo Ventura, “Child-related Transfers, Household Labour Supply, and Welfare,” Review of Economic Studies, vol. 87, no. 5 (2020).
[25]According to the health policy nonprofit organization KFF, all states and D.C. offer Medicaid home and community-based services as of February 2025.
[26]We previously reported that providing Social Security credits for unpaid caregivers is one of several policy options to increase unpaid caregivers’ Social Security retirement benefits. GAO, Retirement Security: Some Parental and Spousal Caregivers Face Financial Risks, GAO‑19‑382 (Washington, D.C.: May 01, 2019).
[27]In general, the FMLA entitles eligible employees of covered employers to take unpaid, job-protected leave for specified family and medical reasons with continued group health insurance coverage.
[28]For a discussion of how telework policies may increase caregivers’ labor force participation, see GAO, Telework: Private Sector Stakeholder and Expert Views, GAO‑25‑107078 (Washington, D.C.: May 08, 2025).
[29]Emma Harrington, and Matthew E. Kahn, Has the Rise of Work from Home Reduced the Motherhood Penalty in the Labor Market?, No. w34147. National Bureau of Economic Research, 2025.
[30]Erik Hurst, “Measuring Time Use in Household Surveys.” Journal of Economic and Social Measurement, vol. 40, no. 1-4 (2015).
[31]Unless otherwise noted, all estimates in this objective have a margin of error that is no greater than ±10 percent of the estimate itself at the 95 percent level of confidence. ATUS records how respondents spent their time the day before they completed the survey and refers to this day as the “diary day.” Because ATUS is a nationwide, generalizable survey, we used these data to determine the percentages of individuals who did and did not do unpaid household work on their diary day over the period of our analysis (i.e., 2021 through 2024). Average daily hours spent on unpaid household work are based on individuals engaged in each activity (i.e., conditional averages). Averages based on the full ATUS population (i.e., unconditional averages) would be lower—particularly for less common activities, such as helping adults. About 12.7 percent of individuals did not do any unpaid household work on their diary day over this period. Of these individuals, about 67.2 percent were men, about 27.5 percent were ages 15-24, about 56.2 percent were unmarried, and about 67.2 percent were employed.
[32]The percentage of individuals engaged in unpaid household work increased only slightly when secondary child care was added because most individuals providing this type of care were already counted as engaging in other types of unpaid work. For example, if an individual engaged in secondary child care while cooking, they would already be counted as engaging in unpaid household work regardless of whether secondary child care was included or excluded. If, however, this individual was engaged in an activity other than work—such as watching TV—while providing secondary child care and did no other type of unpaid household work on their diary day, they would be added to the percentage engaged in unpaid household work only when such work included secondary child care.
[33]Percentages do not add up to 100 percent because individuals can engage in more than one type of unpaid household work. For example, if an individual engaged in both domestic tasks and primary child care, they would be counted under each of these types of work.
[34]The percentage of individuals who cared for adults and children in the same day has a margin of error of about ±12 percent of the estimate itself at the 95 percent level of confidence. Excluding secondary child care, individuals who provided sandwich care spent about 3.68 hours per day on this care.
[35]For these reasons identified by BEA officials and economists, we chose to use the replacement wage method when monetarily valuing unpaid household work in the next section. International organizations such as the United Nations Economic Commission for Europe and the Organisation for Economic Co-operation and Development also recommend the replacement wage method as an appropriate approach for valuing unpaid work.
[36]According to an article by BEA officials, a limitation of using either method to value unpaid household work is that they do not capture the nonmonetary benefits such as the enjoyment of gardening or being with one’s own children. Given this limitation, BEA uses a generalist wage method to value all types of unpaid household work. This article describes such estimates as reasonable, market-based, lower-bound estimates of unpaid household work. See J. Steven Landefeld and Stephanie H. McCulla, “Accounting for Nonmarket Household Production within a National Accounts Framework”, Review of Income and Wealth, vol. 46, No. 3, (2000).
[37]Landefeld and McCulla, “Accounting for Nonmarket Household Production”, (2000).
[38]See for example, Landefeld, Fraumeni, and Vojtech, “Accounting for Household Production” and Aaron Lowen, and Paul Sicilian. “An Alternative Valuation Method for Household Production using American Time Use Survey Data.” Journal of Legal Economics. vol. 22 (2015).
[39]One study in our review that excluded secondary child care was Jonathan Guryan, Erik Hurst, and Melissa Kearney. “Parental Education and Parental Time with Children.” Journal of Economic Perspectives, vol. 22, no. 3 (2008). One study in our review that that valued secondary child care time at half the rate of primary child care was Ajit Zacharias, Fernando Rios-Avila, Nancy Folbre, and Thomas Masterson. “Integrating Nonmarket Consumption into the Bureau of Labor Statistics Consumer Expenditure Surveys.” (2024). One study in our review that valued secondary child care at the federal minimum wage was: Gautham and Folbre. “Parental Expenditures of Time and Money on Children”.
[40]See for example, Jooyeoun Suh, and Nancy Folbre. “Valuing Unpaid Child Care in the U.S.: A Prototype Satellite Account Using the American Time Use Survey.” Review of Income and Wealth, vol. 62, no. 4 (2016).
[41]See Bridgman, Craig, and Kanal. “Accounting for Household Production”. When we value unpaid household work in this report, we do so both including and excluding secondary child care.
[42]The 95 percent confidence interval for this value ranged from about $52 to $53. This reflects the uncertainty around the time-use estimate for performing domestic tasks. We report only the point estimate as the estimated range is relatively precise. Estimated values in this section use conditional average daily hours spent on each type of unpaid household work. For estimated values that use unconditional average annual hours, see app. II.
[43]The low and high wage estimates have margins of error that are about ±21 percent and 19 percent of the estimates themselves, respectively, at the 95 percent level of confidence.
[44]The estimated national annual market value of unpaid household work is based on the average time the entire ATUS population spent on unpaid household work. The estimated per-person values of unpaid household work in the previous section are based on the average time persons engaged in that work spent doing it.
[45]As previously stated, to obtain reliable estimates of the number of hours of unpaid household work, we combined ATUS data from 2021 through 2024 into a single dataset. We valued this work in 2024 dollars—the most current value available at the time of our analysis—using the replacement wage method. Our lower-bound estimate ($5.6 trillion) values all unpaid work at a single, generalist wage. Specifically, we used 2024 median hourly earnings from the Current Population Survey for workers in the private household sector ($18 per hour). Our upper-bound estimate uses the highest specialist wages for caregiving listed in the text box describing our valuation approach.
[46]Similar to our approach, BEA (1) uses ATUS to estimate the amount of time spent on all unpaid household work (which it refers to as non-market services) and (2) uses a generalist wage similar to what we used to calculate our lower-bound estimate (private sector household workers) to value this work. As previously noted, BEA also treats consumer durables used to do this work as investment—reflecting the services these goods provide over time. We did not do this because it was outside the scope of our work. In its 2022 report, BEA estimates that the value of total household production was worth 25.4 percent of GDP in 2020 and attributes about 18.7 percent of this to non-market services and the remaining 6.7 percent to services from consumer durables. See Bridgman, Craig, and Kanal. “Accounting for Household Production”.
[47]We combined 4 years of ATUS data (2021-2024) into a single dataset to compare the representation of groups (e.g., women vs. men) engaged in unpaid household work to their representation in the U.S. population. As previously noted, ATUS data are for non-institutionalized individuals age 15 or older.
[48]Unless otherwise noted, all estimates in this section have a margin of error that is no greater than ±15 percent of the estimate itself at the 95 percent level of confidence. Also, we classified a group as overrepresented if its share of people engaging in unpaid household work exceeded its share of the overall population and the 95 percent confidence intervals for the estimates did not overlap. When the confidence intervals for the estimates overlapped, we reported the percentages were similar. This approach is conservative because overlapping confidence intervals do not always mean that differences in percentages are not statistically significant.
[49]We defined married individuals as either married and living with their spouse or unmarried and living with a partner. We defined unmarried individuals as either not married and not living with a partner or married and their spouse was absent.
[50]Individuals who were not employed were either unemployed or not in the labor force.
[51]We divided individuals engaging in unpaid work into four family income groups using the ATUS family income variable.
[52]We examined the following types of unpaid household work: domestic tasks, primary and secondary child care, caring for adults, sandwich care, and helping adults. In general, we report differences between groups (e.g., women vs. men) in the amount of time spent on unpaid household work when (1) statistical tests indicated a significant difference (p-value is below 0.05) and (2) there was at least a 20-minute (0.33 hours) difference in the amount of time the groups spent on the work. We also generally report that groups spent a similar amount of time on unpaid household work when there was less than a 20-minute difference in the amount of time the groups spent on the work, regardless of whether statistical tests indicated a significant difference. We do not report that groups spent similar or different amounts of time on unpaid household work when the difference in time was (1) at least 20 minutes and (2) statistically insignificant (p-value is at least 0.05).
[53]We also examined whether different groups spent similar or differing amounts of time on sandwich care, which is caring for a child and adult in the same day. According to our analysis of 2021 through 2024 ATUS data, about 1 percent of the population who engaged in unpaid household work provided sandwich care. The only statistically significant difference among individuals providing sandwich caregiving was related to age. Specifically, individuals ages 25 to 54 spent about 8.66 hours per week providing sandwich care, while those ages 15-24 and ages 55 or over spent 5.31 and 6.78 hours per week, respectively. Furthermore, men and women spent similar amounts of time on unpaid sandwich care, as did those with family incomes of $40,00-$74,999 and $150,000 and over.
[54]Bridgman, Benjamin. Introducing Expanded Indicators in the U.S. Household Production Economic Statistics. Working paper no. WP2026–15. Washington, DC: U.S. Bureau of Economic Analysis, June 2026.
[55]Both surveys are nationally representative surveys that are jointly sponsored by the U.S. Bureau of Labor Statistics (BLS) and the U.S. Census Bureau. For both surveys, respondents are civilian, non-institutionalized individuals who are at least 15 years old. All ATUS respondents are randomly selected among individuals who previously participated in the CPS survey and, for respondents of both surveys, most information from the CPS data can be directly linked to ATUS.
[56]Between 2021 and 2024, the response rate for ATUS ranged from 32.4 to 39.4 percent. As a result, the combined number of respondents across those years is 33,400.
[57]ATUS asks survey respondents to identify their sex (male or female). In this report, we use the term “gender” to refer to these data, and we generally use the terms “men” and “women” to refer to individuals who identified their sex as male or female, respectively.
[58]Replacement wages are hourly wage rates of paid professionals in the labor force. We used CPS data to estimate these wage rates.
[59]For example, we used relevant studies to help us determine what types of activities we included in our definition of unpaid household work, which data we used to estimate time spent on these activities, and which wages we used to estimate the monetary values of this time.
[60]We began our literature search in January 2025 and concluded it in March 2025. Other databases we searched were Social Scisearch, EBSCOhost, and Dialog.
[61]See app. III for a list of these studies.
[62]For example, if a survey respondent routinely provided daily care to a child and an adult but happened not to do so on their diary day, then it would not be possible to identify them as a sandwich care provider using ATUS diary data.
[63]Specifically, the survey’s weighting design ensures that reported activities from weekdays and weekends reflect their distribution in a week (i.e., five weekdays and two weekend days).
[64]See Benjamin Bridgman, Andrew Craig, and Danit Kanal, “Accounting for Household Production in the National Accounts,” Survey of Current Business, vol. 102, no. 2 (2022); Rachel Krantz-Kent, “Measuring time spent in unpaid household work: results from the American Time Use Survey,” Monthly Labor Review, vol. 132, no. 7 (2009); and Ajit Zacharias, Fernando Rios-Avila, Nancy Folbre, and Thomas Masterson, “Integrating Nonmarket Consumption into the Bureau of Labor Statistics Consumer Expenditure Surveys,” (2024).
[65]Domestic tasks are those done for one’s own household (e.g., cooking and cleaning). Primary child care is when the caregiver’s primary focus is helping or caring for a child (e.g., reading to a child). Secondary child care is when the caregiver’s primary focus is on something else (e.g., cooking) while keeping an eye on a child. Caring for adults who suffer from an age-related condition (generally older adults) can also include housekeeping, meals, and transportation. Helping adults excludes adults of any age who suffers from an age-related condition. It includes helping adults with noncaregiving activities (e.g., giving adults rides and helping adults who do not live in their household with domestic tasks).
[66]ATUS has an equivalent non-household category for first-tier and second-tier categories related to caring for and helping household children and adults.
[67]In their guidance on estimating the time and value of unpaid household work, international organizations such as the United Nations Economic Commission for Europe and the Organisation for Economic Co-operation and Development recommend the replacement wage method as a valid approach. Steven Landefeld, Barbara Fraumeni, and Cindy Vojtech. “Accounting for Household Production: A Prototype Satellite Account Using the American Time Use Survey.” Review of Income and Wealth, 55.2 (2009).
[68]The specialist wage method may approximate the values of different types of unpaid household work more closely than the generalist wage method, although it assumes that an individual has the same productivity and output (e.g., a meal) as a comparable professional worker in the labor force (e.g., a professional cook).
[69]As discussed above, CPS data captures respondents’ occupation and industry. It uses the Office of Management and Budget’s coding system to classify and describe different occupations (Standard Occupational Classification codes) and industries (North American Industry Classification System codes).
[70]See for example, Zacharias, Ajut, Fernando Rios-Avila, Nancy Folbre, and Thomas Masterson. “Integrating Nonmarket Consumption into the Bureau of Labor Statistics Consumer Expenditure Surveys,” Levy Economics Institute of Bard College and Bureau of Labor Statistics (2024).
[71]BEA also uses this generalist wage when valuing all unpaid household work. The private household industry consists of individuals or families who directly employ workers, such as nannies or housekeepers, in their homes or other private premises.
[72]We also estimated the annual per person value for unpaid household work overall and by type of work. To estimate these values, we multiplied the average hours that the population spent on this work by the replacement wages and 365. For these estimates, see app. II.
[73]In our calculations, we included GDP as reported by BEA. In 2024, it was about $29.2 trillion.
[74]Specifically, we valued both the primary activity (e.g., the domestic task of cooking) and secondary child care with their respective replacement wages. For example, suppose a person spent 2 hours cooking and also provided secondary child care during one of those hours. We would value the 2 hours of cooking at the domestic task wage—$18 per hour—for a total of $36. We would then add the value of the hour spent on secondary child care, which we valued at one-half the wage rates for primary child care. If we used the upper bound child care wage to value this hour, we would add $10 (i.e., one-half of the hourly wage of a preschool/kindergarten teacher), for a total of $46.
[75]For example, to estimate the value of unpaid household work, BEA first calculates the annual average hours spent on this work for demographic groups (e.g., by sex and employment status). It then multiplies these group averages by the corresponding population sizes. Finally, BEA sums the expanded hours across these groups and then multiplies the total by a generalist wage. This differs from our approach, where we multiply the average annual hours that individuals, regardless of their demographics, spent on unpaid household work by the replacement wage. BEA’s approach is informed in part by the agency’s goal of producing estimates that are comparable over time. Also, BEA’s estimates account for individuals beyond ATUS’s scope, namely members of the armed forces.
[76]At the time of our review, the two most recent BEA reports on valuing unpaid household work use ATUS data from 2017 and 2020. We did not use data from 2020 in our methodology check because the COVID-19 pandemic interfered with data collection for that year, and consequently, the data do not represent all of 2020.
[77]The opportunity cost method, discussed in the second objective, is also subject to this limitation.
[78]In ATUS, the overall U.S. population includes those who are noninstitutionalized, civilian, and at least 15 years of age.
[79]Our comparison of percentages between the overall U.S. population and the population of individuals engaging in unpaid household work is descriptive and conservative. In other words, when confidence intervals for two estimates did not overlap, we interpreted this as evidence that the percentages differed. However, overlapping confidence intervals may not always mean that the difference in percentages is not statistically significant.
[80]We define a difference as statistically significant if the p-value from a statistical test is below 0.05 and statistically insignificant if it is at least 0.05.