
Report to Congressional Requesters
United States Government Accountability Office
A report to congressional requesters
Contact: Jacqueline M. Nowicki at nowickij@gao.gov
What GAO Found
Chronic facility issues disrupted teaching and learning in schools nationwide in school year 2024-25, according to GAO’s nationwide survey of districts. GAO estimates that nearly one in five districts (19 percent) canceled school that year due to a facilities issue. These cancellations affected an estimated 2 million students, who lost an estimated 3.5 million days of learning as a result. Top reasons districts canceled school included plumbing emergencies and extreme classroom temperatures. One district GAO visited canceled school after classroom temperatures reached 110 degrees. GAO also estimates that nearly half of districts (47 percent) had chronic facility issues that often disrupted learning.
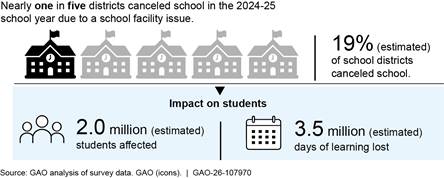
Note: The 95 percent confidence intervals for these estimates are 15 to 24 percent of districts; 1.5 to 2.4 million students affected; and 2.5 to 4.5 million days of learning lost.
Districts frequently face funding constraints and have used strategies like investing in preventive maintenance to manage costs and better meet facility needs. GAO estimates that 55 percent of districts considered their most recent facilities budget insufficient to meet their needs. Districts often faced difficulty implementing capital projects and many deferred maintenance, which can lead to higher costs in the longer term. GAO found that districts with limited capacity to conduct preventive maintenance had more chronic facility problems and more disruptions to instruction. School leaders described taking steps to help address these challenges. They included making strategic investments in preventive maintenance and cost-saving measures, engaging in careful facilities planning efforts, leveraging expertise, and building community buy-in for capital projects.
Nationwide, district leaders had mixed views on the efficacy of state and federal policies related to school facilities. For example, an estimated 73 percent said that limited state formula funding for facilities hindered their ability to meet their facility needs. However, some states have implemented practices that survey respondents and others found helpful. For instance, according to research we reviewed, some states directed dedicated revenue sources to school facilities (e.g., from excise taxes), which helped support facilities funding. Others provided incentives to encourage districts to prioritize preventive maintenance. Finally, some states helped districts keep capital projects on track and on budget through steps like offering adaptable building design plans and expediting permitting.
Why GAO Did This Study
Public school facilities are critical in supporting student learning, civic life, and the long-term economic growth of the nation. Research has demonstrated that modern, well-maintained facilities with healthy indoor environments yield better student performance and health, higher teacher retention, and reduced absenteeism. When schools with outdated or improperly maintained facilities temporarily close buildings or classrooms, instruction and learning are disrupted.
GAO was asked to review lost instructional time associated with facility-related school cancellations across the U.S. This report addresses (1) the extent to which facility issues disrupt instruction in public schools; (2) facilities challenges school districts face and strategies they use to address them; and (3) district leaders’ views on state and federal policies related to school facilities and how states can help districts address systemic issues.
GAO conducted a nationally representative survey of public school districts (overall weighted response of 62 percent). Unless otherwise noted, estimates presented have a margin of error of no more than plus or minus 7 percentage points. In addition, GAO visited nine districts across Alabama, Maine, and Oregon. GAO selected states for variation in average spending per student, geographic region, and receipt of federal Supporting America’s School Infrastructure grant funds. Within these states, GAO selected districts for variation in urbanicity, poverty, and size. GAO also reviewed reports by state agencies, commissions, and legislative committees from 2016 through 2026 that examined school facility issues and potential solutions. GAO also interviewed officials from the Department of Education and from stakeholder groups, selected to capture a range of perspectives.
Abbreviations
ADA Americans with Disabilities Act of 1990
ECS Education Commission of the States
FCA facility condition assessment
HVAC heating, ventilation, and air conditioning
SASI Supporting America’s School Infrastructure
This is a work of the U.S. government and is not subject to copyright protection in the United States. The published product may be reproduced and distributed in its entirety without further permission from GAO. However, because this work may contain copyrighted images or other material, permission from the copyright holder may be necessary if you wish to reproduce this material separately.
September 9, 2026
The Honorable Tammy Baldwin
Ranking Member
Subcommittee on Labor, Health and
Human Services, Education, and Related Agencies
Committee on Appropriations
United States Senate
The Honorable Jack Reed
United States Senate
Public school facilities are critical infrastructure that support both student learning and civic life, as well as the long-term economic growth of the nation. Each year, about 50 million children and 6 million teachers and staff spend their days in public school facilities. Research has demonstrated that modern, well-maintained facilities with healthy indoor environments yield better student performance and health, higher teacher retention, and reduced absenteeism.
In 2020, we reported that about half of public school districts needed to update or replace multiple building systems in their schools.[1] Schools with outdated or improperly maintained facilities may be susceptible to hazardous conditions like flooding, unsafe indoor air temperatures, and mold. To address these conditions, school districts may need to temporarily close classrooms or school buildings, disrupting instruction, and potentially harming student learning.
You asked us to review lost instructional time associated with facility-related school cancellations across the U.S. This report addresses (1) the extent to which facility issues disrupt instruction in public schools; (2) challenges confronting school districts and the strategies they are using to address their facility needs; and (3) district leaders’ views on state and federal policies related to school facilities and how states can help districts address systemic school facility issues.
To address all three objectives, we conducted a nationally representative survey of K-12 public school districts from November 2025 to January 2026. We asked school districts a series of questions about school facility conditions, facility-related school cancellations (i.e., temporary closures for 1 school day or more), the effects of facility issues on students and staff, maintenance practices, funding levels, and the impact of state and federal policies.[2] We obtained a weighted response rate of 62 percent for our survey. The estimates from our survey are generalizable to the population of public school districts.[3] For a complete breakdown of our survey estimates and associated confidence intervals, see appendix II.
We also visited nine districts across three states: Alabama, Maine, and Oregon. We selected states that reflected variation in average spending per student, geographic region, and receipt of federal Supporting America’s School Infrastructure (SASI) grant funds. These grants were designed to increase state capacity to improve school facilities and environments to ensure that facilities are safe, healthy, sustainable, and equitable learning environments for all students. Within these states, we selected districts for variation in urbanicity, poverty, and size. During our visits, we interviewed district leaders about their district’s facility conditions and challenges, facilities-related school cancellations, and the impact of state and federal policy. Additionally, we toured at least two schools per district, with a focus on schools that had faced major facility issues, had experienced facilities-related cancellations, or had been permanently closed due to facility issues.
To better understand state and federal policies related to school facilities, policies that districts find helpful, and opportunities for improvement, we interviewed Department of Education officials; lead researchers from the National Center on School Infrastructure; and representatives from national organizations focused on school facilities, including the 21st Century School Fund, the National Council on School Facilities, and the National School Plant Management Association. In addition, we reviewed a 50-state summary of school construction funding issued by the Education Commission of the States (ECS) and interviewed the officials who compiled it about their methodology. We also searched for reports issued by state facilities agencies, commissions, and legislative committees in the last 10 years (2016 through 2026) that examined school facility issues. We then reviewed these reports to identify school infrastructure policies states have adopted or considered.[4] See appendix I for more information on our objectives, scope, and methodology.
We conducted this performance audit from December 2024 through September 2026 in accordance with generally accepted government auditing standards. Those standards require that we plan and perform the audit to obtain sufficient, appropriate evidence to provide a reasonable basis for our findings and conclusions based on our audit objectives. We believe that the evidence obtained provides a reasonable basis for our findings and conclusions based on our audit objectives.
Background
School buildings are among a community’s most important, heavily used public infrastructure. These buildings and their component systems (e.g., structural, electrical, heating, and air conditioning systems) have finite, expected useful lives. School districts are typically responsible for: (1) maintenance and repair of existing school infrastructure, (2) planning for future infrastructure needs, and (3) carrying out capital projects to address major needs.
Maintenance and repairs. Maintenance and repairs are activities directed toward keeping buildings and their component systems in an acceptable condition and extending their useful life. As we have previously reported, delaying or deferring routine maintenance and repairs may diminish the performance of building systems and may shorten their useful lives.[5]
|
Facility Condition Assessments As we have previously reported, a facility condition assessment (FCA) is a systematic inspection of building systems and features using a standardized method for recording observations about condition. For example, one might walk through a building, record the condition of building systems and features, and identify deficiencies. The results can be presented as a facility condition index, which compares the cost of repairing deficiencies in a building with the cost of replacing the building. They can also help school districts compare conditions across their facilities and prioritize future investments. Source: GAO. | GAO‑26‑107970 |
Planning activities. Common school district planning tools include facility condition assessments (FCA) and multi-year capital plans. FCAs help districts identify deficiencies, compare conditions across facilities, and prioritize needed improvements.
Districts can use FCA results to inform capital plans. Capital planning helps districts ensure that facilities investments are aligned with district priorities and goals. For instance, a district that wishes to improve climate control and reduce heating and cooling costs may prioritize investments in heating, ventilation, and air conditioning (HVAC) systems. A district that anticipates significant enrollment growth may prioritize investments to expand capacity.
Capital projects. When school districts construct, renovate, replace, or make major repairs to building systems or features, such as roofing or plumbing, they undertake capital projects. Districts typically fund large capital projects outside of their operating budget (e.g., using capital reserve funds or bond funding).
School Facilities Funding
In fiscal year 2024, 22 percent of all district spending went toward operations and maintenance ($78 billion); capital expenditures ($113 billion); and interest on debt, such as bonds ($23 billion), according to U.S. Census Bureau data. While Census does not collect data on the sources of funding districts use for their facilities, we reported in 2020 that over half of districts (an estimated 55 percent) relied primarily on local funding, such as local property taxes and local bonds.[6] Further, we estimated that 36 percent relied primarily on state funding, and fewer than an estimated 1 percent relied primarily on federal funding.[7]
Federal Role in School Infrastructure
School infrastructure historically has been seen as primarily a state and local responsibility. Some federal grants are available to support national priorities, such as promoting energy efficiency, supporting economically distressed areas, and serving schools on military installations or for Native American students.[8] Additionally, the federal response to the COVID-19 pandemic included about $190 billion awarded to states and school districts through the Elementary and Secondary School Emergency Relief (ESSER) Fund. States and school districts were required to obligate the last round of ESSER funds by September 30, 2024. We previously reported that nearly half of districts used some of these funds to improve ventilation (e.g., by upgrading HVAC systems) in their schools.[9]
Further, in 2023, Education’s SASI grant program awarded approximately $37 million in competitive grant funding to seven states and one territory to increase their capacity to help high-need school districts and schools improve their facilities over a 5-year period.[10] In the same year, Education awarded $10 million in new funds over 5 years to establish the National Center on School Infrastructure program. This program is intended to serve as a clearinghouse of resources for states and school districts and provide technical assistance to SASI grantees and high-need school districts seeking to leverage available resources to improve public school facilities.
Chronic Facility Issues Affect Many Public School Districts and One in Five Canceled School
Nearly Half of Districts Had Chronic Facility Issues in the 2024-25 School Year
America’s school infrastructure faces significant issues, as reflected by the results of our nationally representative survey of school districts. We estimate that nearly half of U.S. public school districts (47 percent) had chronic facility issues in at least one school in the 2024-25 school year.[11] We also estimate that about 14 percent of schools were considered by district leaders to be in poor or very poor condition.[12] An estimated 15 percent of districts also had serious safety concerns regarding at least one of their schools.[13] Lastly, district leaders commonly reported their schools to have compliance issues related to accessibility, fire, safety, and other building code requirements.
Chronic Facility Issues
Among the estimated 47 percent of districts that faced chronic facility issues in at least one school in the 2024-25 school year, the most common chronic issues were water intrusion and excessive heat and cold in classrooms (see fig. 1).[14] Plumbing, ventilation, structural, and other issues followed close behind. Nearly all districts—an estimated 95 percent—had at least one school that faced isolated facility issues in that school year.[15]
Figure 1: Estimated Percent of School Districts Experiencing Isolated and Chronic Facility Issues in at Least One School, School Year 2024-25
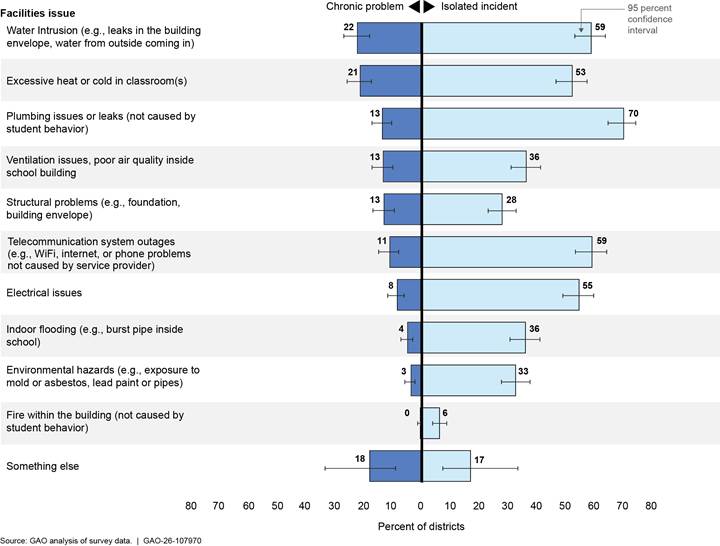
Note: Survey respondents could choose from “never occurred in any school,” “isolated incident(s) in at least one school,” or “chronic problem in at least one school” when rating facility issues.
According to district and school leaders we visited in Alabama, Maine, and Oregon, and school facility professionals we spoke with, keeping schools dry and at the appropriate temperature can be a challenge for school districts.
Water intrusion. Facility professionals we spoke with explained that because school roofs can cost millions of dollars to replace, school districts may patch them to try to extend the life of the roof as long as possible. However, schools we visited had damaged ceilings, floors, or electrical systems due to roof leaks and water intrusion. One teacher told us that every time it rained heavily, there was “a little waterfall” in her classroom, which distracted students and was potentially dangerous.
Excessive heat and cold in classrooms. On our site visits, school district leaders described heating and cooling systems that were outdated and not able to effectively regulate school temperatures. For example, in schools we visited, school staff described experiencing a wide range of classroom temperatures, with classrooms as hot as 90 or more degrees Fahrenheit and below 60 degrees Fahrenheit. Facility professionals cited causes of poor temperature control that included aging heating systems (as old as 70 years or more), poorly functioning building controls or HVAC systems, buildings that were not constructed to facilitate air conditioning, poor insulation, and poor ventilation.
Plumbing issues or leaks. Officials we spoke with during our site visits said old and fragile plumbing and septic systems have backed up and required bathrooms or entire schools to be closed while repairs took place.[16] In our interviews, officials also mentioned inadequate, poor bathroom conditions as a concern. Because of poor bathroom conditions, in one school we visited, some students avoided going to the bathroom at all, and in another, teachers said the bathrooms harm morale for students and staff.
Ventilation issues, poor air quality. In school districts we visited, school staff described heating and cooling issues associated with ventilation problems and poor air quality. Officials we spoke with described stuffy and humid classrooms, windows that did not open or close properly, poor air quality, and concerns about mold, mildew, and bad smells. One high school official mentioned that science classrooms lacked sufficient ventilation to do experiments in science classes. In some cases, teachers and staff ran air purifiers or wore masks in response to air quality issues.
Poor School Conditions and Serious Safety Concerns
We also estimate that about 14 percent of schools nationwide were in poor or very poor condition—meaning that they had major problems that made them hard to use, unusable, or unsafe in their current condition.[17] An estimated one-third of schools were in fair condition—meaning that they were functional but had noticeable wear or aging that needed fixing within the next few years.[18] Finally, an estimated 53 percent were in good or excellent condition.[19] Further, an estimated 15 percent of district leaders had serious safety concerns regarding schools in their district—amounting to roughly 5,300 of the nearly 100,000 public schools nationwide.[20] A small number of these schools (a maximum of approximately 900) were slated for closure or replacement.[21]
We visited at least one school in poor condition and with serious safety concerns in each of our three selected states. For example, we observed children attending school in buildings with black mold, damaged ceilings or floors, hazardous stairs, and extreme classroom temperatures. Three examples follow.
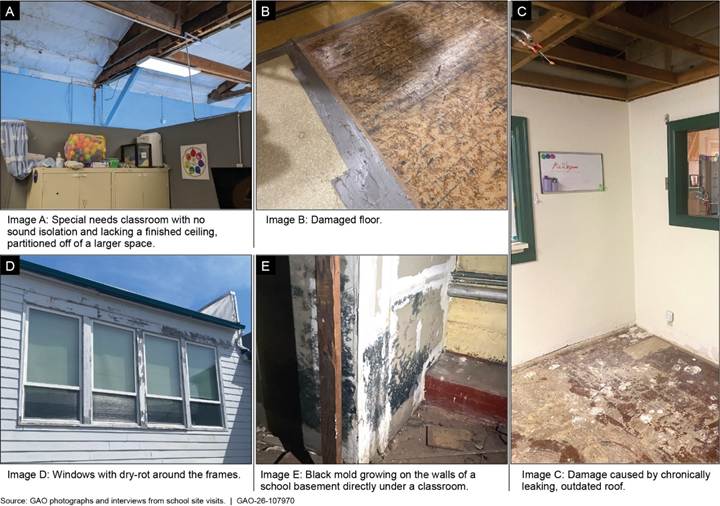
School 1. This rural elementary school faced numerous significant issues that school leaders said threatened to permanently close the over 100-year-old school building (see fig. 2). For example, according to school leaders, whenever it rained, the roof leaked, causing problems including ceiling collapse. At the time of our visit, we observed an office undergoing repair after a major water leak in the ceiling. We also observed water intrusion in the basement that school leaders said had caused black mold to grow on walls underneath a classroom. Officials said they painted over black mold in the teachers’ lounge bathroom because the district could not afford proper mold remediation at the time. The school also had an unreliable HVAC system that led to wide temperature swings, requiring children to wear coats indoors during the winter, according to officials.
Figure 2: Photos of an Over-100-Year-Old Rural Elementary School with Significant Facility Issues, School Year 2024-25
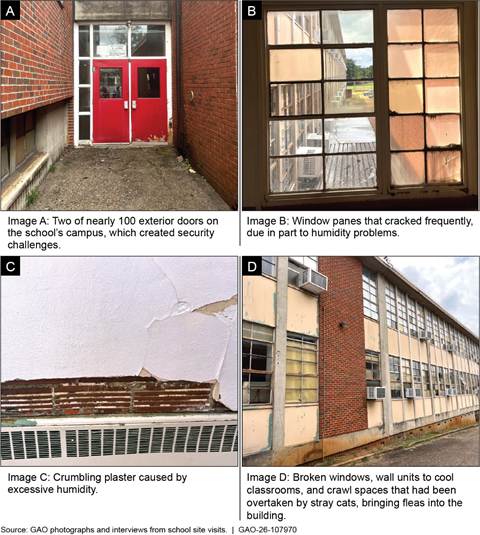
School 2. School leaders said this high school in a large urban district had a history of extensive building leaks, animal infestation, and temperature control problems (see fig. 3). Students had been displaced from one of the school’s buildings for 3 weeks after it lost heating and cooling. The district installed individual wall units to cool classrooms, but common areas remained extremely hot and humid, leading walls to crumble and windows to break frequently, according to school officials. The building had lost two boilers in recent years, costing over $250,000 to replace. The district operations director said, “we have spent millions on this building, and you can’t even tell.” The school also had almost 100 external doors, which made it easy for students to leave the building without being noticed. The operations director feared that a weapon or contraband could easily be hidden near an exterior door and retrieved without detection during the school day.
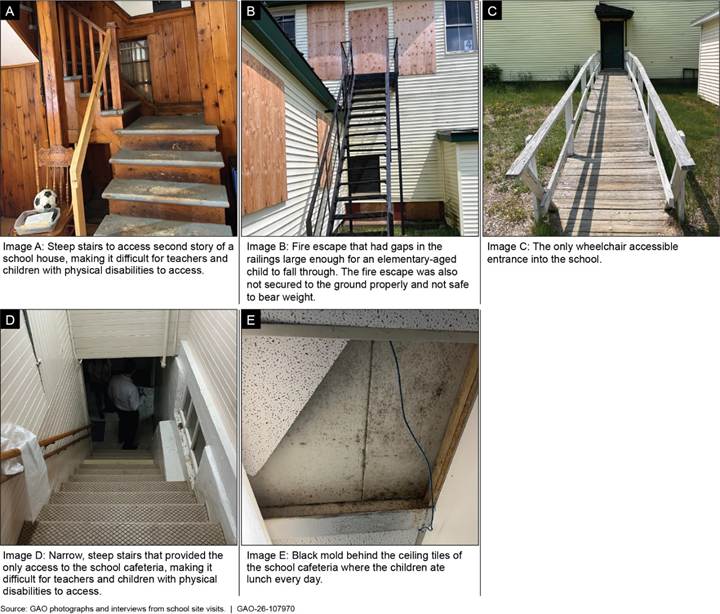
School 3. School leaders told us this rural elementary school was abruptly and permanently closed in 2024 due to safety issues discovered during the district’s facilities condition audit (see fig. 4). These issues included a lack of fire exits from the second floor, accessibility concerns, and mold. District officials told us that following the audit firm’s recommendation, the local school board called a meeting and voted to close the school immediately. This decision initially upset many parents and community members, who had not understood the scope and seriousness of its safety concerns, according to officials. District officials told us children had attended the school in this condition for many years. A former teacher told us she taught art in the school’s moldy basement, and that the children had to wear rain boots in her classroom when it rained. Children with physical disabilities were unable to attend the school because of its significant accessibility issues, according to district officials.
Figure 4: Photographs of A Rural Elementary School with Serious Safety Concerns, Permanently Closed in 2024
Americans with Disabilities Act of 1990 and Other Code Compliance
In addition to specific facility issues and overall building conditions, district leaders described challenges related to compliance with the Americans with Disabilities Act of 1990 (ADA) and safety codes (e.g., fire). District officials considered an estimated 12 percent of schools to have major ADA issues and an additional estimated 35 percent to have minor ADA issues.[22] We also surveyed districts about other types of compliance issues and estimated that over one-third of schools nationwide have either major or minor compliance issues related to fire, safety, or building code requirements.[23] These issues were also present in several of the schools we visited, where we observed situations that school officials described as serious safety concerns.
About One in Five Districts Canceled School Due to an Emergency Facility Issue in the 2024-25 School Year, Affecting an Estimated 2 Million Students Nationwide
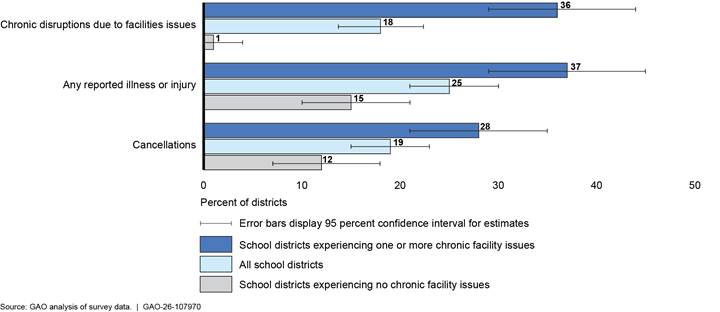
School facility issues disrupt teaching and learning in school districts nationwide, and districts with chronic facility issues in particular experienced closures and disruptions, according to our nationally generalizable survey. We estimate that one in five school districts (19 percent) had to cancel school due to an emergency facility issue in the 2024-25 school year (see fig. 5). A similar proportion experienced other chronic disruptions to instruction (e.g., discomfort, distraction, and displacement from classrooms). We also estimate that in a quarter of school districts nationwide, students and teachers became ill or were injured due to a facility issue in at least one school.
Figure 5: Estimated Percent of School Districts Experiencing Negative Consequences of Facility Issues by Presence or Absence of Chronic Facility Issues, School Year 2024-25
Canceled School
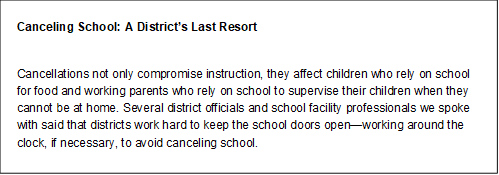
We estimate that one in five school districts (19 percent) experienced a facility problem severe enough that classes had to be canceled in at least one school for a day or more during the 2024-25 school year. These types of issues were associated with an estimated 3.5 million lost days of learning and affected an estimated 2 million children.[24] We estimate that about 12 percent of school districts moved learning online in at least one school due to a facilities issue in the 2024-25 school year.[25] However, an estimated 10 percent of districts canceled classes that were never made up.[26]
Source: GAO interviews with selected school district officials and school facility professionals. | GAO‑26‑107970
Districts canceled school due to a variety of facility emergencies. The most frequent causes of these emergencies were plumbing, electrical, and classroom temperature issues. Further, we estimate that one in five cancellations was precipitated by severe weather or a natural disaster (e.g., interior flooding or roof damage caused by a hurricane).[27] Districts we visited in Alabama, Maine, and Oregon said they had canceled school for a variety of reasons. For example, school was canceled in one elementary school after a sewer line backed up, risking disease transmission among the school’s 500 students and staff. In another school, classroom temperatures reached 110 degrees, resulting in emergency closure.
Other Disruptions to Instruction
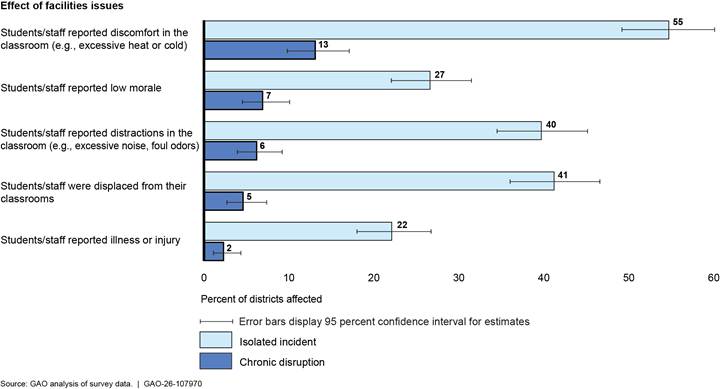
Facility issues can also disrupt instruction in other ways besides cancellations. About one in five districts (an estimated 18 percent) experienced chronic disruptions to instruction in the 2024-25 school year.[28] About four out of five districts (an estimated 78 percent) experienced isolated disruptions.[29] The most common kinds of chronic disruption were discomfort in the classroom (e.g., due to excessive heat or cold), low morale, distraction (e.g., due to excessive noise or foul odors), and displacement from classrooms (see fig. 6).
Figure 6: Estimated Percent of Districts Experiencing Disruptions Caused by Facility Problems in at Least One School, School Year 2024-25
Note: Survey respondents could choose from “never occurred in any school,” “isolated incident(s) in at least one school,” or “chronic problem in at least one school” when rating facility issues.
In our site visits to Alabama, Maine, and Oregon district and school leaders described various ways their own instructional activities had been disrupted by facility issues.
Discomfort. At one of the schools we visited without air conditioning, the principal told us classrooms got so hot during heat waves that students would become sweaty, irritable, and sluggish; some would get headaches.[30] Teachers would turn off the lights and have quiet time to cope with the heat. At a different elementary school, officials said that the boiler went out frequently, leaving most rooms close to 45 degrees. The school remained open, and students wore winter coats to keep warm in the classroom, according to officials.
Displacement. In all three states we visited, district leaders told us inadequate cooling on hot days was a common reason for temporarily closing classrooms. School leaders told us that when it got too hot to learn, teachers and students would relocate to a cooler part of the school (e.g., the cafeteria). In some cases, teachers held class outside because it was cooler than inside. However, another teacher said moving her class was so disruptive that she tried to avoid it. Other reasons cited for moving students out of classrooms included leaks, excessive noise, and electrical issues.
Distraction. School officials we spoke with said facility conditions can interfere with student focus and disrupt learning. For example, we saw one classroom shared by two classes due to space constraints, with a low partition dividing the space. According to a teacher, children in the class told their teacher the classroom was “so noisy that we can’t think.” In another school, the principal said that when a classroom was too hot, the class would “end up talking about the temperature instead of learning about math.”
Low morale. In one district we visited, officials noted that the middle school had been moved to three separate buildings within a 3-year period due to facility issues, which was mentally draining and left teachers and students feeling displaced. A teacher in another district we visited told us that poor building conditions led students to have lower expectations for their own behavior and performance.
Illness and Injury
In the most extreme cases, facility issues can affect the safety of children and adults in the classroom. We estimate that facility issues caused illness or injury in one-quarter of districts (25 percent).[31] Leaders at one school told us a coworker got sick while teaching due to excessive heat in the classroom and had to be taken to the hospital. School leaders in a different state told us a teacher reported their chronic health problem had been exacerbated by poor air quality at a school with extensive mold and poor ventilation.
In other districts, officials expressed fear that students would be injured due to unsafe facilities. Leaders from one school told us that ceiling tiles and lighting fixtures had fallen from the ceiling of the school cafeteria. No one had been injured, but they said they considered it a major safety concern. In a different district, a school we visited had no functioning fire alarms or sprinklers. The principal told us that the school used a “fire watch” protocol which involved patrolling the building every 15 minutes to look for fire.
Districts with Limited Capacity to Conduct Preventive Maintenance Had More Facility Problems
A district’s capacity to perform preventive maintenance was strongly associated with its school conditions and the extent to which it experienced disruptions to instruction in the 2024-25 school year. Districts with limited capacity for preventive maintenance have a significantly higher proportion of schools in poor or very poor condition compared to districts with full capacity for preventive maintenance. In addition, the lower a district’s self-rated capacity to perform preventive maintenance, the more chronic facility issues, chronic disruptions, and serious safety concerns the district experienced (see fig. 7). These observations build on our previous findings regarding deferred maintenance, which include that it may diminish the performance of building systems, shorten their useful lives, and lead to significantly higher long-term costs.[32]
Figure 7: Facility Issues in at Least One School and Outcomes by District Capacity to Perform Preventive Maintenance, School Year 2024-25
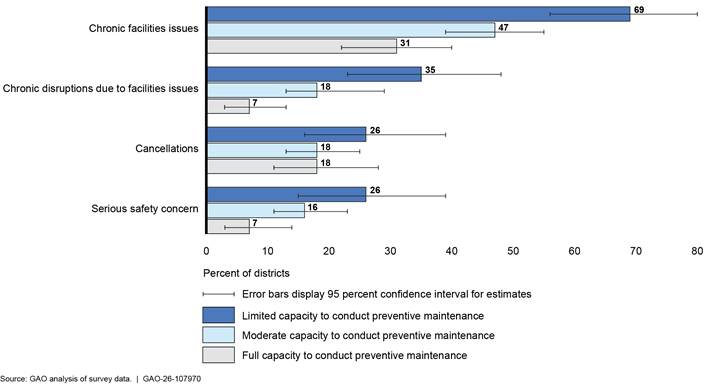
Note: Survey respondents reported the chronic facility issues, chronic disruptions, cancellations, and serious safety concerns occurred in at least one school.
Districts Face Common Facilities Funding Constraints and Leaders Identified Various Practices to Help Address Facility Needs
Districts Often Operate in Challenging Funding Environments
School districts’ facility needs often compete with other budget priorities. Nationwide, school districts face declining student populations, increasing proportions of students with disabilities, aging school infrastructure, and rising construction costs.[33] These factors can put increasing pressure on school budgets and can make it difficult for districts to fully fund their needed maintenance and capital projects.
We estimate that in over half of all school districts (55 percent), leaders considered their budgets insufficient to meet their facility needs in the 2024-25 school year (see fig. 8).
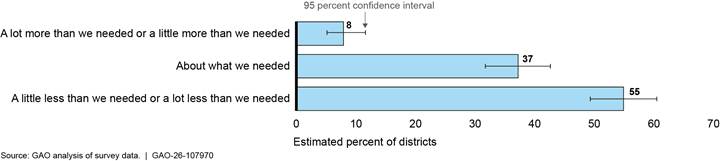
Note: GAO asked survey recipients “How well did your most recent facility budget compare to your district’s needs?” GAO combined “a little more than we needed” and “a lot more than we needed” into one reporting category and “a little less than we needed” and “a lot less than we needed” into another reporting category. For a complete list of survey questions we asked, see appendix III.
On our site visits, district leaders in Alabama, Maine, and Oregon described the challenges they faced in funding their facilities budgets. Officials from an urban district said it was challenging for them to stretch their available funding across 75 structures and a million square feet of grounds. Officials from a rural district said the district’s limited funding only allowed them to temporarily fix facility problems to keep schools open when equipment broke.
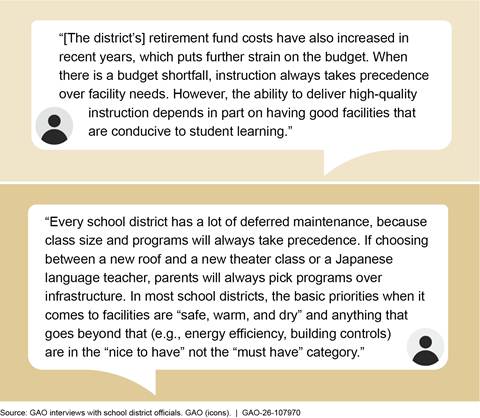
District leaders also told us that facilities budgets were often among the first items to be cut when a district faced budget pressure (see fig. 9). When facilities budgets are cut, district leaders sometimes must defer maintenance or forgo mounting capital projects. Mounting capital projects may be especially challenging for districts due to difficulty securing bond funding and rising construction costs.
Deferring Maintenance
Districts that underfund their facilities budgets may defer repairs and maintenance as a short-term strategy to save costs. We estimate that about one in five districts had limited or no capacity to conduct preventive maintenance in line with recommended schedules (e.g., servicing boilers or flushing sewer lines).[34] As previously mentioned, a higher percentage of these districts had chronic facility condition issues than other districts. And a higher percentage had chronic disruptions to instruction as a result of these issues.
In line with our survey findings, several district leaders told us they were unable to complete all necessary maintenance due to limited funding. In one district, leaders told us they relied on their insurance policy to pay for damage caused by failing building systems because the district did not have funding to address its facility needs proactively. In a rural district, leaders told us the district previously had no tools to carry out even basic repairs. As a result, the district relied on contractors for facilities work and encountered issues with contractors exploiting the district for work that was never completed. Finally, officials from another district told us that since they had deferred $500 million in maintenance work several years ago, they had completed $200 million in needed work. However, due to rising costs and additional maintenance needs, $500 million in outstanding work still remained.
Difficulty Implementing Capital Projects
We also identified gaps in many districts’ capacity to address larger long-term capital needs (e.g., to build or renovate schools). We estimate that about a quarter of districts identified a need to build one or more new schools and more than half needed to renovate or expand one or more existing schools (see table 1). We also estimate that, among districts with these needs, nearly one-third had no plans to address them.[35]
|
All districts |
Districts that identified the capital need |
|||
|
Capital need and plans to address each need |
Estimated percent |
Budgeted or already underway |
In the planning stages |
No plans to address yet |
|
Build one or more new schools |
23% |
32%* |
39%* |
29%* |
|
Renovate or expand one or more existing schools |
58% |
25% |
45% |
30% |
|
Replace major building systems in one or more existing schools (e.g., HVAC, telecom, plumbing) |
70% |
40% |
44% |
16% |
|
Address safety and security (e.g., upgrading security systems, doors) |
75% |
47% |
49% |
4% |
Source: GAO analysis of survey data. | GAO‑26‑107970
Notes: The estimates in this table have a margin of error of no more than plus or minus 7 percentage points, unless otherwise noted with an asterisk (*). Those estimates with an asterisk had a margin of error of plus or minus 11 percentage points. GAO asked survey recipients “What capital needs or projects currently exist in your district?” and “How would you describe the status of district efforts to address its identified capital needs?” For additional capital needs we asked about, see appendix II. For a complete list of survey questions, see appendix III.
Difficulty securing bond funding. Districts that experience difficulty securing bond funding may have gaps in their capacity to carry out major capital projects. Nationwide, an estimated 48 percent of districts had not attempted to pass a bond within the past 5 years.[36] However, nearly all these districts (an estimated 96 percent), had unmet capital needs. About half (an estimated 49 percent) indicated that they needed bond funding.[37]
There are various reasons why districts that have identified a need for bond funding may not attempt to float a bond. According to our survey results, a low local tax base hindered efforts to fund school facility needs in about half of districts (an estimated 55 percent), with the highest rate among rural districts.[38] In one rural district we visited, officials said that the community was economically limited, and raising local taxes to support schools was considered nearly impossible. Moreover, bond initiatives can be expensive to mount, and districts may not attempt a bond if they do not think it will succeed, even if they need the money. For example, leaders from one district said before going out for a bond, they hired a research company to survey the community to gauge its level of support. Officials from another district told us it cost the district about $100,000 to prepare to put a bond on the ballot, and after voters voted down a bond proposal in 2023, officials did not think it would be worth trying again.
Even among districts that can pass bonds or secure voter approval for local tax increases to finance needed capital improvements, the amount raised may not cover all capital needs. Among the four districts we visited that had passed bond initiatives in the last 10 years, all had major capital projects the bond money did not cover. In one district we visited, leaders said that their district had approved a $250 million tax increase to cover capital needs. The district had identified two schools to replace, but there were many more buildings that needed to be replaced or with issues that needed to be addressed. The district was planning to float a bond but could not borrow as much funding as needed due to rising interest rates. In another district that had successfully passed a bond, leaders said the district was able to replace about 75 percent of its roofs with bond funding. However, the other 25 percent would have to be continually patched until they could be replaced.
Rising construction costs. According to the U.S. Bureau of Labor Statistics, new school building construction costs increased by 58 percent between January 2016 and January 2026.[39] Much of that increase occurred after September 2021, consistent with broader inflationary trends. According to our survey, high construction costs was the most frequently identified barrier to meeting districts’ facility needs, with an estimated 82 percent of school districts identifying it as a barrier.[40] In one district we visited, officials said the district successfully passed a bond for its facility needs, but it took 18 months to receive the permits to start the work. In that time, the costs of many of the proposed projects doubled and the district was unable to complete all of the bond’s proposed projects. District leaders said this dynamic affected their ability to ask voters to approve future bonds because the community did not understand why all projects were not completed, losing trust in district leadership. In another district, officials told us that when the district does not receive enough competitive bids, they pay higher prices for projects than they otherwise would.
Some Districts Have Overcome Facility Challenges by Prioritizing and Building Consensus Around Strategic Investments
Among district leaders we spoke with, those who had successfully navigated facilities-related challenges and built momentum for positive change identified strategies for doing so, including: (1) strategically investing resources in preventive maintenance and cost savings measures, (2) planning for facilities, (3) leveraging expertise, and (4) building community buy-in for capital projects.
Investing in Preventive Maintenance and Cost Savings Measures
Preventive maintenance. Obtaining support to invest in preventive maintenance can be challenging when budgets are tight, according to one district official we interviewed. However, doing so can help districts improve their overall facility conditions and save money in the long run. District officials we interviewed described various resulting benefits. For example, officials from an urban district said their decision to invest in preventive HVAC maintenance and system upgrades had “paid major dividends,” resulting in the number of repair calls dropping from 1,500 in 2018 to 90 in 2025.
Cost savings measures. Similarly, cost savings measures can help expand districts’ capacity within existing funding levels. Doing so can require commitment to fund initial investments—as well as expertise to know which investments will pay off. For example, one facilities director we spoke with led a multi-year effort—with support of the chief financial officer—to install sophisticated utility monitoring systems throughout the district. The director said that allowed his team to optimize energy use and quickly detect and repair problems. These efforts required an up-front investment but ultimately saved the district hundreds of thousands of dollars annually, according to this official. Leaders from another district described leveraging the expertise of a consultant, who advised them to purchase electricity from an alternative energy consortium, saving the district 40 percent on their electric bills.
Facilities Planning
Districts that engage in planning activities may better ensure that their facilities investments align with top priorities.[41] Districts leaders we met with described the planning processes they used to identify and prioritize facilities investments. In one district, leaders told us that the new superintendent prioritized developing a 10-year facilities plan to help the district identify and focus on key priorities, rather than leadership’s pet projects. Leaders in another district told us they had conducted a facility condition assessment (FCA) to generate a long-term capital plan. The FCA results guided the district’s decision to prioritize HVAC systems and building envelopes (i.e., roofs, walls, windows, and foundations) for investment. District officials said the district has completed numerous facilities projects in recent years, including installing 38 new roofs and 10 HVAC systems.
Leveraging Expertise
To overcome gaps in facilities expertise, superintendents we interviewed developed collaborative relationships with facilities managers and other knowledgeable leaders. In one district we visited, officials said the district formed a leadership team that included staff from facilities, finance, and IT to address facility issues in a timely manner and foster open communication. District officials said that this leadership team’s open communication and positive working relationships will be especially helpful to support the new superintendent expected to join the district. Having such a leadership team can help ensure continuity in the district’s facility improvement efforts. In another school district we visited, officials told us the district sought a budget increase for the facilities department so that it could hire a qualified candidate for the vacant facilities director role. The district hired a candidate with a construction management background, who brought facilities maintenance best practices to the district.
Several district leaders described how developing internal expertise was important to ensure that vender-proposed initiatives were good investments. These district leaders described unscrupulous vendors who attempt to sell energy-efficiency or building-control packages to districts with the promise of cost-savings that appeared unlikely to materialize. Leaders from one district said that vendors frequently promised savings for schools that “did not always add up.” These leaders turned down an offer that would lock the district into a long-term contract with no way to independently monitor whether accrued savings benefited the district or the vendor. Instead, they said districts could implement energy-savings practices in-house (e.g., installing weather proofing on doors) at a fraction of the cost.
Building Community Buy-In for Capital Investments
District leaders noted the importance of community buy-in on large capital projects. Through our survey, we found that nearly all the districts that had successfully passed a bond in recent years considered community support for school facility investment as key to their success (an estimated 94 percent).[42]
Consistent with our survey findings, district leaders told us that listening to and involving the community in the process of developing a bond proposal was key to successfully passing a bond. For example, leaders in one district we visited told us they prioritized community outreach following a previous bond failure. By surveying the community, the district learned that community members loved the schools and did not understand the dire condition they were in. The district then invited key community members—including opponents of the previous bond initiative—to envision a solution to the schools’ facility problems. The district further worked to inform the community of the consequences if the bond did not pass—that the district would have to close, students would move to a neighboring district, and that neighboring district’s higher taxes would apply to the community’s residents. The process took years, but ultimately, with the community’s support, the proposed bond succeeded, according to district leaders.
Views on State and Federal Facilities-Related Policies Were Mixed, and Stakeholders Identified Possible Solutions
Most School Districts Found that State and Federal Factors Hindered Their Ability to Meet Facility Needs
According to our survey, state and federal factors comprised three of the top five factors districts cited as hindering their ability to meet their school facility needs: low state formula funding (an estimated 73 percent), lack of federal grant and loan opportunities (an estimated 61 percent), and lack of state grant and loan opportunities (an estimated 57 percent).[43] In addition, districts also commonly considered state and federal laws, regulations, or policies—which we refer to as “requirements”—as harmful to their ability to meet their facility needs. Specifically, an estimated 56 percent of districts found state requirements harmful to their ability to make facility investments; 35 percent found federal requirements harmful.[44] A lower proportion found these requirements helpful—about one-quarter for state requirements and 12 percent for federal requirements.[45] Some survey respondents, as well as district leaders we interviewed during our site visits to Alabama, Maine, and Oregon, provided additional insights into these concerns.
Low state formula funding. According to Census data, nearly half of all district revenues (45 percent) came from the states in fiscal year 2024. Most of that support (65 percent) came from formula funds.[46] However, we found that districts generally considered this funding inadequate to meet their facility needs, according to our survey. One survey respondent said the state’s formula unfairly disadvantaged their district after adjusting for the district’s wealth. Other respondents stated that there was too little state funding available for school districts. Some of the 218 district leaders that provided comments on our open-ended survey questions shared concerns about the amount of state formula funding or state funding overall (see fig. 10). For instance, two district leaders noted in their survey comments that their state had capped funding below the level they should have received under the formula.
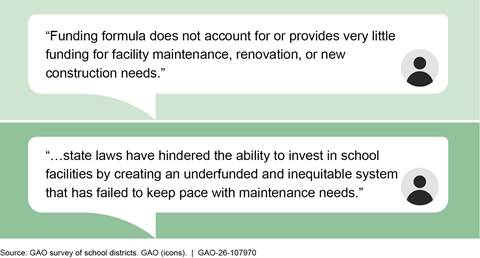
Note: GAO’s survey of district leaders allowed respondents to provide voluntary open-ended comments. These comments are not generalizable.
Lack of federal or state grant and loan opportunities. Some district leaders highlighted the positive impact of federal COVID-19 funding in open-ended comments on our survey. However, some of the 123 district leaders who provided comments on whether federal policies hurt their ability to make school facility investments specifically cited a lack of federal grant and loan opportunities as hindering their ability to meet facility needs.[47] Respondents shared similar concerns about a lack of state grant and loan opportunities. Similarly, districts we visited shared the challenges they faced with limited and unpredictable state funding opportunities. In Maine, for example, districts compete for state grants to renovate or replace schools in poor physical condition.[48] Although some districts received funding for their projects, leaders in one district we visited told us the grants, which are allotted based on need, created an incentive for some districts to allow facilities to fall into disrepair so that those districts could be higher on the list for funding. Survey respondents from two states noted that, as small rural districts, they did not qualify for state funding that targeted urban districts in their state.
Impact of state and federal requirements. Our survey found that leaders in more than half of districts (an estimated 56 percent) believed state requirements hurt their ability to make facility investments.[49] In interviews and open-ended survey comments, district leaders expressed these views in more depth, in some cases citing how costly it is to meet state and federal requirements or the lack of funding to meet them. For example, a district official in Oregon told us that when the state required schools to use LED lighting, it cost the district $5 to $6 million to retrofit all their facilities. Leaders in another Oregon district told us that it would cost up to $1 million to make the high school’s bathrooms ADA compliant. Moreover, some of the 218 district leaders who provided open-ended comments on how state policies hurt their ability to invest in infrastructure specifically cited concerns about the cost implications of certain state requirements. They included new requirements for storm shelters, energy efficiency measures, and professional (architectural and engineering) review of contracts over $100,000. We also estimate that leaders in about a third of districts believed federal requirements hurt their ability to make facility investments.[50] Some respondents shared similar concerns about unfunded federal requirements (see fig. 11).
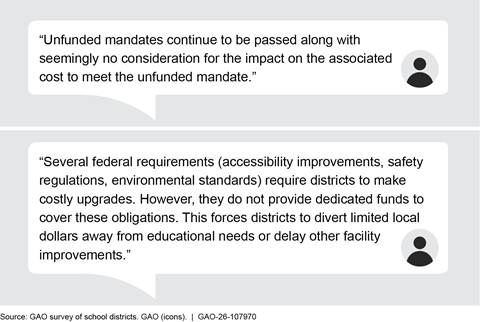
Note: GAO’s survey of district leaders allowed respondents to provide voluntary open-ended comments. These comments are not generalizable.
Stakeholders Identified State Practices That Could Help Address Systemic Facility Issues
Some states have implemented or are exploring practices to help districts address their facility needs, according to state task force and commission reports we reviewed from 19 states.[51] These practices generally align with those described as helpful by survey respondents and district leaders we interviewed. They included (1) financial supports, (2) monitoring and planning, (3) data tracking and technical assistance, and (4) cost reduction strategies.
Financial Supports
Some states reported that they are working through how to better support districts as they face challenging budget environments. Financial solutions identified by stakeholders we interviewed and reports we reviewed included implementing dedicated state funding for facilities, state supports for bond initiatives, and new funding partners and approaches.
Dedicated state funding for facilities. Dedicated state funding for school infrastructure can help districts better plan for facilities investments, according to our interviews and reports we reviewed. According to Education Commission of the States (ECS), at least 19 states established dedicated revenue sources (other than general funds) for construction funding for districts as of 2023.[52] Sources for this funding included use taxes, excise taxes, lottery revenues, and proceeds from the sale and use of state lands. ECS officials told us that dedicated funding streams can help stabilize district facilities budgets during economic downturns. A Maryland state report we reviewed also noted that predictable sources of state funding can help districts avoid construction delays and cost overruns caused by funding gaps. In open-ended comments on our survey, three district leaders from different states reported that their states’ dedicated funding stream helped them make needed investments. Four reports that we reviewed from states without dedicated funding streams explored possible new dedicated sources of school infrastructure funding.
Bond supports. Some states have supported districts that need bond funding for major capital projects. For example, states may take steps in the following areas:
· Providing incentives to help districts pass bonds. Oregon’s matching grant program for districts that pass local bonds was recommended by a 2014 task force and was used by all three districts we visited. A leader in one of these districts told us the $6 million matching grant they received on a $37 million bond was very helpful. Nationwide, we estimate that half of districts with recent successful bond initiatives considered the availability of state incentives to be a contributing factor to the bond’s success.[53]
· Making bonds more affordable. States can also help districts obtain better bond terms and thereby reduce districts’ bond costs. According to ECS, as of 2023, 31 states allowed the issuance of bonds to support school districts’ facility construction. Five states provided other bond supports (e.g., subsidizing district repayment costs). In about half (17) of these states, these bonds and other supports were backed by the full faith and credit of the state, which can help districts secure lower interest rates.
· Acting as a lender. States can also loan districts money at low interest rates to reduce districts’ need for bond funding. ECS reported that nine states allowed for state-funded loans to support facility construction. We reviewed reports from two states—Michigan and Montana—that described such programs.
New funding approaches. Two of the state reports that we reviewed noted that existing approaches were not sufficient to solve the scale and complexity of the funding challenges currently facing districts. They suggested that innovative approaches might be necessary. Specifically, reports from Maine and Maryland proposed exploring possible avenues of support in public-private partnerships, and Maine’s report also proposed exploring philanthropy and community financial institutions as potential sources of support. In particular, Maine’s report highlighted community development financial institutions, which are overseen by the U.S. Department of the Treasury and provide loans, investments, financial services, and technical assistance to underserved populations and communities.
Monitoring Facility Conditions and Planning for Future Investments
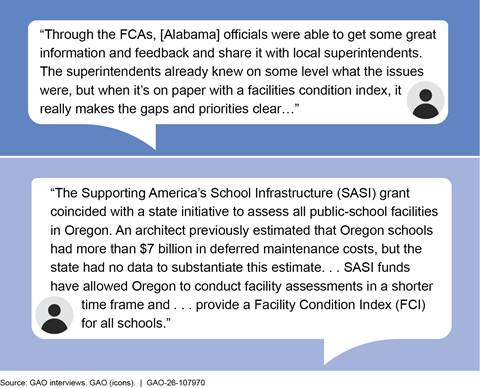
Some states help districts manage their physical assets more strategically by helping them monitor facility conditions and plan for future investments, including by using an FCA process. According to our survey, nearly half of districts (an estimated 44 percent) received assistance conducting an FCA from their states.[54] Districts with low capacity for preventive maintenance—a higher proportion of which do not use FCAs compared to other districts—may benefit most from state support in this area.[55] Of the seven states and one territory that received SASI grants from Education, all used funding to expand access to FCAs. For instance, Alabama assessed 23 schools in high-needs districts. Oregon expected to assess all schools by the end of 2026 and used the process to identify the biggest barriers to meeting its deferred maintenance backlog. State officials in these states discussed the value of FCAs during our site visits (see fig. 12). Other states—including Maryland, New Mexico, Rhode Island, Vermont, and Wyoming—have completed statewide FCAs. New Mexico uses FCA results to prioritize schools in the poorest condition for major renovation or replacement, and to rank facilities with critical system failures (e.g., HVAC, roofing, and security) for targeted upgrades. It also provides funding to districts to develop facility master plans, which are used in longer-term planning.
Figure 12: Examples of State Officials’ Views About the Value of Facility Condition Assessments (FCA) in Alabama and Oregon
Data Tracking and Technical Assistance
States can also play a role in tracking facilities-related information and ensuring that districts have access to technical assistance and expertise.
Data tracking. Some states have recognized a need for data systems that track school facilities information for internal analysis and monitoring, as well as for better communication with stakeholders, including the public. A New Mexico state report we reviewed described a statewide facilities information system it created to track facility conditions, building systems, and capital renewal needs. As part of its SASI grant, Oregon was developing standardized data dashboards to address data gaps identified by a 2014 taskforce. Oregon’s dashboards were intended to enhance the state’s understanding of district needs and enable the state to communicate those needs to the legislature and other stakeholders. Ohio also has an interactive dashboard to enhance communication with the public.
Technical assistance. Multiple states have also helped districts access technical assistance or are exploring ways to do so. For example, as part of its SASI grant, Pennsylvania hired a chief architect to provide tailored technical assistance to districts on planning and infrastructure assessments. Arizona trained districts on topics such as grants management and working effectively with vendors. Kentucky assigns a licensed architect to each district to guide and support districts’ facilities planning efforts, as recommended in a 2022 state task force report. Leaders in one Maine district we visited suggested that the state’s existing regional service centers could be expanded to employ shared experts and technical staff (e.g., HVAC engineers) that would benefit smaller districts with limited capacity to retain skilled technicians.
Cost-Reduction Strategies
Some states have developed policy tools designed to help districts operate more efficiently. These tools include encouraging preventive maintenance, investing in energy efficiency measures, consolidating or closing schools, adopting purchasing power strategies, and supporting districts in their capital projects.
Encouraging preventive maintenance. Since deferred maintenance can be a major facilities cost driver, some states have created incentives for districts to invest in preventive maintenance and other states are considering new ways to do so. For example, Massachusetts rates districts on the extent to which they meet industry best practices for general cleanliness, routine maintenance and repair, and capital repair, and a Massachusetts state report we reviewed described how meeting state ratings thresholds is a prerequisite for districts to receive state capital funding. New Mexico requires districts to have a preventive maintenance plan in place to receive state capital funding, according to a New Mexico state report we reviewed. Maryland awards incentives to districts that have an average or above rating on the state’s annual assessment of maintenance efforts. A Virginia task force recommended setting maintenance targets to help districts avoid major replacement costs in the future. A Maine state commission, citing an $11 billion deferred maintenance backlog among districts in the state, recommended providing targeted funding to help districts address deferred maintenance and carry out preventive maintenance.
Investing in energy efficiency. Some states have taken, or are considering, steps to ensure that energy savings accrue to districts rather than to vendors. For instance, Tennessee provides low-interest loans to enable districts to undertake their own energy efficiency projects, with loan repayments structured based on projected annual energy cost savings. A Maine commission recommended creating a state point of contact to advise districts on vendor energy efficiency proposals. As part of its SASI grant, Rhode Island reported efforts to help districts improve energy efficiency.
Consolidating or closing schools. States can help districts with excess infrastructure make the difficult decisions to close or consolidate underused schools. We estimate that nearly a quarter of districts (22 percent) have too much space, which can be financially burdensome for districts with declining populations.[56] Maine’s task force recommended that the state conduct enrollment studies to relieve districts of the responsibility to determine when consolidation may be warranted. It also recommended that the state continue to incentivize consolidation through its state-funded capital projects. In 2024, Arizona launched a pilot that uses FCAs to systematically flag facilities that have exceeded their useful life for potential closure, with the aim of reducing district maintenance costs and demands on limited state funds. Furthermore, an Alabama state official told us that FCAs conducted as part of that state’s SASI grant were a catalyst for discussions about school consolidations and closures.
Adopting purchasing power strategies. States can also foster economies of scale by supporting district efforts to form purchasing cooperatives or consortia to reduce costs, which two districts cited as helpful in open-ended comments on our survey. They can also allow districts to purchase items through state-negotiated contracts, which another district cited as helpful. Maine’s task force further recommended the state expand use of centralized procurement to reduce costs for districts.
Supporting districts’ capital projects. States can help districts find efficiencies and avoid costly delays when they undertake major capital projects. As we have reported, schedule delays and cost overruns often go hand in hand.[57] Some states have taken steps to help districts expedite their capital projects. For instance, Massachusetts provides preselected consultants and standardized contracts to help districts initiate their projects more quickly. Massachusetts also offers adaptable building designs, which can reduce design costs and timelines for districts. State reports in Maine and Virginia also noted that such designs can reduce upfront costs and time for districts. Maine’s report further recommended several strategies to streamline construction timelines and reduce costs for districts (e.g., through fast-tracking permitting).
Some states have also emphasized the importance of construction quality in their capital project supports. A Washington state report we reviewed described how the state requires districts to hire qualified project managers for major capital projects; project management services are also available through a regional service agency.[58] Because districts may not realize that a new building has construction deficiencies until after the project is deemed complete, Massachusetts and New Jersey provide post-construction inspections for all new schools. Maine’s report also recommended monitoring construction quality after the first and second years and systematic evaluation post-construction.
Agency Comments
We provided a draft of this report to Education for review and comment. Education did not have any comments on the report.
We are sending copies of this report to the appropriate congressional committees, the Secretary of Education, and other interested parties. In addition, the report is available at no charge on the GAO website at https://www.gao.gov.
If you or your staff have any questions about this report, please contact me at nowickij@gao.gov. Contact points for our Offices of Congressional Relations and Media Relations may be found on the last page of this report. GAO staff who made key contributions to this report are listed in appendix IV.
Sincerely,
Jacqueline M. Nowicki, Director
Education, Workforce, and Income Security
In this report, we examined: (1) the extent to which facility issues disrupt instruction in public schools; (2) challenges confronting school districts and the strategies they are using to address their facility needs; and (3) district leaders’ views on state and federal policies related to school facilities and how states can help districts address systemic school facility issues.
We took several steps to understand background information relevant to our research questions and to ensure that our methodological approach was sound. To better understand state and federal policies related to school facilities and opportunities for improvement, we began by interviewing Department of Education officials. During these interviews, we asked officials about the department’s role in providing funding for school facilities, among other topics. We reviewed federal documentation, including the Congressional Research Service’s 2020 report on federal programs related to school facilities and guidance from the Environmental Protection Agency on creating and maintaining healthy and environmentally friendly school facilities.[59] We also reviewed written documentation from Education regarding the Supporting America’s School Infrastructure (SASI) grant program as well as the grant establishing the National Center on School Infrastructure. We interviewed lead researchers from the National Center on School Infrastructure about their work and the data they collect on school facilities.
To learn more about how school facilities are assessed, managed, and can affect teaching and learning, we spoke to organizations with expertise in school facilities. These included national organizations focused on school facilities policy and information sharing, such as the 21st Century School Fund and the National Council on School Facilities. We also spoke with organizations that bring together people who work in school districts, including the Association of School Business Officials International and the National School Plant Managers Association.
To address our research objectives, we used the following methods, which we describe in greater detail below:
· We surveyed a nationally representative sample of K-12 public school districts.
· We visited nine school districts in three states and interviewed state, district, and school staff.
· We conducted building walkthroughs at 21 schools and observed building systems and features in each school.
· We analyzed the findings and recommendations of 25 reports issued by state commissions, legislative committees, and agencies regarding school facility issues.
· We reviewed a 50-state summary of state policies regarding school construction funding issued by the Education Commission of the States (ECS) and interviewed ECS officials about their methodology.
Survey of School Districts
To address all three objectives, we designed and administered a web-based survey to a nationally representative sample of school districts during the 2025-2026 academic year. We sent the survey to school district superintendents on November 20, 2025, and invited them to respond to the survey themselves or forward the survey to the district official best equipped to answer its questions. We closed the survey on January 23, 2026.
The survey included questions about
· school-facility conditions,
· facility-related school cancellations (i.e., temporary closures for one school day or more),
· the effects of facility issues on students and staff,
· maintenance practices,
· funding levels, and
· the impact of state and federal policies.
To ensure that our survey results were generalizable, we designed a sample that would allow us to support population estimates for responses to the survey with a reasonable margin of error. We defined our target population as all school districts in the 50 U.S. states and the District of Columbia that are not under the jurisdiction of the Department of Defense or Bureau of Indian Education.[60] We used the Local Education Agency Universe database from Education’s Common Core of Data for the 2023-2024 school year as our sampling frame. We assessed the reliability of the Common Core of Data by reviewing existing documentation about the data and testing for outliers, missing data, and required data elements. We determined the Common Core of Data were sufficiently reliable for the purposes of selecting a nationally representative survey of school districts.
We filtered the Local Education Agency Universe data to make sure that school districts in the population frame
· were located in the 50 states or the District of Columbia;
· had one or more schools and one or more students;
· were not closed or otherwise nonoperational;
· were not supervisory unions, state government operated, or federally operated; and
· were not exclusively composed of charter schools.[61]
These filters left us with an initial in-scope population of 13,466 school districts. We analyzed this sample frame to look at how the population of school districts distributed across Census geographic regions, by racial composition of the students, Hispanic ethnicity, urbanicity, poverty (measured as percent of students eligible for free or reduced priced lunch), and size. We determined that these factors were all correlated with each other. Based on this analysis, we stratified our population of school districts by urbanicity into three levels (urban, suburban, and town/rural). To classify school districts by urbanicity, we used the National Center for Education Statistics Locality variable, at the aggregated four-category level of measurement, which includes urban, suburban, town, and rural classifications. We further simplified this classification by combining town and rural into a combined town/rural stratum.
We determined the appropriate sample size by considering three factors: the level of precision we wanted to achieve with our estimates, a reasonable response rate to our survey, and the resources required to achieve different levels of precision. Based on recent GAO surveys of school districts, we assumed a response rate of 55 percent to our survey. With that assumed response rate, we designed our sample to support estimates for attribute measures at the individual stratum level with a margin of error no larger than plus or minus 8 percentage points at the 95 percent level of confidence. This resulted in a stratified random sample of 765 school districts.
During the process of preparing the survey contact list, we discovered that numerous town/rural school districts included in our sample from Maine and South Dakota had consolidated since the 2023-2024 school year. We then used school district and state education agency websites to identify all town/rural school districts in these states that had consolidated.[62] We then adjusted the stratum population size and number of unique selections in our sample to account for these consolidations. While preparing our survey contact list, we also discovered additional school districts that were out of scope and eliminated them from our sample.[63] Our final in-scope sample size of 735 school districts is shown by stratum in table 2.
Table 2: Description of Sample Frame, Stratification, and Sample Sizes for the Stratified Random Sample of School Districts and Unweighted In-Scope Response Rates for Survey
|
Stratum |
Population size (number of districts) |
Sample size with out-of-scope cases removed |
Number of completed surveys |
Response rate |
|
Urban |
861 |
214 |
110 |
51.4% |
|
Suburban |
2,945 |
257 |
142 |
55.25% |
|
Rural |
9,705 |
264 |
175 |
66.29% |
|
Total |
13,511 |
735 |
427 |
58.10% |
Source: GAO analysis of Department of Education’s Common Core of Data for the 2023-2024 school year and GAO survey data. | GAO‑26‑107970
We obtained a total of 427 responses, achieving a weighted response rate of 62 percent.[64] Not every school district responded to every question due to survey logic and question nonresponse. We included any survey respondent who answered at least 64.9 percent of the questions on the survey in our analyses. We used logistical response propensity models to check for statistical nonresponse bias using available data from the sample frame. We found no statistically detectable nonresponse bias. Based on this, we used the design-based adjustment to the sampling weights for stratum level nonresponse. All generalizable survey estimates presented in this report are weighted.
All surveys based on statistical samples are subject to sampling error; that is, the difference between our survey results and what would have been obtained had we received completed surveys from the entire population. Because we followed a probability procedure based on random selections, our sample is only one of many samples that we might have drawn. Since each sample could have provided different estimates, we express our confidence in the precision of our particular sample’s results as a 95-percent confidence interval. A 95-percent confidence interval is the interval that would contain the actual population value for 95 percent of the samples we could have drawn. Confidence intervals are provided with each sample estimate in our report.
We took steps while designing and testing the survey questionnaire to minimize nonsampling errors. We pretested the draft instrument in July 2025 with five users, including one school district superintendent, one assistant superintendent, and three current and former school district facilities managers. In the pretests, we asked about the clarity of the questions as well as the flow and layout of the web-based survey. Additionally, in September 2026, we sent survey links to five individuals who were not in our sample so that they could take the survey and provide us with feedback. These included a district superintendent, one current and one former school district facilities director, and two external researchers. Based on feedback from the pretests, we revised the survey instrument. To obtain the maximum number of responses to our survey and to minimize nonsampling error caused by nonresponse, we sent reminder emails to nonrespondents and contacted each nonrespondent by telephone.
School District Visits and Building Walk-Throughs
To address our research questions, we visited nine districts across three states—Alabama, Maine, and Oregon—from April through July 2025. We selected states that reflect variation in average spending per student, geographic region, and receipt of federal Supporting America’s School Infrastructure (SASI) grant funds. Within these states, we selected districts for variation in urbanicity, poverty, and size.
We interviewed state education agency officials via teleconference in advance of the site visit.[65] During site visits, we interviewed district leaders about their district’s facility conditions and challenges, instances in which they had to cancel school due to a facility issue, the practices they used to address their facility issues, and the impact of state and federal policy on their facility management practices. Additionally, district leaders selected at least two schools per district for us to tour, with a focus on schools that had faced major facility issues, had canceled school due to a facility issue, or had permanently closed due to facility issues.[66]
Information we gathered from these interviews and observations, while not generalizable, provides insight into the conditions present in the states and school districts we visited. We used observations from these interviews and school visits as illustrative examples for all three of our objectives. Because we conducted these site visits before we finalized our survey instrument, we also used what we learned from the site visits to inform the questions we asked in our survey.
Report Review
We conducted internet searches to identify reports issued from 2016 through 2026 by state commissions, legislative committees, and agencies regarding school facility issues. A GAO librarian also conducted a literature search for mentions of state reports in periodicals. We then identified those mentioned reports. We also queried representatives of the National Center on School Infrastructure and the 21st Century School Fund for lists of additional state reports. Using these combined methods, we identified 66 mentions of state facilities reports in periodicals and a list of 26 additional potential state reports to consider for inclusion.
We excluded state reports that were
· not on the topics of public K-12 school facilities;
· too narrowly or broadly scoped;
· published before 2016;
· duplicative of reports already identified; or
· not retrievable or no longer public.
These steps left us with a set of 25 state task force, commission, and agency reports published between 2016 and 2026 that discussed state policies and other practices concerning school facility issues (see table 3).
|
State |
Title |
Author(s)/Agency |
Year |
|
AZ |
FY 2025 Annual Report |
Arizona Department of Administration, School Facilities Division |
2026 |
|
CT |
Summary Report of the 2021 SCG-1050 School Facilities Survey |
Connecticut Department of Administrative Services |
2022 |
|
ID |
K-12 Public School Buildings |
Office of Performance Evaluations, Idaho Legislature |
2022 |
|
KY |
Facilities Task Force Recommendations |
Kentucky Department of Education |
2022 |
|
MA |
2025 School Survey Report |
Massachusetts School Building Authority |
2026 |
|
MD |
21st Century School Facilities Commission Final Report |
21st Century School Facilities Commission |
2018 |
|
MD |
Final Report of the Workgroup on Educational Development Specifications |
Interagency Commission on School Construction |
2019 |
|
MD |
State Spending Series: School Construction |
Comptroller of Maryland |
2025 |
|
ME |
Governor's Commission on School Construction |
Joint Standing Committee on Education and Cultural Affairs, Joint Standing Committee on Appropriations and Financial Affairs |
2026 |
|
MI |
Michigan Statewide School Facilities Study Final Report |
School Finance Research Foundation |
2025 |
|
MT |
K-12 School Funding: A 10-Year Review |
2015-2016 School Funding Interim Commission |
2016 |
|
MT |
K-12 Funding: School Facilities |
School Funding Interim Commission |
2025 |
|
NH |
Our Schools, Our Kids: Achieving Greater Equity for New Hampshire Students and Taxpayers |
The Commission to Study School Funding |
2020 |
|
NJ |
2024 Educational Facilities Needs Assessment (EFNA) and Project Prioritization for SDA Districts |
New Jersey Department of Education, Office of School Facilities Planning |
2025 |
|
NM |
FY 2025 Annual Report; July 1, 2024 - June 30, 2025 |
New Mexico School Facilities Authority, Public School Capital Outlay Council |
2025 |
|
OH |
FY 2017 Annual Report |
Ohio Facilities Construction Commission |
2017 |
|
OH |
FY 2025 Annual Report |
Ohio Facilities Construction Commission |
2025 |
|
PA |
Basic Education Funding Commission Majority Report Adopted by Commission |
Basic Education Funding Commission |
2024 |
|
RI |
State of Rhode Island Schoolhouses |
Rhode Island Department of Education, School Building Authority |
2017 |
|
RI |
Renewing the Dream: Delivering 21st Century Learning Environments for Every Student |
Rhode Island Department of Education, School Building Authority |
2022 |
|
TN |
An Overview Of K-12 Capital Infrastructure and Investment in Tennessee and Other States |
Tennessee Comptroller of the Treasury, Office of Research and Education Accountability |
2024 |
|
VA |
Needs and Conditions of Virginia School Buildings, Prepared for the Commission on School Construction and Modernization |
Virginia Department of Education |
2021 |
|
VA |
Report on the Interim Activity of The Commission on School Construction and Modernization |
The Commission on School Construction and Modernization |
2022 |
|
VT |
Vermont School Facilities Inventory and Assessment |
Vermont Agency of Education |
2022 |
|
WA |
Joint Legislative Task Force on Improving State Funding for School Construction, Final Report |
Joint Legislative Task Force on Funding School Construction |
2018 |
Source: GAO literature review. | GAO‑26‑107970
Two analysts read each report. Each analyst identified information about existing or proposed state policies and other practices to assist school districts with school facilities issues, including, but not limited to, school facility planning, maintenance, renovation, and construction.[67] The analysts then reconciled their independent assessments of each report to develop a consensus set of findings related to each state report. In addition, we reviewed a 50-state summary of state policies regarding school construction funding issued by the ECS and interviewed the officials about their methodology.
We surveyed a statistical sample of 735 Local Education Agencies—also known as school districts—from November 20, 2025 to January 23, 2026. This appendix presents nationally generalizable results from select survey questions.
Survey Question: Which of the following school facility issues did your district experience in the 2024-2025 school year? Do not include issues caused by public utility failures, such as power outages or external water main breaks.a
|
|
Isolated incident |
Chronic problem |
||||
|
Facilities issue |
Percent of districts |
Lower bound CIb |
Upper bound CI |
Percent of Districts |
Lower bound CI |
Upper bound CI |
|
Water intrusion (e.g., leaks in the building |
59% |
54% |
64% |
22% |
18% |
27% |
|
Excessive heat or cold in classroom(s) |
53% |
47% |
58% |
21% |
17% |
26% |
|
Plumbing issues or leaks (not caused by |
70% |
65% |
75% |
13% |
10% |
17% |
|
Ventilation issues, poor air quality inside |
36% |
31% |
42% |
13% |
10% |
17% |
|
Structural problems (e.g., foundation, building |
28% |
24% |
33% |
13% |
9% |
17% |
|
Telecommunication system outages (e.g., |
59% |
54% |
65% |
11% |
8% |
15% |
|
Electrical issues |
55% |
49% |
60% |
8% |
6% |
11% |
|
Indoor flooding (e.g., burst pipe inside school) |
36% |
31% |
42% |
4% |
3% |
7% |
|
Environmental hazards (e.g., exposure to mold |
33% |
28% |
38% |
3% |
2% |
5% |
|
Fire within the building (not caused by |
6% |
4% |
9% |
0% |
0% |
1% |
|
Something else |
17% |
8% |
34% |
18% |
9% |
33% |
|
Total percent of all districts experiencing 1 or more facilities problem |
95% |
92% |
97% |
47% |
42% |
53% |
Source: GAO analysis of survey data. | GAO‑26‑107970
aRespondents were asked to choose between “Never occurred in any school,” “Isolated incident(s) in at least one school,” and “Chronic problem in at least one school.”
bCI refers to the confidence interval.
Survey Question: How would you describe the overall conditions of the facilities in your district’s schools?a
|
Condition |
Estimated percent |
Lower bound CIb |
Upper bound CI |
|
Schools that are in good/excellent condition |
53% |
48% |
58% |
|
Schools that are in fair condition |
33% |
29% |
37% |
|
Schools that are in poor/very poor condition |
14% |
12% |
17% |
Source: GAO analysis of survey data. | GAO‑26‑107970
aThe survey question asked respondents to rate how many of their schools were in the following categories: Excellent to Good (Buildings look and work like new, or are in good shape with only small issues that don’t affect daily use.), Fair (Buildings are functional, but have noticeable wear or aging parts that need fixing within the next few years.), Poor to Very Poor (Buildings have big problems that make them hard to use, unusable, or unsafe in their current condition. Major repairs are needed soon or right away.)
bCI refers to the confidence interval.
Survey Question: How would you describe your district schools’ level of compliance with Americans with Disabilities Act (ADA) standards?a
|
Condition |
Estimated percent |
Lower bound CIb |
Upper bound CI |
|
Schools with no ADA issues |
53% |
48% |
59% |
|
Schools with minor ADA issues |
35% |
29% |
40% |
|
Schools with major ADA issues |
12% |
9% |
15% |
Source: GAO analysis of survey data. | GAO‑26‑107970
aThe survey question asked respondents about how many of their district’s schools have no ADA compliance issues or major issues. We calculated the estimated percent of schools with minor ADA issues by taking the district’s total number of schools and subtracting the number of schools with no ADA issues and the number of schools with major ADA issues, then dividing by the total number of schools. We did not independently assess or verify school districts’ compliance with ADA standards. These survey questions and responses do not constitute a legal finding of compliance or noncompliance.
bCI refers to the confidence interval.
Survey Question: How would you describe your district schools’ level of compliance with fire protection, safety, and other facility standards?a
|
Condition |
Estimated percent |
Lower bound CIb |
Upper bound CI |
|
Schools with no compliance issues |
65% |
59% |
72% |
|
Schools with minor compliance issues |
29% |
23% |
35% |
|
Schools with major compliance issues |
6% |
4% |
8% |
Source: GAO analysis of survey data. | GAO‑26‑107970
aThe survey question asked respondents to estimate how many of their district’s schools have no compliance issues or major issues. We calculated the estimated percent of schools with minor compliance issues by taking the district’s total number of schools and subtracting the number of schools with no compliance issues and the number of schools with major compliance issues, then dividing by the total number of schools.
bCI refers to the confidence interval.
Survey Question: How would you describe the amount of indoor space in your district’s schools?a
|
Space Description |
Estimated percent |
Lower bound CIb |
Upper bound CI |
|
Schools with more space than needed |
22% |
18% |
26% |
|
Schools with as much space as needed |
43% |
39% |
48% |
|
Schools with less space than needed |
35% |
31% |
39% |
Source: GAO analysis of survey data. | GAO‑26‑107970
aThe survey question asked respondents to estimate how many of their district’s schools have more space than needed or less space than needed. We calculated the estimated percent of schools with as much space as needed by taking the district’s total number of schools and subtracting the number of schools with less space than needed and the number of schools with more space than needed, then dividing by the total number of schools.
bCI refers to the confidence interval.
Table 9: Estimated Percent of K-12 Public School Districts Experiencing Effects from Facility Issues
Survey Question: What was the impact of the school facility issues you selected during the 2024-2025 school year? You may need to check with other staff members for some of these questions.a
|
|
Isolated incident |
Chronic problem |
|||||
|
Facilities effect |
Percent of districts |
Lower bound CIb |
Upper bound CI |
Percent of districts |
Lower bound CI |
Upper bound CI |
|
|
Classes were cancelled and NOT made up later |
9% |
6% |
12% |
1% |
0% |
2% |
|
|
Classes were cancelled but made up later |
16% |
12% |
20% |
1% |
0% |
2% |
|
|
Learning moved online |
12% |
8% |
15% |
1% |
0% |
2% |
|
|
Students/staff were displaced from their classrooms |
41% |
36% |
47% |
5% |
3% |
7% |
|
|
Students/staff reported discomfort in the classroom (e.g., excessive heat or cold) |
55% |
49% |
60% |
13% |
10% |
17% |
|
|
Students/staff reported distractions in the classroom (e.g., excessive noise, foul odors) |
40% |
35% |
45% |
6% |
4% |
9% |
|
|
Students/staff reported illness or injury |
22% |
18% |
27% |
2% |
1% |
4% |
|
|
Students/staff reported low morale |
27% |
22% |
32% |
7% |
5% |
10% |
|
|
Something else |
6% |
1% |
19% |
6% |
0% |
24% |
|
|
Total percent of all districts experiencing 1 or more effects of facilities problems |
78% |
74% |
83% |
18% |
14% |
22% |
|
Source: GAO analysis of survey data. | GAO‑26‑107970
aRespondents were asked to choose between “Never occurred in any school,” “Isolated incident(s) in at least one school,” and “Chronic problem in at least one school.”
bCI refers to the confidence interval.
Survey Question: What capital needs or projects currently exist in your district?
|
Capital need |
Percent of districts |
Lower bound CI |
Upper bound CI |
|
Build one or more new schools |
23% |
19% |
28% |
|
Renovate or expand one or more existing schools |
58% |
52% |
63% |
|
Purchase modular classrooms |
9% |
7% |
13% |
|
Replace major building systems in one or more existing schools (e.g., HVAC, telecom, plumbing) |
70% |
65% |
75% |
|
Address safety and security (e.g., upgrading security systems, doors) |
75% |
70% |
80% |
|
Replace roof(s) |
67% |
61% |
72% |
|
Replace interior fixtures, furniture, or equipment |
69% |
63% |
74% |
|
Replace windows |
55% |
49% |
60% |
|
Something else |
37% |
21% |
56% |
Source: GAO analysis of survey data. | GAO‑26‑107970
Note: CI refers to the confidence interval.
Table 11: K-12 Public School Districts – Factors Hindering Districts’ Ability to Meet Facilities Needs
Survey Question: From your perspective, do any of the following factors hinder your district’s ability to fund its school facility needs?
|
Factors |
Percent of districts |
Lower bound CI |
Upper bound CI |
|
Community factors |
|
|
|
|
Low local tax base |
55% |
49% |
60% |
|
Low support from the local community |
31% |
26% |
36% |
|
Low district capacity to apply for or manage grants and loans |
30% |
25% |
36% |
|
Low district capacity to pursue cost saving measures (e.g., energy savings) |
25% |
20% |
30% |
|
Financial factors |
|
|
|
|
No capital reserve funds |
28% |
23% |
33% |
|
Inability to obtain bond funding (e.g., low bond rating, at debt limit) |
19% |
15% |
24% |
|
Inability to pass bonds (e.g., low likelihood of passage) |
37% |
32% |
43% |
|
Inability to pay up front for reimbursable costs |
32% |
27% |
38% |
|
Inability to match grant funds |
37% |
32% |
42% |
|
High construction costs |
82% |
78% |
86% |
|
State and federal factors |
|
|
|
|
Low state formula funding |
73% |
67% |
77% |
|
Not qualified for state grant and loan opportunities |
28% |
23% |
33% |
|
Factors |
Percent of districts |
Lower bound CI |
Upper bound CI |
|
Not qualified for federal grant and loan opportunities |
30% |
25% |
36% |
|
Lack of state grant and loan opportunities |
57% |
51% |
62% |
|
Lack of federal grant and loan opportunities |
61% |
56% |
67% |
Source: GAO analysis of survey data. | GAO‑26‑107970
Note: CI refers to the confidence interval.
Survey Questions: Have state laws, regulations, or policies helped or hurt your district’s ability to make school facility investments?
Have federal laws, regulations, or policies helped or hurt your district’s ability to make school facility investments?a
|
Response |
Percent of districts |
Lower bound CIb |
Upper bound CI |
|
State policy helped |
26% |
22% |
31% |
|
State policy hurt |
56% |
51% |
62% |
|
Federal policy helped |
12% |
9% |
16% |
|
Federal policy hurt |
35% |
30% |
40% |
Source: GAO analysis of survey data. | GAO‑26‑107970
aThe survey question allowed respondents to select “yes” or “no” to both responses. That is, a respondent could respond that state policy both helped and hurt, neither helped nor hurt, or a mix. Similarly, respondents were not forced to say federal policy either helped or hurt; they could respond yes or no independently to either option.
bCI refers to the confidence interval.
Survey Question: How would you describe the status of district efforts to address its identified capital needs?
|
|
Budgeted or already underway |
In the planning stages |
No plans to address yet |
|||||||
|
Capital need |
Percent of districts |
Lower bound CI |
Upper bound CI |
Percent of districts |
Lower bound CI |
Upper bound CI |
Percent of districts |
Lower bound CI |
Upper bound CI |
|
|
Build one or more new schools |
32% |
23% |
42% |
39% |
30% |
50% |
29% |
20% |
40% |
|
|
Renovate or expand one or more existing schools |
25% |
20% |
31% |
45% |
38% |
52% |
30% |
24% |
37% |
|
|
Purchase modular classrooms |
33% |
19% |
49% |
33% |
20% |
49% |
34% |
21% |
51% |
|
|
Replace major building systems in one or more existing schools (e.g., HVAC, telecom, plumbing) |
40% |
34% |
46% |
44% |
38% |
50% |
16% |
12% |
22% |
|
|
Address safety and security (e.g., upgrading security systems, doors) |
47% |
41% |
53% |
49% |
42% |
55% |
4% |
2% |
8% |
|
|
Replace roof(s) |
40% |
34% |
46% |
51% |
44% |
58% |
9% |
6% |
14% |
|
|
Replace interior fixtures, furniture, or equipment |
36% |
30% |
43% |
50% |
43% |
56% |
14% |
10% |
19% |
|
|
Replace windows |
26% |
20% |
33% |
46% |
39% |
53% |
28% |
22% |
35% |
|
Source: GAO analysis of survey data . | GAO‑26‑107970
Note: CI refers to the confidence interval.
This appendix contains the closed- and open-ended questions from our survey of local educational agencies (referred to in this report as school districts or districts). In some cases, respondents received different questions based on their response to a prior question. For example, school districts that had successfully passed a bond in the last 5 years received additional questions about the bond effort. However, school districts that had not attempted to pass a bond in the last 5 years received questions to explain the reasons why. For a detailed discussion of our survey methodologies, see appendix I.
GAO Survey of School District Facility Conditions
Who we are: Founded in 1921, the U.S. Government Accountability Office (GAO) is an independent, non-partisan federal agency that provides Congress with objective, fact-based information.
What we’re doing: Congress has asked GAO to review:
· The extent to which school facility problems disrupt instruction in public schools;
· Barriers that school districts face in addressing their school facility problems; and
· Practices that have helped school districts access available resources to address their school facility problems.
What we’re asking: As part of this review, GAO is using this survey to request information from districts. This survey includes questions about your school district’s:
· School facility conditions;
· Strategies for managing facility needs;
· Capital needs and projects;
· Financial capacity; and
· Views on state and federal supports.
How we’ll use your survey responses: We will summarize survey responses and include them in a report to Congress on school facilities. The report will not disclose specific responses, nor will it name any district or survey respondent. If our report makes any recommendations, they will be directed to federal agencies, not to state departments of education or school districts. When complete, the report will be publicly available on our website.
Completing the survey: We estimate that this survey will take 15 to 25 minutes to complete. Please answer all of the questions in their entirety. Your responses will help us provide Congress with an up-to-date assessment of facility challenges facing school districts nationwide and strategies used to address them.
We suggest using your computer rather than your phone: You can use either one, but the version on your computer will be easier on your eyes and your thumbs.
Who should fill out the questionnaire: This survey should be completed by knowledgeable superintendents or facilities managers for your school district. If you are not able to answer the questions in this survey, please forward the survey to the person in your district who is best able to do so.
It’s okay to consult with other officials: When responding, you may want to consult with other officials in your district, such as facilities and maintenance staff, operations professionals, or business office professionals, who are knowledgeable about the facilities challenges your school district faces. Please note: only one person may fill out the survey online. If multiple people need to provide input, please coordinate your responses before filling out the online survey.
Thank you for your help in getting reliable information to Congress about U.S. public school facilities!
First, for context, we’d like to ask a couple questions about you: the person filling out the questionnaire. If more than one person contributes, please answer these questions about the person who has the biggest role in filling out the questionnaire.
Q1 What best describes your role in the school district?
o Superintendent
o Assistant superintendent
o Chief operating officer
o Chief financial officer
o Business manager
o Facilities manager
o Operations manager
o Maintenance director
o Other (please write in your role)

Q2 How many years have you been in your role in this district?
o Less than 1 year
o 1
o 2
o 3
o 4
o 5
o 6
o 7
o 8
o 9
o 10
o More than 10
Next, we’d like to ask you some overview questions about your district’s school facilities.
Q3 To get started, how many schools are in your district?

How would you describe the overall conditions of the facilities in your district’s schools? Please see the definitions at the bottom of the page.
Q4 About how many of your district’s school(s) are in good or excellent condition?
Q5 About how many of your district’s school(s) are in poor or very poor condition?
Here’s our understanding of your district schools’ facility conditions, based on the information you provided. Please adjust what you entered if this summary doesn’t look right to you.
|
Excellent to Good |
Fair |
Poor to Very Poor |
|
0 |
0 |
0 |
|
|
|
|
|
Condition |
Description |
|
Excellent to Good |
Buildings look and work like new or are in good shape with only small issues that don’t affect daily use. |
|
Fair |
Buildings are functional but have noticeable wear or aging parts that need fixing within the next few years. |
|
Poor to Very Poor |
Buildings have big problems that make them hard to use, unusable, or unsafe in their current condition. Major repairs are needed soon or right away |
How would you describe your district schools’ level of compliance with Americans with Disabilities Act (ADA) standards?
Q6 About how many of your district’s school(s) would you say have no ADA compliance issues?
Q7 About how many of your district’s school(s) would you say have major ADA compliance issues?
Here’s our understanding of your district schools’ degree of ADA compliance, based on the information you provided. Please adjust what you entered if this summary doesn’t look right to you.
|
No Issues |
Minor Issues |
Major Issues |
|
0 |
0 |
0 |
How would you describe your district schools’ level of compliance with fire protection, safety, and other facility standards?
Q8 About how many of your district’s school(s) would you say have no compliance issues?
Q9 About how many of your district’s school(s) would you say have major compliance issues?
Here’s our understanding of your district schools’ degree of compliance with fire protection, safety, and other facility standards, based on the information you provided. Please adjust what you entered if this summary doesn’t look right to you.
|
No Issues |
Minor Issues |
Major Issues |
|
0 |
0 |
0 |
How would you describe the amount of indoor space in your district’s schools?
Q10 About how many of your district’s school(s) would you say have more space than needed?
Q11 About how many of your district’s school(s) would you say have less space than needed?
Here’s our understanding of the amount of space your district schools have, based on the information you provided. Please adjust what you entered if this summary doesn’t look right to you.
|
More Than Needed |
As Much As Needed |
Less Than Needed |
|
0 |
0 |
0 |
Q12 Which of the following school facility issues did your district experience in the 2024-2025 school year? Do not include issues caused by public utility failures, such as power outages or external water main breaks.
|
|
Never occurred in any school |
Isolated incident(s) in at least one school |
Chronic problem in at least one school |
|
Excessive heat or cold in classroom(s) |
o |
o |
o |
|
Ventilation issues, poor air quality inside school building |
o |
o |
o |
|
Electrical issues |
o |
o |
o |
|
Plumbing issues or leaks (not caused by student behavior) |
o |
o |
o |
|
Telecommunication system outages (e.g., WiFi, internet, or phone problems not caused by service provider) |
|
o |
o |
|
Fire within the building (not caused by student behavior) |
o |
o |
o |
|
Structural problems (e.g., foundation, building envelope) |
o |
o |
o |
|
Environmental hazards (e.g., exposure to mold or asbestos, lead paint or pipes) |
o |
o |
o |
|
Water Intrusion (e.g., leaks in the building envelope, water from outside coming in) |
o |
o |
o |
|
Indoor flooding (e.g., burst pipe inside school) |
o |
o |
o |
|
Something else (please describe) |
o |
o |
o |
Q13 What was the impact of the school facility issues you selected during the 2024-2025 school year? You may need to check with other staff members for some of these questions.
|
|
Never occurred in any school |
Isolated incident(s) in at least one school |
Chronic problem in at least one school |
|
Classes were cancelled and NOT made up later |
o |
o |
o |
|
Classes were cancelled but made up later |
o |
o |
o |
|
Learning moved online |
o |
o |
o |
|
Students/staff were displaced from their classrooms |
o |
o |
o |
|
Students/staff reported discomfort in the classroom (e.g., excessive heat or cold) |
|
o |
o |
|
Students/staff reported distractions in the classroom (e.g., excessive noise, foul odors) |
o |
o |
o |
|
Students/staff reported illness or injury |
o |
o |
o |
|
Students/staff reported low morale |
o |
o |
o |
|
Something else (please describe) |
o |
o |
o |
Q14 How many schools in your district closed for a day or more due to a facility issue during the 2024-2025 school year? Please do not include weather-related closures, such as snow days, or closures due to public utility failures, such as power outages or external water main breaks.
Q15 In a moment, we’re going to ask you a few questions about each school that closed (its name, the number of days closed, and the reason for closure). Would you like to enter that information right now, or would you prefer to skip it for now and have us contact you about it?
o Enter the information now
o Skip it for now — please contact me
You identified ( X ) schools with a closure. For this set of questions, in the online survey, we will ask you to answer these questions for each school that had a closure.
Q16 What is the name of school that closed?
Q17 How many school days was school closed? (Please enter 999 for permanent closure.)
Q18 What was the main facility issue that caused the closure
o Excessive heat or cold in the classroom
o Ventilation issues, poor air quality inside school building
o Electrical issues
o Plumbing issues or leaks (not caused by student behavior)
o Fire within the building (not caused by student behavior)
o Structural problems (e.g., foundation, building envelope)
o Environmental hazards (e.g., exposure to mold or asbestos, lead paint or pipes)
o Water Intrusion
o Indoor flooding
o Something else
Q19 Is there anything else we should know about the facility issue that caused the closure?
Q20 Was the facility issue in that caused the closure precipitated by severe weather or a natural disaster?
o Yes
o No
Q21 Do you want to keep entering the information about your closed schools, or would you prefer to skip the rest and have us contact you to get it later?
o Keep entering information
o Skip it for now — please contact me
Q22 Do you have serious concerns about the safety of any of your district’s school facilities?
o Yes
o No
Q23 (If yes) How many such schools?
Q24 (If yes) How many of those schools do you plan to close or replace in the next 2 years?
Q25 Is there anything else we should know about the condition of the school buildings in your district?
The next set of questions asks about your district’s strategies for managing its facility needs.
Q26 Does your district use any of the following practices to plan for or prioritize its facility investments?
|
|
Yes |
No |
|
Periodic facility audits or facility condition assessments |
o |
o |
|
A facility condition index (FCI) to prioritize projects |
o |
o |
|
Considering the cost of facility ownership when establishing the annual maintenance budget |
o |
o |
|
An indoor air quality management program or plan |
o |
o |
|
Long-range facilities planning |
o |
o |
|
A regular cycle of equipment replacement |
o |
o |
|
A regular schedule of preventative maintenance |
o |
o |
|
A work-order system |
o |
o |
|
Something else (please explain) |
o |
o |
Q27 Does your district use any of the following to reduce facility costs?
|
|
Yes |
No |
|
||
|
Energy financial incentives (e.g., energy savings performance contracts) |
o |
o |
|||
|
Energy efficiency efforts (e.g., energy audits, purchasing energy efficient equipment) |
o |
o |
|||
|
Building management system or HVAC controls |
o |
o |
|||
|
Uniform building and equipment standards (e.g., lighting, fixtures) |
o |
o |
|||
|
Water-saving measures (e.g., low-water landscaping, water-saving plumbing fixtures) |
o |
o |
|||
|
Negotiate vendor discounts |
o |
o |
|||
|
Purchasing cooperatives or consortiums (e.g., for supplies, utilities, services) |
o |
o |
|||
|
School facility asset tracking program |
o |
o |
|||
|
Something else (please explain) |
o |
o |
|||
Q28 How would you describe your district’s capacity to perform preventative maintenance in line with recommended schedules (e.g., HVAC system checks, boiler servicing, flushing septic and sewer lines)?
o Full capacity
o Moderate capacity
o Limited capacity
o No capacity
Q29 Is there anything else we should know about your district’s strategies for managing its facility needs?
Q30 What capital needs or projects currently exist in your district?
|
|
Yes |
No |
|
Build one or more new schools |
o |
o |
|
Renovate or expand one or more existing schools |
o |
o |
|
Purchase modular classrooms |
o |
o |
|
Replace major building systems in one or more existing schools (e.g., HVAC, telecom, plumbing |
o |
o |
|
Address safety and security (e.g., upgrading security systems, doors) |
o |
o |
|
Replace roof(s) |
o |
o |
|
Replace interior fixtures, furniture, or equipment |
o |
o |
|
Replace windows |
o |
o |
|
Something else (please explain) |
o |
o |
Q31 How would you describe the status of district efforts to address its identified capital needs?
|
|
In the planning stages |
No plans to address yet |
Budgeted or already underway |
|
Build one or more new schools |
o |
o |
o |
|
Renovate or expand one or more existing schools |
o |
o |
o |
|
Purchase modular classrooms |
o |
o |
o |
|
Replace major building systems in one or more existing schools (e.g., HVAC, telecom, plumbing) |
o |
o |
o |
|
Address safety and security (e.g., upgrading security systems, doors) |
|
o |
o |
|
Replace roof(s) |
o |
o |
o |
|
Replace interior fixtures, furniture, or equipment |
o |
o |
o |
|
Replace windows |
o |
o |
o |
|
Something else (please explain) |
o |
o |
o |
Q32 Which of the following funding sources is your district using to carry out its current capital projects?
|
|
Yes |
No |
|
General funds |
o |
o |
|
Local bond funds |
o |
o |
|
State grant funds |
o |
o |
|
State loans |
o |
o |
|
Federal funds |
o |
o |
|
Individual donations |
o |
o |
|
Private grant funds |
o |
o |
|
Utility or energy incentive funds |
o |
o |
|
Other (please explain |
o |
o |
Q33 How many local bond measures has your school district attempted to pass over the past 5 school years (2020-2021 through 2024-2025)? Bonds attempted and passed:
Q34 Bonds attempted but failed:
Q35 (If bonds passed) In total, how much money was raised through any successful local bond measures in the past 5 school years? Please enter in millions of dollars. For example, a bond worth $12,500,000 would be entered as 12.5.
Q36 (If bonds passed) You reported that your district attempted and passed at least one school bond. In your opinion, did any of the following factors contribute to the success of the local school bond initiative(s)? Community factors:
|
|
Yes |
No |
Don't Know |
|
Degree of community willingness to raise taxes |
o |
o |
o |
|
Community support for school facility investment |
o |
o |
o |
|
Degree of plan alignment with community preferences. |
o |
o |
o |
Electoral factors:
|
|
Yes |
No |
Don't Know |
|
High voter turnout |
o |
o |
o |
|
Low voter turnout |
o |
o |
o |
|
Voter approval threshold required to pass bonds |
o |
o |
o |
|
Organized groups (e.g., a political action committee) |
|
o |
o |
District factors:
|
|
Yes |
No |
Don't Know |
|
District leadership |
o |
o |
o |
|
Community outreach |
o |
o |
o |
|
Help from an external consultant |
o |
o |
o |
Proposal factors:
|
|
Yes |
No |
Don't Know |
|
Clarity of plans |
o |
o |
o |
|
Community familiarity with plans |
o |
o |
o |
|
Specific projects included in plans |
o |
o |
o |
Financial factors:
|
|
Yes |
No |
Don't Know |
|
Economic capacity of local tax base |
o |
o |
o |
|
Size of bond proposal |
o |
o |
o |
|
Extent of available state incentives |
o |
o |
o |
Q37 Was there anything else that contributed to the bond’s success?
Q38 (If bond failed) You reported that your district attempted to pass at least one bond that failed. In your opinion, did any of the following factors contribute to the failure of the local school bond initiative(s)?
Community factors:
|
|
Yes |
No |
Don't Know |
|
Degree of community willingness to raise taxes |
o |
o |
o |
|
Community support for school facility investment |
o |
o |
o |
|
Degree of plan alignment with community preferences. |
o |
o |
o |
Electoral factors:
|
|
Yes |
No |
Don't Know |
|
High voter turnout |
o |
o |
o |
|
Low voter turnout |
o |
o |
o |
|
Voter approval threshold required to pass bonds |
o |
o |
o |
|
Organized groups (e.g., a political action committee) |
o |
o |
o |
District factors:
|
|
Yes |
No |
Don't Know |
|
District leadership |
o |
o |
o |
|
Community outreach |
o |
o |
o |
|
Help from an external consultant |
o |
o |
o |
Proposal factors:
|
|
Yes |
No |
Don't Know |
|
Clarity of plans |
o |
o |
o |
|
Community familiarity with plans |
o |
o |
o |
|
Specific projects included in plans |
o |
o |
o |
Financial factors:
|
|
Yes |
No |
Don't Know |
|
Economic capacity of local tax base |
o |
o |
o |
|
Size of bond proposal |
o |
o |
o |
|
Extent of available state incentives |
o |
o |
o |
Q39 (If bond failed) Was there anything else that contributed to the bond’s failure?
Q40 (If no bonds attempted) Were any of the following factors relevant to your district’s decision not to seek a local school bond over the past 5 school years?
Financial factors:
|
|
Yes |
No |
Don't Know |
|
Have not needed bond funding |
o |
o |
o |
|
Previously passed a bond and do not want to ask the community for more |
o |
o |
o |
|
Close to or have reached debt limit |
o |
o |
o |
|
Unable to secure a bond (e.g., poor bond rating) |
o |
o |
o |
|
Lack resources to develop a bond proposal |
o |
o |
o |
|
Construction costs are too high |
o |
o |
o |
Community factors:
|
|
Yes |
No |
Don't Know |
|
Low tax base |
o |
o |
o |
|
Generally skeptical of investing in school facilities |
o |
o |
o |
|
Voted down school bond initiatives in the past |
o |
o |
o |
|
Lacks willingness to raise taxes |
o |
o |
o |
State policy factors:
|
|
Yes |
No |
Don't Know |
|
State incentives (e.g., matching funds, interest rate rebates, loan forgiveness) are not available to us |
o |
o |
o |
|
Available state incentives would not help us |
o |
o |
o |
|
We do not qualify for available state incentives |
o |
o |
o |
|
Something else (please explain) |
o |
o |
o |
Q41 For the most recent completed budget year, what was your district budget? Please enter in millions of dollars. For example, a budget of $5,750,000 would be entered as 5.75.
o Total district budget
Q42 What was your budget over the same period for facilities, maintenance, repairs, and building operations, including utilities? Please enter in millions of dollars. For example, a budget of $85,725 would be entered as .086.
o Facilities-related budget
Q43 How well did your most recent facility budget compare to your district’s needs?
o A lot more than we needed
o A little more than we needed
o About what we needed
o A little less than we needed
o A lot less than we needed
Q44 From your perspective, do any of the following factors hinder your district’s ability to fund its school facility needs?
Community factors:
|
|
Yes |
No |
|
Low local tax base |
o |
o |
|
Low support from the local community |
o |
o |
|
Low district capacity to apply for or manage grants and loans |
o |
o |
|
Low district capacity to pursue cost saving measures (e.g., energy savings) |
o |
o |
Financial factors:
|
|
Yes |
No |
|
No capital reserve funds |
o |
o |
|
Inability to obtain bond funding (e.g., low bond rating, at debt limit) |
o |
o |
|
Inability to pass bonds (e.g., low likelihood of passage) |
o |
o |
|
Inability to pay up front for reimbursable costs |
o |
o |
|
Inability to match grant funds |
o |
o |
|
High construction costs |
o |
o |
State and federal factors:
|
|
Yes |
No |
|
Low state formula funding |
o |
o |
|
Not qualified for state grant and loan opportunities |
o |
o |
|
Not qualified for federal grant and loan opportunities |
o |
o |
|
Lack of state grant and loan opportunities |
o |
o |
|
Lack of federal grant and loan opportunities |
o |
o |
Q45 Are there any other factors that hinder your district’s ability to fund its school facility needs?
Q46 Does your state offer any of the following support to help your district meet its school facility needs?
Technical support:
|
|
Yes |
No |
Don't Know |
|
Assistance with capital planning |
o |
o |
o |
|
Assistance with facility condition assessments |
o |
o |
o |
|
Off-the-shelf school facility designs |
o |
o |
o |
|
Other technical assistance (please explain) |
o |
o |
o |
Financial support:
|
|
Yes |
No |
Don't Know |
|
Financial incentives to upgrade building systems (e.g., lighting, HVAC) |
o |
o |
o |
|
Financial assistance for qualifying capital projects (e.g., loans or assumption of bond payments) |
o |
o |
o |
|
Direct funding for qualifying capital projects (e.g., grants, matching funds) |
o |
o |
o |
|
Other financial assistance (please explain) |
o |
o |
o |
Q47 Does your state offer any other kinds of support for school facility needs?
Q48 Have state laws, regulations, or policies helped or hurt your district’s ability to make school facility investments?
Helped:
▢ Yes (please explain)
▢ No (please explain)
Hurt:
▢ Yes (please explain)
▢ No (please explain)
Q49 Have federal laws, regulations, or policies helped or hurt your district’s ability to make school facility investments?
Helped:
▢ Yes (please explain)
▢ No (please explain)
Hurt:
▢ Yes (please explain)
▢ No (please explain)
Q50 One last thing: would you like us to email you an electronic copy of our report when it is issued in 2026?
o Yes, please!
o No thanks!
Congratulations! You’ve finished the questions. Ready to submit? Please review your responses before clicking the SUBMIT button below. Once you click SUBMIT, you will not be able to change your responses unless you email us for a retake link. A PDF copy of your responses will be available for download on the next screen after you submit your survey.
GAO Contact
Jacqueline M. Nowicki, Director, nowickij@gao.gov
Staff Acknowledgments
In addition to the contact named above, Ellen Phelps Ranen (Assistant Director), Jessica Rider (Analyst in Charge), Carl Barden, Ghipsel Cibrian-Lopez, Dan Corstange, Michael Fienberg, Kathleen McQueeney, Chris Morehouse, Liz Spurgeon, Walter Vance, and David Watsula made key contributions to this report. Michael Armes, James Ashley, Kyle Browning, Charlotte Cable, Sara Daleski, Brian Egger, Steven Flint, Alex Galuten, Kayla Good, Hayden Huang, Helena Johnson, Michael Jones, Jill Lacey, Jean McSween, John Mingus, Abinash Mohanty, Michelle Munn, Claire Saint-Rossy, Daniel Setlow, Lindsay Shapray, Curtia Taylor, Jeff Tessin, and Sonya Vartivarian made additional contributions.
The Government Accountability Office, the audit, evaluation, and investigative arm of Congress, exists to support Congress in meeting its constitutional responsibilities and to help improve the performance and accountability of the federal government for the American people. GAO examines the use of public funds; evaluates federal programs and policies; and provides analyses, recommendations, and other assistance to help Congress make informed oversight, policy, and funding decisions. GAO’s commitment to good government is reflected in its core values of accountability, integrity, and reliability.
Obtaining Copies of GAO Reports and Testimony
The fastest and easiest way to obtain copies of GAO documents at no cost is through our website. Each weekday afternoon, GAO posts on its website newly released reports, testimony, and correspondence. You can also subscribe to GAO’s email updates to receive notification of newly posted products.
Order by Phone
The price of each GAO publication reflects GAO’s actual cost of production and distribution and depends on the number of pages in the publication and whether the publication is printed in color or black and white. Pricing and ordering information is posted on GAO’s website, https://www.gao.gov/ordering.htm.
Place orders by calling (202) 512-6000, toll free (866) 801-7077,
or
TDD (202) 512-2537.
Orders may be paid for using American Express, Discover Card, MasterCard, Visa, check, or money order. Call for additional information.
Connect with GAO
Connect with GAO on X,
LinkedIn, Instagram, and YouTube.
Subscribe to our Email Updates. Listen to our Podcasts.
Visit GAO on the web at https://www.gao.gov.
To Report Fraud, Waste, and Abuse in Federal Programs
Contact FraudNet:
Website: https://www.gao.gov/about/what-gao-does/fraudnet
Automated answering system: (800) 424-5454
Media Relations
Sarah Kaczmarek, Managing Director, Media@gao.gov
Congressional Relations
David A. Powner, Acting Managing Director, CongRel@gao.gov
General Inquiries
[1]GAO, K‑12 Education: School Districts Frequently Identified Multiple Building Systems Needing Updates or Replacement, GAO‑20‑494 (Washington, D.C.: June 4, 2020).
[2]For a copy of our survey instrument, see appendix III.
[3]We excluded districts that did not have any students or had no schools in operation, were state or federally operated, and those that contained only charter schools. We excluded charter-only districts from our sample because charter school districts tend to face different types of school facility challenges than non-charter public school districts. We have reported separately on facility issues related to charter schools. See, for example GAO, K‑12 Education: Challenges Locating and Securing Charter School Facilities and Government Assistance, GAO‑21‑104446 (Washington, D.C.: Sept. 27, 2021). Appendix I contains further details regarding the sample for our survey.
[4]We did not assess the feasibility of the ideas presented in state commission reports. Further, we did not determine whether states implemented the policy or practice changes presented or the impact of any policy or practice changes.
[5]See, for example, GAO, Federal Real Property: Agencies Attribute Substantial Increases in Reported Deferred Maintenance to Multiple Factors, GAO‑23‑106124 (Washington, D.C.: Oct. 28, 2022).
[6]These estimates were based on a nationally generalizable survey of school districts. The 95 percent confidence interval for this estimate is 48 to 62 percent. GAO‑20‑494.
[7]The 95 percent confidence intervals for these estimates are 29 to 43 percent and 0.5 to 3.3 percent, respectively.
[8]Congressional Research Service, School Construction and Renovation: A Review of Federal Programs and Legislation, R41142 (Washington, D.C.: Aug. 31, 2020).
[9]GAO, K‑12 Education: School Districts Reported Spending Initial COVID Relief Funds on Meeting Students’ Needs and Continuing School Operations, GAO‑24‑106913 (Washington, D.C.: Sept. 23, 2024).
[10]The eight recipients were: Alabama, Arizona, California, Oregon, Pennsylvania, Rhode Island, Virginia, and the Commonwealth of the Northern Mariana Islands.
[11]The 95 percent confidence interval for this estimate is 42 to 53 percent.
[12]The 95 percent confidence interval for this estimate is 12 to 17 percent.
[13]The 95 percent confidence interval for this estimate is 11 to 19 percent.
[14]Survey respondents could choose from “never occurred in any school,” “isolated incident(s) in at least one school,” or “chronic problem in at least one school” when rating issues.
[15]The 95 percent confidence interval for this estimate is 92 to 97 percent.
[16]We specifically asked survey and interview respondents to focus on plumbing problems not caused by student behavior. For a complete list of survey questions we asked, see appendix III.
[17]The 95 percent confidence interval for this estimate is 12 to 17 percent.
[18]The 95 percent confidence interval for this estimate is 29 to 37 percent.
[19]The 95 percent confidence interval for this estimate is 48 to 58 percent. For the full definitions we provided, see the survey questionnaire in appendix III.
[20]The 95 percent confidence interval for the number of schools with serious safety concerns is 3,300 to 7,400.
[21]The estimated total number of schools with serious safety concerns slated for closure was 518 with a 95 percent confidence interval of 124 to 913 schools.
[22]The 95 percent confidence intervals for these estimates are 9 to 15 percent and 29 to 40 percent, respectively. For additional results and confidence intervals see appendix II. We did not assess any schools’ compliance with ADA requirements nor did our survey constitute a legal assessment of compliance. For more on accessibility, see GAO, K‑12 Education: School Districts Need Better Information to Help Improve Access for People with Disabilities, GAO‑20‑448 (Washington, D.C.: June 30, 2020).
[23]District leaders considered 29 percent of schools to have minor compliance issues related to fire, safety, and other building codes, while 6 percent of schools are considered to have major compliance issues. The 95 percent confidence intervals for these estimates are 23 to 35 percent and 4 to 8 percent, respectively.
[24]The 95 percent confidence intervals for these estimates are 2.5 million student days to 4.5 million student days and 1.5 million students to 2.4 million students, respectively.
[25]An estimated 11 percent of districts had isolated cases of learning moved online and 0.5 percent of districts had chronic occurrences. The 95 percent confidence intervals for these estimates are 8 to 15 percent and 0 to 2.1 percent, respectively.
[26]An estimated 9 percent of districts had isolated cases of classes canceled and not made up later and 0.7 percent of districts had chronic occurrences of classes not being made up. The 95 percent confidence intervals were 6 to 12 percent and 0.1 to 2.2 percent, respectively. One superintendent said it would be costly and impractical to make up school days lost at just one school, noting that his district’s teaching, bussing, and food service contracts spanned the entire district. Another superintendent said the district had transitioned to online learning in one instance, but that it was not equivalent to in-person learning. See appendix II for a complete list of impacts of facility issues we asked about on our survey and associated confidence intervals.
[27]The estimate is 20 percent and the 95 percent confidence interval is 12 to 33 percent.
[28]The 95 percent confidence interval for this estimate is 14 to 22 percent.
[29]The 95 percent confidence interval for this estimate is 74 to 83 percent.
[30]We completed 21 school visits across three states; 11 of these schools lacked air conditioning in all or part of the school building.
[31]The 95 percent confidence interval for this estimate is 20 to 30 percent.
[33]According to Education’s National Center for Education Statistics, public school enrollment declined between 2019 and 2022 from 50.8 million students to 49.6 million students and is projected to continue to decline through 2031. Additionally, the proportion of students with disabilities increased from 13 to 15 percent from 2012-2023. Also, see “Fast Facts: Condition of Public School Facilities,” National Center for Education Statistics, accessed July 14, 2026, https://nces.ed.gov/fastfacts/display.asp?id=94.
[34]The estimate for districts at limited capacity to perform preventive maintenance is 19 percent with a 95 percent confidence interval of 15 to 23 percent. The estimate for districts with no capacity is 0.4 percent with a 95 percent confidence interval of 0 to 2.2 percent.
[35]In addition, districts faced gaps in addressing safety and security issues (e.g., upgrading security systems). For a breakdown of districts’ capital needs and the percentage of those needs being actively addressed, with associated confidence intervals, see appendix II.
[36]The 95 percent confidence interval for this estimate is 42 to 54 percent.
[37]The 95 percent confidence intervals for these estimates are 91 to 99 percent and 41 to 57 percent, respectively.
[38]The 95 percent confidence interval for this estimate is 49 to 60 percent. We combined rural and town districts into one classification that we refer to as “rural” throughout this report. An estimated 62 percent of rural districts considered a low tax base to hinder their efforts to fund school facility needs. The 95 percent confidence interval for this estimate is 55 to 70 percent.
[39]U.S. Bureau of Labor Statistics, Producer Price Index by Industry: New School Building Construction [PCU236222236222], retrieved from FRED, Federal Reserve Bank of St. Louis; https://fred.stlouisfed.org/series/PCU236222236222, July 14, 2026.
[40]The 95 percent confidence interval for this estimate is 78 to 86 percent.
[41]We estimate that 90 percent of districts performed periodic facility audits or facility condition assessments. About half (an estimated 51 percent) use facility condition indexes to prioritize projects. These estimates have a 95 percent confidence interval of 86 to 94 percent and 45 to 56 percent, respectively. We found that more districts with full capacity to perform preventive maintenance engaged in planning practices, such as facility condition assessments, than those with limited capacity.
[42]The 95 percent confidence interval for this estimate is 88 to 98 percent.
[43]The 95 percent confidence intervals for these estimates are 67 to 77 percent, 56 to 67 percent, and 51 to 62 percent, respectively. The other two factors in the top five were high construction costs (an estimated 82 percent) and a low local tax base (an estimated 55 percent). The 95 percent confidence interval for these estimates are 78 to 86 percent and 49 to 60 percent, respectively.
[44]The 95 percent confidence intervals for these estimates are 51 to 62 percent and 30 to 40 percent, respectively.
[45]The estimate for districts that found state requirements helpful was 26 percent and the 95 percent confidence interval for this estimate is 22 to 31 percent. The 95 percent confidence interval for districts who found federal requirements helpful was 9 to 16 percent.
[46]According to Education Commission of the States, state formulas may include a base amount of funding per student with additional money or weights added to provide additional services and support to students with unique needs. Education Commission of the States, 50-State Comparison: K-12 Funding (March 2024), https://reports.ecs.org/comparisons/k-12-funding-2024-01.
[47]In open-ended comments, some survey respondents shared that ESSER funding had presented a significant opportunity to address high-priority facility issues. One district leader told us they used their funding to address mold and air quality concerns. Another said certain facility improvements would not have been possible without this funding. These comments align with our previous findings on COVID relief funding for education expenses. For example, about 46 percent of districts used these funds to improve their schools’ HVAC systems. See GAO‑24‑106913.
[48]This program has experienced three funding cycles in the last 16 years. The state has awarded funding for projects in 2010-2011, 2017-2018, and 2024-2025. “School Facilities,” Maine Department of Education Office of School Facilities, accessed June 11, 2025, https://www.maine.gov/doe/facilitieshome.
[49]The 95 percent confidence interval is 51 to 62 percent.
[50]This estimate is 35 percent and the 95 percent confidence interval is 30 to 40 percent.
[51]For a complete list of reports we reviewed, see appendix I. Implementing the policies identified in state reports may come with challenges and trade-offs. We did not assess the feasibility of the policies and practices identified in state reports. Further, except where noted, we did not determine whether states implemented the policy or practice changes identified in these reports or the impact of any policy or practice changes.
[52]Education Commission of the States (ECS), 50-State Comparison: K-12 School Construction Funding (June 2023), https://www.ecs.org/50-state-comparison-k-12-school-construction-funding-2023/.
[53]The 95 percent confidence interval for this estimate is 40 to 60 percent.
[54]The 95 percent confidence interval for this estimate is 38 to 51 percent.
[55]Specifically, we estimate that 77 percent of districts with lower capacity for preventive maintenance used FCAs, with a 95 percent confidence interval of 64 to 88 percent. In comparison, we estimate 96 percent of districts with full capacity reported using facility condition assessments with a 95 percent confidence interval of 88 to 99 percent.
[56]The 95 percent confidence interval for this estimate is 18 to 26 percent.
[57]For instance, we have reported that schedule variances are typically followed by cost variances and management tends to respond to schedule delays by adding more resources or authorizing overtime. See GAO, Schedule Assessment Guide: Best Practices for Project Schedules, GAO‑16‑89G (Washington, D.C.: Dec. 22, 2015) and GAO, Cost Estimating and Assessment Guide: Best Practices for Developing and Managing Program Costs, GAO‑20‑195G (Washington, D.C.: Mar. 12, 2020).
[58]The Construction Services Group, operated by Washington State’s Educational Services District 112, acts as an owner’s representative, advocate, and team member with the goal of ensuring that a school district’s consulting architects, engineers, and contractors perform high-quality services, on time and within budget. Educational Services District 112 website, page on Construction Services Group, https://www.esd112.org/csg/, downloaded July 10, 2026.
[59]Congressional Research Service, School Construction and Renovation: A Review of Federal Programs, R41142, (Washington, D.C.: Aug. 2020). Environmental Protection Agency, Indoor Air Quality Tools for Schools: Preventive Maintenance Guidance, EPA-402-K-18-001, (Washington, D.C.: March 2019) and Sensible Steps to Healthier School Environments, EPA-908-R-17-001, (Washington, D.C.: April 2017). EPA, Research References Related to Indoor Air Quality in Schools, last updated on August 14, 2025. Downloaded from: https://www.epa.gov/iaq-schools/research-references-related-indoor-air-quality-schools#55 on Feb. 4, 2026.
[60]We excluded these school districts from our scope because they have a fundamentally different mechanism for funding and operating school facilities. We have previously reported on school facilities under the jurisdiction of the Department of Defense and the Bureau of Indian Education. See for example, GAO, K‑12 Education: Administration of DOD Schools in Bahrain, GAO‑26‑108077 (Washington, D.C.: Dec. 18, 2025) and Indian Affairs: Actions Needed to Better Manage Indian School Construction Projects, GAO‑17‑447 (Washington, D.C.: May 24, 2017).
[61]We excluded charter-only districts from our sample because charter school districts tend to face different types of school facility challenges than non-charter public school districts. We have reported on facilities issues related to charter schools. See for example GAO, K‑12 Education: Challenges Locating and Securing Charter School Facilities and Government Assistance, GAO‑21‑104446 (Washington, D.C.: Sept. 27, 2021).
[62]We assigned any district that shared an identical contact address with one or more other districts to the new consolidated district.
[63]These included county offices of education which did not operate any schools, state operated schools, and career and technical schools embedded in community colleges that primarily educate adults.
[64]We used a weighted response rate because our survey sample incorporates strata with different probabilities of selection. A weighted response rate more accurately reflects the statistical effect of differing probabilities of selection.
[65]We interviewed state officials who were knowledgeable about their state’s role in funding, assessing, or providing other resources to school districts for school facilities. We discussed SASI grant projects (where applicable), state level information regarding emergency facility issues that cause schools to close, and state policies to assist school districts in addressing facilities issues, among other topics.
[66]During these visits, we used a data collection instrument to ask officials about school building systems and features that school personnel identified as particularly in need of repair or replacement, as well as new or upgraded systems. We photographed these as appropriate.
[67]We did not assess the feasibility of the ideas presented in state commission reports. Further, we did not determine whether states implemented policy or practice changes in response to these ideas or the impact of any policy or practice changes.