Report to Congressional Committees
United States Government Accountability Office
A report to congressional requesters
For more information, contact Michael E. Clements at ClementsM@gao.gov
What GAO Found
In response to the COVID-19 pandemic, the Board of Governors of the Federal Reserve System authorized 13 emergency lending programs—with lending facilities to implement the programs—to ensure the flow of credit across the economy. To improve oversight of these programs, the Federal Reserve evaluated program internal processes and controls and identified 20 opportunities to enhance internal controls. GAO found that Federal Reserve Banks, which manage the facilities, have implemented processes to address all 20 opportunities. In addition, the Federal Reserve has completed its review of all 20 opportunities. GAO also found that the Federal Reserve’s plans for ongoing monitoring of the facilities are generally aligned with federal internal control standards.
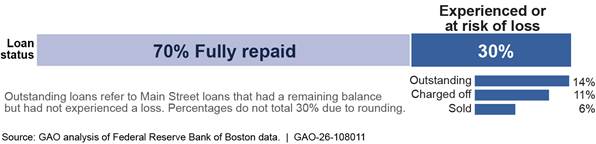
The five facilities under the Main Street Lending Program targeted small and midsize businesses and nonprofits. Of the 1,830 loans made through this program, 70 percent (1,277 loans) were fully repaid as of January 5, 2026, while 30 percent had experienced or were at risk of loss. Nearly 14 percent (251 loans) remained outstanding even though they should have closed by January 5, 2026. The other 16 percent resulted in losses to the program—$1.3 billion in charged-off loan amounts and $1.4 billion in authorized loan amounts sold back to their lenders at a net loss.
Loans to larger borrowers and those made by larger lenders had higher payoff rates and lower default rates. For example, loans to the largest businesses in the program (those with more than $42.1 million in revenue) had the highest percentage of repaid loans and the lowest percentage of impaired loans by number. Additionally, about 87 percent of loans made by the largest lenders (with revenue greater than $250 billion at program intake) were fully repaid, outperforming loans made by lenders of other sizes. Loan outcomes also varied by sector.
About 70 percent of borrowers with loans outstanding through their scheduled maturity date were unable to make the loan’s final balloon payment (remaining principal) on time, leaving nearly $2 billion in authorized loan amounts at risk of non-repayment. Elevated interest rates through the duration of the program and the timing of principal payment milestones generally were associated with a decreased likelihood of full loan repayment and increased likelihood of loan impairment. The Federal Reserve Bank of Boston has approved some loan modifications, and officials explained that they will continue to provide borrowers with the opportunity to modify their loans and make payments toward their remaining balance.
Why GAO Did This Study
As of January 2026, three of the Federal Reserve’s emergency lending facilities, all part of the Main Street Lending Program, continued to hold outstanding loans. As of that date, these facilities had approximately $672 million in outstanding loans. The three facilities were among the nine that received funds appropriated through the CARES Act (section 4003). The Federal Reserve plans to monitor and report on the status of the facilities until they no longer hold outstanding assets or loans.
The CARES Act includes a provision for GAO to annually report on section 4003 loans, loan guarantees, and investments. This report examines (1) the Federal Reserve’s oversight and monitoring of the CARES Act facilities and (2) the status and performance of Main Street Lending Program loans, including factors associated with losses.
GAO conducted loan-level analysis of Main Street Lending Program loan performance covering July 2020 through January 2026, reviewed Federal Reserve documentation, and interviewed Federal Reserve officials.
|
Abbreviations |
|
|
|
|
|
|
|
LIBOR |
London Interbank Offered Rate |
|
|
NAICS |
North American Industry Classification System |
|
|
RBOPS |
Division of Reserve Bank Operations and Payment Systems |
|
|
SOFR |
Secure Overnight Funding Rate |
|
This is a work of the U.S. government and is not subject to copyright protection in the United States. The published product may be reproduced and distributed in its entirety without further permission from GAO. However, because this work may contain copyrighted images or other material, permission from the copyright holder may be necessary if you wish to reproduce this material separately.
June 17, 2026
Congressional Committees
In response to the economic effects of the COVID-19 pandemic, the Board of Governors of the Federal Reserve System authorized 13 emergency lending programs in 2020, known as facilities. These facilities were intended to support the flow of credit to employers, consumers, small and midsize businesses, state and local governments, and nonprofit organizations.[1] Nine of the 13 facilities received funds appropriated by the CARES Act.[2]
The CARES Act facilities ceased purchasing assets or extending credit by January 8, 2021. Of the 13 facilities, only those under the Main Street Lending Program, which targeted small and midsize businesses and nonprofits, continue to hold outstanding assets and loans into 2026.[3] As of early January 2026, the program held $672 million in outstanding loan participations.[4] Main Street loans have a 5-year maturity. Accordingly, the earliest loans began to come due in July 2025, and all loans were scheduled to come due by January 2026 based on their origination dates.
Section 4026(f) of the CARES Act includes a provision for us to report annually on the loans, loan guarantees, and other investments provided under section 4003 of the CARES Act.[5] This report, the sixth in its series, examines (1) the Federal Reserve’s continued oversight and monitoring of the CARES Act facilities and (2) the status of Main Street loans and trends in loan performance, including factors associated with loss. In addition, appendix I describes the status of the Aviation and National Security Loan Program, which also used funds provided in section 4003.[6]
To address the first objective, we analyzed documentation from the Federal Reserve’s Division of Reserve Bank Operations and Payment Systems (RBOPS) covering December 2020 to December 2025. This included its procedures for CARES Act facilities, planning documents, and summaries of completed reviews. We also compared RBOPS’s monitoring plans against selected federal internal control standards.[7]
For the second objective, we conducted loan-level analysis of Main Street Lending Program data as of January 5, 2026, the most recent data available from the Federal Reserve Bank of Boston. In addition, we built multiple regression models to assess the characteristics of loans as their status changed—for example, when loans were fully repaid or became impaired (that is, became delinquent, were charged off, or were sold).
To assess the reliability of Main Street loan data, we reviewed documentation, including the data dictionary, and performed electronic testing on-site for outliers, missing data, and erroneous values. We also obtained information from Federal Reserve Bank of Boston officials about data collection methods and the nature of remaining loans. We determined the data were sufficiently reliable for describing the status, characteristics, and performance of Main Street loans. A more detailed description of our objectives, scope, and methodology can be found in appendix II.
To describe the status of the Aviation and National Security Loan Program, we reviewed reports by the Department of the Treasury on the program’s status. We also reviewed documentation on outstanding loans and plans for loans in default, as well as Treasury’s communication with borrowers during the program’s life cycle.
We conducted this performance audit from January 2025 to June 2026 in accordance with generally accepted government auditing standards. Those standards require that we plan and perform the audit to obtain sufficient, appropriate evidence to provide a reasonable basis for our findings and conclusions based on our audit objectives. We believe that the evidence obtained provides a reasonable basis for our findings and conclusions based on our audit objectives.
Background
The Federal Reserve System and Emergency Lending Authority
The Federal Reserve Act established the Federal Reserve System as the nation’s central bank.[8] The system consists of three parts: the Federal Reserve Board of Governors, Reserve Banks, and the Federal Open Market Committee.[9] The Federal Reserve Board is a federal agency located in Washington, D.C., that oversees the operations of the Reserve Banks and shares with them the responsibility for supervising and regulating certain financial institutions and activities. The Federal Reserve System is divided into 12 districts, each served by a regional Reserve Bank.
The Federal Reserve Board has the authority to authorize the Reserve Banks to extend credit more broadly than usual during emergencies.[10] Specifically, under section 13(3) of the Federal Reserve Act, during unusual and exigent circumstances, the Federal Reserve can authorize Reserve Banks to extend credit to a broader range of borrowers.[11]
Emergency Lending Facilities in Response to COVID-19
In response to the economic disruptions caused by the COVID-19 pandemic, the CARES Act authorized at least $454 billion for the Department of the Treasury to support the Federal Reserve in establishing facilities to provide liquidity to the financial system. With the Secretary of the Treasury’s approval, the Federal Reserve used its authority under section 13(3) to authorize nine facilities using funds appropriated by the CARES Act.[12] The Federal Reserve cited several factors in determining that unusual and exigent circumstances existed, including disruptions in financial markets, reduced credit availability, heightened demand for credit, and increased business expenditures.
In general, the CARES Act facilities were designed to support broad sectors of the economy, such as large corporations, small and midsize businesses, and state and local governments. Collectively, the CARES Act facilities could support up to $1.95 trillion in transaction volume, and Treasury disbursed $102.5 billion in CARES Act funds to support the facilities. Of this total, as of September 30, 2025, the Federal Reserve had returned about $100.5 billion to Treasury, leaving about $2 billion available to cover any potential losses the facilities incur. In accordance with the Consolidated Appropriations Act, 2021, all nine facilities stopped purchasing assets or extending credit by January 2021. In total, they conducted about $41 billion in transactions (see table 1).[13]
|
CARES Act–supported facilities |
Number of facilities |
Facility activity |
Termination date |
Transaction
amount |
|
Primary Market Corporate Credit Facility and Secondary Market Corporate Credit Facility |
2 |
Support large businesses by purchasing qualifying corporate bonds and other eligible assets |
Dec. 31, 2020 |
$14.3a |
|
Main Street Lending Program |
5b |
Support small and midsize for-profit businesses and nonprofit organizations by purchasing participations in eligible loans |
Jan. 8, 2021 |
$16.6c |
|
Municipal Liquidity Facility |
1 |
Support states, certain counties, municipalities, multistate entities, and revenue bond issuers by purchasing eligible notes that these entities issued |
Dec. 31, 2020 |
$6.4 |
|
Term Asset-Backed Securities Loan Facility |
1 |
Support consumers and businesses by providing nonrecourse loans to U.S. companies secured by qualifying asset-backed securities generally backed by recently originated consumer and business loans |
Dec. 31, 2020 |
$3.7 |
Source: GAO analysis of documents and data from the Board of Governors of the Federal Reserve System. | GAO‑26‑108011
aThe Primary Market Corporate Credit Facility did not conduct any transactions.
bThe Main Street Lending Program comprised five facilities: the Main Street New Loan Facility, Main Street Priority Loan Facility, Main Street Expanded Loan Facility, Nonprofit Organization New Loan Facility, and Nonprofit Organization Expanded Loan Facility.
cTransaction amount refers to the Federal Reserve’s participation in Main Street Lending Program loans, which is the purchase of 95 percent of lenders’ authorized loan amount to eligible borrowers. The Nonprofit Organization Expanded Loan Facility did not conduct any transactions.
For the facilities that received CARES Act funds, outstanding assets peaked between November 2020 and January 2021 (see fig. 1). As of the end of January 2026, three of the Main Street Lending Program facilities continued to hold assets.[14]
Figure 1: Outstanding Assets of Federal Reserve Lending Facilities Supported by CARES Act Funding, June 2020–January 2026
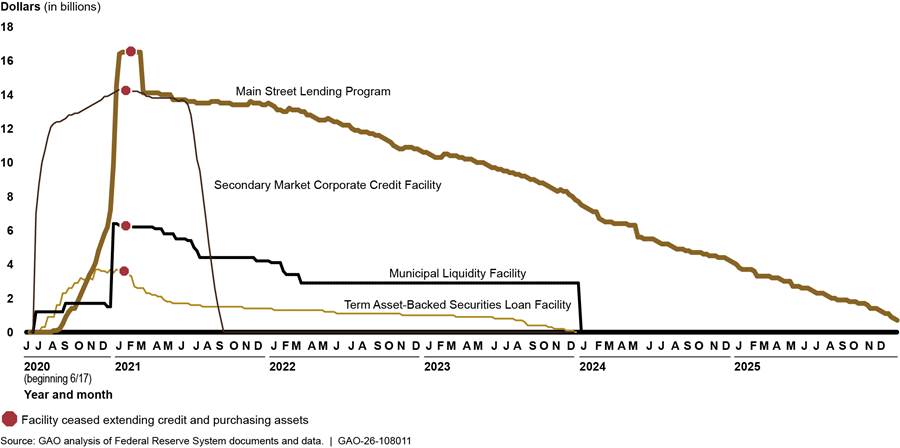
Note: Since Feb. 24, 2021, the Main Street Lending Program’s outstanding assets have been reported net of an allowance for credit losses, which is updated quarterly. The Main Street lending facilities purchased participation interests in newly eligible loans issued by eligible lenders to eligible small and midsize for-profit borrowers and nonprofit organizations.
Federal Reserve Oversight of the Facilities
The Federal Reserve Board’s Division of Reserve Bank Operations and Payment Systems (RBOPS), which oversees the policies and operations of the Reserve Banks, is primarily responsible for the oversight of the facilities. RBOPS’s oversight framework consists of three phases:
· Phase one. During its initial phase in 2020, RBOPS, through communication with Reserve Bank staff, focused on helping set up the facilities quickly.
· Phase two. As the facilities became operational, starting in May 2020, RBOPS reviewed the facilities’ governance structures, process workflows, and internal control design. These reviews were intended to help Reserve Banks identify early opportunities to enhance facility processes and controls (enhancement opportunities) to provide reasonable assurance that they were adequately designed to ensure effective operations. RBOPS completed phase two reviews for all facilities by December 2020.
· Phase three. The third phase consists of ongoing monitoring activities, including continued communication with Reserve Bank management and periodic reviews of facility operations and controls. These activities are intended to provide reasonable assurance that controls are in place and functioning to address identified risks. According to RBOPS documentation, phase three oversight activities will continue throughout the life of the facilities, until they no longer hold outstanding assets or loans.
As part of phase three, RBOPS prepares periodic oversight reports that summarize the scope of oversight activities and any enhancement opportunities related to facility processes and controls. As of April 2026, RBOPS had issued nine oversight reports to Reserve Bank management communicating the results of the phase three reviews, cumulatively covering December 2020 through December 2025.[15]
As we previously reported, RBOPS has a process for determining whether enhancement opportunities have been addressed.[16] RBOPS officials told us Reserve Bank staff notify RBOPS when they have completed steps to address an enhancement opportunity. RBOPS then analyzes the actions taken and determines whether the enhancement opportunity has been addressed. According to RBOPS officials, this analysis may include discussions with a Reserve Bank’s internal audit team and management, walk-throughs with Reserve Bank staff to understand new or updated processes, and reviews of documentation such as process flows and procedures.
All of the CARES Act facilities except those under the Main Street Lending Program had wound down all processes and terminated operations by February 2024.
Federal Reserve Oversight Continues, and Reserve Banks Have Implemented Previously Identified Enhancements
Federal Reserve Identified No New Opportunities to Enhance Processes and Controls
Since our last report on this topic in 2024, RBOPS continued to monitor facilities with outstanding loans and to review efforts to address a previously identified enhancement opportunity, as discussed below.[17] RBOPS’s most recent oversight report, issued in April 2026, identified no new opportunities to enhance facilities’ processes and controls. In addition, RBOPS communicated the results of its ongoing monitoring to facility management teams at relevant Reserve Banks and the Federal Reserve Board. RBOPS conducts ongoing follow-up and periodic reporting on the remaining Main Street facilities.
Consistent with our previous reporting, we found that RBOPS’s ongoing monitoring of the facilities generally aligned with federal internal control standards for monitoring of an entity’s internal control system.[18] According to the standards, management should establish and operate activities to monitor the internal control system and evaluate the results. This includes ongoing monitoring of the design and operating effectiveness of the internal control system as part of the normal course of operations. Further, management should remediate identified internal control deficiencies on a timely basis.
RBOPS Has Completed Its Review of Enhancement Actions
As previously reported, Reserve Banks have implemented processes to address all 20 enhancement opportunities identified by RBOPS.[19] RBOPS completed its review of 19 of the 20 enhancements prior to April 2026.
The remaining enhancement opportunity was related to the validation of one facility’s credit evaluation model and associated Reserve Bank policy. In April 2026, RBOPS reported that the Reserve Bank had taken steps to remediate the identified issue, and RBOPS closed the remaining enhancement opportunity.
Thirty Percent of Main Street Program Loans Either Have Experienced or May Be at Risk of Losses
The Main Street Lending Program was scheduled to end in January 2026, but as of that date, 14 percent of its 1,830 loans remained outstanding and at risk of loss.[20] In addition, 17 percent of the program’s loans had already incurred losses. In total, 30 percent of loans either had experienced or were at risk of losses. Our analysis found that loan outcomes were associated with certain borrower and lender characteristics, such as borrower size and lender assets, and were also associated with interest rate changes and the program’s payment structure. In addition, most Main Street borrowers with outstanding loans were unable to make their final payment.
As of January 2026, 17 Percent of Loans Had Experienced Losses and 14 Percent Were Outstanding and at Risk of Losses
|
Loan Sales in the Main Street Lending Program Loans made in the Main Street Lending Program could be sold back to lenders upon request, and sales were approved on a case-by-case basis. According to Federal Reserve Bank of Boston officials, the Reserve Bank initiated a formal buyback program in June 2025 for all lenders carrying outstanding loans prior to final payments coming due for the earliest borrowers. During the program, the Reserve Bank sold 92 loans back to lenders at a loss to the program. Officials said this action helped to minimize loan expenses and to limit any additional program losses from those loans. Between June 2025 and February 2026, an additional five loans were sold back to lenders. Source: GAO interviews of Federal Reserve Bank of Boston officials. | GAO‑26‑108011 |
As of early January 2026, about 70 percent of loans (1,277 loans), representing about $12 billion, had been repaid in full. The other 30 percent of loans (554) either had experienced or were at risk of being charged off. Specifically, about 17 percent of all loans had resulted in losses to the program, including charged-off loans (11 percent of all loans) and loans sold back to lenders at a net loss (6 percent of all loans). Charged-off loans represented about $1.3 billion in losses, and loan sales represented about $1.4 billion in authorized loan amounts. According to Federal Reserve officials, lenders paid, on average, about $0.50 for each dollar still outstanding for loans they bought back from the program.[21] The Main Street program anticipates additional loan sales, which could result in further program losses. Figure 2 shows the status of all Main Street loans as of early January 2026.
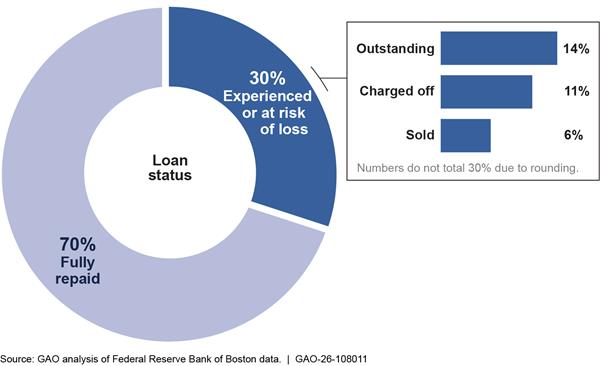
Note: Outstanding loans refer to Main Street loans that had a remaining balance but had not experienced a loss. While loans that have experienced a loss remain contractually outstanding, we do not consider them outstanding for the purposes of our analysis.
In early January 2026, 251 loans (about 14 percent of all loans) remained outstanding, representing about $2 billion in authorized loan amounts (or about 12 percent of the total amount authorized). According to Federal Reserve Bank of Boston officials, all outstanding loans that had not extended their maturity dates were technically in default. These loans are therefore at risk of generating additional losses to the program. Officials also stated that outstanding loans remain in default until (1) a modification agreement is executed or (2) a payment in full is made. In addition, an outstanding loan could be charged off, but it would remain in default. Because Main Street loans are recourse loans, borrowers remain responsible for repayment even if the loan is impaired (for example, delinquent or charged off).
Federal Reserve Bank of Boston officials told us they communicated with lenders throughout different program stages, particularly during key milestone dates and when loans missed payments. In addition, lenders are able to submit Core Rights requests, which are requests for loan modifications or waivers. Officials said approved modifications generally have been either short-term maturity extensions or forbearance agreements, both of which provide borrowers additional time to make their final payments. Some modifications have included the release of borrower collateral in support of recovery prospects. Federal Reserve Bank of Boston officials said they will continue to provide borrowers opportunities to modify their loans and make payments toward their remaining balances.
Loan Outcomes Varied by Borrower Size, Lender Assets, Geography, and Business Sector
According to our analysis of Main Street loan repayment data through early January 2026, loan outcomes varied across borrower and lender size, geographic region, and business sector.
Business Size
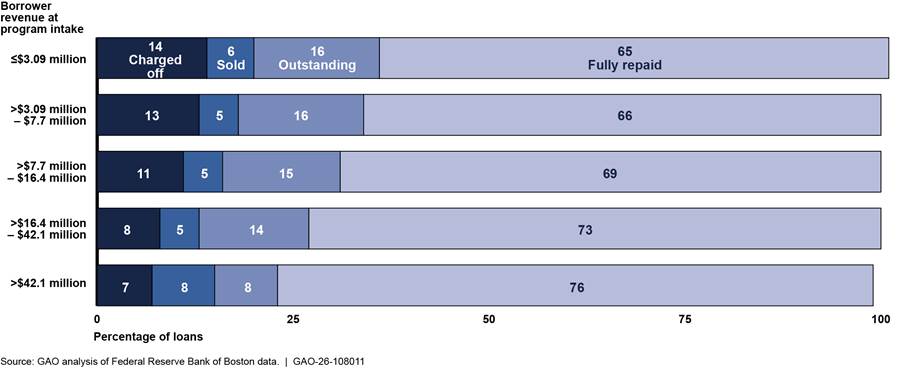
Loans to businesses of different sizes experienced different rates of repayment and charge-off. For example, loans to the largest businesses (those with more than $42.1 million in revenue) had the highest rates of repayment and the lowest charge-off rates. These loans were also slightly more likely to be sold back to their lenders. In contrast, loans to the smallest businesses (those with $3.09 million or less in revenue) experienced the lowest rates of full repayment and the highest charge-off rates (see fig. 3).
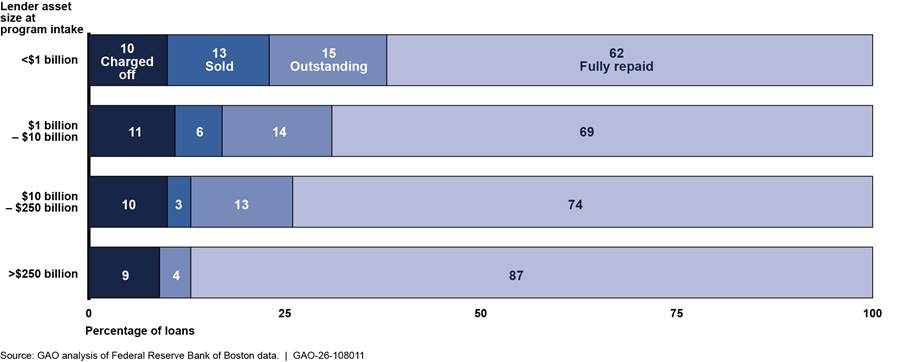
Lender Size
Lenders that made loans to businesses participating in the Main Street program varied widely in asset size, ranging from less than $100 million to greater than $1 trillion. Over 70 percent of Main Street loans were made by lenders with assets between $1 billion and $250 billion (see table 2).
|
Lender asset size at intake |
Percentage of loans madea |
|
Less than $1 billion |
24% |
|
$1 billion to $10 billion |
32% |
|
>$10 billion to $250 billion |
40% |
|
>$250 billion |
3% |
|
Assets unavailable at application |
1% |
Source: GAO analysis of Federal Reserve Bank of Boston data. | GAO‑26‑108011
aPercentages do not sum to 100 due to rounding.
Lenders with the largest asset sizes (greater than $250 billion at intake) experienced the highest repayment rates (about 87 percent), although these loans represented the smallest share of loans made across lender-size categories. In contrast, the smallest lenders (less than $1 billion in assets at intake) experienced the lowest borrower repayment rates. Lenders with the largest asset sizes also experienced the lowest charge-off rates, although charge-off rates varied minimally across all size categories (see fig. 4).
Geographic Region
Payoff rates varied across geographic regions. For example, three census divisions—East South Central, Mountain, and East North Central—had repayment rates ranging from about 79 to about 82 percent.[22] In contrast, the West North Central division, which includes Iowa, Kansas, Minnesota, Missouri, Nebraska, North Dakota, and South Dakota, had a repayment rate of about 62 percent, with nearly one-quarter of loans still outstanding (see fig. 5).
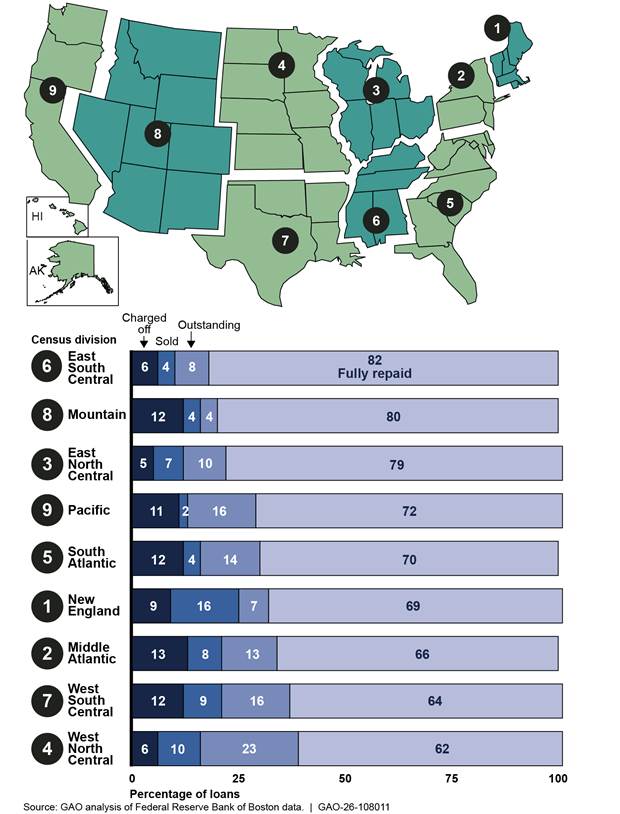
Note: Percentages may not add to 100 due to rounding.
Business Sector
Businesses in the information sector had a higher loan repayment rate (about 84 percent) than businesses in other sectors. In contrast, businesses in the sectors with the lowest payoff rates—financial activities (64 percent) and natural resources and mining (60 percent)—had higher charge-off rates than most other sectors (see fig. 6).
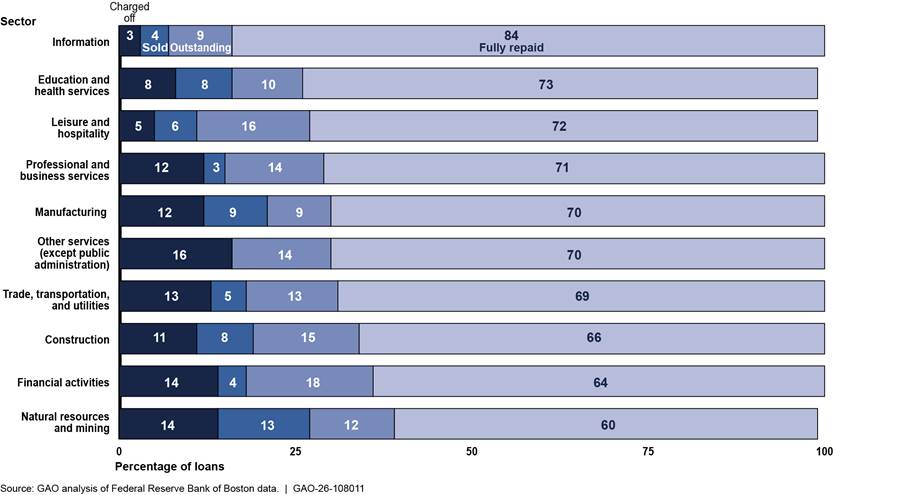
Note: Percentages may not add to 100 due to rounding.
Changing Interest Rates and Required Payments May Have Influenced Loan Outcomes Prior to the End of the Program
Of all Main Street loans, 83 percent either were fully repaid or became impaired before they were expected to mature.[23] To understand factors associated with loan outcomes prior to maturity, we constructed a sequence of multiple regression models using Main Street Lending Program loan data from program inception to early January 2026.[24] Two factors we looked at were (1) interest rate changes and (2) payment milestones.[25]
Changing Interest Rates
Significant increases in interest rates over the life cycle of the program were associated with a greater likelihood of impairment and a lower likelihood of full repayment.[26] When borrowers obtained loans through the program from July 2020 through January 2021, the benchmark rate was close to zero.[27] Thus, initial interest rates were expected to be around 3 percent. From mid-2021 through early 2022, loans had a median interest rate of about 3.1 percent, in line with general expectations.
However, between July 2021, when the earliest interest payments began, and December 2023, when rates peaked, the median interest rate for Main Street loans almost tripled, increasing to about 8.5 percent, in line with benchmark rate increases.[28] Rates subsequently declined and stood at about 6.9 percent as of early January 2026.
Higher interest rates were associated with an increased likelihood of impairment and a decreased likelihood of full repayment. Model results indicate that for every percentage point increase in interest rates, loans had about a 17 percent decreased likelihood of being fully repaid relative to being active in a given month and an 18 percent increased risk of becoming impaired relative to being active.[29]
Payment Milestones
During the 5-year program, Main Street borrowers made interest and principal payments at different stages, with all payments deferred for the first year. Generally, borrowers began making interest payments 1 year after a loan’s inception and principal payments 3 years after inception. Interest payments began in July 2021 for the earliest loans and in January 2022 for the last loans. Two principal payments were due before the end of the program:
1. The first 15 percent of principal came due in the third year of the program (starting in June 2023).
2. Another 15 percent of principal came due in the fourth year of the program (starting in June 2024).
The likelihood of repayment differed as the loan program progressed. At the time of first principal payment, the likelihood of repayment relative to staying active dropped 58 percent relative to when interest payments began. At the time of the second principal payment, the likelihood of full repayment dropped 44 percent relative to the baseline after the first payment.
In contrast, the likelihood of a loan becoming impaired generally grew over time. In addition to a month-over-month increase in the risk of becoming impaired, the risk of loans becoming impaired increased by 111 percent once interest payments came due. While we did not identify a statistically significant increase in impairment risk after the first principal payment came due, the risk of impairment increased by an additional 58 percent after the second principal payment, through the 59th month of the repayment period.
Figure 7 illustrates transitions to repayment or impairment through the 59th month of participation in the Main Street program. As demonstrated in the figure, repayment, at all milestones, and impairment, at principal payment milestones, were higher in the months when borrowers reach payment milestones compared with the month before. However, the impairment generally increased over time, whereas full repayments showed little visible trend. Notably, impairments increased sharply at month 54, while full repayments did not. This reflects 77 loans that were sold back to their lenders in that month of participation.
Figure 7: Transitions to Full Repayment and Impairment for Main Street Program Loans, Months 1–59 (July 2020–Dec. 2025)
Bars show the number of loans transitioning to full repayment or impairment in each month of participation.
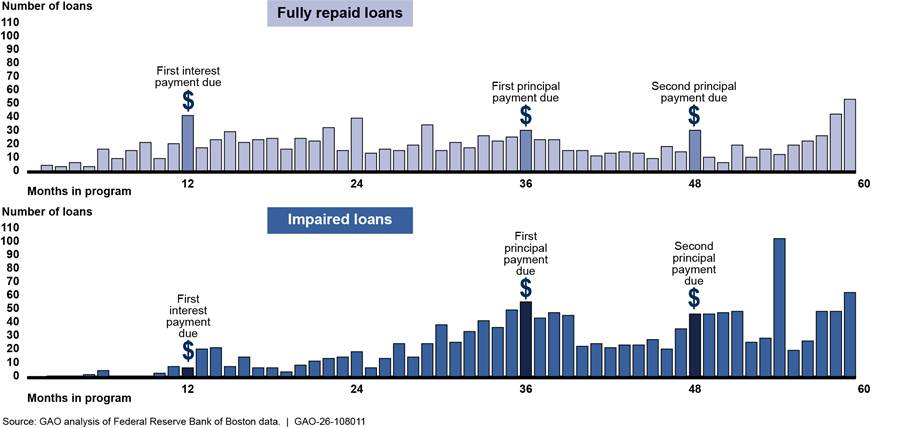
Note: Since Main Street loans originated over a 6-month period from July 2020 to January 2021, loans reached 59 months of participation at different calendar dates in 2025. An impaired loan (1) is 30 or more days delinquent on any payment, (2) has experienced a charge-off, (3) was sold back to its lender, or (4) continues to be outstanding in the program after 60 months, which is when the final principal payment was due for borrowers.
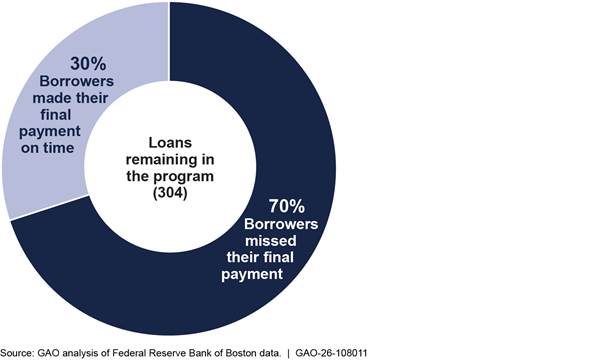
Most Main Street Borrowers with Outstanding Loans Were Unable to Make Their Final Balloon Payment
For Main Street loans that remained active through their scheduled maturity date, most borrowers were unable to make the program’s final balloon payment. Over 300 loans were active 1 month prior to their scheduled maturity dates, which varied because loans originated over a 6-month period (from July 2020 through January 2021). However, once final balloon payments were due in the 60th month, about 70 percent of those borrowers were unable to make their final payment (see fig. 8). The size of the final payment may have contributed to financial stress for borrowers that remained in the program. In addition, Federal Reserve officials said many borrowers with access to traditional credit sources may have refinanced and exited the program before their loan’s maturity date. As a result, borrowers that remained in the program likely had weaker credit profiles and a greater risk of not repaying their loans in full.
Figure 8: Share of Main Street Program Loans Making Final Balloon Payments on Time for Loans Outstanding in the 59th Month
Agency Comments
We provided a draft of this report to the Federal Reserve and Treasury for their review and comment. The Federal Reserve and Treasury provided technical comments, which we incorporated as appropriate.
We are sending copies of this report to the appropriate congressional committees, the Chair of the Board of Governors of the Federal Reserve System, and the Secretary of the Treasury. This report will also be available at no charge on GAO’s website at https://www.gao.gov. If you or your staff have any questions about this report, please contact me at clementsm@gao.gov. Contact points for our Offices of Congressional Relations and Media Relations may be found on the last page of this report. GAO staff who made key contributions to this report are listed in appendix IV.

Michael E. Clements
Director, Financial Markets and Community Investment
List of Committees
The Honorable Susan Collins
Chair
The Honorable Patty Murray
Vice Chair
Committee on Appropriations
United States Senate
The Honorable Tim Scott
Chairman
The Honorable Elizabeth Warren
Ranking Member
Committee on Banking, Housing, and Urban Affairs
United States Senate
The Honorable Lindsey Graham
Chairman
The Honorable Jeff Merkley
Ranking Member
Committee on the Budget
United States Senate
The Honorable Ted Cruz
Chairman
The Honorable Maria Cantwell
Ranking Member
Committee on Commerce, Science, and Transportation
United States Senate
The Honorable James Lankford
Chairman
The Honorable John Fetterman
Ranking Member
Subcommittee on Border Management, Federal Workforce and Regulatory Affairs
Committee on Homeland Security and Governmental Affairs
United States Senate
The Honorable Tom Cole
Chairman
The Honorable Rosa DeLauro
Ranking Member
Committee on Appropriations
House of Representatives
The Honorable Jodey Arrington
Chairman
The Honorable Brendan Boyle
Ranking Member
Committee on the Budget
House of Representatives
The Honorable French Hill
Chairman
The Honorable Maxine Waters
Ranking Member
Committee on Financial Services
House of Representatives
The Honorable Sam Graves
Chairman
The Honorable Rick Larsen
Ranking Member
Committee on Transportation and Infrastructure
House of Representatives
Background
The CARES Act authorized the Department of the Treasury to provide up to $46 billion in loans and loan guarantees to certain aviation businesses and other businesses deemed critical to maintaining national security (national security businesses).[30] The specific businesses eligible for loans were
· passenger air carriers;
· businesses certified to perform inspection, repair, replace, or overhaul services (repair station operators);
· ticket agents;
· cargo air carriers; and
· national security businesses.
The CARES Act set out specific terms and conditions for the loans but also gave Treasury substantial discretion to design and implement certain aspects of the program.[31] For example, when making a loan to a publicly traded company, Treasury was required to obtain a warrant (an option to buy stock shares at a predetermined price before a specified date) or an equity interest (ownership in a company).[32] Treasury had authority to set other terms and conditions to protect the government’s financial interest. For example, Treasury generally required that the loans be secured with collateral, such as aircraft or equipment. However, Treasury also offered unsecured loans for $20 million or less.
In summer and fall 2020, Treasury executed 35 loan agreements that authorized up to $21.9 billion in loans to businesses in these targeted sectors. Each executed loan had a duration of 5 years or less, with most loans maturing in October or November 2025. Borrowers were required to make interest payments throughout the life of the loan, and principal was due at maturity.[33]
Treasury Has Collected More in Principal and Interest Payments Than It Disbursed
As of April 2026, Treasury has collected more in principal and interest payments than the nearly $2.7 billion it disbursed (see table 3). Across all borrowers, those that fully repaid their loans paid Treasury, overall, more than was disbursed for the loan program. This reflects payment-in-kind interest, which is added to the outstanding loan amount, and cash interest receipts, which are paid on a schedule set by loan terms.
Dollars in thousands
|
Type of borrower |
Number of loans executed |
Assistance authorized |
Assistance disbursed |
Total |
Total |
Total |
|
|
Cargo air carrier |
2 |
$2,112 |
$2,112 |
$362 |
$58 |
$3,339 |
|
|
Passenger air carrier |
15 |
$21,113,400 |
$1,900,400 |
$1,893,555 |
$78,899 |
$15,508 |
|
|
Repair station operator |
5 |
$18,988 |
$18,988 |
$6,352 |
$3,182 |
$20,929 |
|
|
Ticket agent |
2 |
$20,550 |
$20,550 |
$20,530 |
$313 |
$424 |
|
|
National security business |
11 |
$735,934 |
$735,934 |
$762,437 |
$121,794 |
$21,484 |
|
|
Total |
35 |
$21,890,984 |
$2,677,984 |
$2,683,235 |
$204,246 |
$61,684 |
|
Source: GAO analysis of the Department of the Treasury monthly loan program reports. | GAO‑26‑108011
Notes: Totals may not sum due to rounding. Outstanding
loan balances include all loan disbursements and increases of loan principal
amount arising from payment-in-kind interest and accrued unpaid interest, less
any repayments of principal. Because payment-in-kind interest is added to
principal, total principal repaid may exceed total assistance disbursed.
As of April 2026, 22 of the 35 loans have been fully repaid with interest, including the largest loan disbursed, $700 million to Yellow Corporation.[34] Of the remaining loans, 11 had outstanding balances, and two were closed without Treasury receiving the full amount owed.[35]
Large passenger air carriers—the borrowers with the largest authorized loan amounts—did not draw on the full amount of their loans.[36] As such, there was about a $19 billion difference between the authorized loan amounts and actual disbursements. According to Treasury officials, the purpose of the program was to provide liquidity to the targeted sectors, and they view it as a success.
Treasury Expects Nominal Losses for the Loan Program
As of April 2026, Treasury officials said they expect nominal losses of about $46 million for the aviation and national security loan program. Treasury officials said they expected that some loans would not be fully repaid.[37] For example, one borrower has declared bankruptcy, and Treasury does not expect to recover the full amount of that loan.[38]
Treasury has taken actions to increase the likelihood of repayment for loans with outstanding balances. It has accelerated eight loans due to missed interest payments or failure to repay the loan at maturity, allowing Treasury to demand full repayment. It also extended maturity dates for five loans to provide those borrowers more time to pursue options such as alternative financing; one of those loans was subsequently repaid in full. The CARES Act does not allow Treasury to extend maturity dates beyond 5 years from the initial origination date for borrowers that are passenger air carriers, so only national security companies were eligible for an extension.[39]
As of April 2026, Treasury continues to work with borrowers to collect outstanding balances. Treasury officials said they are working, in consultation with the Department of Justice, with some borrowers to develop repayment plans or other compromise settlements for the outstanding loans. Treasury may also refer outstanding loans to Treasury’s Bureau of Fiscal Service for collection activities.[40]
Outcomes from Treasury Exercising Taxpayer Protections
Treasury obtained warrants from nine companies—all passenger air carriers—related to loans made under the program. In June 2024, Treasury auctioned warrants to purchase the stock for seven of these publicly traded passenger air carriers.[41] The auction generated about $556.7 million in revenue. Treasury auctioned these warrants to recover value for taxpayers, after the federal government provided assistance to the aviation industry during the pandemic to protect jobs and help maintain services. According to Treasury officials, after the auction concluded, Treasury held warrants issued by two passenger air carriers that received loans. One air carrier’s warrants expired in October and November 2025, and Treasury exercised all the warrants issued by the other air carrier between May 2025 and February 2026, for which Treasury received a total of $6.3 million.[42]
For one loan, to Yellow Corporation, Treasury received equity interests. When the loan was executed in July 2020, Treasury received a 29.6 percent equity interest in the business. Yellow Corporation filed for bankruptcy in August 2023, and the company’s bankruptcy estate fully repaid the loan. The bankruptcy case has not concluded, but Treasury officials said they do not expect to receive any funds related to the equity stake.
For the sixth report in our series, our objectives were to examine (1) the Board of Governors of the Federal Reserve System’s continued oversight and monitoring of the CARES Act facilities and (2) the status of Main Street loans and trends in loan performance, including factors associated with loss. In addition, we reviewed the status of the Aviation and National Security Loan Program.
To address the first objective, we analyzed documentation from the Federal Reserve’s Division of Reserve Bank Operations and Payment Systems (RBOPS), including policies and procedures for ongoing monitoring and controls of the CARES Act facilities covering December 2020 to December 2025. We reviewed planning documents and summaries of completed reviews of the facilities covering the same period. We also obtained written responses from Federal Reserve officials on RBOPS’s framework and approach for ongoing monitoring of the facilities and results of RBOPS’s oversight reviews.
We compared RBOPS’s monitoring plans against selected federal internal control standards, including the principles that management should establish and operate activities to monitor the internal control system and evaluate the results, and that management should remediate identified internal control deficiencies on a timely basis.[43]
To address the second objective, we reviewed Main Street Lending Program loan-level data on-site at the Federal Reserve Bank of Boston. To evaluate the status, characteristics, and trends of Main Street loans, we obtained information from two data sources: (1) a Reserve Bank compendium of borrower information collected during the lender registration and participation review processes and (2) Main Street accounting records generated by a third-party contractor. The compendium included borrower information at loan origination and borrower-reported payment information. The accounting records included information on loan positions, loan transactions from inception, and loan delinquencies.
We tested and analyzed the participation data and loan-level payment data on Main Street loans from the program’s July 2020 inception through January 5, 2026 (the most recent data available at the time of our analysis) to (1) understand loan performance and (2) conduct econometric analysis to estimate the propensity for Main Street loans to be repaid or become impaired, as well as the scale of losses, based on a variety of loan and borrower characteristics.[44] To understand loan performance, we used loan-level data to determine (1) the number and dollar amount of outstanding, fully repaid, sold, and charged-off loans and (2) the distribution of loans by loan status based on borrower business size and lender asset size.[45]
Additionally, we analyzed geographic and sectoral information for loans within each status. For our geographic analyses, we matched loan payment information as of January 2026 to borrower geographic identifiers collected at intake. To maintain confidentiality, we aggregated geographic data at the census-division level. We reported the share of fully repaid, outstanding, sold, and charged-off loans for each census division.
For our sectoral analyses, we matched loan payment information to North American Industry Classification System (NAICS) codes collected from borrowers at loan intake. To maintain confidentiality, we aggregated these codes into sectors defined by the Bureau of Labor Statistics. We reported the share of fully repaid, outstanding, sold, and charged-off loans for each sector.[46]
Additionally, we obtained written responses from Federal Reserve officials about the outcomes of the Main Street program, including (1) loan performance based on the program’s design and (2) the specifications of a lender buyback program established in June 2025, which resulted in 92 loans being sold back to their lenders. We also obtained officials’ written responses regarding the nature of loans that remained outstanding as of January 5, 2026, and any updates on those loans as of February 27, 2026.
We assessed the reliability of the Main Street data we used by reviewing agency documentation, including a data dictionary, and conducting electronic testing for outliers, missing data, and erroneous values. We also interviewed Federal Reserve Bank of Boston staff regarding the interpretation and reliability of various data fields and how the data are collected, stored, and maintained. We determined the data were sufficiently reliable for describing selected characteristics of Main Street loans and their payment performance.
To describe the status of the Aviation and National Security Loan Program, we analyzed information on loans made under Section 4003 of the CARES Act, which created and appropriated funds for the program. This included reviewing Department of the Treasury reports to determine
· the number of repaid and outstanding loans;
· total loan amounts approved, disbursed, repaid, and outstanding; and
· the number of loans in default and the reasons for default.
We interviewed Treasury officials and reviewed agency documentation to describe estimated program losses and Treasury’s communication with borrowers on required interest payments, loan maturity, and repayment. This discussion included any plans for working with borrowers that did not fully repay their loans upon maturity, including plans to recover unpaid loan amounts.
We conducted this performance audit from January 2025 to June 2026 in accordance with generally accepted government auditing standards. Those standards require that we plan and perform the audit to obtain sufficient, appropriate evidence to provide a reasonable basis for our findings and conclusions based on our audit objectives. We believe that the evidence obtained provides a reasonable basis for our findings and conclusions based on our audit objectives.
The Main Street Lending Program was designed with a 60-month loan term to provide funding to small and midsize businesses and nonprofit organizations to help support the flow of credit during the COVID-19 pandemic. Most borrowers (about 83 percent) exited current status in the program before maturity, either by fully repaying their loans or through impairment (delinquency, charge-off, or sale at a loss). Of the about 17 percent of loans that remained current up to the final balloon payment, which represented 70 percent of the loan’s principal, less than one-third of borrowers made that payment on time. As of January 5, 2026, loans that did not make the final payment remained outstanding and delinquent.
Because we did not have the final disposition for a significant share of loans that reached the 60th month at the time of our analysis, we chose not to model the outcomes for loans that reached maturity. In addition, the nature of delinquencies for loans that missed the final balloon payment may become clearer after our analysis cutoff date of January 5, 2026. Despite this limitation, we modeled the 83 percent of loans that exited the program early, identifying attributes of the loan program, interest-rate environment, and borrower and lender characteristics associated with early payoff or impairment.
Methodology
A standard approach to modeling risks of event occurrences, such as loan payoffs or impairments, is to use a discrete-time competing risk model. This model type assesses the contribution of included variables to the risk of “transition” from one status to another, conditional on loans being in the “baseline” state—that is, current and active. Our models identified the extent to which (1) payment milestones and (2) loan interest rates provided predictive information about the risks of loan impairment or payoff. The models were not designed to identify the causes of loan impairment or early payoff.
We limited the model to loans that exited current status in the Main Street Lending Program prior to 60 months of participation, when loans matured. The program required loans to exit in the 60th month and be classified as either paid off or impaired, creating a different process for causing exits that is distinct from the early exits. Therefore, our model used all loans that were current in each month through month 58 and estimated their probability of transitioning to a different status in the following month. We excluded the transition from month 59 to 60.
Our data include all loans that participated in the Main Street Lending Program. While the final disposition of many loans was still unknown as of January 5, 2026 (the most recently available data), we have complete coverage of loans in current status. Our data include the status of all loans through either (1) their exit from the program or (2) the first 59 months, for loans that remained in the program through all payment milestones. Our data therefore represent a census of all loans in current status, and we know in which month all loans were fully repaid or charged off except for loans that remained in the program through the 60th month.
Outcome Variables
Variables in the analysis are for a loan during a particular month. The universe of loan-months included as independent variables in the model consists of loan-months where a loan is in current, unimpaired status. The dependent variable is the status of the loan in the next month. Because loans could exit the Main Street Lending Program through either impairment or payoff, we used multinomial logit regression models to simultaneously review the risk of both types of transition away from current status. The three possible statuses are defined below.
Current. Current loans are those continuing in the program, meeting their contractual obligations in each month.
Paid off. Paid-off loans are those for which borrowers have paid off the full principal loan amount and any accrued interest and have exited the program. Borrowers may retire the liability from their books through raised funds or refinance the loan in credit markets.[47]
Impaired. Impaired loans include loans that fall within one of four categories: (1) 30 or more days delinquent on either an interest or principal payment; (2) charged off; (3) sold back to lenders at a loss to the program; or (4) having an outstanding balance after 60 months—that is, after the loan should have matured. Technically, delinquent loans are still active in the program. To avoid delinquency being an overwhelming predictor of exit, we timed the transition point as the first instance of a loan becoming 30 or more days delinquent, rather than when it was charged off.
Some loans did not pass through delinquency and instead were charged off immediately after their last month in active status. These loans therefore exited our sample in the month they were charged off. Additionally, some loans were sold back to their lenders at a net loss to the program. We coded these loan sales as impaired as of the date of the sale (unless they had previously been delinquent, in which case they would have already exited the sample).
Time-Varying Independent Variables
The primary independent variables we investigate are the time-varying variables related to interest rates and loan program milestones.
Time in program. We control for the passage of time with a time-in-program variable that is a count of the months elapsed since the borrower entered the program. We include this variable in every model specification. Since we would expect loans to exit current status at an increasing rate over time, as borrowers either repay the loan or fall behind on obligations, we would expect that the likelihood of both types of exit would grow over time.
Interest rate. Because the program has a variable interest rate that is generally reset monthly, rates have varied widely over time. For loans that were current, inter-borrower variation reflected the timing of loan issuance and the benchmark rate used.[48] Variation in interest rates did exist between borrowers in relation to the programmatic control variables, such as when interest payments were first required. This variation arises because loans were issued over a 6-month period and the interest rates track calendar time, whereas other variables are set relative to the time in the program. We expected that as interest rates went up, the propensity of loans to become impaired would increase. It is less clear what impact higher interest rates would have on the rate of payoffs, as borrowers may have faced additional challenges refinancing in an environment with increasing interest rates and high inflation but also faced increased incentives to pay off their loans to limit interest rate costs.
Programmatic indicators. We used three indicator variables that capture key program milestones. Each indicator is set to zero at the start of the loan and switches to 1 in the month prior to the milestone, remaining at 1 thereafter. We used this lead structure because the outcome variable (next status) is also a lead variable. In general, we would expect the likelihood of impairment to increase at each milestone. It is less clear what impact milestones would have on the probability of paying off the loan in full. The programmatic milestones are as follows:
· Interest payments begin. This indicator switches to 1 in the 12th month of the loan to indicate that the first interest payment was due in the next month and remains 1 through the life of the loan.
· First principal payment due. This indicator switches to 1 in the 35th month of the loan to indicate that the first principal payment (15 percent) was due and remains 1 through the life of the loan.
· Second principal payment due. This indicator switches to 1 in the 47th month of the loan to indicate that the second principal payment (15 percent) was due and remains 1 through the life of the loan.
We tested the association of loan status in the next month with interest rates controlling for time elapsed and the programmatic indicators controlling for time elapsed. We also tested the association of loan status in the next month with interest rates and programmatic indicators when interest rates, programmatic indicators, and time elapsed were included as independent variables in the regression.
Time-Invariant Borrower and Lender Characteristics
We augmented our core models with additional tests of the associations between borrower and lender characteristics and the likelihood of early exit from the program. In addition to the time-varying controls in our core models, we added the following:
Borrower revenue. We used revenue as of 2019, in millions of dollars. Since larger businesses often have access to more alternative sources of credit, we expected borrowers with higher revenue to be more likely to repay earlier.
Lender assets. We included indicator variables for the two smallest (less than $1 billion and $1 billion to $10 billion) and the largest (greater than $250 billion) groups of lenders.[49] If lenders of different sizes had different underwriting strategies, loan outcomes could vary accordingly, particularly given that loans were made under unusual circumstances.
Census division. We included indicator variables for the census division of the borrower’s headquarters. While geography does not directly affect ability to pay, regional differences in COVID-19-related disruptions and other economic dynamics may have affected business recovery timelines. We used census division 5 (Delaware, the District of Columbia, Florida, Georgia, Maryland, North Carolina, South Carolina, Virginia, and West Virginia) as the reference category because it issued the most loans.
Sector. We included indicator variables for six economic sectors. Three sectors had the highest repayment rates as of January 5, 2026: (1) education and health services, (2) information, and (3) leisure and hospitality. The other three sectors had the lowest repayment rates: (4) construction, (5) financial activities, and (6) natural resources and mining. Loans in all other sectors constituted the reference category.
We ran models with all of our time-varying characteristics and the amount of lender assets and borrower revenue as our expanded base model. We then tested the inclusion of census divisions and sectors separately and together along with the expanded base model.
Results
Our core model results suggest that both program design and interest-rate environment generally were associated with the propensity of borrowers to either pay off their loan or become impaired in a given month (see table 4 for full results). Coefficient estimates remain quite stable across the model specifications, with one exception. The coefficient for the second principal payment coming due switches directional effect in both outcomes when the interest rate is included alongside the programmatic indicators, and the impairment coefficient becomes statistically significant in Model 3.
Interest rates began to fall in the last two calendar years of the program, which provides more opportunity to differentiate the association of the programmatic indicators from the association of the interest rate with outcomes.
|
Next status |
|
|
Model 1 |
Model 2 |
Model 3 |
|
|
|
|
Relative risk ratios |
||
|
Repayment |
|
Intercept |
0.01*** |
0.01*** |
0.01*** |
|
|
|
(0.10) |
(0.09) |
(0.11) |
|
|
|
Time in the program |
1.04*** |
1.04*** |
1.08*** |
|
|
|
|
(0.00) |
(0.01) |
(0.01) |
|
|
|
Interest rate |
0.93*** |
— |
0.83*** |
|
|
|
|
(0.02) |
|
(0.04) |
|
|
|
Interest payments come due |
— |
1.08 |
0.98 |
|
|
|
|
|
(0.14) |
(0.13) |
|
|
|
First principal payment due |
— |
0.58*** |
0.42*** |
|
|
|
|
|
(0.13) |
(0.15) |
|
|
|
Second principal payment due |
— |
1.27* |
0.66* |
|
|
|
|
|
(0.12) |
(0.17) |
|
|
Impairment |
|
Intercept |
0.00*** |
0.00*** |
0.00*** |
|
|
|
|
(0.14) |
(0.22) |
(0.22) |
|
|
|
Time in the program |
1.06*** |
1.07*** |
1.04*** |
|
|
|
(0.00) |
(0.01) |
(0.01) |
|
|
|
Interest rate |
1.16*** |
— |
1.18*** |
|
|
|
|
(0.02) |
|
(0.02) |
|
|
|
Interest payments begin |
— |
2.35** |
2.11*** |
|
|
|
|
|
(0.26) |
(0.27) |
|
|
|
First principal payment due |
— |
0.80 |
0.93 |
|
|
|
|
|
(0.16) |
(0.15) |
|
|
|
Second principal payment due |
— |
0.97 |
1.58** |
|
|
|
|
|
(0.13) |
(0.14) |
|
|
|
Akaike Information Criteria |
19,178.56 |
19,212.28 |
19,126.72 |
|
|
|
Bayesian Information Criteria |
19,233.43 |
19,303.71 |
19,236.44 |
|
|
|
Number of observations |
69,130 |
69,130 |
69,130 |
|
* = statistically significant at the 5 percent level; ** = statistically significant at the 1 percent level; *** = statistically significant at the 0.1 percent level; — = not applicable.
Source: GAO analysis of Federal Reserve Bank of Boston data. | GAO‑26‑108011
Note: Bolded coefficients are statistically significant at
the  = 0.05 level or less.
Significance tests compare the coefficient to 1. Standard errors are included
in parentheses under each reported coefficient.
= 0.05 level or less.
Significance tests compare the coefficient to 1. Standard errors are included
in parentheses under each reported coefficient.
We selected Model 3 as our preferred model for subsequent exploration of borrower and lender characteristics. When adding borrower and lender characteristics, the coefficients estimated remained stable across models (see table 5). Accordingly, we selected Model 7, which includes all borrower and lender characteristics, as our preferred expanded model.
Table 5: Results of Additional Main Street Loan Performance Models with Borrower and Lender Characteristics, as of Jan. 5, 2026
|
Next status |
Coefficients |
Model 4 |
Model 5 |
Model 6 |
Model 7 |
||
|
|
|
Relative risk ratios |
|
||||
|
Repayment |
Intercept |
0.01*** |
0.01*** |
0.01*** |
0.01*** |
|
|
|
|
(0.11) |
(0.12) |
(0.12) |
(0.12) |
|
||
|
|
Time in the program |
1.08*** |
1.09*** |
1.08*** |
1.09*** |
|
|
|
|
|
(0.01) |
(0.01) |
(0.01) |
(0.01) |
|
|
|
|
Interest rate |
0.83*** |
0.84*** |
0.84*** |
0.83*** |
|
|
|
|
|
(0.04) |
(0.04) |
(0.04) |
(0.04) |
|
|
|
|
Interest payments begin |
0.99 |
0.97 |
0.98 |
0.99 |
|
|
|
|
(0.13) |
(0.13) |
(0.13) |
(0.13) |
|
||
|
|
First principal payment due |
0.43*** |
0.44*** |
0.43*** |
0.43*** |
|
|
|
|
|
(0.15) |
(0.15) |
(0.15) |
(0.15) |
|
|
|
|
Second principal payment due |
0.66* |
0.64** |
0.66* |
0.66* |
|
|
|
|
|
(0.17) |
(0.17) |
(0.17) |
(0.17) |
|
|
|
|
Revenue (millions) |
1.00** |
1.00* |
1.00** |
1.00* |
|
|
|
|
(0.00) |
(0.00) |
(0.00) |
(0.00) |
|
||
|
|
Lenders (< $1 billion) |
0.73*** |
0.70*** |
0.73*** |
0.68*** |
|
|
|
|
(0.08) |
(0.09) |
(0.08) |
(0.09) |
|
||
|
|
Lenders ($1–10 billion) |
0.86* |
0.83* |
0.85* |
0.82** |
|
|
|
|
(0.07) |
(0.08) |
(0.07) |
(0.08) |
|
||
|
|
Lenders ($10–250 billion) (reference category) |
— |
— |
— |
— |
|
|
|
|
Lenders (>$250 billion) |
2.02*** |
1.91*** |
2.00*** |
1.92*** |
|
|
|
|
(0.18) |
(0.18) |
(0.18) |
(0.18) |
|
||
|
|
Census division 1 |
— |
1.36 |
— |
1.34 |
|
|
|
|
(0.17) |
(0.17) |
|
||||
|
|
Census division 2 |
— |
0.95 |
— |
0.89 |
|
|
|
|
(0.13) |
(0.13) |
|
||||
|
|
Census division 3 |
— |
1.38** |
— |
1.25 |
|
|
|
|
(0.12) |
(0.12) |
|
||||
|
Repayment |
Census division 4 |
— |
1.05 |
— |
1.08 |
|
|
|
|
(0.14) |
(0.14) |
|
||||
|
|
Census division 5 (reference category) |
— |
— |
— |
— |
|
|
|
|
Census division 6 |
— |
1.62** |
— |
1.68** |
|
|
|
|
(0.18) |
(0.17) |
|
||||
|
|
Census division 7 |
— |
1.10 |
— |
1.08 |
|
|
|
|
— |
(0.10) |
— |
(0.10) |
|
||
|
|
Census division 8 |
— |
1.78*** |
— |
1.68*** |
|
|
|
|
(0.13) |
(0.13) |
|
||||
|
|
Census division 9 |
— |
1.37** |
— |
1.33** |
|
|
|
|
(0.10) |
(0.10) |
|
||||
|
|
Census division 0 |
— |
2.98* |
— |
2.57* |
|
|
|
|
(0.47) |
(0.46) |
|
||||
|
|
Construction |
— |
— |
0.76* |
0.79* |
|
|
|
|
|
(0.12) |
(0.12) |
|
|||
|
|
Education and health |
— |
— |
1.07 |
1.11 |
|
|
|
|
services |
(0.14) |
(0.14) |
|
|||
|
|
Financial activities |
— |
— |
0.81 |
0.81 |
|
|
|
|
|
(0.11) |
(0.11) |
|
|||
|
|
Information |
— |
— |
1.36* |
1.33* |
|
|
|
|
|
(0.13) |
(0.13) |
|
|||
|
|
Leisure and hospitality |
— |
— |
1.22* |
1.20* |
|
|
|
|
|
(0.08) |
(0.08) |
|
|||
|
|
Natural resources and |
— |
— |
0.90 |
0.91 |
|
|
|
|
mining |
(0.14) |
(0.15) |
|
|||
|
Impairment |
Intercept |
0.00*** |
0.00*** |
0.00*** |
0.00*** |
|
|
|
|
|
(0.23) |
(0.23) |
(0.23) |
(0.23) |
|
|
|
|
Time in the program |
1.04*** |
1.04*** |
1.04*** |
1.04*** |
|
|
|
|
|
(0.01) |
(0.01) |
(0.01) |
(0.01) |
|
|
|
|
Interest rate |
1.18*** |
1.19*** |
1.19*** |
1.20*** |
|
|
|
|
|
(0.02) |
(0.02) |
(0.02) |
(0.02) |
|
|
|
|
Interest payments begin |
2.09** |
1.96* |
2.10** |
2.03** |
|
|
|
|
|
(0.27) |
(0.27) |
(0.27) |
(0.27) |
|
|
|
|
First principal payment due |
0.92 |
0.93 |
0.93 |
0.93 |
|
|
|
|
|
(0.15) |
(0.15) |
(0.15) |
(0.15) |
|
|
|
Impairment |
Second principal payment due |
1.58** |
1.64*** |
1.62*** |
1.66*** |
|
|
|
|
|
(0.14) |
(0.14) |
(0.14) |
(0.14) |
|
|
|
|
Revenue ($ millions) |
1.00 |
1.00 |
1.00 |
1.00 |
|
|
|
|
(0.00) |
(0.00) |
(0.00) |
(0.00) |
|
||
|
|
Lenders (< $1 billion) |
1.19* |
1.35** |
1.18 |
1.35** |
|
|
|
|
(0.09) |
(0.10) |
(0.09) |
(0.10) |
|
||
|
|
Lenders ($1–10 billion) |
0.87 |
0.93 |
0.89 |
0.95 |
|
|
|
|
(0.09) |
(0.10) |
(0.09) |
(0.10) |
|
||
|
|
Lenders ($10–250 billion) (reference category) |
— |
— |
— |
— |
|
|
|
|
Lenders (>$250 billion) |
0.83 |
0.68 |
0.83 |
0.79 |
|
|
|
|
(0.40) |
(0.43) |
(0.39) |
(0.40) |
|
||
|
|
Census division 1 |
— |
1.17 |
— |
1.31 |
|
|
|
|
— |
(0.20) |
— |
(0.20) |
|
||
|
|
Census division 2 |
— |
0.89 |
— |
0.93 |
|
|
|
|
(0.14) |
(0.14) |
|
||||
|
|
Census division 3 |
— |
0.46*** |
— |
0.45*** |
|
|
|
|
(0.19) |
(0.19) |
|
||||
|
|
Census division 4 |
— |
0.51*** |
— |
0.54*** |
|
|
|
|
(0.17) |
(0.17) |
|
||||
|
|
Census division 5 (reference category) |
— |
— |
— |
— |
|
|
|
|
Census division 6 |
— |
0.82 |
— |
0.85 |
|
|
|
|
(0.25) |
(0.25) |
|
||||
|
|
Census division 7 |
— |
0.93 |
— |
0.95 |
|
|
|
|
(0.11) |
(0.12) |
|
||||
|
|
Census division 8 |
— |
0.95 |
— |
1.06 |
|
|
|
|
(0.17) |
(0.17) |
|
||||
|
|
Census division 9 |
— |
0.82 |
— |
0.82 |
|
|
|
|
(0.13) |
(0.13) |
|
||||
|
|
Census division 0 |
— |
1.44 |
— |
1.76 |
|
|
|
|
(1.00) |
(1.01) |
|
||||
|
|
Construction |
— |
— |
1.00 |
0.94 |
|
|
|
|
(0.12) |
(0.12) |
|
||||
|
|
Education and health |
— |
— |
1.06 |
1.00 |
|
|
|
|
services |
(0.16) |
(0.17) |
|
|||
|
|
Financial activities |
— |
— |
1.13 |
1.13 |
|
|
|
|
(0.11) |
(0.12) |
|
||||
|
|
Information |
— |
— |
0.66* |
0.65* |
|
|
|
|
(0.21) |
(0.21) |
|
||||
|
|
Leisure and hospitality |
— |
— |
0.80* |
0.77* |
|
|
|
|
(0.11) |
(0.11) |
|
||||
|
|
Natural resources and |
— |
— |
1.11 |
1.03 |
|
|
|
|
mining |
(0.15) |
(0.16) |
|
|||
|
|
Akaike Information Criteria |
19,079.56 |
19,036.63 |
19,062.88 |
19,021.32 |
|
|
|
|
Bayesian Information Criteria |
19,262.43 |
19,384.09 |
19,355.48 |
19,478.50 |
|
|
|
|
Number of observations |
69,130 |
69,130 |
69,130 |
69,130 |
|
|
* = statistically significant at the 5 percent level; ** = statistically significant at the 1 percent level; *** = statistically significant at the 0.1 percent level; — = not applicable.
Source: GAO analysis of Federal Reserve Bank of Boston data. . | GAO‑26‑108011
Note: Bolded coefficients are statistically significant at
the = 0.05 level or less.
Significance tests compare the coefficient to 1. Standard errors are included
in parentheses under each reported coefficient.
Our model was not designed to identify causal relationships, and some of the dynamics we identify may be capturing associations with the timing of an impairment or payoff rather than the overall likelihood of an outcome. For example, firms may have strategically defaulted on or before a lump-sum installment when they anticipated being unable to fulfill loan terms, even if they could have remained current for a longer period. Similarly, borrowers able to time their full payoff may have repaid earlier if they anticipated interest rates would rise rapidly. In both cases, payment structure or interest rates may have influenced the timing of actions rather than the outcome.
Some borrowers that paid off their loans early may have done so with money raised in the commercial credit sector. We do not know how many of these refinanced loans were current, paid off, or delinquent once the loan changed hands. Similarly, when lenders repurchased loans at a discount through the buyback program, they may have restructured terms in ways that improved the borrower’s ability to repay. While our model can provide insights into factors associated with loans backed by the Federal Reserve, these factors may not predict the loan’s performance after the loans left the Federal Reserve’s books.
GAO Contact
Michael E. Clements, ClementsM@gao.gov
Staff Acknowledgments
In addition to the contact named above, Tarek Mahmassani (Assistant Director), Zamir Ruli (Analyst in Charge), Sarah Arnett, Abigail Brown, Marcia Carlsen, Courtney Cox, Daniel Horowitz, Joanie Lofgren, Marc Molino, Jennifer Schwartz, and Griffen Wolfe made key contributions to this report.
The Government Accountability Office, the audit, evaluation, and investigative arm of Congress, exists to support Congress in meeting its constitutional responsibilities and to help improve the performance and accountability of the federal government for the American people. GAO examines the use of public funds; evaluates federal programs and policies; and provides analyses, recommendations, and other assistance to help Congress make informed oversight, policy, and funding decisions. GAO’s commitment to good government is reflected in its core values of accountability, integrity, and reliability.
Obtaining Copies of GAO Reports and Testimony
The fastest and easiest way to obtain copies of GAO documents at no cost is through our website. Each weekday afternoon, GAO posts on its website newly released reports, testimony, and correspondence. You can also subscribe to GAO’s email updates to receive notification of newly posted products.
Order by Phone
The price of each GAO publication reflects GAO’s actual cost of production and distribution and depends on the number of pages in the publication and whether the publication is printed in color or black and white. Pricing and ordering information is posted on GAO’s website, https://www.gao.gov/ordering.htm.
Place orders by calling (202) 512-6000, toll free (866) 801-7077,
or
TDD (202) 512-2537.
Orders may be paid for using American Express, Discover Card, MasterCard, Visa, check, or money order. Call for additional information.
Connect with GAO
Connect with GAO on X,
LinkedIn, Instagram, and YouTube.
Subscribe to our Email Updates. Listen to our Podcasts.
Visit GAO on the web at https://www.gao.gov.
To Report Fraud, Waste, and Abuse in Federal Programs
Contact FraudNet:
Website: https://www.gao.gov/about/what-gao-does/fraudnet
Automated answering system: (800) 424-5454
Media Relations
Sarah Kaczmarek, Managing Director, Media@gao.gov
Congressional Relations
David A. Powner, Acting Managing Director, CongRel@gao.gov
General Inquiries
[1]The facilities were authorized under section 13(3) of the Federal Reserve Act and approved by the Secretary of the Treasury. Section 13(3) of the Federal Reserve Act permits the Federal Reserve to provide emergency lending.
[2]To provide economic relief, section 4003(b)(4) of the CARES Act made available at least $454 billion for the Department of the Treasury to support the Board of Governors of the Federal Reserve System in establishing facilities. Pub. L. No. 116-136, § 4003(b)(4), 134 Stat. 281, 470 (2020). We refer to these facilities as CARES Act facilities.
[3]The Federal Reserve also established four emergency lending facilities that did not receive CARES Act appropriations, which we refer to as non–CARES Act facilities, intended to serve various markets and credit needs. On July 30, 2021, the last of the non–CARES Act facilities stopped purchasing assets or extending credit.
[4]This amount includes Main Street loan participations at face value, net of an allowance for credit losses as of December 31, 2025.
[5]Specifically, we are to report no later than 9 months after the date of enactment of the act, and annually thereafter through the year succeeding the last year for which loans, loan guarantees, or other investments made under section 4003 are outstanding. Our previous reports were GAO, Federal Reserve Lending Programs: Nearly Half of Main Street Program Loans Are Fully Repaid, but Losses Have Increased, GAO‑25‑107246 (Washington, D.C.: Dec. 19, 2024); Federal Reserve Lending Programs: Status of Monitoring and Main Street Lending Program, GAO‑24‑106482 (Washington, D.C.: Dec. 22, 2023); Federal Reserve Lending Programs: Risks Remain Low in Related Credit Markets, and Main Street Loans Have Generally Performed Well, GAO‑23‑105629 (Washington, D.C.: Dec. 19, 2022); Federal Reserve Lending Programs: Credit Markets Served by the Programs Have Stabilized, but Vulnerabilities Remain, GAO‑22‑104640 (Washington, D.C.: Oct. 19, 2021); and Federal Reserve Lending Programs: Use of CARES Act-Supported Programs Has Been Limited and Flow of Credit Has Generally Improved, GAO‑21‑180 (Washington, D.C.: Dec. 10, 2020). Additionally, we have issued government-wide reports on the federal response to COVID-19, available at https://www.gao.gov/coronavirus.
[6]Section 4003 of the CARES Act also made available up to $46 billion in loans and loan guarantees to certain aviation businesses and other businesses deemed critical to maintaining national security, known as the Aviation and National Security Loan Program. CARES Act, Pub. L. No. 116-136, § 4003, 134 Stat. 281, 470 (2020).
[7]GAO, Standards for Internal Control in the Federal Government, GAO‑25‑107721 (Washington, D.C.: May 15, 2025).
[8]Federal Reserve Act, Pub. L. No. 63-43, 38 Stat. 251 (1913).
[9]The Federal Open Market Committee consists of the seven members of the Board of Governors, the President of the Federal Reserve Bank of New York, and four other Reserve Bank presidents who serve on a rotating basis. The committee is responsible for directing open market operations to influence the total amount of money and credit available in the economy.
[10]Reserve Banks typically lend to banks through discount window programs based on established statutory criteria. 12 U.S.C. § 347b(a). The discount window is a Federal Reserve Board lending program that allows eligible institutions to borrow money, usually on a short-term basis, at an above-market rate to meet temporary liquidity shortages.
[11]12 U.S.C. § 343(3). Any emergency lending programs or facilities authorized by the Federal Reserve under its section 13(3) authority must have broad-based eligibility to qualify for use.
[12]The Federal Reserve established 13 emergency lending facilities in response to the COVID-19 pandemic. Four of these—the Commercial Paper Funding Facility, Money Market Mutual Fund Liquidity Facility, Paycheck Protection Program Liquidity Facility, and Primary Dealer Credit Facility—were non–CARES Act facilities, and all stopped purchasing assets or extending credit by July 30, 2021.
[13]For the Main Street Lending Program, the transaction amount refers to the Federal Reserve’s participation in the Main Street loans, which is the purchase of 95 percent of lenders’ authorized loan amount to eligible borrowers.
[14]The Main Street Lending Program’s Nonprofit Organization Expanded Loan Facility did not conduct any transactions.
[15]The most recent RBOPS oversight report covered January 2025 through December 2025 and was issued in April 2026.
[18]GAO‑25‑107246. See also GAO‑25‑107721.
[20]For the purposes of this report, outstanding loans refer to Main Street loans that had a remaining balance but had not experienced a loss. That is, these were active loans that had not resulted in a charge-off and were not sold back to their lenders at a net loss. While loans that have experienced a loss remain contractually outstanding, we do not consider them outstanding for the purposes of our analysis.
[21]The recovery rate from the sale is based on the loan amount outstanding at the time of the sale.
[22]The Census Bureau divides the United States into a variety of geographic units for analytical purposes. Regions are the largest unit, dividing the country into four areas. Divisions are the second largest unit, dividing the country into nine areas. U.S. territories are not represented in either regions or divisions.
[23]The remaining 17 percent of loans were fully repaid or became impaired on their maturity date. For the purposes of our model, a fully repaid loan is one that has a balance of zero and has been repaid. An impaired loan (1) is 30 or more days delinquent on any payment, (2) has been charged off, (3) was sold back to its lender, or (4) remains outstanding after 60 months, which is when the final principal payment was due. Loans were expected to mature after participating in the program for 60 months. We considered delinquent loans to be impaired because continued delinquency is the first step to loan charge-off.
[24]For more details about our models, see app. III.
[25]The results discussed on next two pages are based on Model 3 in app. III. In this model, a loan’s status in the next month is associated with how many months the loan was in the program, interest rates, and payment milestones.
[26]For this report, we use the term likelihood to describe the relative risk ratio results of our modeling efforts.
[27]The Main Street Lending Program used the London Interbank Offered Rate (LIBOR) as its benchmark rate. Main Street borrowers agreed to take on an adjustable interest rate, calculated by adding 300 basis points (or 3 percent) to the adjustable 1-month or 3-month LIBOR, depending on a loan’s terms. After LIBOR was decommissioned on June 30, 2023, Main Street lenders were required to file a Core Rights Request form to change from a LIBOR-pegged rate to a comparable rate—generally, the term Secure Overnight Funding Rate (SOFR). According to Federal Reserve Bank of Boston officials, 96 percent of Main Street loans transitioned from LIBOR to SOFR. The remaining 4 percent transitioned to other comparable rates (such as the prime rate).
[28]We have previously reported that increases in interest rates may have potentially increased financial stress on Main Street borrowers. See GAO‑24‑106482, 31–34.
[29]The model estimates the relationship of a variable, such as interest rates, to the probability of transitioning to each outcome separately, relative to the baseline probability of remaining a current loan in the same month, holding other variables (such as time in the program) constant.
[30]CARES Act, Pub. L. No. 116-136, § 4003(b)(1)–(3), 134 Stat. 281, 470 (2020). The CARES Act did not provide criteria for which businesses were “critical to maintaining national security.” Treasury established the following definition: (1) performing under a “DX”-priority-rated contract or order under the Defense Priorities and Allocations System regulations (15 C.F.R. pt. 700) or (2) operating under a valid top secret facility security clearance under the National Industrial Security Program regulations (32 C.F.R. pt. 2004). Treasury guidance also noted that applicants that did not meet either criterion could still be considered for loans if, based on the recommendation and certification by the Secretary of Defense or the Director of National Intelligence, the Secretary of the Treasury determined that the applicant’s business was critical to maintaining national security.
[31]We examined how Treasury implemented this program and how it reviewed applications for loans in 2020. See GAO, Financial Assistance: Lessons Learned from CARES Act Loan Program for Aviation and Other Eligible Businesses, GAO‑21‑198 (Washington, D.C.: Dec. 10, 2020).
[32]In 2021, we reported that Treasury had not documented policies and procedures to guide when to act on warrants it obtained related to this and another program. We recommended that Treasury develop such policies and procedures for both programs. Treasury fully implemented these recommendations. It developed a plan to guide its actions on warrants in 2023 and subsequently held auctions to dispose of the warrants in June 2024. See GAO, COVID-19: Additional Actions Needed to Improve Accountability and Program Effectiveness of Federal Response, GAO‑22‑105051 (Washington, D.C.: Oct. 27, 2021).
[33]We conducted ongoing oversight of the Aviation and National Security Loan Program over the last 5 years and included observations and lessons learned in our 2024 all-of-government report on COVID-19 programs and financial assistance. We recommended that Treasury include key lessons from the COVID-19 emergency financial assistance provided to the aviation industry, including those identified by GAO and other auditing entities, in the department’s ongoing efforts to prepare for future financial emergencies. Treasury agreed with the recommendation and continues to work on it. See GAO, COVID-19: Lessons Can Help Agencies Better Prepare for Future Emergencies, GAO‑24‑107175 (Washington, D.C.: Aug. 1, 2024).
[34]Yellow Corporation, formerly known as YRC Worldwide, was a trucking company that was classified as a national security business for this loan program. It filed for bankruptcy in 2023. The loan was repaid in full through payments made before the bankruptcy filing and through the bankruptcy estate.
[35]Treasury reported that in October 2025 it sold its interests in the loan to Mesa Airlines to an unaffiliated third party. Proceeds from this sale, along with prior principal payments from Mesa Airlines, resulted in total principal repayments of $192.6 million out of $195 million disbursed. The other loan not repaid in full was to Visual Semantics, Inc., a national security business, which filed for bankruptcy in March 2023. Total principal repaid on this loan was $17,601 out of approximately $1.1 million. Treasury deemed the remaining balance uncollectable.
[36]The large passenger air carriers did not draw on the full amount of their loans. In July 2021, we reported that representatives from these carriers told us that the existence of the Treasury loan program helped increase liquidity in financial markets and lender confidence in extending loans to air carriers. GAO, COVID-19: Continued Attention Needed to Enhance Federal Preparedness, Response, Service Delivery, and Program Integrity, GAO‑21‑551 (Washington, D.C.: July 19, 2021).
[37]For the federal budget, the estimated long-term cost to the government of a direct loan or loan guarantee is calculated on a net present value basis and reported as a subsidy rate, or cost, per $100 of lending. The credit supplement to the fiscal year 2027 budget (which included data through fiscal year 2025) showed increased estimated subsidy costs for the loans made to cargo carriers, repair station operators, and ticket agents in this program. Specifically, the updated estimated subsidy cost for cargo carriers increased from $7.75 (original estimate) to $80.60 per $100 of lending. The updated estimated subsidy cost for repair station operators and ticket agents increased from $8.62 (original estimate) to $20.30 per $100 of lending. These increases reflect higher risk of loan losses for these types of borrowers. The estimated subsidy costs for other types of borrowers remained the same. Office of Management and Budget, Budget of the U.S. Government: Federal Credit Supplement, Fiscal Year 2027.
[38]As mentioned earlier, Visual Semantics, Inc., a national security business, filed for bankruptcy in March 2023. The bankruptcy case concluded in January 2024.
[39]CARES Act, Pub. L. No. 116-136, § 4029(b), 134 Stat. 281, 497 (2020). Though the CARES Act also allowed Treasury to extend the loan maturity date for cargo air carriers, the only cargo air carrier with an outstanding loan ceased operations. Therefore, Treasury would not have been able to grant it an extension.
[40]The Debt Collection Improvement Act of 1996 and Federal Claims Collection Standards require that the Department of Justice must approve any plans or settlements when compromise involves an amount more than $100,000 (excluding interest).
[41]Treasury received warrants from passenger air carriers related to the loan program as well as the Payroll Support Program. See GAO‑22‑105051 for more information on the warrants received for both programs.
[42]According to Treasury officials, the warrants the agency obtained from Mesa Airlines expired unexercised because their exercise price was significantly higher than the trading price of Mesa Airlines’ common stock through the expiration date. Treasury negotiated an extension of the expiration date of the loan warrants issued by Republic Airways to permit Treasury to exercise those warrants up to 90 days after the closing on the merger of Republic Airways and Mesa Airlines. This extension resulted in a larger exercise settlement payment than Treasury would have received prior to the merger. The amount received from Republic Airways includes both loan and Payroll Support Program warrants.
[43]See GAO, Standards for Internal Control in the Federal Government, GAO‑25‑107721 (Washington, D.C.: May 15, 2025).
[44]See app. III for additional information on the econometric analysis and results.
[45]At the time of our review, we were able to determine the final outcomes for 1,580 loans (about 86 percent of all loans in the program). Although loans were due to close by January 2026, 250 remained outstanding as of that date.
[46]According to the Bureau of Labor Statistics, NAICS codes can be grouped into 10 sectors: construction; education and health services; financial activities; information; leisure and hospitality; manufacturing; natural resources and mining; professional and business services; trade, transportation, and utilities; and other services.
[47]The Federal Reserve Bank of Boston does not collect data on the source of funds used to pay off loans in full.
[48]At origination, the Main Street Lending Program used the London Interbank Offered Rate (LIBOR) as its benchmark rate. Main Street borrowers agreed to an adjustable interest rate, calculated by adding 300 basis points (or 3 percent) to the adjustable 1-month or 3-month LIBOR, depending on loan terms. LIBOR was decommissioned on June 30, 2023. According to Federal Reserve Bank of Boston officials, 96 percent of borrowers transitioned to the Secure Overnight Funding Rate. The remaining 4 percent transitioned to other comparable rates, such as the prime rate.
[49]We did not have data on the asset size of individual lenders. Instead, we used the asset-size categories assigned by the Federal Reserve during the loan approval process.