
Report to Congressional Requesters
United States Government Accountability Office
A report to congressional requesters
Contact: Jessica Lucas-Judy at lucasjudyj@gao.gov
What GAO Found
Qualified Opportunity Zones (Zone)—low-income census tracts nominated by governors and designated by the Department of the Treasury—have lower incomes and higher poverty than other census tracts. The law commonly known as the One Big Beautiful Bill Act (OBBBA) changed the eligibility criteria for Zone designation, which resulted in fewer eligible tracts for future selection. Stakeholders, including some states and subject-matter specialists, reported that this may allow better targeting of the tax incentive to the most economically distressed areas.
Stakeholders reported the incentive is primarily funding real estate development. According to state officials and Qualified Opportunity Fund representatives, Zones that received investment tended to be in urban locations and have access to infrastructure and community support. Tax benefits for investments in newly defined rural Zones could drive investment in those areas, but stakeholders were uncertain about the extent.
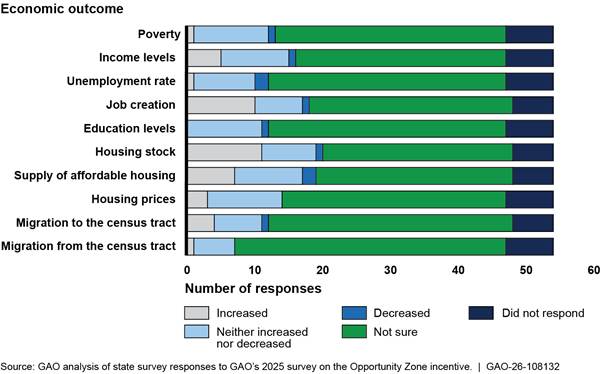
States were mostly unsure about the effects of investment on outcomes, but about 20 percent of states cited increased job creation and housing as effects.
OBBBA’s changes to the tax incentive may mitigate some challenges state officials and fund representatives identified with the original incentive. For example, new requirements for funds and for Treasury to report on characteristics of investments will allow the government and the public to better understand investment and its potential economic effects in Zones. Further, the additional time the act provides for states to prepare to nominate census tracts to be designated as Zones may help states make informed selections.
Why GAO Did This Study
Congress created the Opportunity Zone tax incentive to spur investment in economically distressed communities. Taxpayers who invest in Qualified Opportunity Funds—funds organized for the purpose of investing in Zones—are eligible for certain tax benefits, such as deferral of taxes on the invested amount. These funds held more than $108 billion in assets as of the end of 2024. OBBBA made the incentive permanent and introduced a new category of Zones comprised entirely of a rural area with different potential tax benefits.
GAO was asked to review the Opportunity Zone tax incentive. This report describes (1) Zones’ characteristics and how the revised incentive under OBBBA could affect future Zones’ characteristics; (2) the experiences of states, Qualified Opportunity Funds, and other stakeholders with the original incentive and how the revised incentive may affect future investment activity; (3) stakeholders’ awareness of the original incentive’s effects on communities; and (4) the changes to the incentive introduced by OBBBA and the extent to which they address previous challenges.
GAO analyzed Census data on tracts designated as Zones and those eligible for the second round of Zone designation, analyzed data from a nongeneralizable sample of 16 Qualified Opportunity Funds, interviewed fund representatives, conducted site visits to investments from seven selected funds, surveyed all states and U.S. territories, and interviewed selected state officials and subject-matter specialists knowledgeable about the tax incentive from five organizations. GAO also reviewed documents and interviewed federal agency officials.
|
Abbreviations |
|
|
|
|
|
|
|
ACS |
American Community Survey |
|
|
IRS |
Internal Revenue Service |
|
|
OBBBA |
One Big Beautiful Bill Act |
|
|
TCJA |
Tax Cuts and Jobs Act |
|
|
Zone |
Qualified Opportunity Zone |
|
This is a work of the U.S. government and is not subject to copyright protection in the United States. The published product may be reproduced and distributed in its entirety without further permission from GAO. However, because this work may contain copyrighted images or other material, permission from the copyright holder may be necessary if you wish to reproduce this material separately.
August 24, 2026
Congressional Requesters:
Conventional access to credit and investment capital for developing small businesses, creating and retaining jobs, and revitalizing neighborhoods is often limited in economically distressed communities or in communities with large low-income populations. To incentivize growth and investment in these communities, in 2017 Congress created the Opportunity Zone tax incentive in Public Law 115-97, commonly known as the Tax Cuts and Jobs Act (TCJA).[1] Qualified Opportunity Zones (Zone) are designated low-income community census tracts where certain qualified investments are eligible for federal tax benefits. Specifically, taxpayers can receive tax benefits if they invest in Qualified Opportunity Funds that either operate businesses themselves in the Zones or in Qualified Opportunity Zone Businesses that operate in the Zone. These businesses may include multifamily housing, hotels, and commercial real estate. The nearly 9,000 designated tracts are home to approximately 10 percent of the nation’s population.
According to Internal Revenue Service (IRS) data, Qualified Opportunity Funds, which are investment vehicles organized for the purpose of investing in qualified property within Zones, held more than $108 billion in total assets as of the end of 2024.[2] These investments can potentially grow tax free through the end of 2047: taxpayers may elect to exclude from gross income any appreciation on their qualifying investments in funds if taxpayers hold that investment for at least 10 years. Public Law 119-21—commonly known as the One Big Beautiful Bill Act (OBBBA)—was enacted in July 2025.[3] It introduced new benefits for investments in rural areas and made other revisions. It also made the Opportunity Zone incentive permanent, whereas under the TCJA, the incentive was to sunset.[4]
You asked us to review the Opportunity Zone tax incentive. This report describes (1) Zones’ characteristics and how the revised incentive under OBBBA could affect characteristics of future Zones; (2) the experiences of states, Qualified Opportunity Fund representatives, and other stakeholders with the original incentive and perspectives on how the revised incentive may affect future investment activity; (3) stakeholders’ awareness of the original incentive’s effects on communities; and (4) the changes to the incentive enacted in OBBBA and the extent to which those changes address previous challenges faced by states.
To describe Zones’ characteristics and how the revised incentive could affect characteristics of future Zones, we analyzed Department of the Treasury and IRS guidance, and American Community Survey (ACS) data, applicable federal laws, including TCJA and OBBBA, and relevant federal regulations. Specifically, we analyzed 2020-2024 ACS data to describe the characteristics of census tracts, including tracts that were designated as Zones and tracts eligible for a second round of Zone designations. We used 2020-2024 data because they were the most recent at the time of our analysis. We also interviewed subject-matter specialists knowledgeable about the tax incentive from five organizations. These organizations provide tax and accounting professional services, conduct research, or provide advocacy related to the Opportunity Zone tax incentive and economic development more generally.
To describe the experiences of states, Qualified Opportunity Funds, and other stakeholders with the original incentive and perspectives on how the revised incentive may affect future investment activity, and to describe stakeholders’ awareness of the original incentive’s effects on communities, we
· conducted a survey of the 50 states, the five U.S. territories, and Washington, D.C. (hereafter states);
· interviewed Qualified Opportunity Fund representatives, state and local officials, and subject-matter specialists knowledgeable about the tax incentive; and
· conducted site visits to seven funds’ investments and the corresponding Zones.
On our survey, we received responses from 54 of the 56 states. We conducted semi-structured interviews with fund representatives from 16 of the 18 Qualified Opportunity Funds we selected for case studies for our 2021 Opportunity Zones report to understand their experience using the Opportunity Zone tax incentive and perspectives on the revised incentive.[5] We conducted site visits to Qualified Opportunity Funds’ investment sites to observe completed and in-process projects to better see and understand how the incentive is being used. During these site visits, we also interviewed state and local officials. The interviews and site visits are not generalizable but provide illustrative examples.
We also analyzed the original incentive as enacted by TCJA and the revised incentive enacted by OBBBA to describe how the revised incentive may affect future investment activity.
To describe the changes to the incentive enacted in OBBBA and the extent to which those changes address previous challenges faced by states, we interviewed state and local government officials and officials from Treasury, and analyzed state survey responses, TCJA, OBBBA, and publicly available information on the incentive.
We conducted this performance audit from February 2025 to August 2026 in accordance with generally accepted government auditing standards. Those standards require that we plan and perform the audit to obtain sufficient, appropriate evidence to provide a reasonable basis for our findings and conclusions based on our audit objectives. We believe that the evidence obtained provides a reasonable basis for our findings and conclusions based on our audit objectives.
For more information on our objectives, scope, and methodology, see appendix I.
Background
TCJA Created the Opportunity Zone Incentive
The financial benefits of the Opportunity Zone tax incentive for investors can vary with the length of time they maintain investments in Qualified Opportunity Funds. Qualified Opportunity Funds are investment vehicles which are organized as a corporation or a partnership for the purpose of investing in Qualified Opportunity Zone property.[6] As enacted by TCJA and implementing regulations, investing in these funds allows taxpayers realizing capital gains to defer these gains from taxable income until as late as December 31, 2026—and under certain circumstances to pay reduced taxes on those gains.
Specifically, investors who held Qualified Opportunity Fund investments at least 7 years were eligible for a 15 percent step-up in basis and those who held an investment at least 5 years were eligible for a 10 percent step-up in basis. Generally, a taxpayer’s initial basis—the amount of their investment in property for tax purposes—is generally set at zero for eligible investments in Qualified Opportunity Funds. Deferred gain is included in the taxpayer’s gross income upon the earlier of an inclusion event, such as sale or exchange, or December 31, 2026.[7] When the deferred gain is included in income, the basis is increased to be equal to the amount of gain that had been deferred through investment in a fund. However, if the investment was held for 5 years, the initial basis is increased, or “stepped up” to 10 percent, effectively reducing by 10 percent the capital gains recognized in income, and thus taxable. Further, for an investment held 7 years, the initial basis is stepped up an additional 5 percent, resulting in effectively a 15 percent reduction in capital gains recognized in income and taxable. Because the original tax deferral was to expire on December 31, 2026, taxpayers needed to invest by December 31, 2019, or December 31, 2021, to be eligible for the 15 or 10 percent step-up in basis, respectively.
In addition, taxpayers generally would not pay taxes on any gain due to appreciation of investments in Qualified Opportunity Funds if those investments were held for at least 10 years and an election was made by the end of 2047 upon disposition of the investment. In other words, under certain conditions, an investor can elect to have their basis increased to the fair market value of an investment at the time of sale, which results in no capital gains to be taxed.
As shown in figure 1, to receive these tax benefits, generally taxpayers must first invest their original gains in a Qualified Opportunity Fund within 180 days of realizing those gains; in turn, these funds must invest in property located within the Zones.
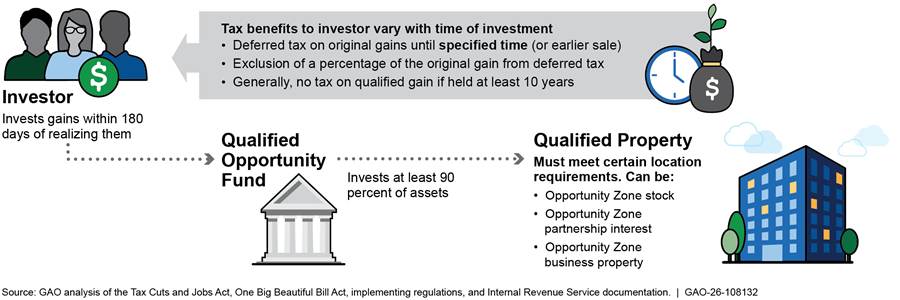
Qualified Opportunity Funds must meet a number of requirements, including holding at least 90 percent of their assets in qualified property, which can consist of tangible property in Zones or equity interests in qualified businesses that themselves must meet requirements, such as owning tangible property in Zones.[8] Such tangible property must satisfy original use or substantial improvement requirements and must be located or used in a Zone.[9] Among other requirements, qualified businesses in which Qualified Opportunity Funds have an equity interest must earn at least 50 percent of their gross income from business activities within a Zone.[10]
OBBBA Made Incentive Permanent and Created a New Zone Type with Additional Benefits
In 2025, OBBBA made the Opportunity Zone tax incentive permanent with new Zones nominated by governors in 2026 and designated by Treasury effective January 1, 2027.[11] Designations will occur every 10 years. The structure of the incentive remains mostly the same, though OBBBA made some adjustments and introduced a new incentive for taxpayers that invest in Qualified Rural Opportunity Funds—funds that invest in certain rural areas. Taxpayers may still defer the recognition of capital gains by investing the gains in Qualified Opportunity Funds, provided that the gains are invested within 180 days of realization. Qualified Opportunity Funds must satisfy the statutory and regulatory requirements regarding business property and business location. As with the original incentive, if an eligible investment is held for at least 10 years, taxpayers may elect to exclude the gain from their investment when it is sold or exchanged, which could result in no tax due on the gain.
In a change from the original incentive, the revised Opportunity Zone incentive removes a singular capital gains deferral deadline and introduces rolling benefits. Certain capital gains taxes are deferred 5 years from the date of investment and receive a step-up in basis at that time.[12] As shown in figure 2, taxpayers are no longer required to sell Opportunity Zone investments to elect a basis adjustment for tax-free growth. Taxpayers that hold their investment for more than 30 years from the date of the investment and make an election may step-up the basis of that investment to the fair market value of that investment on the date that is 30 years after that investment date and any gains that accrue after 30 years are taxable.
Figure 2: Example of Tax Benefits over Time from Investments Under Revised Opportunity Zones Tax Incentive
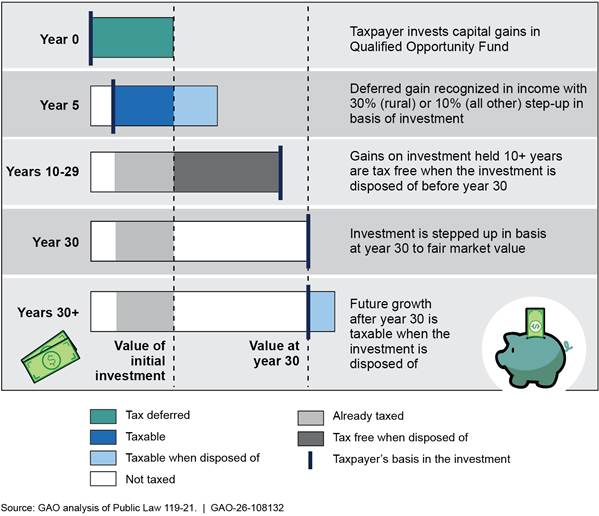
Note: Taxpayers must make an election to defer recognition of capital gains from income by investing the gains in a Qualified Opportunity Fund or Qualified Rural Opportunity Fund. Post-investment appreciation may be excluded from taxable income upon sale or disposition if the investment is held for at least 10 years and the taxpayer makes the required election.
OBBBA also introduced new benefits for investments in Qualified Opportunity Zones that are comprised entirely of a rural area.[13] These benefits apply to certain previously-designated Zones as well as rural tracts that will be designated in the future. Taxpayers who invest on or after January 1, 2027, in Qualified Rural Opportunity Funds, which substantially hold their tangible property in Zones comprised entirely of a rural area, may be eligible for a 30 percent step-up in basis after 5 years. In contrast, taxpayers investing in other Qualified Opportunity Funds may be eligible for a 10 percent step-up in basis after 5 years.
Pursuant to the OBBBA, investments made in Zones comprised entirely of a rural area have different requirements than investments made in non-rural Zones for the extent to which the Qualified Opportunity Fund must improve a property. Property in Zones is considered substantially improved if within any 30-month period after the acquisition of the property, it has been improved by an amount in excess of the adjusted basis (generally exclusive of the land value) at the start of the 30-month period. For example, if a fund bought property that cost $300,000, with the building used in the active conduct of a trade or business being valued at $250,000 and the land worth $50,000, then the fund would need to invest more than $250,000 in the property. In contrast, property in Zones comprised entirely of a rural area is considered substantially improved after a 50 percent increase in adjusted basis.[14] If the property purchased in the previous example was located in a rural Zone, the fund would need to invest only $125,000 to meet its substantial improvement obligation.
OBBBA also changed the criteria for census tract eligibility for Zone designation, as shown in table 1.
Table 1: Eligibility Criteria for Census Tracts to Be Designated as Qualified Opportunity Zones Under TCJA and OBBBA
|
Eligibility criterion |
Original Opportunity Zone tax incentive (TCJA) |
Revised Opportunity Zone tax incentive (OBBBA) |
|
Median family income |
Does not exceed 80 percent of the greater of statewide median family income or the metropolitan area median family income (for metropolitan areas) |
Does not exceed 70 percent of statewide median family income (for non-metropolitan areas) or 70 percent of the metropolitan area median family income (for metropolitan areas) |
|
Poverty rate and median family income |
At least 20 percent with no median family income requirements |
At least 20 percent, and the median family income of the tract does not exceed 125 percent of the statewide median family income (for non-metropolitan areas) or the metropolitan area median family income (for metropolitan areas) |
|
Other New Markets Tax Credit eligibility |
Meets certain other criteria outlined in Internal Revenue Code section 45D(e) (New Markets Tax Credit) |
Not applicable; census tracts are not eligible to be designated as Qualified Opportunity Zones using this criterion |
|
Contiguity with designated low-income community |
Is contiguous with a low-income community that is designated as a Qualified Opportunity Zone, and the median family income does not exceed 125 percent of the median family income of the contiguous Qualified Opportunity Zone |
Not applicable; census tracts are not eligible to be designated as Qualified Opportunity Zones using this criterion |
Source: GAO analysis of the Tax Cuts and Jobs Act (TCJA) and the One Big Beautiful Bill Act (OBBBA). | GAO‑26‑108132
Note: Tracts must satisfy at least one of the eligibility criteria for designation but do not have to satisfy all criteria. Eligibility for designation under the original Opportunity Zone tax incentive was based on the definition of “low-income community” used by the New Markets Tax Credit, pursuant to Internal Revenue Code subsection 45D(e). This definition comprises the first three eligibility criteria in the table above. OBBBA revised the definition of “low-income community” and it no longer references the definition used to determine New Markets Tax Credit eligibility.
In October 2020, we recommended that Congress consider requiring more reporting for the Opportunity Zone tax incentive and specified that Treasury is best suited to collect that information.[15] We found that IRS collected information from Qualified Opportunity Funds and their investors necessary to administer the tax code and ensure compliance with the rules of the incentive. We noted that as a result of unclear statutory authority, there was insufficient data available to evaluate Opportunity Zone performance. Some of the data, such as investment amounts, could be used to evaluate outcomes. However, there was a limited amount of data available to understand how and where the incentive was being used and the effect of Opportunity Zone investments, because such data were not necessary to determine tax compliance.
Congress implemented our recommendations by introducing reporting requirements in OBBBA on incentive use and outcomes by Qualified Opportunity Funds and Treasury. OBBBA requires Qualified Opportunity Funds to file returns annually on certain information on their business and investment activity, including the value of the assets, the value of the investment, housing data associated with investments if applicable, and full-time employment data.[16] The law also requires Treasury to report annually on the amount and characteristics of Qualified Opportunity Fund investments. Further, Treasury is required to report beginning in the 6th year on the effect of Zone designation as measured by economic indicators such as job creation and poverty reduction.[17]
Zones Have Lower Incomes and Higher Poverty than Other Census Tracts and Future Zones May Have Even Lower Incomes
We previously reported, using data from the 2015-2019 American Community Survey (ACS), that Zones had lower incomes and higher poverty than census tracts overall. Using updated data from the 2020-2024 ACS, we find that is still the case. They also have a greater share of Black or Hispanic residents compared to all tracts. Zones also have a greater share of population that was foreign born and have lower educational attainment than the populations of all tracts, as shown in table 2. New tracts eligible for Zone designation in 2027 have similar average economic and demographic characteristics to existing Zones, with higher poverty, lower income, and lower educational attainment compared to all census tracts. Based on the rules governing how many tracts a state can nominate, approximately 25 percent of those eligible tracts will ultimately be designated as Zones, and depending on which tracts are selected, the average characteristics of the newly designated zones could differ significantly from the average characteristics of the eligible tracts.[18]
Table 2: Comparison of Estimated Population Characteristics of All Census Tracts, Qualified Opportunity Zones, and Census Tracts Eligible for 2027 Designation
|
|
All Census Tracts |
All Qualified Opportunity Zones |
Census Tracts Eligible for 2027 Opportunity Zone Designation |
|
Population Characteristics |
|
|
|
|
Share of All Census Tracts (percent) |
100 |
12 |
30 |
|
Population |
338,079,229 |
35,002,797 |
90,127,656 |
|
Economic Characteristics |
|
|
|
|
Household Median Income (dollars) |
85,726 |
52,885 |
51,246 |
|
Average Poverty Rate (percent) |
13 |
22 |
24 |
|
Average Unemployment Rate (percent) |
5 |
8 |
8 |
|
Demographic Characteristics |
|
|
|
|
Percentage of the population that is… |
|
||
|
White |
57 |
38 |
38 |
|
Hispanic |
20 |
34 |
31 |
|
Black |
12 |
20 |
22 |
|
Asian |
6 |
4 |
4 |
|
Other |
5 |
5 |
5 |
|
Percentage of the population that is… |
|
|
|
|
Foreign born |
3 |
10 |
5 |
|
Living in a non-English speaking household |
22 |
27 |
31 |
|
Percentage of the population with… |
|
|
|
|
High school education or less |
36 |
49 |
51 |
|
A bachelor’s degree or higher |
36 |
23 |
21 |
Source: GAO Analysis of Census American Community Survey, Department of the Treasury, and Internal Revenue Service data. | GAO‑26‑108132
Notes: Includes 50 states, Washington, D.C., and Puerto Rico, but excludes the other territories, which are not covered by the Census American Community Survey. We reported on five race/ethnicity categories, combining some Census categories for ease of analysis: White, Black, Hispanic (an ethnicity that applies to individuals of any racial background), Asian (includes Asian, Native Hawaiian, and Other Pacific Islander), and Other (includes American Indian, Alaska Native, two or more races, and some other race). The boundaries of census tracts have changed since Qualified Opportunity Zones (Zone) were designated in 2018, however the Zone boundaries are the same as when they were originally designated. As a result, any summary statistics based on the original Zone designation should be considered approximations based on matching between the 2010 and 2020 census tract boundaries. The estimates in this figure have margins of error at the 90-percent confidence level within 1 percent or 2 percentage points, respectively, except for the percentage of the population living in a non-English speaking household, which has a margin of error of less than 5 percentage points. Dollar amounts are in 2024 dollars.
As a result of the changed census tract eligibility criteria under OBBBA, there will be about a quarter fewer eligible tracts, according to our analysis of the list of eligible tracts published by Treasury.[19] We estimate that approximately 31 percent of existing Zones will not be eligible for redesignation based on the changed criteria and ACS estimates for 2020-2024.[20]
The revised eligibility criteria may allow for better targeting of the incentive to economically distressed communities. Some subject-matter specialists knowledgeable about the tax incentive told us that having fewer tracts may encourage communities to actively court designations and may concentrate investment locations in the fewer tracts that are ultimately designated, which will likely be economically needier. Officials from two different states said that the changed eligibility criteria will focus investment on more distressed communities. Officials from another state told us that the eligibility changes, particularly to remove contiguous tracts, will likely reduce the selection of tracts that could experience development without the incentive. However, subject-matter specialists from one organization said that, among the selected tracts, investors will still have discretion to choose where they invest, which may or may not be in communities that are more distressed.
Stakeholders Said Local Support Affected Investment Activity; Revised Incentive May Change Investment Patterns
Stakeholders Reported Urban Zones with Local Support Were More Likely to Receive Investment
Once designated, taxpayers invest in funds that then make investments in Zones. Comprehensive data on the location and types of investments into Zones are not publicly available, but some stakeholders reported that they were aware of investments in Zones in their jurisdictions.
According to some state survey respondents, Qualified Opportunity Fund representatives, subject-matter specialists knowledgeable about the tax incentive, and state and local officials, characteristics of Zones more likely to receive investment include: (1) Zones that are in urban locations, (2) Zones that have or are near ongoing development, (3) Zones that have or will have access to infrastructure, and (4) Zones that have community support.[21] Subject-matter specialists from one organization said that urban location, proximity to development, and access to infrastructure are all indicators of strong market projections that would drive investment to Zones.
Urban location. In our state survey, some reported urban Zones were more likely to receive Opportunity Zone investment. For example, one state reported that job growth tended to occur in a small group of Zones in cities and their suburbs that were primed for growth. Puerto Rico reported that even though most of the island was designated as Zones, Opportunity Zone development predominantly occurred in metropolitan areas. Further, of the 24 states aware of investments made by Qualified Opportunity Funds in their jurisdictions, a majority reported there are more Opportunity Zone investments in metropolitan areas than non-metropolitan areas. Officials from one state said that Zones need to have population and workforce to support development projects.
Ongoing development. In our state survey, many reported that Zones with pre-existing development or that had pre-existing development opportunities were more likely to receive Opportunity Zone investment. Separately, officials from one state we interviewed said that areas receiving investment had pre-existing housing and shopping development and the incentive “turbocharged” ongoing development.
Access to infrastructure. Zones with access to infrastructure—such as public transportation or access to highways—were highlighted as more likely to receive investment. Officials from four states that we interviewed highlighted the importance of access to infrastructure in attracting Opportunity Zone investment. For example, officials from one state said that Zones need to have infrastructure that would be able to support investments so that they will be profitable. A representative from a development company who worked on Opportunity Zone investment projects highlighted the importance of local infrastructure for making investment site locations desirable for development, such as public transit and proximity to an airport.
Community support. In our state survey, some states reported that Zones with community support—such as committed, active local community government; proactive local leaders who market and further incentivize priority projects; and communities with other tools available (e.g., urban renewal authority, other state incentives)—were more likely to receive Opportunity Zone investment. Officials from one state we interviewed said Zones in their state that were proactive and supported Opportunity Zone incentive use have had successful investment projects completed, whereas other Zones’ communities which did not take a proactive approach were not aware of investment that they may have received.
In addition to those Zone characteristics, Opportunity Zone investment is also more likely to occur when Qualified Opportunity Funds are able to “stack,” or combine Opportunity Zone financing with other incentives, according to many fund representatives, state and local officials, and subject-matter specialists knowledgeable about the tax incentive. Local officials in one of our site-visit cities highlighted the importance of stacking incentives, such as Department of Housing and Urban Development or Department of Transportation grants and said that stacking can spur strategic development. A representative from one of our 16 selected funds said that as costs have increased, it has been harder for an Opportunity Zone investment in real estate development to make sense financially, so the fund has tried to combine the incentive with other tax incentives to ensure the project will be profitable. This fund combined Opportunity Zone investment with energy incentives, tax abatements, and other state and local incentives related to affordable housing, according to the representative.
Some subject-matter specialists knowledgeable about the tax incentive echoed this view and said the incentive is a “relatively shallow” incentive and combining it with other incentives can help make projects economically viable. These subject-matter specialists concluded that the Opportunity Zone incentive and other economic development incentives are complementary, not substitutes.
Stakeholders Reported Incentive Was Primarily Funding Real Estate Development
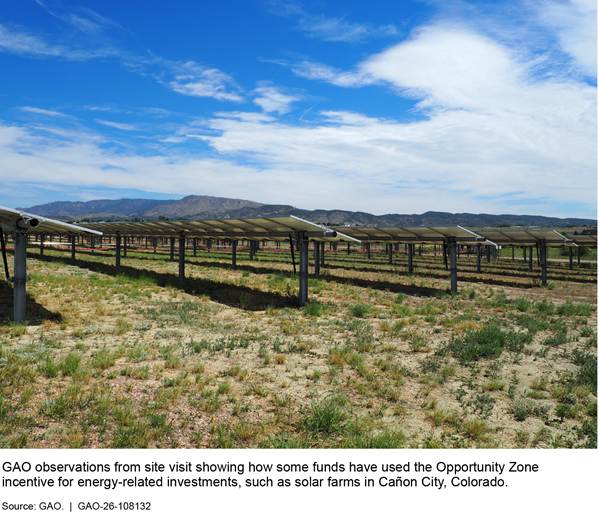
The Opportunity Zone incentive allows for diverse investments. As we previously reported, the incentive is being used to support various types of projects and operating businesses.[22] For example, some Qualified Opportunity Funds have used the Opportunity Zone incentive for energy-related investments, such as solar farms (see fig. 3).
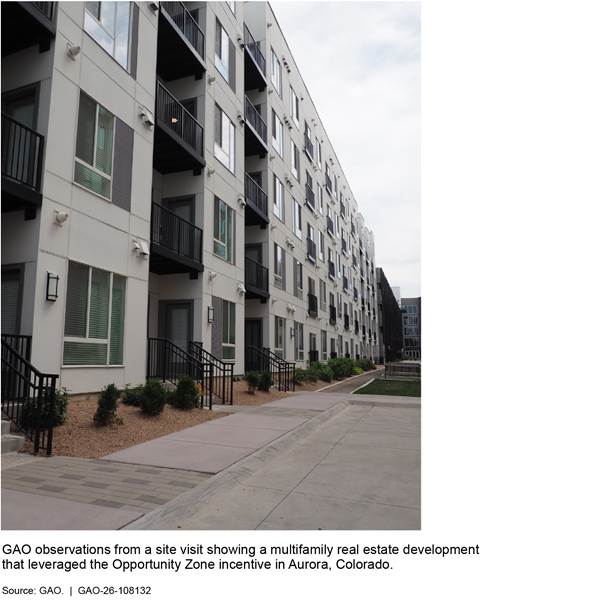
However, state and local officials, and subject-matter specialists said the incentive primarily funded real estate development based on their knowledge, and some said multifamily rental real estate development has been the largest use of the incentive.[23] One state reported in its survey response that real estate investments work better with the Opportunity Zone incentive’s substantial improvement requirement and 10-year hold requirement for special tax treatment. Figure 4 shows a multifamily real estate development that used Opportunity Zone investment.
According to our survey results and subject-matter specialists knowledgeable about the tax incentive, there can be challenges to using the Opportunity Zone incentive for making investments in operating businesses. In survey responses, four states highlighted the Opportunity Zone incentive rules as a challenge to investing in operating businesses. Subject-matter specialists said it is difficult for existing businesses to use Opportunity Zone investment capital to expand. In our survey, one state reported that the incentive’s rules create barriers for investing in existing businesses. A different state reported that the timelines for holding an investment to receive Opportunity Zone incentive benefits—10 years to permanently exclude resulting gains from income upon an election—align with real estate investment, but not with business investment. The state reported that enabling investors in operating businesses to hold those investments for less time but roll them over into another eligible Opportunity Zone incentive investment to meet the 10-year requirement could help address this challenge.
Stakeholder Perspectives Are Mixed on New Benefits for Rural Zones Investment
As described above, Opportunity Zone investment is more likely to occur in urban areas, but the revised incentive’s new benefits for investments in a new, rural class of Zones may drive additional investment to these areas, according to stakeholders we interviewed. Representatives from six of our 16 selected funds were interested in pursuing rural investments with the permanent Opportunity Zone tax incentive because these investments would be eligible for a 30 percent step-up in basis.[24] Some fund representatives told us the new lower substantial improvement requirement for rural property would make it easier to redevelop existing buildings. State and local officials from five different communities also highlighted new rural benefits as a potential positive change for their communities. For example, officials from one rural state told us that they think the new benefits may attract investment to their state and any additional development will make a large difference because of the state’s small population. Similarly, one state reported in our survey that rural areas are in need of more housing supply but may have been deemed risky for Opportunity Zone investment under the original incentive.
However, subject-matter specialists from one organization and representatives from four selected funds told us they do not expect the new rural incentives to meaningfully change investment patterns. For example, these subject-matter specialists said the incentive’s structure will not address hurdles that make rural development less attractive, such as depopulation in rural areas. It can be harder to develop and maintain multifamily real estate development, the type of investment that is perceived to be the most common for Opportunity Zone investment, in low-population areas. Representatives from one selected fund told us that while rural construction costs are similar to urban construction costs, rents are typically lower in rural areas, making it more difficult to recoup an investment.
Funds’ Experiences with the Original Incentive Varied; Revised Incentive May Address Some Challenges
Our selected funds reported varied experiences with the Opportunity Zone incentive. As of June 2026, progress in completing planned Opportunity Zone investment by our 16 selected Qualified Opportunity Funds varied, as shown in table 3.[25] At the time of our 2021 report, representatives from two selected funds told us they had completed development of their Opportunity Zone investments.[26] Since that time, nine more funds have fully developed their investment projects, according to fund representatives.
Table 3: Status of Selected Qualified Opportunity Funds’ Planned 2021 Opportunity Zone Projects, June 2026
|
Status of Planned 2021 Opportunity Zone Investments |
Number of Funds |
|
Completed development of all projects |
12 |
|
Completed development of some projects, others in progress |
2 |
|
Development of one project ongoing, abandonment of other planned project |
1 |
|
No longer pursuing use of Opportunity Zone incentive as enacted by the Tax Cuts and Jobs Act |
1 |
Source: GAO analysis of interviews with representatives from selected Qualified Opportunity Funds. | GAO‑26‑108132
Note: This table displays the status of selected Qualified Opportunity Funds’ planned investments at the time of our 2021 report. For more information on those planned investments see, GAO‑22‑104019.
A representative from one fund that developed a mixed-use (residential and commercial) development said the apartments in the mixed-use development are fully rented, most of the commercial storefronts are occupied, and the investment is generating cash flow. The fund representative said the incentive is straightforward and he did not encounter any challenges in using the incentive. Representatives from a different fund that completed all its projects stated they had difficulty fully leasing one of their developments because there was a large amount of Opportunity Zone investment in the area, resulting in an oversupply of housing. In contrast, representatives from a different selected fund said the fund was unable to raise capital to complete any of its initially planned Opportunity Zone projects and ultimately decided not to pursue use of the Opportunity Zone incentive.
While the incentive’s timing requirements continued to be cited as challenges to incentive use, many fund representatives said some of the challenges related to unfamiliarity with the incentive and uncertainty related to incentive rules had lessened over time. Representatives from three funds cited the requirement for Qualified Opportunity Funds to deploy capital within 6 months as a challenge in both 2021 and 2025.[27] Conversely, in 2021, representatives from five funds highlighted delayed guidance and uncertainty around the incentive as a challenge and representatives from three funds said they had to explain the incentive to potential investors. In 2025, representatives from one fund highlighted the delayed guidance as a challenge and representatives from a different fund said lack of understanding of incentive rules was a challenge.
Representatives from most selected funds found general economic conditions—rising costs, interest, and inflation—challenging to their Opportunity Zone development. Because the incentive is structured to provide a capital gains tax benefit after 10 years, projects must be successful and make a profit for investors to realize the value of a permanent exclusion on resulting capital gains. As costs increase, projects become less or no longer viable. Representatives from 12 funds cited rising costs as a challenge, and representatives from one fund explained that cost increases have made it difficult to manage multifamily real estate development. In particular, there has been inflation in labor costs and costs to replace building appliances, higher insurance payments in high-risk areas, and increases in capital costs, according to the fund representative. Representatives from eight funds cited higher interest rates as a challenge. For example, representatives from one fund explained that increased interest rates have made it difficult to refinance construction loans, which was the Qualified Opportunity Fund’s primary strategy for providing liquidity to investors in advance of the original incentive’s 2026 tax deferral coming due.
Representatives from seven of the 16 selected funds said they used the Opportunity Zone incentive to raise capital for and fund additional Opportunity Zone investment projects. Representatives from selected funds that did not continue to use the Opportunity Zone incentive cited various reasons, including tax complexity, inability to qualify for the step-up in basis on initially invested gains, and increased costs. Generally, the selected funds that continued to use the incentive raised capital to fund projects similar to their initial projects, such as multifamily housing, hotels, mixed-use, and commercial real estate projects.
Representatives from six of the seven funds that continued raising capital noted that the diminishing incentive benefits have also made it harder to raise capital. For example, representatives from one selected fund explained that the temporary status of the original Opportunity Zone tax incentive made it difficult to attract investors who had not invested by the end of 2019 or 2021 and had therefore missed the eligibility window for the 15 percent and 10 percent step-up in basis on the initially invested gains. Representatives further explained that new investment was also reduced in 2025 and 2026 because the temporary deferral of tax on invested gains is due in 2027 and this short period of time for the deferral is not much of a benefit.
The OBBBA’s change to make the Opportunity Zone incentive permanent with rolling deferral dates addressed some of the timing challenges of the original incentive, according to several fund representatives and subject-matter specialists we interviewed. Representatives from 11 selected funds highlighted permanency as a positive change to the incentive. For example, representatives from one fund explained that investors can now take their time to select projects rather than investing quickly to maximize time-dependent tax benefits. Similarly, subject-matter specialists we interviewed expect more consistent interest in Opportunity Zone investing as permanent tax benefits remain the same regardless of investment date. In particular, representatives from one subject-matter specialist organization said the rolling deferral date addresses the decay of the deferral benefit, which they characterized as the most significant timing challenge of the original incentive.
General Lack of Data Led to Uncertainty of Overall Use and Effects of the Original Incentive
States Reported More Uncertainty in Awareness of Opportunity Zone Investment Compared to 2020
More states reported uncertainty in awareness of Opportunity Zone investment in their states than in our 2020 survey. In our 2025 survey, there was an increase in 10 states reporting they were not sure if there was Opportunity Zone investment activity in their states. There was also an increase in states reporting they were not aware of investment activity, as shown in figure 5.[28]
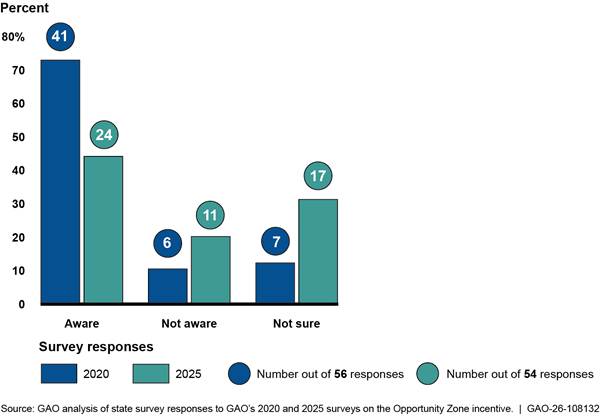
Note: This graphic is based on state survey responses to GAO’s 2020 and 2025 surveys. GAO surveyed officials from the 50 states, Washington, D.C., and the five U.S. territories—American Samoa, Guam, the Commonwealth of the Northern Mariana Islands, Puerto Rico, and the U.S. Virgin Islands. In 2020, GAO received responses from all 56 states and territories. In 2025, GAO received responses from 54 of the 56.
There are different reasons a state could change from being aware of Opportunity Zone investment in 2020 to being unsure or not being aware of investment in 2025. For example, states may not know the outcome of Opportunity Zone projects that were in development in 2020. One of the states that reported being aware of a project in 2020 and not in 2025 was aware of a project that had not yet closed at the time of our 2020 survey. It is possible this project did not ultimately begin development. Separately, an official from a different state told us one of the potential Opportunity Zone projects he had been aware of in 2020 planned to have a winery on site. While the project was completed, he was unsure if it ended up being able to use Opportunity Zone investment because the law prohibits some stores that sell alcoholic beverages from being Qualified Opportunity Zone Businesses.[29]
States do not have complete awareness of investments. As discussed above, there is no public listing of all Opportunity Zone investments and funds do not have to report publicly or to state and local officials whether their investments are using Opportunity Zone capital. Of the 24 states aware of Opportunity Zone investment, 22 reported that there is likely other Opportunity Zone investment of which they are unaware. This aligns with what Qualified Opportunity Fund representatives told us: representatives from eight of our selected funds did not pre-emptively promote with state or local officials that their development was using Opportunity Zone capital and representatives from 13 of our selected funds reported that the funds were not publicly reporting information about their investments.
Many states also reported less outreach and education related to the Opportunity Zone incentive in 2025 than in 2020, which could contribute to less awareness of investment. For example, officials from one state told us that there was early excitement surrounding the incentive and their office devoted resources to Opportunity Zone activities. However, as the state’s priorities shifted over time and officials had to balance their resources across all the programs the office oversees, the state conducted fewer Opportunity Zone incentive-related activities.
Stakeholders Reported Uncertainty of the Original Incentive’s Overall Effects, but Cited Housing and Jobs as Benefits
Uncertainty of Incentive’s Overall Effects
Since our 2020 survey, an increased number of states reported being unsure of the Opportunity Zone incentive’s overall effect on their states. In 2020, 20 states reported the incentive had an overall positive effect and 20 states reported not being sure of the effect. In 2025, 11 states reported an overall positive effect and 29 reported being unsure of the overall effect, as shown in figure 6.
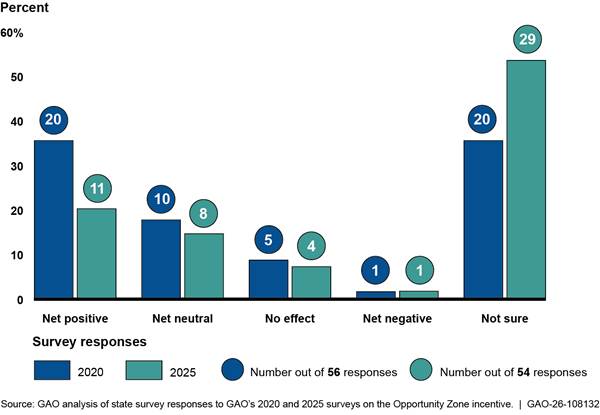
Note: This graphic is based on state survey responses to GAO’s 2020 and 2025 surveys. GAO surveyed officials from the 50 states, Washington, D.C., and the five U.S. territories—American Samoa, Guam, the Commonwealth of the Northern Mariana Islands, Puerto Rico, and the U.S. Virgin Islands. In 2020, GAO received responses from all 56 states and territories. In 2025, GAO received responses from 54 of the 56.
Most states reported they were not sure of the incentive’s effect on economic outcomes—poverty, income levels, unemployment rate, job creation, education levels, housing stock, supply of affordable housing, housing prices, and migration to and from the census tract—in their states. In an open-ended survey question, eight states raised the lack of data on Opportunity Zone investments as a reason for not being aware of the incentive’s effects. See figure 7 for state survey responses on Opportunity Zone investment’s effect on selected outcomes.
Figure 7: States’ Views of Effect of Opportunity Zone Investment on Selected Outcomes in Their States, 2025
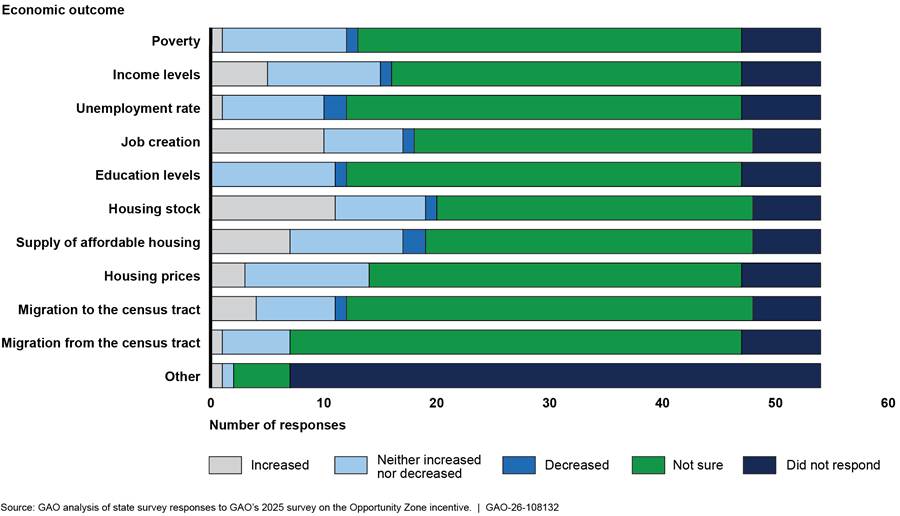
Notes: In this report, GAO is using the term “states” to refer to the 50 states, Washington, D.C., and the five U.S. territories—American Samoa, Guam, the Commonwealth of the Northern Mariana Islands, Puerto Rico, and the U.S. Virgin Islands. GAO surveyed state officials and received responses from 54 of the 56 states. This survey question asked respondents if Opportunity Zone investment had substantially increased, increased, neither increased nor decreased, decreased, or substantially decreased the selected economic outcomes listed above. This figure combines “substantially increased” and “increased” into “increased” and combines “substantially decreased” and “decreased” into “decreased.”
Largely unchanged from what we found in 2021, most of our 16 selected Qualified Opportunity Funds were not publicly providing detailed reporting on specific investment outcomes for their Opportunity Zone investments, according to fund representatives.
Jobs, Housing, and Other Benefits
While states and our selected Qualified Opportunity Funds were generally not tracking specific outcomes related to the Opportunity Zone incentive, many states and representatives from many of our selected funds cited new jobs and housing development as benefits of Opportunity Zone investments. Fourteen of the 24 states that reported they were aware of investment stated that investments from Qualified Opportunity Funds had affected job creation, housing, or both.
Job Creation. Eight states reported that the incentive increased job creation. Some of the jobs created were temporary, such as construction jobs, and others are permanent, such as apartment management, according to fund representatives. States also reported job growth in non-real estate industries. One state reported that manufacturing and distribution investments have increased the number of jobs in Qualified Opportunity Zones (Zone). A different state estimated the incentive led to more than 150 new jobs per Zone that are concentrated in utilities, finance and insurance, transportation, and warehouse industries.
Housing. Eleven states reported that the incentive increased housing stock and seven states reported that the incentive increased the supply of affordable housing. One state reported that the incentive’s most substantial effect has been an increase in the supply of market rate and workforce housing. A different state reported that Opportunity Zone investment enabled repair and renovation of distressed buildings that increased the supply of badly needed residential housing units.
Increased housing can help meet states’ development needs, and state and local officials we interviewed generally cited the need for more housing in their communities. An official from one state told us their state was experiencing a housing crisis and would need about 10,000 new houses in the next 5 years. The official further cited the Opportunity Zones tax incentive’s effect on increasing housing development nationally and planned to focus on attracting that kind of investment going forward.
Other benefits. Some other lesser-cited benefits included redevelopment of obsolete and underutilized property, increased tax revenue for local communities, increased health services for the community, and safety and aesthetic improvements of surrounding areas. For example, in our state survey, one state reported that the incentive has spurred redevelopment and was key to moving projects forward. A different state reported that the incentive led to improved quality of life and vibrancy in downtown areas. Representatives from one selected fund described improvements they made to their development’s surrounding area, such as improving the road and sidewalk. See figure 8 for a comparison of an unimproved road section and the road and sidewalk where improvements occurred.
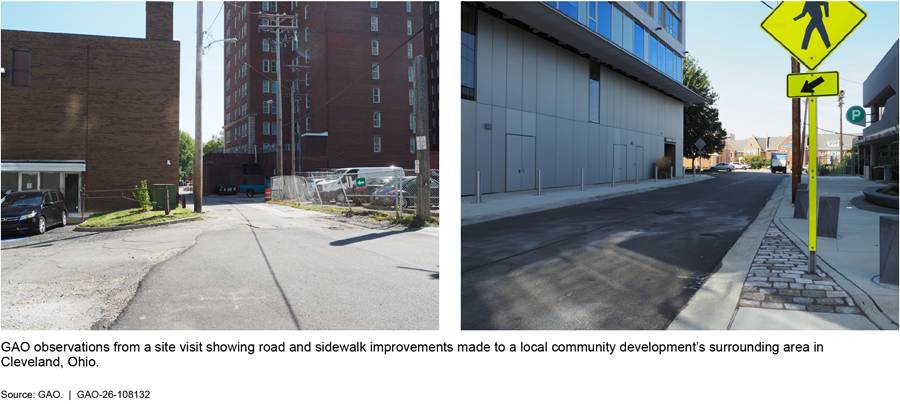
Changes to the Incentive May Lessen Some Challenges States Faced
States Benefit from Longer Time Frame to Identify New Zones
The original incentive as enacted by TCJA generally provided state governors with 90 days, beginning on the date of enactment of the law, to nominate census tracts to be designated by Treasury as Opportunity Zones. While OBBBA similarly provided governors with a 90-day window to make nominations for the next round of Zones, this window opened almost one year after OBBBA was enacted. Officials from five communities told us that the short time frame for nomination under the original Opportunity Zone tax incentive was a challenge or that the longer time frame to prepare for nomination under the permanent Opportunity Zone tax incentive would be an improvement.
Additionally, some states highlighted the limited information available during the original nomination period as a challenge. As we previously reported, IRS and Treasury did not publish the list of eligible census tracts and guidance for nominating Zones until February 2018, partway through the nomination process.[30] IRS and Treasury published the proposed rulemaking for the original Opportunity Zone incentive in October 2018, after the 2018 designation period ended.[31] They published the final rule in January 2020.[32]
As shown in figure 9, OBBBA provides states with more time to identify and nominate census tracts to be designated as Zones.
Figure 9: Timeline of Original and Revised Qualified Opportunity Zone Nomination and Designation Processes
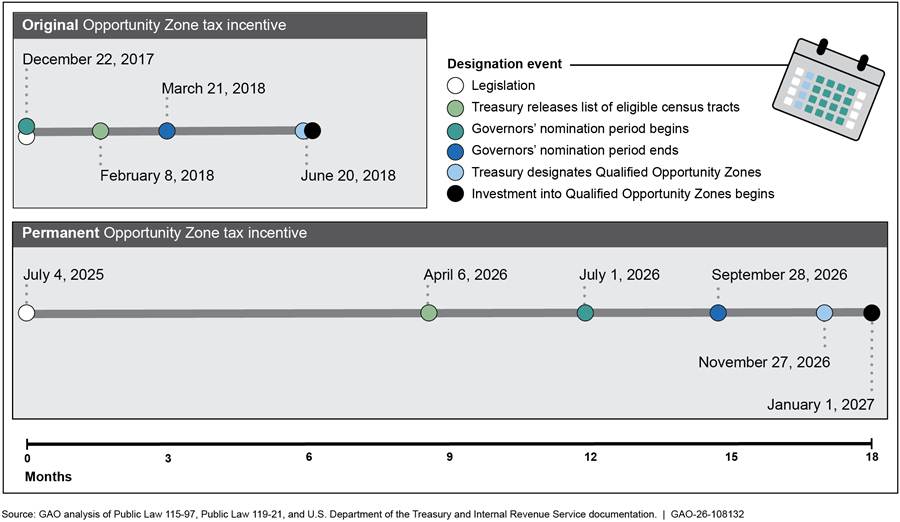
Note: Governors may request, and receive, a 30-day extension to the 90-day nomination period beginning July 1 and ending September 28, which would conclude, at the latest, on October 28, 2026. Governors may also request, and receive, a 30-day extension of the designation period beginning October 28 and ending November 27, which would conclude, at the latest, on December 28, 2026.
Given the additional time to prepare for the Opportunity Zones nomination period and governors’ experience with the actual use cases of the incentive over the past few years, subject-matter specialists knowledgeable about the tax incentive told us they expect governors to be more deliberate with their 2026 census tract nominations than they were in 2018. Consistent with this, officials from one state said that their state prioritized nominating tracts from a variety of geographic regions in 2018, but this approach resulted in selecting several Zones that were not a good fit for Opportunity Zone investment. For example, the Zones had geographic characteristics, like rocky ground, that made development difficult. Officials from another state told us that using basic eligibility criteria to select Zones in the original nomination period resulted in some designated Zones that were mostly established residential areas. Going forward they will aim to select nonresidential areas that have potential for redevelopment or new development, because officials believe those tracts are where Opportunity Zone investment has occurred and can still benefit adjacent residential tracts.
New Reporting Could Help States Make More Informed Tract Selection Decisions
For states or communities that wanted to take an active approach to encouraging Opportunity Zone investment in their jurisdictions, the lack of information on the type and location of funds’ investments could have limited states’ ability to do so. This, in turn, may have hampered Opportunity Zone investment in their jurisdictions.
State and local officials told us that their general impressions of Opportunity Zone incentive use and resulting development are anecdotal. They said the lack of specific data created challenges, consistent with what many states reported in their survey responses. For example, officials from one state told us that the lack of data on the incentive made it difficult for them to understand whether their Opportunity Zone education and outreach activities have been successful in attracting investment to the state. Officials from two other states told us that they would have liked to be able to contact Qualified Opportunity Funds to offer additional state incentives, but they were unaware of which funds were making investments in their states.
According to officials from states we interviewed, the lack of data on investment created challenges for states to determine which census tracts to nominate in the 2026 designation process. In our interviews with officials from six states, these officials described a preference to nominate census tracts that would be attractive to investors as Zones. However, these officials also noted that the lack of data on existing investments made it difficult for them to understand where these investments were occurring. Without this type of information on the location of existing investments, officials from one state told us it was hard to identify characteristics of census tracts that were a good fit for the Opportunity Zone incentive.
OBBBA introduced reporting requirements for Qualified Opportunity Funds and for Treasury that will provide some new information on incentive use, such as the characteristics of funds’ business and investment activity, and the economic effect of designation on Zones. Specifically, Qualified Opportunity Funds are now required to file returns annually on the value of assets, the value of the investment, housing data associated with investments if applicable, and full-time employment data.[33] These annual returns will provide IRS and Treasury with information on characteristics of investments, but annual returns are generally not made available to the public. Treasury is required to publicly report annually on Qualified Opportunity Fund characteristics, such as the number of Qualified Opportunity Funds and amounts of investment made in these funds, and, beginning in the 6th year, on the effects of designation as measured by economic indicators.
Many of the state officials we spoke with welcomed additional federal reporting requirements and said information on investments could help states and localities identify successful Zones and prepare for the Zone designation process.
While the new required information reporting could be used to evaluate the effects of the incentive, there may be limitations to using this information to help state officials identify specific tracts that would be a good fit for Zone designation and support investments in their jurisdictions. In particular, Treasury’s ability to report additional information on Opportunity Zone incentive use and outcomes using taxpayer data could be constrained by taxpayer privacy safeguards.[34] In general, federal tax information including information collected or generated by the IRS from tax and information returns, is protected from disclosure; however, certain information can be disclosed if the data are in a form that cannot be associated with, or otherwise identify, directly or indirectly, a particular taxpayer.[35] In practice, this means that nationwide or state-level data involving at least 20 investments can be disclosed in aggregate form, according to IRS.
In the context of Opportunity Zones, this means IRS could not share estimated state-level summary information with us about property directly owned or leased by Qualified Opportunity Funds in tax year 2023. However, it was able to share estimates of the number and value of investments and value of property owned or leased by Qualified Opportunity Zone Businesses in all states except Illinois, because Illinois had fewer than 20 such estimated investments.[36] For those states with 20 or more investments that could be reported at the state level, it is unclear whether or how many of those investments were concentrated in the same Zones. If a Zone received fewer than 20 investments, IRS would not be able to publicly report on investments at the Zone level. However, Treasury officials told us that they will publicly report census tract locations of investments at a level of aggregation consistent with taxpayer confidentiality, and their ability to report at more granular levels has increased as more investors and funds have participated in the incentive.
Agency Comments
We provided a draft of this report to the Departments of Housing and Urban Development and the Treasury, Internal Revenue Service, and Community Development Financial Institutions Fund for review and comment. IRS provided technical comments, which were incorporated, as appropriate. The Departments of Housing and Urban Development and the Treasury and the Community Development Financial Institutions Fund did not have any comments on our draft report.
We are sending copies of this report to the appropriate congressional committees, the Secretary of Housing and Urban Development, the Secretary of the Treasury, the Commissioner of Internal Revenue, the Director of the Community Development Financial Institutions Fund, and other interested parties. In addition, the report is available at no charge on the GAO website at https://www.gao.gov.
If you or your staff have any questions about this report, please contact me at LucasJudyJ@gao.gov. Contact points for our Offices of Congressional Relations and Media Relations may be found on the last page of this report. GAO staff who made key contributions to this report are listed in appendix V.
Jessica Lucas-Judy
Director, Tax Issues
Strategic Issues
List of Requesters
The Honorable Mike Crapo
Chairman
The Honorable Ron Wyden
Ranking Member
Committee on Finance
United States Senate
The Honorable Jason Smith
Chairman
The Honorable Richard E. Neal
Ranking Member
Committee on Ways and Means
House of Representatives
The Honorable Cory A. Booker
United States Senate
The Honorable Charles E. Grassley
United States Senate
The Honorable Tim Scott
United States Senate
This report describes (1) Qualified Opportunity Zones’ (Zone) characteristics and how the revised incentive under the One Big Beautiful Bill Act (OBBBA) could affect characteristics of future Zones; (2) the experiences of states, funds, and other stakeholders with the original incentive and perspectives on how the revised incentive may affect future investment activity; (3) stakeholders’ awareness of the original incentive’s effects on communities; and (4) changes to the incentive enacted in OBBBA and the extent to which those changes address previous challenges faced by states.
To describe Zones’ characteristics and how the revised incentive could affect characteristics of future Zones, we analyzed Department of the Treasury and Internal Revenue Service (IRS) guidance; the Tax Cuts and Jobs Act (TCJA); Public Law 119-21, commonly known as OBBBA; and relevant federal regulations; and interviewed subject-matter specialists knowledgeable about the tax incentive from five organizations.
We also analyzed American Community Survey (ACS) data. ACS is a nationwide annual survey conducted by the U.S. Census Bureau. It is designed to provide communities with reliable and timely social, economic, housing, and demographic data.[37] Specifically, we analyzed 2020-2024 ACS data to describe the characteristics of census tracts, including tracts that were designated as Zones, and tracts eligible for the second round of Zone designation. This analysis was limited to the 50 states, the District of Columbia, and Puerto Rico, but excludes the other territories, which are not covered by the Census American Community Survey. We used 2020-2024 data because they were the most recent at the time of our analysis. For each of those categories of tracts, we calculated the average of various economic and demographic characteristics.
Because the ACS is based on a probability sample, estimates produced from these data are subject to sampling error. We express our confidence in the precision of our results with respect to a 90 percent confidence interval. This is the interval that would contain the actual population value for 90 percent of the samples that could have been drawn.
Opportunity Zones were originally designated using the census tract boundaries from the 2010 Census. These boundaries were updated following the 2020 Census, and the 2020-2024 ACS uses these updated boundaries.[38] We matched census tracts using the 2020 boundaries to the 2010 boundaries, considering a new census tract to be an Opportunity Zone if the majority of land area of the new census tract was in a designated Opportunity Zone under the old census tract boundaries. If the tract remained the same between 2010 and 2020 the Opportunity Zone was matched directly to the ACS data. Because the boundaries of census tracts have changed since their original designation, we do not present counts of census tracts in this report, and any summary statistics based on the original Opportunity Zone designation should be considered approximations based on the matching between the 2010 and 2020 census tract boundaries.
We found the ACS data elements used for our engagement sufficiently reliable to describe Zone characteristics. To assess the data’s reliability, we reviewed related documentation and reviewed our prior analysis of Zones using ACS data.[39]
We also analyzed TCJA and OBBBA to identify program requirements and the changes OBBBA made to the original incentive with respect to the eligibility criteria for census tracts to be nominated and designated as Zones. We interviewed state officials and subject-matter specialists to understand how the revised incentive’s eligibility criteria could affect the characteristics of future Zones and future use of the incentive. We selected five organizations with subject-matter specialists knowledgeable about the tax incentive based on knowledge from our prior Opportunity Zones work and review of online Opportunity Zones resources. These organizations provide tax and accounting professional services, conduct research, or provide advocacy related to the Opportunity Zone tax incentive and economic development more generally.
To describe the experiences of states, Qualified Opportunity Funds, and other stakeholders with the original incentive and perspectives on how the revised incentive may affect future investment activity, we conducted a survey of states, U.S. territories, and Washington, D.C.; interviewed Qualified Opportunity Fund representatives from our case studies, state and local officials, and subject-matter specialists; and conducted site visits of selected Opportunity Zone investment projects.
Survey of states. We surveyed officials in the 50 U.S. states, Washington, D.C., and the five U.S. territories—American Samoa, Guam, the Commonwealth of the Northern Mariana Islands, Puerto Rico, and the U.S. Virgin Islands (hereafter states)—to understand state experiences with the Opportunity Zones incentive.[40]
To identify relevant state officials and develop our questionnaire, we built off our prior work where we conducted a state survey on the Opportunity Zone tax incentive in 2020.[41] Because we hoped to be able to identify how, if at all, states’ experiences with the Opportunity Zone incentive had changed since our initial audit work in 2021, we re-used our original survey questionnaire, with slight modifications, to collect information we could analyze longitudinally.
For the 2020 survey, we selected the state level as the ideal unit of analysis because of the manageable population size, likelihood of experience with the Opportunity Zones tax incentive, and inclusivity of multiple regions and types of investment areas (e.g., urban v. rural). Because we wanted to analyze results longitudinally, where possible, we identified the 2021 survey respondents as our 2025 state survey recipients. If the 2021 respondent was no longer with the state agency, we identified relevant state officials by searching the agencies’ websites to identify the Opportunity Zones incentive contact. If there was no designated contact, we selected the supervisor of the department in which Opportunity Zones or similar incentives were described on the site.
We took steps in developing the questionnaire, collecting the data, and analyzing them to minimize nonsampling error. For example, survey specialists designed the questionnaire in collaboration with staff who had subject matter expertise. Then we pretested the draft questionnaire with state officials to ensure that the questions were relevant, clearly stated, and easy to understand.
We chose three states with which to pretest, including one state that appeared to be actively promoting use of the Opportunity Zones tax incentive within its state and one state that did not appear to be actively promoting the incentive, to ensure our questions were specific enough to be meaningful but general enough to be understood across the variation of state experiences with this incentive.
We revised the questionnaire considering feedback from pretests, as well as comments from an internal survey expert. To see a copy of the questionnaire used for this study, see appendix IV.
We administered a web-based survey. We launched the survey on June 4, 2025, and conducted email and telephone follow-up until we closed the survey on October 1, 2025. We received responses from 54 of 56 states—all states except New York and North Carolina.
We analyzed the survey responses to identify states’ views and experiences with the Opportunity Zones incentive, including the types of projects being funded using Opportunity Zones investment, the incentive’s overall effect, challenges to using the incentive, and state efforts to encourage its use. To characterize state views throughout this report, we defined modifiers (e.g., “most”) to quantify views as follows:
· “nearly all” represents 48 or more states,
· “most” represents 27 to 47 states,
· “many” represents 10 to 26 states, and
· “some” represents three to nine states.
To supplement the survey and to elaborate on survey responses, we randomly selected five states with which to conduct follow-up interviews. These interviews helped us obtain a more detailed understanding of states’ experiences with the Opportunity Zone tax incentive and gain insight on their views of the revised incentive and plans for the 2026 Zone nomination process and future Opportunity Zone incentive activities.
Qualified Opportunity Fund case studies and site visits. We conducted semi-structured interviews with fund representatives from 16 of the 18 Qualified Opportunity Funds we selected for case studies for our 2021 Opportunity Zones report. We did this to understand their experience using the Opportunity Zones tax incentive and perspectives on the revised incentive.[42] For our 2021 work, we randomly selected 18 funds for nongeneralizable case studies using Qualified Opportunity Funds identified through our 2020 state survey, public information (e.g., online listings, a report from a White House Council), and Securities and Exchange Commission filings.[43] For that work, we used a purposeful, stratified random sampling methodology to select Qualified Opportunity Funds for case studies to ensure we examined a range of characteristics, including a variety of investment approaches and projects.
We analyzed the interview content from these fund representatives to identify fund representatives’ experiences using the incentive, the types of projects being funded using Opportunity Zones investment, benefits from the incentive, challenges to using the incentive, and how changes to the incentive could affect future investment and incentive use. To characterize fund representatives’ views throughout this report, we defined modifiers (e.g., “most”) to quantify representatives’ views as follows:
· “nearly all” represents more than 13 representatives,
· “most” represents 10 to 13 representatives,
· “many” represents six to nine representatives, and
· “some” represents two to five representatives.
The results from this nongeneralizable sample cannot be used to make inferences about all Qualified Opportunity Funds.
We conducted site visits to seven Qualified Opportunity Funds’ investment sites to observe completed and in-process projects to better understand how the incentive is being used. We visited sites in Colorado, Ohio, and Maryland. We also observed the surrounding geographic areas to better understand Zone characteristics. During these site visits we interviewed fund representatives, developers, and on-site management, as well as state and local government officials and other Opportunity Zone incentive stakeholders. We selected sites to visit prioritizing our ability to (1) hold in-person meetings with fund representatives and state and local government officials, (2) visit multiple sites in the same trip, (3) observe a variety of fund and investment characteristics, and (4) visit investments from multiple selected funds.
In addition, we conducted a more limited site visit to a select site in Massachusetts to observe a completed project and gather information about Zone characteristics. For this site visit, we did not conduct any interviews. We selected this location based on geographic proximity to our staff locations and to help report on a range of characteristics of Opportunity Zone investments.
Analysis of TCJA and OBBBA and stakeholder interviews. We analyzed TCJA and OBBBA and interviewed Opportunity Zone incentive stakeholders to determine changes to the incentive that could affect incentive use. We also interviewed Opportunity Zone incentive stakeholders—states and local officials, Qualified Opportunity Fund representatives, and subject-matter specialists knowledgeable about the tax incentive—to understand their perspectives on how the revised incentive may affect future incentive use and investment activity.
We also analyzed TCJA and OBBBA to identify the program requirements and changes OBBBA made to the incentive with respect to the eligibility criteria for census tracts to be nominated and designated as Zones. We interviewed relevant Opportunity Zone incentive stakeholders, including subject-matter specialists and fund representatives, to understand how the revised incentive’s eligibility criteria could affect the characteristics of future Zones and future use of the incentive.
To describe stakeholders’ awareness of the original incentive’s effects on communities, we conducted a survey of states; interviewed Qualified Opportunity Fund representatives from our case studies, state and local officials, and subject-matter specialists knowledgeable about the tax incentive; and conducted site visits of selected Opportunity Zone investments. In our survey of states, described above, we asked state officials (1) how, if at all, investments by Qualified Opportunity Funds affected economic outcomes in Opportunity Zones; (2) to describe the overall effects that an Opportunity Zone designation has had on designated census tracts receiving investment; and (3) if the federal Opportunity Zone designation had a positive or negative effect on the state.
Additionally, we asked Qualified Opportunity Fund representatives we met with for our case studies to describe what, if any, benefits to the community have come from the fund’s investment and what, if any, state or local community reaction to the investment has been. In our interviews with state and local government officials and subject-matter specialists knowledgeable about the tax incentive, we also asked their perspective on the incentive’s effects on communities. We analyzed state survey responses and Qualified Opportunity Fund representatives’, state and local government officials’, and subject-matter specialists’ statements to identify any commonalities or differences in their perspectives on the incentive’s effects on communities. We also observed Opportunity Zone investments and the surrounding areas during our site visits.
To describe changes to the incentive enacted in OBBBA and the extent to which the revised incentive addressed previous challenges faced by states, we interviewed state and local government officials and officials from Treasury, IRS, the Department of Housing and Urban Development, and the Community Development Financial Institutions Fund and analyzed state survey responses, TCJA, OBBBA, and publicly available information on the incentive. We interviewed Community Development Financial Institutions Fund officials because the Community Development Financial Institutions Fund oversees the nomination tool for governors to use to nominate census tracts to be designated as Qualified Opportunity Zones on behalf of Treasury. We interviewed Department of Housing and Urban Development officials because the Secretary previously served as the Executive Director for an interagency working group to promote the Opportunity Zone incentive, and some department staff have been conducting Opportunity Zone incentive-related work. We also analyzed the results from our 2025 state survey and interviewed selected state and local government officials about the challenges they faced nominating census tracts for designation as Zones and understanding investment in designated Zones in their jurisdictions. We analyzed TCJA and OBBBA to identify changes to the incentive that could address challenges.
We conducted this performance audit from February 2025 to August 2026 in accordance with generally accepted government auditing standards. Those standards require that we plan and perform the audit to obtain sufficient, appropriate evidence to provide a reasonable basis for our findings and conclusions based on our audit objectives. We believe that the evidence obtained provides a reasonable basis for our findings and conclusions based on our audit objectives.
For our 2021 Opportunity Zones report, we selected 18 Qualified Opportunity Funds for case studies using a purposeful, stratified random sampling methodology to ensure that we examined a range of characteristics, including a variety of investment approaches and projects.[44] For this report, we followed up with these funds and interviewed representatives from 16 of them.[45] The case studies are not generalizable to the entire population of Qualified Opportunity Funds.
Below we present some characteristics of these funds and describe experiences they identified using the Opportunity Zone tax incentive, including 2021 planned investments and their status, challenges they encountered using the incentive, if they continued to raise Opportunity Zone capital for new projects after our 2021 audit work, and if they plan to use the incentive as revised by the One Big Beautiful Bill Act (hereafter revised incentive) to fund development projects or invest in operating businesses.
|
FUND A: COMMERCIAL REAL ESTATE DEVELOPMENT (INVESTMENT CENSUS REGION: SOUTH) |
|
|
No photograph available |
2021 plan for incentive use: In 2021, this fund intended to develop a mobile home park with amenities and a multi-acre warehouse business park in a separate location. Status of planned investments: Plans to divest of one planned investment (mobile home park) and develop the second investment (business park) Reported challenges: (1) misalignment of benefit timing, (2) short window to be eligible for step-up in basis on invested gains, (3) development timing requirements, (4) general economic conditions, and (5) change in local conditions Continued use of original incentive: No Plan to pursue use of revised incentive: No |
|
FUND B: REAL ESTATE DEVELOPMENT (Investment Census region: West) |
|||||
|
|
2021 plan for incentive use: Developing a small apartment building and updating an existing retail strip center on the same property. Status of planned investments: Completed Reported challenges: None Continued use of original incentive: No Plan to pursue use of revised incentive: No |
||||
|
FUND C: RESIDENTIAL REAL ESTATE DEVELOPMENT (INVESTMENT CENSUS REGION: WEST) |
|||||
|
|
2021 plan for incentive use: Was finishing development of three apartment buildings that it acquired mid-development or near-completion. Status of planned investments: Completed Reported challenges: (1) lack of Internal Revenue Service guidance early in the incentive’s life cycle, (2) incentive timing requirements that funds deploy capital within 6 months, and (3) general economic conditions Continued use of original: Yes Plan to pursue use of revised incentive: Yes |
||||
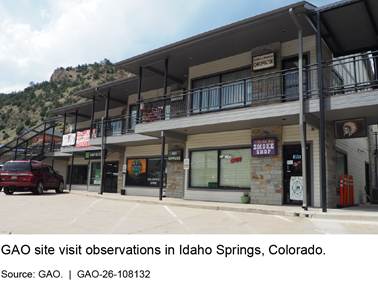
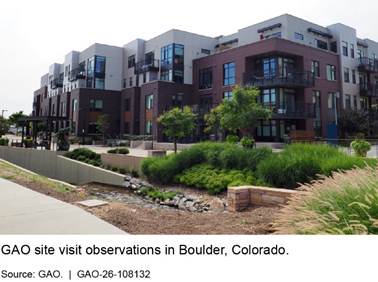
|
FUND D: COMMERCIAL REAL
ESTATE: AGRICULTURAL LAND IMPROVEMENTS |
|
|
No photograph available. |
2021 plan for incentive use: Planned to improve agricultural land and then lease it out to farmers. Status of planned investments: Completed Reported challenges: (1) lack of clarity in regulations, (2) difficulty explaining incentive rules to investors, and (3) difficulty determining structure to be able to return capital to investors in 2026 Continued use of original incentive: No Plan to pursue use of revised incentive: Yes |
|
FUND E: OPERATING
BUSINESS/RENEWABLES AND RESIDENTIAL AND MIXED-USE REAL ESTATE |
|
|
No photograph available. |
2021 plan for incentive use: Intended to invest in multiple businesses focusing on renewable energy, such as a business collecting and processing seaweed into sustainable products, a solar energy business, and battery storage. Status of planned investments: One operating business investment (renewables) is active and provides solar panels and batteries; one operating business not successful; and three real estate development projects in or approaching construction Reported challenges: (1) 180-day window for investors to invest their gains in a Qualified Opportunity Fund, (2) incentive timing requirements that funds deploy capital within 6 months, (3) uncertainty about the future of the incentive, (4) lack of understanding of incentive rules, (5) cancellation or delay in federal funding for renewable energy projects, and (6) general economic conditions Continued use of original incentive: Yes Plan to pursue use of revised incentive: Yes |
|
FUND F: HOSPITALITY REAL
ESTATE DEVELOPMENT |
||
|
|
2021 plan for incentive use: Was developing more than 10 hotel properties across the country. The first of these opened in March 2020 and the fund expected the last of these to open in 2023. Status of planned investments: Completed Reported challenges: general economic conditions Continued use of original incentive: Yes Plan to pursue use of revised incentive: Yes
|
|
|
FUND H: COMMERCIAL REAL
ESTATE DEVELOPMENT |
||
|
|
2021 plan for incentive use: Developed an industrial warehouse speculatively (without a committed tenant). The fund will finish the site when it has a tenant so it can customize it accordingly. Status of planned investments: Completed Reported challenges: (1) need to have capital gains to be eligible to receive tax benefits, (2) incentive rules related to triple net leases, and (3) general economic conditions Continued use of original incentive: Yes Plan to pursue use of revised incentive: Yes |
|
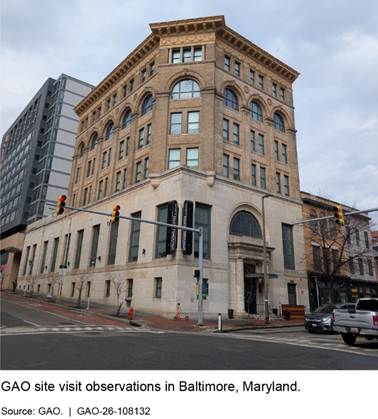
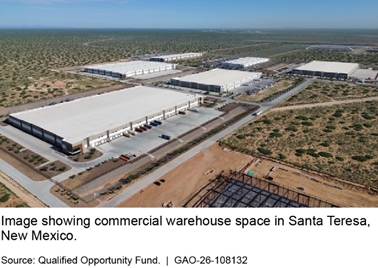
|
FUND I: REAL ESTATE
DEVELOPMENT |
||
|
|
2021 plan for incentive use: Was developing nine apartment buildings—mainly midrise or garden style—that would have between 200 and 500 units each. Status of planned investments: Completed Reported challenges: (1) “slow down” in capital gains invested in Qualified Opportunity Funds as the step-up in basis on invested gains lessened and expired, as well as the date for paying deferred taxes approached; (2) incentive rules related to triple net leases; (3) incentive rules related to “sin” businesses; (4) limitations on reinvestment of gains; (5) qualified opportunity zone business rules; and (6) general economic conditions Continued use of original incentive: Yes Plan to pursue use of revised incentive: Yes |
|
|
FUND J: MIXED-USE REAL
ESTATE DEVELOPMENT |
||
|
|
2021 plan for incentive use: Invested in the development of an apartment building with commercial real estate on the first floor on a formerly vacant brownfield site. Status of planned investments: Completed Reported challenges: (1) short window to be eligible for step-up in basis on invested gains, (2) uncertainty about the new round of Opportunity Zone designations, (3) projects need to appreciate in value, and (4) general economic conditions Continued use of original incentive: Yes Plan to pursue use of revised incentive: Yes |
|
|
FUND K: HOSPITALITY REAL
ESTATE DEVELOPMENT |
||
|
No photograph available |
2021 plan for incentive use: Was investing in the development of a hotel. The development was ongoing and expected to be completed in spring 2022. Status of planned investments: Completed Reported challenges: (1) lack of guidance early in incentive life cycle, and (2) incentive rules related to prior land ownership Continued use of original incentive: No Plan to pursue use of revised incentive: Unknown |
|
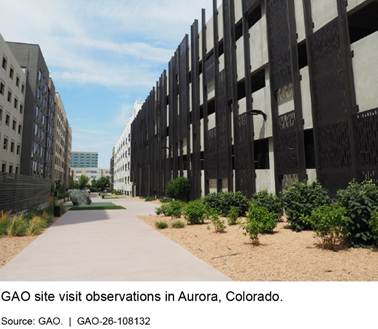
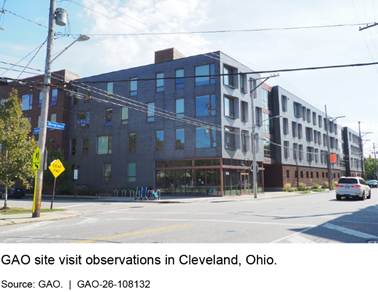
|
FUND L: COMMERCIAL AND
RESIDENTIAL REAL ESTATE DEVELOPMENT |
|
|
|
2021 plan for incentive use: Had invested in five projects as of April 2021, including the development of an industrial warehouse building, three apartment buildings, and a lab/life science development. The fund planned to invest in two or more other projects depending on the final amount raised. Status of planned investments: As of July 2026, the Fund is fully invested, and had acquired eight development sites, of which six were completed and two remain in a pre-development phase. Reported challenges: (1) regulation timing (delay in issuance of tax regulations), (2) incentive timing requirements that funds deploy capital within 6 months, (3) the requirement to hold investment for 10 years to receive full benefits, (4) the risk that capital gains tax rate increases in 2026, (5) the 30-month development horizon, (6) the substantial improvement requirement, (7) that not all projects are suitable for Opportunity Zone incentive investment, and (8) general economic conditions Continued use of original incentive: No Plan to pursue use of revised incentive: Unlikely |

|
FUND M: MIXED-USE REAL
ESTATE DEVELOPMENT |
|
|
No photo available – no Opportunity Zone investments developed. |
2021 plan for incentive use: Expected to finance between 10 and 12 mixed-use real estate projects. These developments would be on or near Historically Black Colleges and Universities and could include grocery stores, health care facilities, housing, and hotels. Status of planned investments: None developed Reported challenges: (1) competition with other funds for investors, (2) need to have capital gains to be eligible for tax benefits, (3) short window to be eligible for step-up in basis on invested gains, (4) eligibility criteria for census tracts to be designated Zones, and (5) lack of general oversight Continued use of original incentive: No Plan to pursue use of revised incentive: Yes |
|
FUND O: COMMERCIAL,
RESIDENTIAL, AND MIXED-USE REAL ESTATE DEVELOPMENT |
|
|
|
2021 plan for incentive use: Was investing in 10 different projects, including a commercial building that would be anchored by a hospital center, a workforce housing apartment building, and an apartment building with ground floor retail space. Status of planned investments: Completed 10 planned projects and seven additional ones. Reported challenges: (1) 180-day window for investors to invest their gains in a Qualified Opportunity Fund, (2) incentive timing requirements that funds deploy capital within 6 months, (3) oversupply of housing in one area made it difficult to fully lease some projects, and (4) general economic conditions Continued use of original incentive: No Plan to pursue use of revised incentive: Yes |
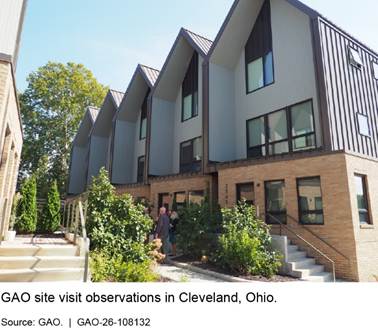
|
FUND P: COMMERCIAL REAL
ESTATE DEVELOPMENT/OPERATING BUSINESS/RENEWABLES |
|
|
|
2021 plan for incentive use: Was investing in three solar farms that were all operational and selling electricity to municipalities. The fund constructed the solar farms and put them into service in 2020. Status of planned investments: Completed Reported challenges: (1) different treatments of partnerships and corporations, (2) uncertainty of future capital gains tax rate, and (3) general economic conditions Continued use of original incentive: No Plan to pursue use of revised incentive: Yes |
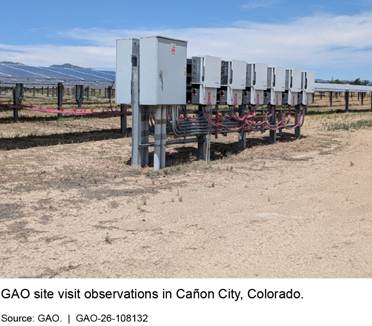
|
FUND Q: OPERATING
BUSINESS/RENEWABLES |
|
|
|
2021 plan for incentive use: Was investing in an operating business that was installing solar panels on commercial, non-profit, and residential properties at no upfront cost under a power purchase agreement. Status of planned investments: The operating business completed seven solar panel installations and fully expended the fund. These sites are still active. Reported challenges: (1) tax filing and reporting complications, (2) incentive rules’ interactions with other incentives’ rules, (3) lack of clear information on investment timeline, (4) short window to be eligible for step-up in basis on invested gains, (5) change in census tract boundaries, (6) tracts designated as Zones, and (7) no incentive for job creation or environmental or social justice Continued use of original incentive: No Plan to pursue use of revised incentive: No |
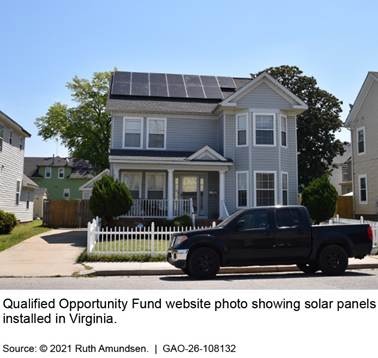
|
FUND R: COMMERCIAL REAL
ESTATE DEVELOPMENT |
|
|
|
2021 plan for incentive use: Was investing in between 10 and 14 properties that it could convert to self-storage units; it was not investing in ground-up development. These storage facilities would be class A properties and contain climate-controlled units. Status of planned investments: Completed Reported challenges: (1) incentive rules related to prior land ownership, (2) incentive’s timing requirements, and (3) general economic conditions Continued use of original incentive: Yes Plan to pursue use of revised incentive: Yes |
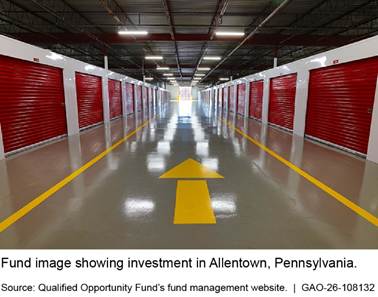
Appendix III: State Responses to Select 2025 Opportunity Zones Tax Incentive Survey Questions and Comparison to 2020 Survey Responses
In 2025, we surveyed officials in the 50 U.S. states, Washington, D.C., and the five U.S. territories—American Samoa, Guam, the Commonwealth of the Northern Mariana Islands, Puerto Rico, and the U.S. Virgin Islands—(hereafter states) to understand states’ experiences with the Opportunity Zones tax incentive and identify Qualified Opportunity Funds and investments and received responses from 54 of the 56 states.[46] We also conducted a similar survey of states, Washington, D.C., and the five U.S. territories in 2020 for our prior work and received responses from all 56 states. Below are states’ responses to select 2025 survey questions, and, in some instances, comparisons of 2025 state survey responses to 2020 state survey responses.[47]
Table 4: Responses to Select 2025 Survey Questions by States Reporting Awareness of Opportunity Zone Investment
|
State |
Estimate of the number of investments of which officials were aware |
Are there more real estate or more business investments? |
Are there more metropolitan or non-metropolitan investments? |
|
Alaska |
Less than 5 |
Not sure |
More metropolitan |
|
Arizona |
At least 20 |
Not sure |
Not sure |
|
Arkansas |
Did not respond with a numerical estimate |
More real estate |
More metropolitan |
|
California |
At least 20 |
More real estate |
More metropolitan |
|
Colorado |
At least 20 |
More real estate |
Not sure |
|
Delaware |
Less than 5 |
More real estate |
More metropolitan |
|
Georgia |
Did not respond with a numerical estimate |
Not sure |
Similar numbers of each |
|
Idaho |
Less than 5 |
More real estate |
More metropolitan |
|
Maryland |
At least 50 |
More real estate |
More metropolitan |
|
Michigan |
Less than 5 |
More businesses |
More metropolitan |
|
Montana |
At least 5 |
Similar numbers of each |
Not sure |
|
Nebraska |
Less than 5 |
More real estate |
Not sure |
|
New Jersey |
At least 50 |
More real estate |
More metropolitan |
|
Oklahoma |
At least 10 |
More real estate |
More metropolitan |
|
Pennsylvania |
Did not respond with a numerical estimate |
More real estate |
More metropolitan |
|
Puerto Rico |
At least 20 |
More real estate |
More metropolitan |
|
South Carolina |
Did not respond with a numerical estimate |
More real estate |
More metropolitan |
|
Tennessee |
At least 10 |
More real estate |
Similar numbers of each |
|
U.S. Virgin Islands |
Less than 5 |
More real estate |
More non-metropolitan |
|
Utah |
At least 5 |
More real estate |
More metropolitan |
|
Vermont |
Did not respond with a numerical estimate |
Not sure |
More non-metropolitan |
|
Washington, D.C. |
Less than 5 |
More real estate |
More metropolitan |
|
Wisconsin |
Did not respond with a numerical estimate |
Not sure |
Not sure |
|
Wyoming |
Did not respond with a numerical estimate |
Not sure |
Not sure |
Source: GAO analysis of state survey responses to GAO’s 2025 survey on Opportunity Zone incentive. | GAO‑26‑108132
Notes: The term “states” refers to the 50 states, Washington, D.C., and the five U.S. territories—American Samoa, Guam, the Commonwealth of the Northern Mariana Islands, Puerto Rico, and the U.S. Virgin Islands. GAO surveyed officials from the 50 states, Washington, D.C., and the five U.S. territories and received responses from 54 of the 56. This table includes states that indicated they were aware of Opportunity Zones investment in their states. This table is referring to the number of investments (e.g., number of real estate projects or investments in operating businesses) and not the monetary amount of investments in this table. States provided different levels of specificity for the number of investments of which they were aware. GAO categorized these numerical responses into the following categories: less than five, at least five, at least 10, at least 20, at least 50, and at least 100. GAO categorized these responses with minimum amounts of which they are aware. For example, a respondent that reported being aware of 27 investments would be categorized as more than 20 and not included in the more than five category. Respondents from states not listed in this table either indicated they were unaware of any investment, were unsure if there was investment, or did not respond to this question.
Table 5: State Reporting on Types of Opportunity Zone Investment in Real Estate Projects in Their States, 2025
|
|
Aware |
Not aware |
Not sure |
Did not respond |
Total |
|
Residential |
15 |
0 |
5 |
2 |
22 |
|
Industrial |
5 |
2 |
11 |
4 |
22 |
|
Commercial |
18 |
0 |
3 |
1 |
22 |
|
Mixed-use |
17 |
0 |
4 |
1 |
22 |
|
Other |
1 |
0 |
1 |
20 |
22 |
Source: GAO analysis of state survey responses to GAO’s 2025 survey on Opportunity Zone incentive. | GAO‑26‑108132
Notes: The term “states” refers to the 50 states, Washington, D.C., and the five U.S. territories—American Samoa, Guam, the Commonwealth of the Northern Mariana Islands, Puerto Rico, and the U.S. Virgin Islands. GAO surveyed officials from the 50 states, Washington, D.C., and the five U.S. territories and received responses from 54 of the 56. This table includes states that indicated they were aware of Opportunity Zone real estate investment in their states.
Table 6: State Reporting on Types of Opportunity Zone Investment in Operating Businesses in Their States, 2025
|
|
Aware |
Not aware |
Not sure |
Did not respond |
Total |
|
Manufacturing |
4 |
1 |
1 |
18 |
24 |
|
Data centers |
0 |
3 |
3 |
18 |
24 |
|
Hospitality |
3 |
1 |
3 |
17 |
24 |
|
Storage |
4 |
1 |
3 |
16 |
24 |
|
Energy |
1 |
2 |
3 |
18 |
24 |
|
Restaurant |
3 |
1 |
3 |
17 |
24 |
|
Other |
1 |
0 |
1 |
22 |
24 |
Source: GAO analysis of state survey responses to GAO’s 2025 survey on Opportunity Zone incentive. | GAO‑26‑108132
Notes: The term “states” refers to the 50 states, Washington, D.C., and the five U.S. territories—American Samoa, Guam, the Commonwealth of the Northern Mariana Islands, Puerto Rico, and the U.S. Virgin Islands. GAO surveyed officials from the 50 states, Washington, D.C., and the five U.S. territories and received responses from 54 of the 56. This table includes states that indicated they were aware of Opportunity Zone investment in operating businesses in their states.
|
Response |
Number of Responses |
Percentage of Respondents to Survey Question |
Overall Percentage of States Responding to Survey |
|
Investment peaked in 2018 and then steadily decreased through 2025 |
4 |
17 |
17 |
|
Investment began in 2018, increased and peaked, and then began decreasing through 2025 |
7 |
29 |
29 |
|
Investment was lowest in 2018 and has steadily risen through 2025 |
2 |
8 |
8 |
|
Investment has been consistent from 2018 through 2025 |
3 |
13 |
13 |
|
Other |
3 |
13 |
13 |
|
Not sure |
5 |
21 |
21 |
|
Did not respond |
0 |
N/A |
0 |
|
Total |
24 |
100 |
100 |
Legend: N/A = not applicable
Source: GAO analysis of state survey responses to GAO’s 2025 survey on Opportunity Zone incentive. | GAO‑26‑108132
Notes: The term “states” refers to the 50 states, Washington, D.C., and the five U.S. territories—American Samoa, Guam, the Commonwealth of the Northern Mariana Islands, Puerto Rico, and the U.S. Virgin Islands. GAO surveyed state officials from all 50 states, Washington, D.C., and the five U.S. territories and received responses from 54 of the 56 states. This table includes states that indicated they were aware of Opportunity Zones investment in their states. Percentages may not sum to 100 percent due to rounding.
Table 8: Would States Change Census Tracts Designated as Opportunity Zones, if Given the Option, 2025
|
Response |
Number of Responses |
Percentage of Respondents to Survey Question |
Overall Percentage of States Responding to Survey |
|
Yes |
22 |
42 |
41 |
|
No |
6 |
11 |
11 |
|
Not sure |
25 |
47 |
46 |
|
Did not respond |
1 |
N/A |
2 |
|
Total |
54 |
100 |
100 |
Legend: N/A = not applicable
Source: GAO analysis of state survey responses to GAO’s 2025 survey on Opportunity Zone incentive. | GAO‑26‑108132
Notes: The term “states” refers to the 50 states, Washington, D.C., and the five U.S. territories—American Samoa, Guam, the Commonwealth of the Northern Mariana Islands, Puerto Rico, and the U.S. Virgin Islands. GAO surveyed state officials in all 50 states, Washington, D.C., and the five U.S. territories and received responses from 54 of the 56 states. Percentages may not sum to 100 percent due to rounding.
Table 9: Comparison of State Views Whether They Would Change Census Tracts Designated as Opportunity Zones, if Given the Option in 2020 and 2025
|
Response |
Number of Responses in 2020 |
Number of Responses in 2025 |
Change from 2020 to 2025 |
|
Yes |
26 |
22 |
Decrease of 4 |
|
No |
9 |
6 |
Decrease of 3 |
|
Not sure |
20 |
25 |
Increase of 5 |
|
Did not respond |
1 |
1 |
No change |
|
Total |
56 |
54 |
Decrease of 2 |
Source: GAO analysis of state survey responses to GAO’s 2020 and 2025 surveys on Opportunity Zone incentive. | GAO‑26‑108132
Note: The term “states” refers to the 50 states, Washington, D.C., and the five U.S. territories—American Samoa, Guam, the Commonwealth of the Northern Mariana Islands, Puerto Rico, and the U.S. Virgin Islands. GAO surveyed state officials in all 50 states, Washington, D.C., and the five U.S. territories and in 2020 received responses from all 56 states and territories. In 2025, we received responses from 54 of the 56.
Table 10: States’ Views of Opportunity Zone Investment on Selected Economic Outcomes in Their States, 2025
|
Economic Outcome |
Increased |
Neither increased nor decreased |
Decreased |
Not sure |
Did not respond |
|
Poverty |
1 (2%) |
11 (20%) |
1 (2%) |
34 (63%) |
7 (13%) |
|
Income levels |
5 (9%) |
10 (19%) |
1 (2%) |
31 (57%) |
7 (13%) |
|
Unemployment rate |
1 (2%) |
9 (17%) |
2 (4%) |
35 (65%) |
7 (13%) |
|
Job creation |
10 (19%) |
7 (13%) |
1 (2%) |
30 (56%) |
6 (11%) |
|
Education levels |
0 (0%) |
11 (20%) |
1 (2%) |
35 (65%) |
7 (13%) |
|
Housing stock |
11 (20%) |
8 (15%) |
1 (2%) |
28 (52%) |
6 (11%) |
|
Supply of affordable housing |
7 (13%) |
10 (19%) |
2 (4%) |
29 (54%) |
6 (11%) |
|
Housing prices |
3 (6%) |
11 (20%) |
0 (0%) |
33 (61%) |
7 (13%) |
|
Migration to the census tract |
4 (7%) |
7 (13%) |
1 (2%) |
36 (67%) |
6 (11%) |
|
Migration from the census tract |
1 (2%) |
6 (11%) |
0 (0%) |
40 (74%) |
7 (13%) |
|
Other |
1 (2%) |
1 (2%) |
0 (0%) |
5 (9%) |
47 (87%) |
Source: GAO analysis of state survey responses to GAO’s 2025 survey on Opportunity Zone incentive. | GAO‑26‑108132
Notes: The term “states” refers to the 50 states, Washington, D.C., and the five U.S. territories—American Samoa, Guam, the Commonwealth of the Northern Mariana Islands, Puerto Rico, and the U.S. Virgin Islands. GAO surveyed state officials in all 50 states, Washington, D.C., and the five U.S. territories and received responses from 54 of the 56 states. This survey question asked respondents if Opportunity Zone investment had substantially increased, increased, neither increased nor decreased, decreased, or substantially decreased selected economic outcomes. For this table, we combined “substantially increased” and “increased” into “increased” and combined “substantially decreased” and “decreased” into “decreased.” Percentages may not sum to 100 percent due to rounding.
Table 11: State Views on Clarity of Federal Opportunity Zones Tax Incentive Guidance and Information, 2025
|
Response |
Number of Responses |
Percentage of Respondents to Survey Question |
Overall Percentage of States Responding to Survey |
|
Very clear |
3 |
6 |
6 |
|
Clear |
18 |
33 |
33 |
|
Somewhat clear |
21 |
39 |
39 |
|
Not at all clear |
3 |
6 |
6 |
|
Not sure |
9 |
17 |
17 |
|
Did not respond |
0 |
N/A |
0 |
|
Total |
54 |
100 |
100 |
Legend: N/A = not applicable
Source: GAO analysis of state survey responses to GAO’s 2025 survey on Opportunity Zone incentive. | GAO‑26‑108132
Notes: The term “states” refers to the 50 states, Washington, D.C., and the five U.S. territories—American Samoa, Guam, the Commonwealth of the Northern Mariana Islands, Puerto Rico, and the U.S. Virgin Islands. GAO surveyed state officials in the 50 states, Washington, D.C., and the five U.S. territories and received responses from 54 of the 56 states. Percentages may not sum to 100 percent due to rounding.
Table 12: Comparison of State Views on Clarity of Federal Opportunity Zones Tax Incentive Guidance and Information in 2020 and 2025
|
Response |
Number of Responses in 2020 |
Number of Responses in 2025 |
Change from 2020 to 2025 |
|
Very clear |
2 |
3 |
Increase of 1 |
|
Clear |
21 |
18 |
Decrease of 3 |
|
Somewhat clear |
24 |
21 |
Decrease of 3 |
|
Not at all clear |
5 |
3 |
Decrease of 2 |
|
Not sure |
3 |
9 |
Increase of 6 |
|
Did not respond |
1 |
0 |
Decrease of 1 |
|
Total |
56 |
54 |
Decrease of 2 |
Source: GAO analysis of state survey responses to GAO’s 2020 and 2025 surveys on Opportunity Zone incentive. | GAO‑26‑108132
Note: The term “states” refers to the 50 states, Washington, D.C., and the five U.S. territories—American Samoa, Guam, the Commonwealth of the Northern Mariana Islands, Puerto Rico, and the U.S. Virgin Islands. GAO surveyed state officials in the 50 states, Washington, D.C., and the five U.S. territories and in 2020 received responses from all 56 states and territories. In 2025, we received responses from 54 of the 56.
Table 13: State Views on Sufficiency of Federal Opportunity Zones Tax Incentive Guidance and Information, 2025
|
Response |
Number of Responses |
Percentage of Respondents to Survey Question |
Overall Percentage of States Responding to Survey |
|
Very sufficient |
0 |
0 |
0 |
|
Sufficient |
19 |
36 |
35 |
|
Somewhat sufficient |
22 |
42 |
41 |
|
Not at all sufficient |
2 |
4 |
4 |
|
Not sure |
10 |
19 |
19 |
|
Did not respond |
1 |
N/A |
2 |
|
Total |
54 |
100 |
100 |
Legend: N/A = not applicable
Source: GAO analysis of state survey responses to GAO’s 2025 survey on Opportunity Zone incentive. | GAO‑26‑108132
Notes: The term “states” refers to the 50 states, Washington, D.C., and the five U.S. territories—American Samoa, Guam, the Commonwealth of the Northern Mariana Islands, Puerto Rico, and the U.S. Virgin Islands. GAO surveyed state officials in the 50 states, Washington, D.C., and the five U.S. territories and received responses from 54 of the 56 states. Percentages may not sum to 100 percent due to rounding.
Table 14: Comparison of State Views on Sufficiency of Federal Opportunity Zones Tax Incentive Guidance and Information in 2020 and 2025
|
Response |
Number of Responses in 2020 |
Number of Responses in 2025 |
Change from 2020 to 2025 |
|
Very sufficient |
2 |
0 |
Decrease of 2 |
|
Sufficient |
21 |
19 |
Decrease of 2 |
|
Somewhat sufficient |
25 |
22 |
Decrease of 3 |
|
Not at all sufficient |
3 |
2 |
Decrease of 1 |
|
Not sure |
5 |
10 |
Increase of 5 |
|
Did not respond |
0 |
1 |
Increase of 1 |
|
Total |
56 |
54 |
Decrease of 2 |
Source: GAO analysis of state survey responses to GAO’s 2020 and 2025 surveys on Opportunity Zone incentive. | GAO‑26‑108132
Note: The term “states” refers to the 50 states, Washington, D.C., and the five U.S. territories—American Samoa, Guam, the Commonwealth of the Northern Mariana Islands, Puerto Rico, and the U.S. Virgin Islands. GAO surveyed state officials in the 50 states, Washington, D.C., and the five U.S. territories in 2020 and received responses from all 56 states and territories. In 2025, we received responses from 54 of the 56.
Definitions
For purposes of this survey we are considering Opportunity Zones projects, as projects that are at least partially funded by a Qualified Opportunity Fund. We are categorizing Opportunity Zone projects as either real estate projects or operating business projects. A real estate project is a project where the primary value of the project is the real estate (e.g., development of an apartment building). An operating business project is business that derives its value primarily from activities other than its real estate.
1. Are you aware of any investments (operating businesses or real estate projects) being funded by Qualified Opportunity Funds in Opportunity Zones in your state/territory?
o Yes
o No
o Not sure
2. (If “Yes” to 1) How many different Opportunity Zone operating businesses (receiving at least some investment from a Qualified Opportunity Fund) and real estate projects (real estate projects receiving at least some investment from a Qualified Opportunity Fund) from Qualified Opportunity Funds are you aware of in your state/territory?
__________________________________________________________
3. (If “Yes” to 1) Do you believe that there are additional investments or projects from Qualified Opportunity Funds that you are not aware of in your state/territory?
o Yes
o No
o Not sure
3a. (If “Yes” to 1) Please explain your answer here, if needed.
__________________________________________________________
4. (If “Yes” to 1) Have you used any of the following sources of information to learn about Opportunity Zone operating businesses and real estate projects financed by Qualified Opportunity Funds in your state/territory? Please select one response per row.
|
|
Yes |
No |
|
State/locality required reporting of Qualified Opportunity Funds |
o |
o |
|
Direct contact with Qualified Opportunity Fund |
o |
o |
|
Direct contact with project manager/developer |
o |
o |
|
Direct contact with a local government official |
o |
o |
|
Online database or listing (e.g., Novogradac or OpportunityZones.com) |
o |
o |
|
A conference/investment pitch event |
o |
o |
|
Public meetings or hearings |
o |
o |
|
Newspapers, news articles, or other news outlet |
o |
o |
|
Trade or industry journals |
o |
o |
|
Other (Please specify): |
o |
o |
4a. (If “Yes” to 1) Please explain your answer here, if needed.
__________________________________________________________
5. (If “Yes” to 1) In your experience, for investments made by Qualified Opportunity Funds in your state/territory: Please choose the best response.
o There are more real estate projects.
o There are more operating business projects.
o There are similar numbers of each.
o Not sure.
5a. (If “Yes” to 1) Please explain your answer here, if needed.
__________________________________________________________
6. (If “Yes” to 1) In your experience, what type of area in your state/territory has received more—in terms of number of investments—Qualified Opportunity Fund investments in operating businesses or real estate projects? For the purposes of this survey, metropolitan areas are comprised of a core of at least one urbanized area that has a population of at least 50,000 and adjacent outlying counties that have a high degree of social and economic integration.
o There are more metropolitan projects.
o There are more non-metropolitan projects.
o There are similar numbers of each.
o Not sure.
6a. (If “Yes” to 1) Please explain your answer here, if needed.
____________________________________________________
7. (If “Yes” to 1) Are you aware of any real estate projects receiving investment from a Qualified Opportunity Fund in your state/territory?
o Yes
o No
7a. (If “Yes” to 7) Where are the real estate projects receiving investment from a Qualified Opportunity Fund located in your state/territory?
o More in metropolitan areas
o More in non-metropolitan areas
o About the same amount in both metropolitan areas and rural areas
o Not sure
7b. (If “Yes” to 7) Please explain your answer here, if needed.
__________________________________________________________
7c. (If “Yes” to 7) Are the real estate projects receiving investment from a Qualified Opportunity Fund any of the following types? Please select one response per row.
|
|
Yes |
No |
Not sure |
|
Residential |
o |
o |
o |
|
Industrial |
o |
o |
o |
|
Commercial |
o |
o |
o |
|
Mixed-use |
o |
o |
o |
|
Other (Please specify): |
o |
o |
o |
7d. (If “Yes” to any option in 7c) Please rank the top 2 most common types of real estate receiving investment from a Qualified Opportunity Fund projects in your state/territory. Enter a “1” in the box next to the most common, and, if applicable, a “2” in the box next to the second most common. If there are additional boxes, please leave them blank.
______ Residential
______ Industrial
______ Commercial
______ Mixed-use
______ Other:
8. (If “Yes” to 1) Are you aware of any Opportunity Zone operating businesses in your state/territory?
o Yes
o No
8a. (If “Yes” to 8) Where are the Opportunity Zone operating businesses located in your state/territory? For the purposes of this survey, metropolitan areas are comprised of a core of at least one urbanized area that has a population of at least 50,000 and adjacent outlying counties that have a high degree of social and economic integration.
o More in metropolitan areas
o More in non-metropolitan areas
o About the same amount in both metropolitan areas and rural areas
o Not sure
8b. (If “Yes” to 8) Please explain your answer here, if needed.
__________________________________________________________
8c. (If “Yes” to 8) Are the Opportunity Zone operating businesses any of the following types? Please select one response per row.
|
|
Yes |
No |
Not sure |
|
Manufacturing |
o |
o |
o |
|
Data centers |
o |
o |
o |
|
Hospitality |
o |
o |
o |
|
Storage |
o |
o |
o |
|
Energy |
o |
o |
o |
|
Restaurant |
o |
o |
o |
|
Other (please specify): |
o |
o |
o |
8d. (If “Yes” to any option in 8c) Please rank the top 2 most common types of Opportunity Zone operating businesses in your state/territory. Enter a “1” in the box next to the most common, and, if applicable, a “2” in the box next to the second most common. If there are additional boxes, please leave them blank.
______ Manufacturing
______ Data centers
______ Hospitality
______ Storage
______ Energy
______ Restaurant
______ Other:
9. (If “Yes” to 1) Are you aware of new investment in your state/territory since January 2021?
o Yes
o No
o Not sure
9a. (If “Yes” to 1) Please explain your answer here, if needed.
__________________________________________________________
10. (If “Yes” to 1) For Opportunity Zone investments that you are aware of in your state/territory, please select the statement below that most closely represents the timing of those investments based on your knowledge:
o Investment peaked in 2018 and then steadily decreased through 2025.
o Investment began in 2018, increased and peaked, and then began decreasing through 2025.
o Investment was lowest in 2018 and has steadily risen through 2025.
o Investment has been consistent from 2018 through 2025.
o Investment had multiple peaks.
o
Other (please specify):
__________________________________________________
o Not sure
10a. (If “Yes” to 1) Please explain your answer here, if needed.
__________________________________________________________
10b. (If “Yes” to second option in 10) Based on your knowledge, what year did Opportunity Zone investment peak in your state/territory?
o 2019
o 2020
o 2021
o 2022
o 2023
o 2024
o Not sure
10c. (If “Yes” to fifth or sixth option in 10) Based on your knowledge, what years did Opportunity Zone investment peak in your state/territory? Please select all that apply.
□ 2018
□ 2019
□ 2020
□ 2021
□ 2022
□ 2023
□ 2024
□ 2025
□ Not sure
10d. (If “Yes” to fifth or sixth option in 10) Based on your knowledge, what year(s) had the lowest amount of Opportunity Zone investment in your state/territory? Please select all that apply.
□ 2018
□ 2019
□ 2020
□ 2021
□ 2022
□ 2023
□ 2024
□ 2025
□ Not sure
11. (If “Yes” to 1) Would you be willing to provide us with information on the Qualified Opportunity Funds and/or their associated investments that you are aware of in your state/territory? Note: For our prior work, we selected Funds for case studies as illustrative examples to describe different use cases of the incentive. For our current work we may expand our case study population. We are not collecting information on individuals’ investments in Funds or their investment amounts.
o Yes
o No
11a. (If “Yes” to 11) Please upload a document (e.g., Word, pdf, etc.) with the information. If the file is larger than 50 MB or you experience difficulty, please e-mail the information to OpportunityZonesSurvey@gao.gov. If you would like to provide information at a later time, please leave blank and we can follow up with you after you have submitted the survey.
12. How would you describe any outreach or education to promote federal Opportunity Zone benefits your state/territory is conducting to explain the incentive or to attract investment in your state/territory?
__________________________________________________________
13. Is your state/territory offering additional incentives to specifically attract investment to federal Opportunity Zones (e.g., state or territory tax conformity with federal Opportunity Zone incentive, state/territory tax credits, expedited application processing)?
o Yes
o No
o Not sure
13a. (If “Yes” to 13) Please explain which additional incentives your state/territory offers.
__________________________________________________________
14. Have you used the following sources to get information about the federal Opportunity Zones incentive? Please select one response per row.
|
|
Yes |
No |
|
White House Opportunity and Revitalization Council information (December 2018 – January 2021) |
o |
o |
|
Conferences |
o |
o |
|
Trade or industry information (e.g., Tax Notes) |
o |
o |
|
News/media coverage |
o |
o |
|
Tax professionals |
o |
o |
|
Economic/Community development professionals |
o |
o |
|
IRS and Treasury official guidance (e.g., regulations, notices) |
o |
o |
|
IRS and Treasury information (e.g., FAQs, fact sheets) |
o |
o |
|
Other (please specify): |
o |
o |
14a. Please explain your answer here, if needed.
__________________________________________________________
15. For the following question, please consider federal guidance and information (e.g., IRS and Treasury official guidance, IRS and Treasury information, White House Opportunity and Revitalization Council information) related to the federal Opportunity Zone incentive. How clear are the federal guidance and information related to the federal Opportunity Zone incentive?
o Very clear
o Clear
o Somewhat clear
o Not at all clear
o Not sure
15a. Please explain your answer here, if needed.
__________________________________________________________
16. For the following question, please consider federal guidance and information (e.g., IRS and Treasury official guidance, IRS and Treasury information, White House Opportunity and Revitalization Council information) related to the federal Opportunity Zone incentive. How sufficient are the federal guidance and information related to the federal Opportunity Zone incentive?
o Very sufficient
o Sufficient
o Somewhat sufficient
o Not at all sufficient
o Not sure
16a. Please explain your answer here, if needed.
__________________________________________________________
17. If you were able to change the Census tracts designated as Zones in your state/territory, would you do so?
o Yes
o No
o Not sure
17a. (If “Yes” to 17) About what percentage of Census tracts designated as Zones in your state/territory would you change?
o 0-25%
o 26-50%
o 51-75%
o 76-100%
17b. (If “Yes” to 17) Please explain why you would change the Census tracts designated as Zones in your state/territory.
__________________________________________________________
18. What challenges are associated with the federal Opportunity Zone incentive (e.g., federal implementation, encouraging investors to use the incentive, lack of eligible gains to invest)?
__________________________________________________________
19. How could these challenges be addressed? Please write N/A if there were no challenges.
__________________________________________________________
20. Based on your knowledge, how, if at all, have investments by Qualified Opportunity Funds affected the following economic outcomes in Opportunity Zones in your state or territory? Please select one response from each dropdown list.
|
|
Substantially increased |
Increased |
Neither decreased or increased |
Decreased |
Substantially decreased |
Not sure |
|
Poverty |
o |
o |
o |
o |
o |
o |
|
Income levels |
o |
o |
o |
o |
o |
o |
|
Unemployment rate |
o |
o |
o |
o |
o |
o |
|
Job creation |
o |
o |
o |
o |
o |
o |
|
Education levels |
o |
o |
o |
o |
o |
o |
|
Housing stock |
o |
o |
o |
o |
o |
o |
|
Supply of affordable housing |
o |
o |
o |
o |
o |
o |
|
Housing prices |
o |
o |
o |
o |
o |
o |
|
Migration to the census tract |
o |
o |
o |
o |
o |
o |
|
Migration from the census tract |
o |
o |
o |
o |
o |
o |
|
Other (please specify): |
o |
o |
o |
o |
o |
o |
21. In your own words, could you generally describe the overall effects that an Opportunity Zone designation has had on designated census tracts receiving investment? If yes, please describe them below. If unsure, please enter “Not sure”.
__________________________________________________________
22. Based on your observations, what characteristics distinguish Zones that have received investments from those that have not received investments?
__________________________________________________________
23. Does your state collect or analyze data to understand the impact the federal Opportunity Zone incentive has had related to poverty, income levels, unemployment, job creation, education levels, available housing, supply of affordable housing, housing prices, migration to the census tract, migration from the census tract, and/or other economic outcomes?
o Yes
o No
23a. (If “Yes” to 23) What information and/or reports does your state collect and use to analyze the impact of the federal Opportunity Zone incentive and what it shows related to poverty, income levels, unemployment, job creation, education levels, available housing, supply of affordable housing, housing prices, migration to the census tract, migration from the census tract, and/or other economic outcomes?
__________________________________________________________
24. Did the federal Opportunity Zone designation have a positive or negative impact on your state/territory?
o Net positive
o Net neutral
o Net negative
o No impact
o Not sure
24a. Please explain your answer here, if needed.
__________________________________________________________
25. Please list the officials, titles, and contact information for those that answered this survey in case we have any follow-up questions.
__________________________________________________________
26. Please describe any information sources used to answer this survey.
__________________________________________________________
GAO Contact
Jessica Lucas-Judy at LucasJudyJ@gao.gov
Staff Acknowledgments
In addition to the contact named above, Brian James (Assistant Director), Dawn Bidne, Gina Hoover, Amalia Konstas, Daniel Mahoney, Cory Marzullo, Carly McCann, Catherine Paxton, Sabine Paul, Paras Sharma, Peter Verchinski, Crystal Wesco, and Alicia White made key contributions to this report.
The Government Accountability Office, the audit, evaluation, and investigative arm of Congress, exists to support Congress in meeting its constitutional responsibilities and to help improve the performance and accountability of the federal government for the American people. GAO examines the use of public funds; evaluates federal programs and policies; and provides analyses, recommendations, and other assistance to help Congress make informed oversight, policy, and funding decisions. GAO’s commitment to good government is reflected in its core values of accountability, integrity, and reliability.
Obtaining Copies of GAO Reports and Testimony
The fastest and easiest way to obtain copies of GAO documents at no cost is through our website. Each weekday afternoon, GAO posts on its website newly released reports, testimony, and correspondence. You can also subscribe to GAO’s email updates to receive notification of newly posted products.
Order by Phone
The price of each GAO publication reflects GAO’s actual cost of production and distribution and depends on the number of pages in the publication and whether the publication is printed in color or black and white. Pricing and ordering information is posted on GAO’s website, https://www.gao.gov/ordering.htm.
Place orders by calling (202) 512-6000, toll free (866) 801-7077,
or
TDD (202) 512-2537.
Orders may be paid for using American Express, Discover Card, MasterCard, Visa, check, or money order. Call for additional information.
Connect with GAO
Connect with GAO on X,
LinkedIn, Instagram, and YouTube.
Subscribe to our Email Updates. Listen to our Podcasts.
Visit GAO on the web at https://www.gao.gov.
To Report Fraud, Waste, and Abuse in Federal Programs
Contact FraudNet:
Website: https://www.gao.gov/about/what-gao-does/fraudnet
Automated answering system: (800) 424-5454
Media Relations
Sarah Kaczmarek, Managing Director, Media@gao.gov
Congressional Relations
David A. Powner, Acting Managing Director, CongRel@gao.gov
General Inquiries
[1]To provide for reconciliation pursuant to titles II and V of the concurrent resolution on the budget for fiscal year 2018. Pub. L. No. 115-97, § 13823, 131 Stat. 2054, 2183-88 (2017) (codified as amended at 26 U.S.C. §§ 1400Z-1 – Z-2) (hereafter, TCJA). The Opportunity Zone tax incentive is a tax expenditure, which is a special credit, deduction, or other tax provision that reduces taxpayers’ tax liabilities, and as a result, reduces federal tax revenue. The Congressional Budget and Impoundment Control Act of 1974 defines tax expenditures as “revenue losses attributable to provisions of the Federal tax laws which allow a special exclusion, exemption, or deduction from gross income or which provide a special credit, a preferential rate of tax, or a deferral of tax liability.” Pub. L. No. 93-344, § 3, 88 Stat. 297, 299 (1974) (codified at 2 U.S.C. § 622(3)).
[2]Total assets include both capital invested into funds, and other assets such as cash, intangibles, and equipment owned or leased by funds. The full cost of the incentive to the federal government is unknown because this cost depends on the growth of investments held at least 10 years, and the first such investments were made in 2018—less than 10 years ago.
[3]An act to provide for reconciliation pursuant to title II of H. Con. Res. 14, Pub. L. No. 119-21, 139 Stat. 72 (2025) (hereafter, OBBBA). Certain OBBBA provisions governing Opportunity Zones only apply to qualified investments made into funds after December 31, 2026. Pub. L. No. 119-21, § 70421(c)(5).
[4]Pursuant to the TCJA and implementing IRS regulations, the Opportunity Zone tax incentive provision was to sunset on December 31, 2026, for new deferral and investment of capital gains; December 31, 2028, for Qualified Opportunity Zone designations; and December 31, 2047, for taxpayers’ ability to elect to increase the basis of an investment held at least 10 years in a Qualified Opportunity Fund. As explained above, OBBBA made the incentive permanent.
[5]Two funds did not respond to our requests to schedule interviews to discuss their continued experience with the Opportunity Zone incentive. One fund was no longer planning to use the Opportunity Zone incentive at the conclusion of our 2021 work. For more information, see GAO, Opportunity Zones: Census Tract Designations, Investment Activities, and IRS Challenges Ensuring Taxpayer Compliance, GAO‑22‑104019 (Washington, D.C.: Oct. 7, 2021).
[6]Qualified Opportunity Funds are required to hold at least 90 percent of its assets in Qualified Opportunity Zone property and meet other conditions. 26 U.S.C. § 1400Z-2(d)(1). Qualified Opportunity Fund investments in other Qualified Opportunity Funds will not count towards the requirement for Funds to hold 90 percent of its assets in Qualified Opportunity Zone property.
[7]26 U.S.C. § 1400Z-2(b).
[8]Qualified property includes qualified opportunity zone stock, qualified opportunity zone partnership interest, and qualified opportunity zone business property. Qualified opportunity zone stock and qualified opportunity zone partnership interest are interests in qualified opportunity zone businesses, which are defined under 26 U.S.C. § 1400Z-2(d)(3).
[9]26 U.S.C. § 1400Z-2(d)(1)-(2)(D)(ii). During substantially all (90 percent) of the time a Qualified Opportunity Fund or qualified business holds or leases tangible property, substantially all (generally at least 70 percent) of that property’s use must be in a Zone.
[10]26 C.F.R. § 1.1400Z2(d)-1(d)(3)(i); 26 U.S.C. § 1397C(b).
[11]26 U.S.C. § 1400Z-1(b)(1), (c)(2). The statute refers to the chief executive officer in a state, which is in turn defined to include U.S. possessions and the District of Columbia. Internal Revenue Service, Revenue Procedure 2018 –16, Internal Revenue Bulletin No. 2018-9 (Washington, D.C.: Feb. 26, 2018). For ease of reference, in this report, we use the term “governor” instead.
[12]26 U.S.C. § 1400Z-2(b)(1).
[13]Rural areas are defined as any area other than a city or town that has a population of greater than 50,000 inhabitants, and any urbanized area contiguous and adjacent to a certain city or town. 26 U.S.C. § 1400Z-2(b)(2)(C)(ii).
[14]Specifically, property shall be treated as substantially improved by the Qualified Opportunity Fund only if, during any 30-month period beginning after the date of acquisition of such property, additions to basis with respect to such property in the hands of the Qualified Opportunity Fund exceed an amount equal to the adjusted basis or 50 percent of such adjusted basis in the case of property in a Zone comprised entirely of a rural area at the beginning of such 30-month period. 26 U.S.C. § 1400Z-2(d)(2)(D)(ii).
[15]GAO, Opportunity Zones: Improved Oversight Needed to Evaluate Tax Expenditure Performance, GAO‑21‑30 (Washington, D.C.: Oct. 8, 2020). TCJA did not require funds to file information on their activities.
[16]26 U.S.C. § 6039K(a), (b).
[17]Pub. L. No. 119-21, § 70421(e)(4).
[18]Generally, the number of population census tracts in a state that may be designated as qualified Zones may not exceed 25 percent of the number of low-income communities in the state. 26 U.S.C. § 1400Z-1(d)(1).
[19]Department of the Treasury, Rev. Proc. 2026-14 (Apr. 6, 2026).
[20]Figure is approximate due to changes in the census tract boundaries following the 2020 census. See appendix I for more information.
[21]We surveyed officials from the 50 states, Washington, D.C., and the five U.S. territories—American Samoa, Guam, the Commonwealth of the Northern Mariana Islands, Puerto Rico, and the U.S. Virgin Islands—and received responses from 54 of the 56. To characterize state officials’ views throughout this report, we defined modifiers (e.g., “most”) to quantify officials’ views as follows: “nearly all” represents 48 or more state officials, “most” represents 27 to 47 state officials, “many” represents 10 to 26 state officials, and “some” represents three to nine state officials.
For our 2021 Opportunity Zones report (GAO‑22‑104019), we selected 18 funds for case studies using a purposeful, stratified random sampling methodology to ensure that we examined a range of characteristics, including a variety of investment approaches and projects. For this report, we followed up with these funds and interviewed 16 of them. The case studies are not generalizable to the entire population of Qualified Opportunity Funds. To characterize fund representatives’ views throughout this report, we defined modifiers (e.g., “most”) to quantify representatives’ views as follows: “nearly all” represents more than 13 representatives, “most” represents 10 to 13 representatives, “many” represents six to nine representatives, and “some” represents two to five representatives.
[22]Operating businesses are entities that conduct day-to-day operations of a business rather than holding real estate and other assets. For example, a landscaping company would be considered an operating business.
[23]As previously noted, there is no complete or comprehensive publicly available information on Opportunity Zone investments, and under the original incentive enacted by TCJA, there was no requirement that funds publicly report their investments nor for Treasury to report on fund investments. As discussed later, OBBBA introduced new annual reporting requirements for Treasury and annual filing requirements for funds. However, funds are not required to report publicly or to state and local officials whether their investments are using Opportunity Zone capital.
[24]As explained above, taxpayers who invest in Qualified Rural Opportunity Funds that hold an investment in these rural Zones for 5 years are eligible for a 30 percent step-up in basis. 26 U.S.C. § 1400Z-2(b)(2)(B)(iii)(I).
[25]For more information on the characteristics of our selected funds and their experiences using the Opportunity Zone incentive, see appendix II.
[27]26 U.S.C. § 1400Z-2(d)(1), (f). Funds must self-certify as a Qualified Opportunity Fund and report their 90-percent investment standard calculation. A fund generally must hold at least 90 percent of its assets in qualified property, determined by the average of the percentage of qualified property held by that fund as measured in 6-month intervals. If a fund fails to meet the 90-percent investment standard, the fund generally must pay a penalty for each month that it fails to meet that standard. In practice, this means that funds generally must invest capital within 6 months of receiving it to avoid paying a penalty.
[28]We surveyed officials from the 50 states, Washington, D.C., and the five U.S. territories—American Samoa, Guam, the Commonwealth of the Northern Mariana Islands, Puerto Rico, and the U.S. Virgin Islands—and received responses from 54 of the 56. To characterize states’ views throughout this report, we defined modifiers (e.g., “most”) to quantify states’ views as follows: “nearly all” represents 48 or more states, “most” represents 27 to 47 states, “many” represents 10 to 26 states, and “some” represents three to nine states.”
[29]See 26 U.S.C. § 1400Z-2(d)(3)(A)(iii); 26 U.S.C. § 144(c)(6)(B).
[31]83 Fed. Reg. 54279 (Oct. 29, 2018).
[32]85 Fed. Reg. 1866 (Jan. 13, 2020).
[33]26 U.S.C. § 6039K(a), (b).
[34]Federal tax information is kept confidential under Section 6103 of the Internal Revenue Code, except as specifically authorized by law. 26 U.S.C. § 6103. We previously reported that even when IRS collects taxpayer data that could be useful for evaluating tax expenditures, Treasury might be unable to report those taxpayer data publicly—even in aggregation—or share those data with other agencies. For more information, see GAO‑21‑30 and GAO, Low-Income Housing Tax Credit: Joint IRS-HUD Administration Could Help Address Weaknesses in Oversight, GAO‑15‑330 (Washington, D.C.: July 15, 2015).
[35]26 U.S.C. § 6103(b)(2).
[36]IRS provided data from its Statistics of Income Partnership sample, which develops estimates based on a sampling methodology that does not specifically sample Qualified Opportunity Fund returns. IRS was also able to share estimates of the number and value of investments and value of property owned or leased by Qualified Opportunity Zone Businesses in the District of Columbia and American Samoa, but not in Puerto Rico because there were more than zero but fewer than 20 estimated investments. The sample data did not produce estimates of any investment in Guam, the Commonwealth of the Northern Mariana Islands, or the U.S. Virgin Islands.
[37]A separate annual survey, called the Puerto Rico Community Survey, collects similar data about the population of and housing units in Puerto Rico.
[38]IRS clarified in Announcement 2021-10 that the Opportunity Zone boundaries were unaffected by the 2020 decennial census changes. Opportunity Zone boundaries were established at the time they were designated and are not subject to change. https://www.irs.gov/pub/irs‑drop/a‑21‑10.pdf.
[40]For the purposes of designating Qualified Opportunity Zones the term “state” includes the U.S. territories and the District of Columbia. See 26 U.S.C. § 1400Z-1(c)(3); 26 U.S.C. § 7701(a)(10); and Internal Revenue Service, Revenue Procedure 2018 –16, Internal Revenue Bulletin No. 2018-9 (Washington, D.C.: Feb. 26, 2018). To see select survey responses, see appendix III.
[41]GAO, Opportunity Zones: Census Tract Designations, Investment Activities, and IRS Challenges Ensuring Taxpayer Compliance, GAO‑22‑104019 (Washington, D.C.: Oct. 7, 2021).
[42]Two funds did not respond to our requests to schedule interviews to discuss their continued experience with the Opportunity Zone incentive. One fund was no longer planning to use the Opportunity Zone incentive at the conclusion of our 2021 work. For more information, see GAO, Opportunity Zones: Census Tract Designations, Investment Activities, and IRS Challenges Ensuring Taxpayer Compliance, GAO‑22‑104019 (Washington, D.C.: Oct. 7, 2021).
[43]According to IRS data on the number of Forms 8996 received, at the time of our case study selection, there were about 9,000 Qualified Opportunity Funds. As of tax year 2024, there were approximately 13,000 funds that filed Form 8996. For more information on how we identified and selected case study funds and their characteristics, see GAO‑22‑104019.
[44]GAO, Opportunity Zones: Census Tract Designations, Investment Activities, and IRS Challenges Ensuring Taxpayer Compliance, GAO‑22‑104019 (Washington, D.C.: Oct. 7, 2021).
[45]Two funds did not respond to our requests to schedule interviews to discuss their continued experience with the Opportunity Zone incentive. One fund was no longer planning to use the Opportunity Zone incentive at the conclusion of our 2021 work.
[46]For more information on our survey methodology, see appendix I. For the purposes of designating Qualified Opportunity Zones the term “state” includes the U.S. territories and the District of Columbia. See 26 U.S.C. § 1400Z-1(c)(3); 26 U.S.C. § 7701(a)(10); and Internal Revenue Service, Revenue Procedure 2018 –16, Internal Revenue Bulletin No. 2018-9 (Washington, D.C.: Feb. 26, 2018).
[47]To see a copy of our survey questionnaire, see appendix IV.