MUSEUM FACILITIES
Deferred Maintenance Persists and Costs to Repair Are Unknown
Report to Congressional Committees
United States Government Accountability Office
A report to congressional committees
For more information, contact: David Marroni at marronid@gao.gov.
What GAO Found
For an estimated 77 percent (about 12,300) of the nation’s museums, the condition of at least one building system (e.g., heating, ventilation, and air conditioning) or building issue puts their collections at risk of damage or loss, according to GAO’s survey of museums. An estimated 73 percent, or about 11,900 museums, cited at least one building system or facility issue that poses a potential health or safety concern. Further, GAO estimates that nearly half of museums identified physical accessibility, such as inaccessible entrances, as a potential concern. Museum representatives said they have no options but to store collections in areas that experience water leaks or uncontrolled temperature or humidity.
The total cost to repair museums nationwide is unknown. Stakeholders cite challenges with limited museum resources to conduct facility assessments and expertise required to report accurate cost estimates for repairs. An estimated 85 percent (about 13,700) of museums report having a backlog of deferred maintenance and repair, and an estimated 80 percent expect deferred maintenance to persist or increase in the next 3 years based on projected budgets and planned projects. An estimated 49 percent, or about 7,900 museums, have a deferred maintenance backlog of more than $100,000 each.
Common challenges to addressing facility repair cited by museums in response to GAO’s survey are funding availability and construction costs. Specifically, funding is a key challenge to addressing maintenance and repairs for an estimated 85 percent of museums. An estimated 80 percent of museums use donations or fundraising to address repairs. However, reliance on fundraising can pose challenges, particularly in rural areas with limited funding opportunities, or for museums with limited expertise or capacity for fundraising.
Why GAO Did This Study
Museums preserve history and serve an educational role. However, many museums are in aging buildings, and their building systems may need repair or replacement to prevent damage to collections. While the federal agency, the Institute of Museum and Library Services (IMLS), supports museum programs and services, museums are prohibited from using IMLS funds for building construction.
The Joint Explanatory Statement accompanying the Departments of Labor, Health and Human Services, and Education, and Related Agencies Appropriations Act, 2024, includes a provision for GAO to study the availability and conditions of museum facilities. This report examines the reported physical conditions of museum facilities and the estimated cost and challenges to addressing facility repair needs. GAO’s scope included public (other than federal) and private nonprofit museums, excluding museum disciplines focused on living collections, like zoos.
GAO conducted a sample survey generalizable to an in-scope population of nearly 16,700 museums in 50 states and the District of Columbia. The survey results can be found on the “Additional Data” link of GAO’s website. GAO visited 17 museums across two Tribal Nations, six states, the District of Columbia, and Puerto Rico. GAO selected these jurisdictions based on state or territorial funding for museum facilities, the number of natural disasters experienced in the last 5 years, and geography. GAO also interviewed officials from IMLS; local and tribal museums; state museum associations; and other museum stakeholders, including the American Alliance of Museums; Association of Tribal Archives, Libraries, and Museums; and Small Museum Association.
Abbreviations
ADA Americans with Disabilities Act
FEMA Federal Emergency Management Agency
FY fiscal year
HVAC heating, ventilation, and air conditioning
ICA Impoundment Control Act
IMLS Institute of Museum and Library Services
This is a work of the U.S. government and is not subject to copyright protection in the United States. The published product may be reproduced and distributed in its entirety without further permission from GAO. However, because this work may contain copyrighted images or other material, permission from the copyright holder may be necessary if you wish to reproduce this material separately.
March 10, 2026
The Honorable Shelley Moore Capito
Chair
The Honorable Tammy Baldwin
Ranking Member
Subcommittee on Labor, Health and Human Services, Education, and Related Agencies
Committee on Appropriations
United States Senate
The Honorable Robert Aderholt
Chairman
The Honorable Rosa DeLauro
Ranking Member
Subcommittee on Labor, Health and Human Services, Education, and Related Agencies
Committee on Appropriations
House of Representatives
Museums preserve history and serve an educational role in their communities. However, a 2019 study found that about a third of museums in the United States reported damage or loss of their collections due to moisture and improper storage, among other factors.[1] Additionally, a 2022 survey of art museum directors found that many museums have experienced damage to their facilities and collections, due to natural disasters and extreme weather.[2]
As museums age, their building systems or features, such as roofs and heating, ventilation, and air conditioning (HVAC) systems, require ongoing maintenance to ensure they function properly.[3] Deferring such maintenance and repairs may increase the severity of problems and shorten the life of the building system.[4] We previously reported that deferring maintenance can reduce an organization’s ability to carry out its mission, decrease facility quality, and result in higher repair costs.[5]
The Institute of Museum and Library Services (IMLS), established in 1996, is a federal agency authorized to provide federal funding to museums for programming and services. It awarded about $42 million to museums through discretionary grants programs in fiscal year (FY) 2025.[6] In early 2025, an executive order directed IMLS to eliminate nonstatutory components and functions and to reduce the related performance of statutory functions to the minimum required by law.[7] However, in November 2025, a federal district court “vacated” previous actions to implement the order in their entirety and granted a permanent injunction prohibiting “any further action to implement” the order with respect to IMLS.[8] According to IMLS officials, the agency obligated all FY 2025 funds and reinstated all grants.[9]
As an administrator of federal grants that support museums nationwide, IMLS is responsible for managing and overseeing discretionary grants to museums. However, since September 2003, museums have been prohibited from using these funds for construction-related expenses.[10]
The Joint Explanatory Statement accompanying the Departments of Labor, Health and Human Services, and Education, and Related Agencies Appropriations Act, 2024, includes a provision for us to examine the conditions of museum facilities.[11]
For the purposes of current IMLS grants, federal law defines museums as public, tribal, or private nonprofit institutions, organized on a permanent basis for educational, cultural heritage, or aesthetic purposes.[12] They may exhibit tangible objects that are either animate or inanimate, provide exhibitions and programs, or steward a historic site. They include different types of disciplines, such as art, history, and science. IMLS’s 2025 National Museum Survey data consist of more than 19,500 museums in the U.S., as of February 2025.[13]
This report examines the (1) reported physical conditions of museum facilities; (2) estimated cost to address museum facility repair needs; and (3) challenges to addressing museum facility repair needs, according to stakeholders.
To address these objectives, we:
· reviewed relevant federal laws and regulations, along with IMLS data and documents;
· interviewed IMLS officials and stakeholders from 15 museum organizations and held a discussion group with representatives from small museums at the 2025 Small Museum Association annual conference;
· conducted a nationally representative stratified random sample survey of museums from April through May 2025.[14] From a population of 16,686 in-scope museums, we sampled 324 museums and received 138 valid survey responses, resulting in an unweighted and weighted response rate of around 40 percent. Estimates generated from the survey, adjusting for nonresponse, are generalizable to the entire target population of museums in our scope.[15] Museum survey results can be found in this report and in the “Additional Data” link of our website for this report, GAO‑26‑108485; and
· conducted site visits to selected museums to supplement information we collected from the survey. We visited 17 museums, including two in Tribal Nations and 15 in six states (Alaska, California, Georgia, Indiana, Maine, and Virginia), the District of Columbia, and one territory (Puerto Rico). We selected these jurisdictions based on variation in the amount of funding the state or territory provided for museum facilities, the number of natural disasters experienced in the last 5 years, and geography, among other factors. We selected the museums based on facility repair needs, museum discipline, and our resource considerations. We also visited tribal museums, including those in development, and museums in Puerto Rico to obtain and supplement information that could not be collected from the survey. At these museums, we observed building features and interviewed museum representatives to get firsthand experience and perspectives on the physical conditions of museum facilities. The size of museums we visited varied widely, from a historic house museum to a large, multistory, purpose-built museum.
For more information about our objectives, scope, and methodology, see appendix I.
We conducted this performance audit from January 2024 to March 2026 in accordance with generally accepted government auditing standards. Those standards require that we plan and perform the audit to obtain sufficient, appropriate evidence to provide a reasonable basis for our findings and conclusions based on our audit objectives. We believe that the evidence obtained provides a reasonable basis for our findings and conclusions based on our audit objectives.
Background
Museum Governance Structure
Museums have different governance structures that can affect the responsibilities and funding for facility maintenance and construction. Many museums are private, nonprofit organizations with a board governing structure, whereas other museums are public institutions within a state, tribal, county, or municipal governance structure, according to the American Alliance of Museums.[16] A museum can also be part of a system of museums, comprised of multiple museums in different locations within a city or a state.
The responsibility for carrying out and paying for facility maintenance and repairs can vary, depending on the governance framework of the museum. Likewise, responsibility for maintenance and repair can depend on who owns the building the museum occupies. Museums in leased spaces may rely on the building owners to handle all or only certain repairs, such as those affecting the outside of the building. Museums that share a building with other entities, such as local government agencies, may need to coordinate with multiple entities for repair needs.
Characteristics of Museum Facilities
Museums exist within a variety of building configurations. Some occupy buildings not originally designed to serve as museums, such as former office buildings or airplane hangars, retail mall spaces, or historic homes. Some are in standalone buildings, and others are co-located in residential or municipal buildings that can include administrative offices, businesses, or a library. Certain museums are composed of multiple buildings, such as a historic site with a separate visitor center. Further, a museum’s facility needs may have changed since the museum was originally built.
Museum design standards. Museum buildings generally provide open space to accommodate exhibits and visitors, as well as security. In addition, national and international museum associations have developed guidelines that recommend museums to have stringent environmental controls to protect their collections. These may include specific humidity levels, lighting, and temperature controls.
Museums can also be accredited by the American Alliance of Museums, which involves examining building conditions to determine whether they meet certain facility standards and assessing whether museums can ensure the safety of collections.[17] According to the American Alliance of Museums, accreditation is recognized as the gold standard of museum excellence, and 1,125 museums were accredited as of November 2025. According to IMLS officials, this represents less than 3 percent of the total museum population.
Outside of accreditation, museums can participate in other standards-based assessments and programs from the American Alliance of Museums and other organizations, depending on the museum’s size, needs, and resources. For example, small and midsized museums may review their museum’s facilities and the building environment as it relates to collections care through the Collections Assessment for Preservation program and the Museum Assessment Program.[18]
Museum facilities are also subject to certain federal requirements, including ensuring that buildings are physically accessible to people with disabilities, with certain exceptions. Older buildings may have been constructed at a time when physical accessibility standards did not exist. However, the Americans with Disabilities Act (ADA) of 1990 requires museum buildings constructed after 1994 to accommodate people with disabilities, and any alterations that affect the usability of museums must, to the maximum extent feasible, accommodate people with disabilities in the altered portion of the museum.[19]
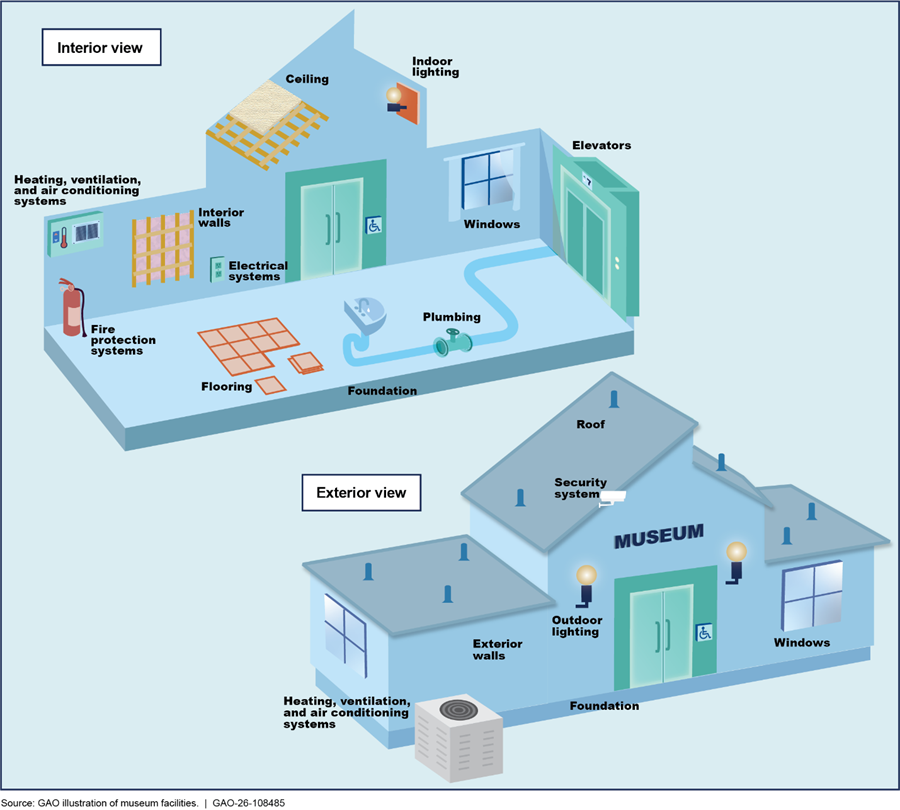
Common museum building features. Common museum building features include roof and exterior walls and systems such as HVAC, electrical, fire protection, and plumbing, as shown in figure 1.
Facility assessments. An assessment of the conditions of building systems can help museum staff make informed decisions about maintaining their facilities. Such an assessment often includes an inventory with information, such as the date of a system’s prior repair or replacement and the expected lifespan of a building system, before replacement is needed. To identify deficiencies, museum staff can conduct a systematic inspection of their building systems and features, also known as a facility condition assessment.[20] These facility condition assessments can help staff identify the building’s maintenance and repair needs and develop cost estimates to address facility deficiencies, which can help them plan and budget.
IMLS Roles and Other Federal Resources
IMLS was established as a federal agency in 1996, incorporating the functions from the previously existing Institute of Museum Services.[21] As previously mentioned, the agency is authorized to award discretionary grants supporting museum services activities but is prohibited by statute from awarding funds for construction. In FY 2025, IMLS announced awards of about $42 million to museums through eight discretionary grant programs.[22] According to IMLS documentation, the Museums for America grant is IMLS’s largest source of federal funding for museum programs and services. The Museums for America grant program supports museums of all sizes and disciplines to serve the public through exhibitions, educational programs, and collections management.
In addition to awarding financial assistance, IMLS has statutory authority to collect data on museum programs and information services.[23] In February 2024, IMLS officials told us they began a study on museum and library infrastructure to assess the physical conditions of museums, in response to a provision included in House Report 117-403.[24] According to IMLS officials, the purpose of the study was to assess the physical infrastructure needs of libraries and museums located in rural, disaster prone, and underserved regions, in particular. The study was to explore the met and unmet infrastructure needs in these areas, which would lay the groundwork for future consideration of potential solutions. In December 2025, IMLS officials said that they were working to develop a summary report of that study for Congress.
Although museums are prohibited from using IMLS funds for construction expenses, other federal grants have been available for preserving historic buildings. For example, the Department of the Interior’s Save America’s Treasures program provides competitive grants for the preservation of collections and historic properties that are nationally significant and threatened or endangered.[25] In FY 2024, about $26 million was available from this federal grant program for eligible entities, which could include eligible museums in historic buildings to support the preservation of nationally significant historic properties and collections.
An Estimated Three-Quarters of Museums Identified Health or Safety Concerns from Building Conditions; Older Buildings Face Particular Challenges
An Estimated 73 Percent of Museums Identified a Potential Health or Safety Concern, with 49 Percent Citing a Concern Related to Physical Accessibility
On the basis of our nationally representative survey of museums, we estimate that 73 percent of museums, or about 11,900, have at least one building system or facility issue that poses a potential health or safety concern.[26] For example, we estimate that nearly half of museums have a physical accessibility issue (i.e., physical barrier to movement or access) that poses a potential health or safety concern (see fig. 2).[27] Respondents to open-ended questions in our survey cited specific concerns, such as steps that pose a trip hazard and the need to navigate stairs when there is no elevator alternative. One museum representative expressed concern that older visitors must navigate a set of concrete stairs to enter the programs room. We previously reported that facilities with physical barriers limiting access can exclude people with certain disabilities from participating in community activities in those facilities.[28]
Figure 2: Estimated Percentage of Museums Identifying Potential Health or Safety Concerns Related to Building Issues
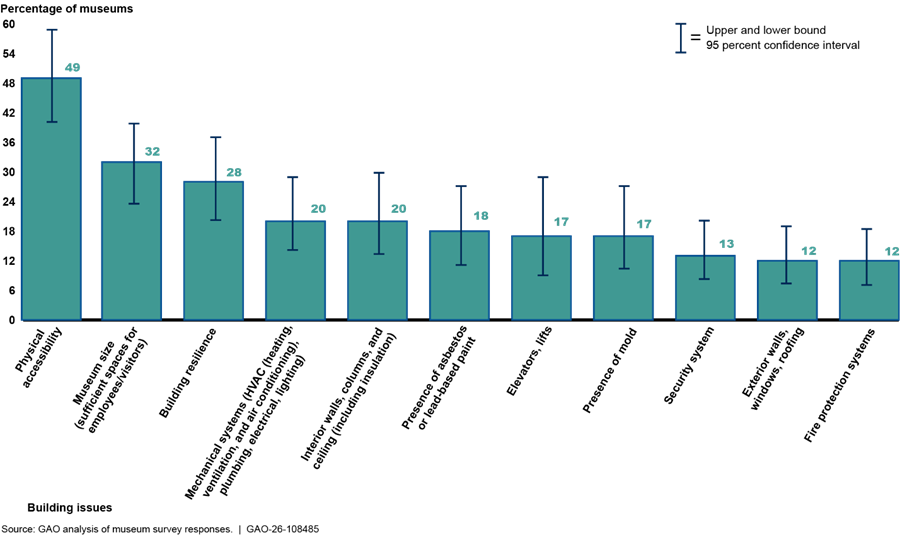
Note: We asked respondents to identify whether the condition of a building system was a health or safety concern. Percentages shown are those answering “yes” and “somewhat” among those museums for which the system is applicable. Each system was applicable for an estimated 86 percent or more of museums, except for elevators/lifts, which were applicable for an estimated 59 (51, 68) percent of museums. The other response options were “no” and “not sure.” We administered the survey from April 2025 through May 2025. The thin bars (whiskers) display the 95 percent confidence interval for each estimate. Bars with nonoverlapping whiskers are statistically different at the 5 percent significance level.
Of six specific barriers to accessibility, such as inaccessible entrances, we estimate that about 9,600 museums (59 percent) have at least one barrier in their primary building.[29] For example, an estimated 46 percent of museums do not have an accessible route available for some indoor public spaces in their primary building (for example, no ramp, elevator, or lift is available when steps are required) (see fig. 3).[30] We estimate that additional reported barriers include no or insufficient accessible parking (29 percent), entrances (26 percent), and bathrooms (26 percent).[31]
Figure 3: Estimated Percentage of Museums Identifying Certain Physical Barriers to Accessibility in Their Primary Building
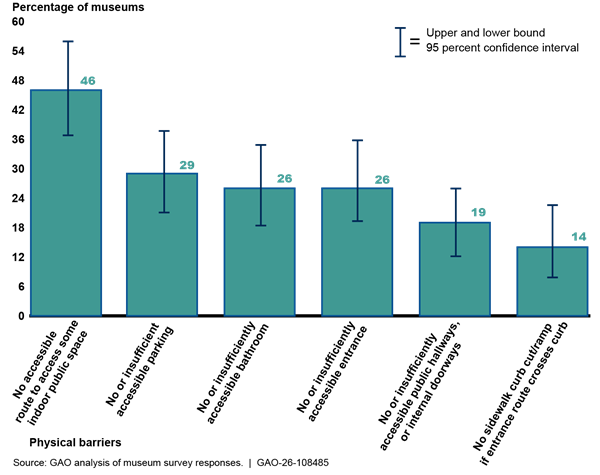
Note: In this report, we define barriers as structural or physical features that have the potential to limit access for a person with disabilities. Percentages shown are those answering “have this barrier.” Survey respondents could write in additional “other physical barriers,” which included deteriorating ramps, unpaved paths, and other answers. Respondents were asked to judge whether their museum had these barriers in their primary public building. An estimated 46 (37, 55) percent of museums have more than one building, but we did not ask respondents to identify barriers in other buildings. We administered the survey from April 2025 through May 2025. The thin bars (whiskers) display the 95 percent confidence interval for each estimate. Bars with nonoverlapping whiskers are statistically different at the 5 percent significance level.
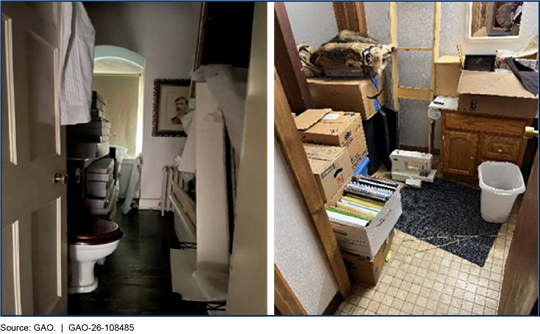
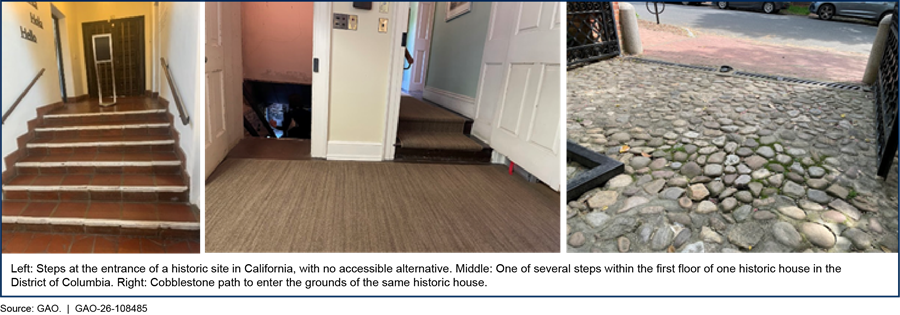
Further, at eight of the 17 museums we visited, representatives cited concerns about inaccessible entrances and steps required inside their museum. For example, one historic site we visited in California is on a hill and requires walking up what amounts to five flights of stairs, and there is no elevator or other accessible alternative to reach the site. In a historic home we visited in the District of Columbia, uneven cobblestone steps lead up to the museum, the first floor has several doorways between rooms that require steps up or down, and there is a step at the entrance of each bathroom (see fig. 4). Representatives said a ramp at one of those first-floor doorways would need to be about 16 feet long to have the appropriate slope. Representatives from five of the 17 museums we visited expressed concern about steep ramps on their properties.
Representatives from national museum organizations we spoke with emphasized physical barriers as common features of older museums, particularly small historic homes and buildings. According to our survey, an estimated 8,800 museums (53 percent) have a primary building built over 100 years ago (1923 or prior; see fig. 5).[32] Stakeholders pointed out that older buildings may have space or cost limitations that prevent modernization, and the cost of installing accessibility features, such as ramps or elevators, may be too high for a museum with a small budget. In one historic house we visited in the District of Columbia, representatives were interested in installing an elevator to access a potential exhibition space in the basement. However, they said they would face increased project costs because of needing to find workers skilled in construction in historic spaces. Another stakeholder said a museum may need to fund other deferred maintenance projects first, and those costs have likely increased over the years.
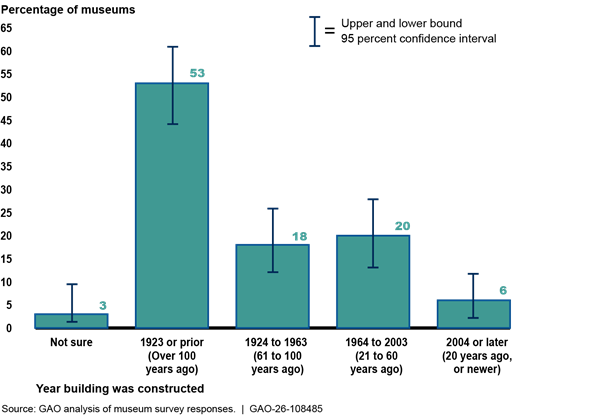
Note: We asked museums to identify the year their primary public building was constructed. However, an estimated 46 (37, 55) percent of museums have more than one building, and we did not ask respondents to identify the year other buildings were constructed. We administered the survey from April 2025 through May 2025. The thin bars (whiskers) display the 95 percent confidence interval for each estimate. Bars with nonoverlapping whiskers are statistically different at the 5 percent significance level.
Museum stakeholders, respondents to our survey, and representatives from museums we visited mentioned the challenges of improving accessibility, given historic preservation requirements specifying that building modifications cannot compromise historic building features. According to our survey, we estimate that 56 percent of museums maintain their primary building as a historic building, preserving the integrity of the historic materials or features.[33]
An Estimated 77 Percent of Museums Identified at Least One Building Issue That Puts Collections or Exhibits at Potential Risk
We estimate that 77 percent of museums (about 12,300) identified that the condition of at least one building system or building issue poses a potential risk of damage or loss to their collections.[34] For an estimated 63 percent, the size of museum storage space is the most frequently identified risk to potential damage or loss of collections (see fig. 6).[35] Survey respondents expressed concerns with having to store collections in areas that put their collections at risk of damage from uncontrolled humidity or temperature, as well as water intrusion. Stakeholders from national museum organizations and museums we visited emphasized that maintaining environmental controls (such as controlled temperature and humidity) is important to preventing damage to collections. They added that environmental controls can be strict, particularly for museums that receive collections loaned from other museums. Smaller percentages of museums reported other risks, with some survey respondents discussing, for example, risks related to manually transporting collections between floors, when an elevator is not functional or available.
Figure 6: Estimated Percentage of Museums Identifying Potential Risks to Collections or Exhibits Related to Building Issues
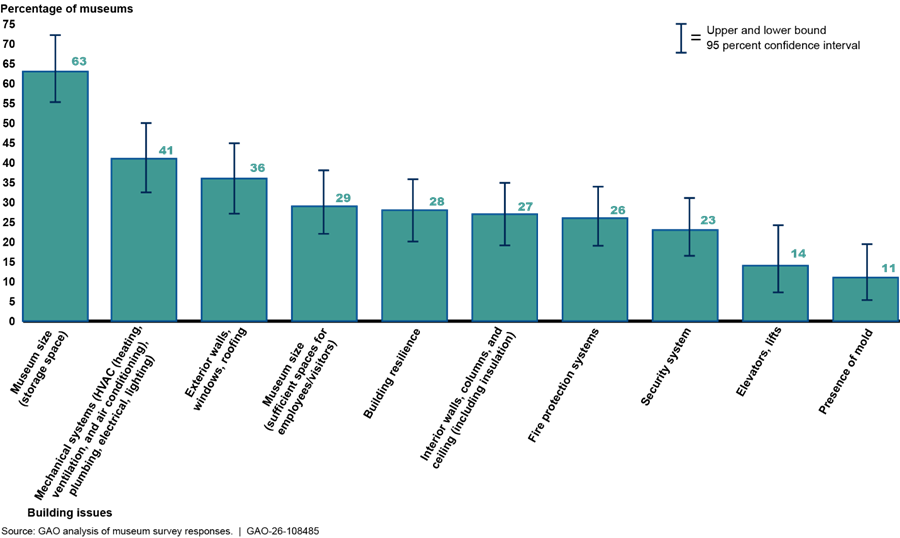
Note: Percentages shown are those answering “yes” and “somewhat” to whether the condition of a building system or building issue poses a risk to collections or exhibits, among those museums for which the system or issue is applicable. Each was applicable for an estimated 85 percent or more of museums, except for elevators/lifts, which were applicable for an estimated 60 (51, 69) percent of museums. The other response options were “no” and “not sure.” We administered the survey from April 2025 through May 2025. The thin bars (whiskers) display the 95 percent confidence interval for each estimate. Bars with nonoverlapping whiskers are statistically different at the 5 percent significance level.
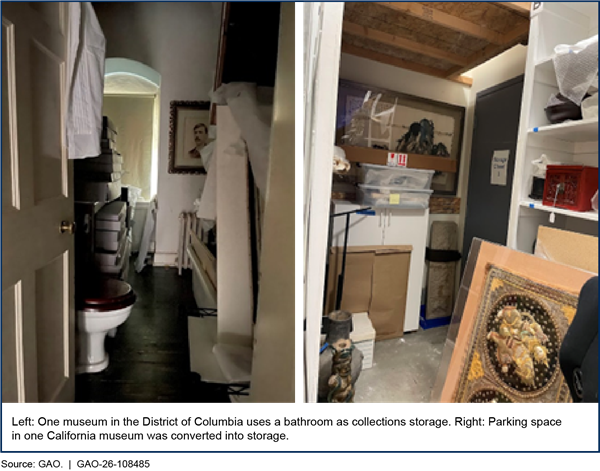
We estimate that for 74 percent of museums, their storage space does not meet their needs, or only somewhat meets their needs.[36] One stakeholder noted that most museums have a small percentage of their collections on display at any one time, and the rest are typically in storage. One respondent to our survey noted that without proper or larger storage areas, they must remove or dispose of exhibits to make room for other items. Representatives at five of the 17 museums we visited described storage areas that put collections at risk of damage or loss, for example, from having no or insufficient climate controls.[37] Representatives from one museum in the District of Columbia said they needed to use a bathroom for storage of fine art (see fig. 7). In another museum we visited, representatives were concerned about periodic flooding in the basement, which, along with the lack of climate-controlled storage, endangers the collections stored there.
We estimate that for 41 percent of museums, the condition of mechanical systems, such as HVAC, poses a risk, or potential risk, of damage or loss to their collections.[38] However, building systems do not need to be in poor condition to put collections at risk, particularly when leaks, temperature fluctuations over time, and inadequate storage conditions can damage collections.
Over 40 respondents to an open-ended question in our survey wrote that environmental factors, such as temperature fluctuations or water leaks, posed a risk to collections. One respondent wrote that unregulated temperatures and roof leaks threatened not only objects in their collection, but also the building itself, which they consider part of their collection. They added that the costs to retrofit a building built in the 1800s with temperature controls are very high but, given the increasing temperatures in their location, it is imperative to install them. Another respondent emphasized that even a short period of uncontrolled heat, cold, or moisture due to a malfunctioning mechanical system could damage their displays and lead to a loss of visitors. One respondent wrote that their museum experienced challenges in controlling humidity and temperature during extreme weather, which led to damage to the oldest photographs in their collection.
Respondents also discussed challenges with buildings not originally built to serve as museums that do not have appropriate climate controls for collections. On the basis of our survey, we estimate that most museums’ primary buildings (74 percent) were not originally constructed as museums.[39]
An Estimated 32 Percent of Museums Identified at Least One Building System in Poor Condition
On the basis of our survey, we estimate that about 5,200 museums (32 percent) have at least one building system in their primary building in poor condition.[40] Building systems frequently cited as needing repair or replacement beyond routine maintenance were HVAC and roof, among others (see fig. 8). In contrast, we estimate that 19 percent of museums have all their systems in their primary building in “good” or “very good” condition.[41] When looking at each system individually, we estimate that at least 50 percent of museums rated each system in “good” or “very good” condition.[42] For example, an estimated 77 percent of museums rate their foundation in “good” or “very good” condition.[43]
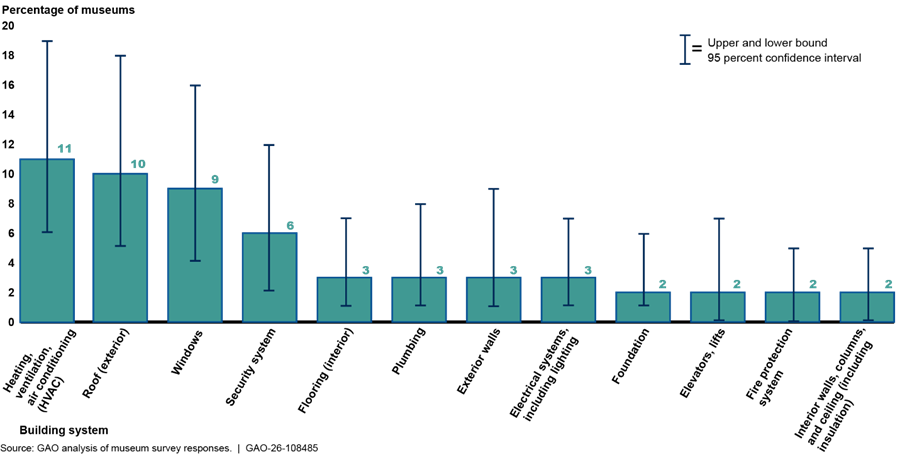
Note: Museums self-assessed a building system as in poor condition if it needs repair or replacement beyond routine maintenance and is not functioning as required or not meeting the museum’s needs. Response options were “very good,” “good,” “fair,” “poor,” “building does not have this feature but needs it,” “not sure,” and “not applicable.” Results in the figure are among those museums with the applicable system. Each building system was applicable for an estimated 89 percent or more of museums, except for elevators/lifts, which were applicable for an estimated 54 (46, 63) percent of museums. We asked museums to identify the condition of systems in their primary public building. However, an estimated 46 (37, 55) percent of museums have more than one building, and we did not ask respondents to identify the condition of systems in other buildings. We administered the survey from April 2025 through May 2025. The thin bars (whiskers) display the 95 percent confidence interval for each estimate. Bars with nonoverlapping whiskers are statistically different at the 5 percent significance level.
HVAC. We estimate that about 1,700 museums (11 percent) have an HVAC system in their primary building in poor condition.[44] Most responding museums in our sample with an HVAC system in poor condition in their primary building either do not have a planned repair or replacement project within the next 5 years or do not have funding allocated to fix their HVAC system.[45]
Representatives from seven of the 17 museums we visited also mentioned that their HVAC system was inefficient or ineffective. Staff from one museum in Maine said their museum building was constructed before modern HVAC technology standards, and they experience humidity that could degrade their paintings and wooden artifacts. Another museum in Maine that provides summer camps for children had to close for several days because their HVAC could not maintain comfortable temperatures. An art museum we visited in the District of Columbia noted that they maintain a partially redundant HVAC, and this backup system allows them to ensure they can maintain humidity levels, which is crucial to their ability to borrow items and collections to exhibit.
Roof. On the basis of our survey, we estimate that about 1,600 museums’ (10 percent) primary building’s roof is in poor condition.[46] Representatives from seven of the 17 museums we visited mentioned needing roof repair or replacement, which can be high-cost projects. For example, representatives from one museum we visited in Indiana said their building still had the original roof from 1989. While the roof is older than its expected lifespan, the museum did not have the funds to repair the roof at the time of our visit, which they estimated would cost over $1 million. They further expressed concerns about the negative effect of their roof’s deficiencies on environmental controls for their collection.
One museum stakeholder noted that roof repairs can be an especially challenging issue for historic homes—renovations within the required parameters of historic preservation can cost millions and take years. We visited an Indiana museum on the National Register of Historic Places, where representatives told us that moisture issues related to a failing roof are the cause of most of the internal damage to their building. They added that keeping the building watertight is the highest priority for the museum, making the roof replacement its most important project. However, the museum has an operating budget of just over $200,000, and they estimate it will cost $1.2 million to replace the roof.
Building envelope and water intrusion. The quality of the building envelope—exterior walls, windows, roof, and foundation—can also affect the performance of other building systems. We estimate that about 3,000 museums (19 percent) have some element of the building envelope in their primary building in poor condition.[47] The building envelope separates indoor and outdoor environments and affects comfort, lighting, energy efficiency, and the functioning of other building systems. Damage to the building envelope can increase energy use and costs, lead to moisture intrusions, and may cause mold or damage inside the building.[48]
Representatives from 12 of the 17 museums we visited said they experienced issues with water intrusion. Representatives told us that water intrusions have affected flooring, caused mold concerns, and threatened collections. Representatives from five museums we visited said they suspected, or had experienced, mold in their building due, in part, to water intrusion. Several respondents to our survey discussed mold or concern about potential mold in their museums.
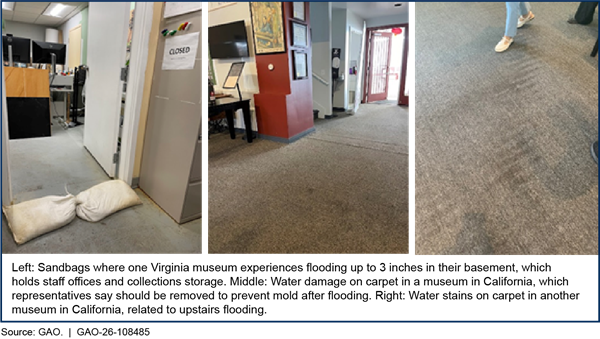
One Virginia museum we visited showed us sandbags placed in the basement, which has experienced up to 3 inches of flooding. The basement holds staff offices and collections storage, and representatives said they removed the carpet to help prevent mold from forming (see fig. 9). A California museum we visited also uses sandbags during heavy rain. Representatives said water enters from the back door and from roof leaks, and they hope to replace their 20-year-old carpet, as their biggest health or safety concern is whether mold has grown underneath the carpet.
|
Tribal Museums and Cultural Centers Face Facility Challenges
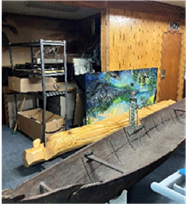
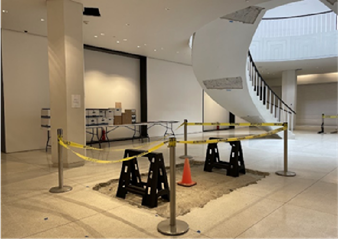
Representatives from several tribal entities we spoke to were interested in building, or actively planning to build, a dedicated museum or cultural center that would enable them to store repatriated items. One representative from a national tribal organization estimates that the cost to do the preliminary planning to set up a cultural facility is about $250,000. One Tribe we visited said they estimate the planning phase for their future facility will cost between $300,000 and $450,000, though they note that capital projects are very hard to fund. For Tribes that have dedicated museums and cultural centers, some may face facility challenges. One tribal cultural center we visited had moved into a temporary space, as their original building was in a coastal surge zone and vulnerable to natural disaster. They store their collections in a basement, which is at risk of flooding and has no museum-grade storage (see photo). Tribal officials said they have been in the temporary building since 2020 and expect to be there at least another 3 years, until they can secure funding for a new facility. Sources: GAO analysis of interviews with representatives from tribal entities, a state museum association, and tribal officials; 25 U.S.C. § 3001, et seq; 43 C.F.R. part 10; and GAO (photo). | GAO-26-108485. |
Some Museums Report Facing Facility and Resiliency Challenges Related to Aging Buildings
Older museum buildings can also have challenges that a stakeholder called “aging building syndrome,” or having building systems that need more repair or replacement over time. Representatives from several museums we visited mentioned facing maintenance and repair needs related to aging buildings, including entire systems that were repaired in a piecemeal fashion and now need total replacement. One stakeholder from a national museum organization mentioned that maintaining environmental standards, like temperature and humidity, can require high energy usage; other stakeholders mentioned that a higher level of capital investment may be needed to update aging building systems in museums. Stakeholders from one museum organization in Alaska told us that aging systems are a significant infrastructure challenge for museums in the state. They added that most museums in Alaska have deferred maintenance projects for years—particularly roof and HVAC projects—and that costs have increased over time, due to inflation. These stakeholders believe that the project costs are now out of reach for most Alaskan communities.
|
Zoo, Aquarium, and Public Garden Facility Issues Although we did not include zoos, aquariums, and public gardens in our survey and site visits, we spoke with representatives of national associations representing those types of museums. Representatives from one such organization commented that natural disasters and extreme weather events (such as droughts or storm surges) can threaten or destroy outdoor living collections. They said there is no readily available funding mechanism to replace outdoor living collections, which makes recovery particularly challenging. If a public garden has to close to clean up after a natural disaster or extreme weather, they also experience a loss in revenue. These representatives also told us that steep terrain may be an accessibility challenge for visitors to public gardens, though it may be cost prohibitive to address accessibility barriers over what may be acres of land. They added that older public gardens’ infrastructure was not designed to meet modern accessibility features. Further, they said that historic preservation requirements may inadvertently conflict with modern accessibility requirements. In contrast, representatives from a national zoos and aquariums association said that although zoos and aquariums face challenges with aging buildings, many have been renovated to be more accessible. They commented that these facilities are also generally well maintained to meet zoo and aquarium accreditation standards, which are specific to the needs of their disciplines. Source: GAO analysis of interviews with representatives from a national public gardens association and a national zoos and aquariums association. | GAO‑26‑108485 |
The age and condition of some older museum buildings can lower the museums’ resiliency to natural disasters and extreme weather. We estimate that about 6,900 museums (41 percent) experienced a natural disaster or extreme weather from 2020 through 2024.[49] According to the Federal Emergency Management Agency, building codes have improved over the past few decades to better protect against natural disasters, such as flooding, high winds, and earthquakes.[50] However, as discussed above, we estimate that more than half of museum buildings were constructed more than 100 years ago, before these building codes were in place.
Several stakeholders said that resiliency against the impact of natural disasters is a topic of interest to museums, though funding availability and competing priorities make it challenging for them to increase resiliency. We estimate that 41 percent of museums do not have a disaster preparedness plan with staff trained to implement it.[51] One respondent to our survey wrote that in the event of a major weather emergency, their collections are susceptible to complete loss. A museum stakeholder noted that small museums may need to rely on local insurance companies that do not cover their collections for their actual value.
|
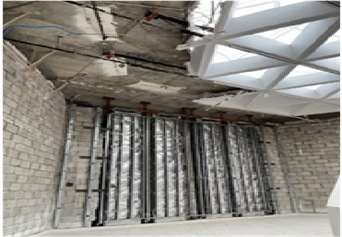
Museums and Historic Structures in Puerto Rico Face Challenging Conditions from Natural Disasters and Environmental Stressor
These officials added that agency budget cuts have also meant that only a small amount of maintenance for certain historic properties is funded. They added that historic buildings in Puerto Rico are costly to run, as they have large energy bills, and several historic sites and museums on the island experience water leaks and frequent power outages that lead to humidity and fungus. Additionally, exposure to hurricanes creates a need for constant maintenance and repair. Sources: GAO analysis of interviews with officials in Puerto Rico and museum representatives; GAO, Puerto Rico Recovery: FEMA Made Progress in Approving Projects, But Should Identify and Assess Risks to the Recovery, GAO-21-264 (Washington, D.C.: May 19, 2021); and GAO (photos). | GAO-26-108485 |
Total Cost for Facility Repair Needs Is Unknown, but Most Museums Report Persistent or Growing Deferred Maintenance Backlogs
Absence of Data and Limitations in Resources and Staff Expertise Are Challenges to Estimating Nationwide Facility Repair Costs
The total cost to address museum facility maintenance and repair needs nationwide is unknown. No such data have been collected, according to one stakeholder from a national museum association. According to several museum association stakeholders, many museums do not have such data on their facilities because of resource limitations. Two museum stakeholders told us there are no statewide museum facility assessments in their states in part because their states do not have museum agencies with the funding and authority to conduct studies on the cost of facility maintenance and repair needs. IMLS officials said that the cost estimates that do exist for specific museums may vary widely, as museums could interpret cost questions by reporting costs to bring facilities to an optimal condition, rather than to complete basic maintenance to reach a state of good repair. Furthermore, officials added that there are additional challenges to determining costs, if the museum rents or shares space with another entity.
Museum stakeholders cited challenges to conducting facility condition assessments and developing cost estimates, including (1) funding needed to conduct a study, (2) staff expertise to report accurate information, and (3) variations in how repair costs are estimated. On the basis of our survey, we estimate that 33 percent of museums conducted a facility condition assessment for their primary public building from 2014 through 2024.[52]
One stakeholder we spoke to said that large museums generally have the capacity to conduct facility condition assessments, as opposed to small museums with few or no paid staff, who may be balancing higher priorities. We estimate that 25 percent of museums have no full-time paid staff, and 44 percent of museums have one to three full-time paid staff.[53] One stakeholder added that lending and borrowing institutions may have facilities condition information, due to requirements to protect loaned items. Some museums seeking accreditation may conduct a facility condition assessment, stakeholders added, but the process is costly, and relatively few museums have obtained accreditation.
Museum stakeholders we spoke to also identified differences in museum building infrastructure that can affect facility needs and related costs. For example, museums that have airplane hangars, theaters, planetariums, or have outdoor exhibition spaces to maintain each have different needs. Similarly, museums—such as children’s museums—with interactive exhibits experience distinct types of wear and tear. Museums with fine art galleries that may house paintings and historic collections often have specific humidity and temperature standards, which require different types of upkeep that affect their needs and related costs.
An Estimated 85 Percent of Museums Report Having a Deferred Maintenance Backlog, and 38 Percent Report an Increasing Backlog Since 2022
We estimate that 85 percent of museums (about 13,700) have a backlog of deferred facility maintenance and repairs (see fig. 10).[54] Nearly half (49 percent, or about 7,900 museums) have over $100,000 in deferred maintenance and repairs.[55] In addition, we estimate that 20 percent of museums spent over $100,000 on deferred maintenance in 2023, while 8 percent did not spend any money that year addressing their deferred maintenance backlog (see fig. 11).[56]
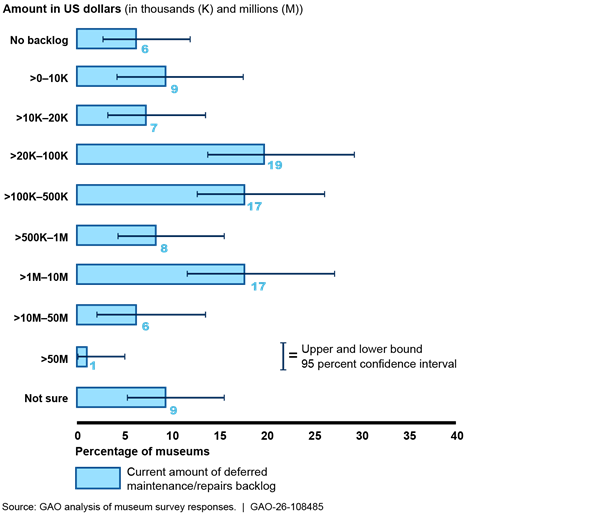
Note: Our survey asked respondents to estimate their museum’s current amount of deferred maintenance backlog. We administered the survey from April 2025 through May 2025. The thin bars (whiskers) display the 95 percent confidence interval for each estimate. Bars with nonoverlapping whiskers are statistically different at the 5 percent significance level.
Figure 11: Estimated Amount That Museums Identified Spending in 2023 on Their Deferred Maintenance Backlog
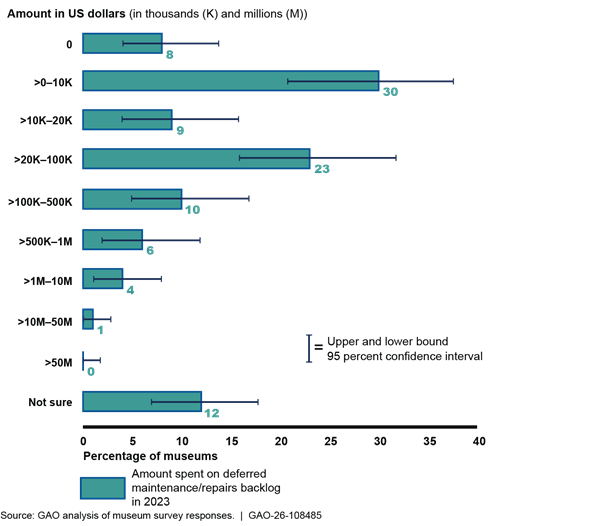
Note: Our survey asked respondents to estimate their museum’s amount spent addressing deferred maintenance and repairs in 2023. We administered the survey from April 2025 through May 2025. The thin bars (whiskers) display the 95 percent confidence interval for each estimate. Bars with nonoverlapping whiskers are statistically different at the 5 percent significance level.
We and others have previously reported on the negative consequences of deferred maintenance and repair.[57] Deferring maintenance can limit an organization’s ability to carry out its mission, shortening the life and value of a facility, and potentially leading to significantly higher maintenance and repair costs. It can also lead to systems not functioning as required, resulting in poor facility conditions, such as leaking roofs, mold, defective HVAC, or other systems that are no longer energy efficient or safe. For example, one museum we visited in Indiana does not have adequate funds to complete a roof replacement they believe will cost over $1 million, which is negatively impacting their ability to control humidity and temperatures to protect their collections.
A substantial backlog of deferred maintenance can even necessitate the construction of an entirely new building. For example, stakeholders told us about one museum in Alaska with a large backlog of deferred maintenance that, after experiencing 2 consecutive years of flooding, now faces repair costs that exceed the cost of constructing a new building.
As we have previously reported, however, a backlog of deferred maintenance does not necessarily indicate greater future maintenance and repair needs.[58] Sometimes an institution has no plans to make repairs because a new system is scheduled to be installed in the near future.
Many museums reported being unable to significantly reduce their deferred maintenance backlog. On the basis of our survey, we found that an estimated 79 percent of museums experienced an increase, or no change, in the size of their deferred maintenance backlog in the past 3 years (from 2022 through 2024).[59] Specifically, 38 percent experienced an increase, 10 percent experienced a reduction, and 41 percent experienced no change in their deferred maintenance backlog (see fig. 12).[60]
Figure 12: Estimated Percentage of Museums Whose Deferred Maintenance Backlog Increased, Decreased, or Remained the Same in the Past 3 Years, 2022–2024
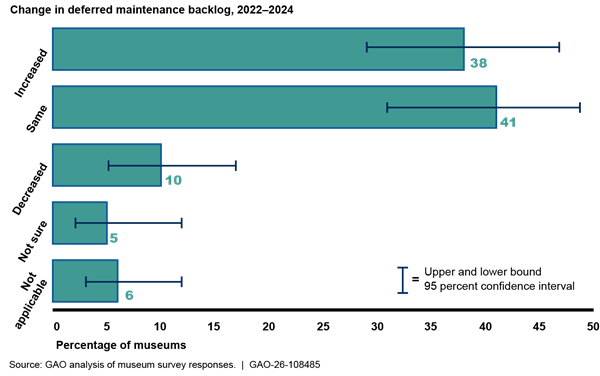
Note: Our survey asked respondents to estimate whether their deferred maintenance backlog changed from 2022 through 2024. Survey respondents had the choice of selecting “not applicable” as a response option, but we did not collect data on why the change in deferred maintenance backlog is not applicable. We administered the survey from April through May 2025. The thin bars (whiskers) display the 95 percent confidence interval for each estimate. Bars with nonoverlapping whiskers are statistically different at the 5 percent significance level.
Based on their budget forecasts and planned projects, museum staff expressed pessimism about being able to address their deferred maintenance backlog. We estimate that 80 percent expect deferred maintenance for their facilities to either remain the same or increase in the next 3 years (from 2025 through 2027).[61] An estimated 39 percent anticipate an increase to their backlog (see fig. 13).[62]
Figure 13: Estimated Percentage of Museums Expecting Deferred Maintenance to Increase, Decrease, or Remain the Same in the Next 3 Years, 2025–2027
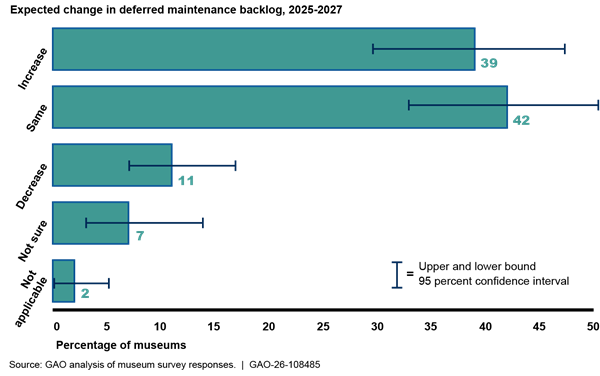
Note: Our survey asked respondents to estimate whether they expect their deferred maintenance backlog to change in the next 3 years (2025 through 2027). Survey respondents had the choice of selecting “not applicable” as a response option, but we did not collect data on why their expected change is not applicable. We administered the survey from April 2025 through May 2025. The thin bars (whiskers) display the 95 percent confidence interval for each estimate. Bars with nonoverlapping whiskers are statistically different at the 5 percent significance level.
Museums Identified Funding Availability and Construction Costs as Key Challenges to Addressing Facility Repair Needs
Among the most common challenges to addressing facility maintenance and repair needs that museums cited in response to our survey are funding availability and construction costs (see fig. 14).
Figure 14: Estimated Percentage of Museums Rating a Challenge to Addressing Maintenance and Repair Needs as “Major” or “Moderate”
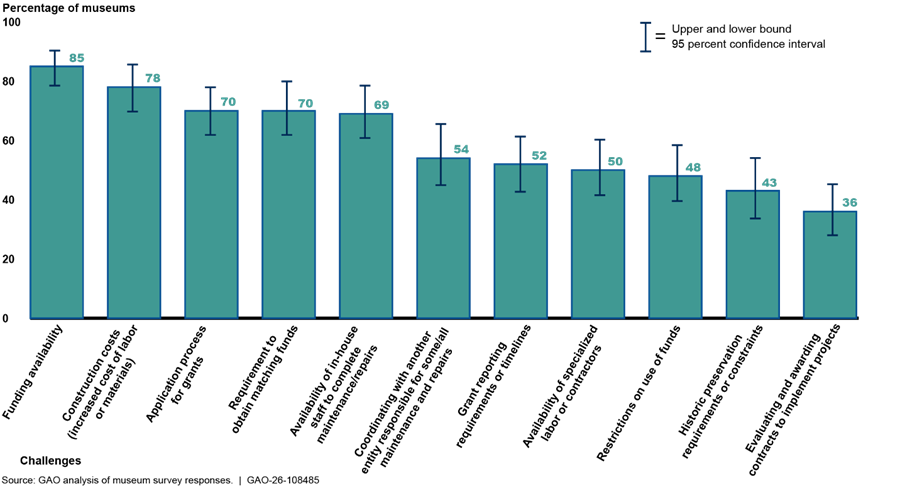
Note: Survey response options were “major challenge,” “moderate challenge,” “minor challenge,” “not a challenge,” “not sure,” and “not applicable.” Results in the figure are among those museums where the challenge was applicable. Each challenge was applicable for an estimated 80 percent or more of museums, except “coordinating with another entity” (applicable for 74 (65, 82) percent of museums), and “historic preservation” (applicable for 79 (70, 86) percent of museums). We administered the survey from April 2025 through May 2025. The thin bars (whiskers) display the 95 percent confidence intervals for each estimate. Bars with nonoverlapping whiskers are statistically different at the 5 percent significance level.
Funding availability. For an estimated 85 percent of museums (about 13,300), funding availability is a major or moderate challenge for addressing their maintenance and repair needs.[63] One museum association stakeholder said that museum funding is largely a patchwork of competitive grants, little of which are for operating support. Representatives from nine of the 17 museums we visited also said that funding availability is a challenge to making needed building repairs. For example, staff from a museum we visited in Indiana said their annual operating budget was $212,000. Last year, the museum spent over $289,000 on building repairs, which representatives said was only possible through a capital campaign to fund building repairs and obtain grants for building preservation. Along with other repairs, staff estimated needing another $200,000 to rewire the building, as the electrical work has not been updated since the 1930s, and they also estimated needing $1.2 million for roof replacement.
Representatives from one museum association we interviewed also said that insufficient funding to maintain facilities may result in a museum’s closure. Two stakeholders also told us that available funding for museums largely supports programming (such as community events, speakers, and presentations), with few available external funding sources covering maintenance and repair needs or capital projects. Three stakeholders mentioned additional funding availability challenges, including:
· limited and restricted grant funding;
· museums located in rural areas with marginal resources;
· part-time or seasonal museums earning more limited revenue; and
· insufficient municipal funding for municipal museums, where competing priorities may result in limited funding to address deferred maintenance.
We estimate that 80 percent of museums used donations or fundraising for maintenance and repairs from 2020 through 2024 (see fig. 15).[64] Of museums that used fundraising or capital campaigns to fund maintenance, an estimated 30 percent cited these sources as the primary funding sources they used to address maintenance in that period.[65]
Figure 15: Estimated Percentage of Each Funding Source That Museums Used for Maintenance and Repairs from 2020-2024
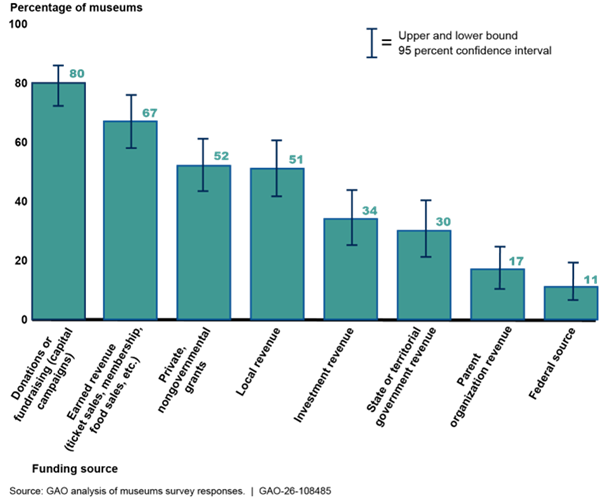
Note: Survey results are of museums that made repairs from 2020 through 2024; an estimated 5 percent of museums did not make any repairs in this period. We administered the survey from April 2025 through May 2025. The thin bars (whiskers) display the 95 percent confidence interval for each estimate. Bars with nonoverlapping whiskers are statistically different at the 5 percent significance level.
Two museum association stakeholders said that fundraising and capital campaigns are key funding sources for facility repair. However, they also cited challenges, such as limited interest from donors in funding maintenance or capital projects, rural areas with limited opportunities for corporate philanthropy, and disadvantages for museums without staff expertise in fundraising. One museum we visited also mentioned donor-restricted funds as a challenge. Small museums in particular may face challenges with limited staff capacity, as one stakeholder noted that fundraising is typically a labor-intensive, year-round effort.
Some museums receive public support from local or state governments, but the extent of public support varies.[66] Two stakeholders cited some state funding opportunities, including a state museum grant program in California funded by fees from special vehicle license plates, and funding for certain historic properties from a capital improvements grant in Pennsylvania. One official and other stakeholders we spoke to discussed challenges with state funding, including funding cuts; limited funding, or no revenue source to fund museums, in one state; and the need for political connections to obtain support for one-time projects. A representative from one museum we visited expressed concerns that state funding in their area largely goes to major cities and said that funds could be distributed more equitably.
Two museum stakeholders also mentioned several federal funding sources that have been available in past years for museum facility maintenance and repairs, though another stakeholder noted that federal funding is limited and typically focused on programming. Stakeholders also mentioned federal funding sources, including the Challenge Program at the National Endowment for the Humanities, the Historic Preservation Fund grant programs from the National Park Service, and IMLS funding.
However, in February 2024, IMLS officials told us that while IMLS grant funds can be used for conservation purposes, such as addressing humidity or fire suppression, these projects cannot lead to construction. They said that identifying the extent of modifying a building for conservation can be complicated. Officials explained that the prohibition for using IMLS funds for construction expenses is a “gray area” and may also prohibit funding for certain facility maintenance and repair needs, such as adding a sump pump in a basement to mitigate potential flooding during storms.
Construction costs. On the basis of our survey results, we estimate that 78 percent of museums (about 12,000) experience construction costs, such as increasing labor or material costs, as a major or moderate challenge for addressing their maintenance and repair needs.[67] In contrast, we estimate that 18 percent of museums consider construction costs as a minor challenge, or not a challenge, to addressing maintenance and repairs.[68]
Officials and representatives from a Tribe and a tribal museum we visited, and another museum stakeholder, discussed construction costs as being higher for rural and remote communities. A museum stakeholder in Alaska also said that construction costs are high because of the cost to transport materials by barge, or other off-road transport, and the need to bring in skilled workers where there may be a shortage. A stakeholder added that most museums in Alaska have years of accumulated deferred maintenance, resulting in costs that have increased over time, due to inflation. Two stakeholders noted that, in general, the rising costs of building materials and hiring skilled labor to perform repairs can exacerbate funding challenges for small museums.
Additionally, two museum stakeholders mentioned cost as a challenge for addressing physical accessibility barriers. According to one of these stakeholders, this can be a particularly acute challenge for small museums with limited budgets, and for older museums, where other priorities, such as deferred maintenance, compete with funding accessibility projects.
Other challenges to addressing maintenance and repair needs. Museums also cited several other challenges to addressing maintenance and repair needs. For an estimated 70 percent of museums, the application process for grants is a major or moderate challenge.[69] Two museum stakeholders said that small museums in particular face challenges in applying for grants due to having limited staff, competing priorities that reduce time available for staff to apply for grants, and limited expertise in writing grant applications. One state museum organization said that most museums in their state are small and volunteer run, whereas a large museum may have multiple staff members dedicated to fundraising. Museum stakeholders in Puerto Rico noted that language is an additional barrier for museums that want to apply for grants.
For an estimated 69 percent of museums, availability of in-house staff to complete maintenance is a major or moderate challenge to maintenance and repair.[70] One museum stakeholder noted that a small museum may have just a single staff member to address repairs, and they may lack maintenance and repair expertise. Further, a historic building may require specialized expertise for repairs, as was the case for representatives in Puerto Rico, who told us that specialists were required to mix materials for a wall repair in a historic building.
|
Tribal Representatives Said That Tribal Museums Face Funding Challenges and Competing Priorities Tribal museums face challenges with funding availability, due to construction costs, competing priorities, and other issues. For example, representatives from one tribal community and one tribal museum we visited in rural areas in Alaska said that construction costs are high for them because of the cost to transport materials to their relatively remote communities. One of these Tribes we visited noted that construction costs for their planned museum increased significantly after the pandemic. A tribal museum we visited in Alaska estimated needing about $30 million to construct a new building to accommodate their growing collections, particularly the return of repatriated ancestors and cultural items from other institutions. They expect funding for a future facility will come from grants, which could be challenging, given the limited funding sources and competing needs and priorities with other tribal programs and services, such as health care, schools, and road maintenance. In addition, representatives from one tribal museum we visited in Alaska said that identifying the needed construction funding for building the museum facility is challenging, whereas most available funding from statewide entities is for programming. One tribal organization told us they were not aware of major funding mechanisms that support tribal museums outside of Institute of Museum and Library Services and tribal government funding. Source: GAO analysis of interviews with representatives from national tribal organizations and tribal officials. | GAO-26-108485 |
Agency Comments
We provided a draft of this report to IMLS for review and comment. In its response, IMLS provided technical comments, which we incorporated where appropriate.
We are sending copies of this report to the appropriate congressional committees, the Acting Director of IMLS, and other interested parties. In addition, the report is available at no charge on the GAO website at https://www.gao.gov.
If you or your staff have any questions about this report, please contact me at marronid@gao.gov. Contact points for our Offices of Congressional Relations and Media Relations may be found on the last page of this report. GAO staff who made key contributions to this report are listed in appendix II.

David Marroni, Director
Physical Infrastructure Issues
This report examines the (1) reported physical conditions of museum facilities; (2) estimated cost to address museum facility repair needs; and (3) challenges to addressing museum facility repair needs, according to stakeholders.[71] To address these objectives, we:
· surveyed a nationally representative random sample of museums from an eligible population of 16,686 in-scope museums from April through May 2025;
· visited 17 selected museums, including two in Tribal Nations and 15 in six states (Alaska, California, Georgia, Indiana, Maine, and Virginia), the District of Columbia, and one territory (Puerto Rico); and
· reviewed relevant federal laws, regulations, and agency documentation from the Institute of Museum and Library Services (IMLS) and museum stakeholders. We also interviewed officials from IMLS and representatives from museum associations, such as the American Alliance of Museums and selected state and territorial museum associations.
For the purposes of current IMLS grants, federal law defines museums as public, tribal, or private nonprofit institutions, organized on a permanent basis for educational, cultural heritage, or aesthetic purposes.[72] They may exhibit tangible objects that are either animate or inanimate, provide exhibitions and programs, or steward a historic site. They include different types of museum disciplines, such as art, history, and science. IMLS’s definition also includes museums operated by colleges or universities and federal agencies. Their definition does not include for-profit museums.
We had initially considered including all museum disciplines in our review and had interviewed stakeholders from national museum associations representing aquariums, zoos, and botanical gardens. However, we ultimately decided not to include museums whose primary discipline focuses on living collections, such as aquariums, arboretums, botanical gardens, nature centers, and zoos, due to the distinctive infrastructure needs of those facilities. We also did not include institutions operated by colleges or universities and federal agencies, due to our resource considerations. Our review included tribal museums that are established in federally recognized Tribal Nations; however, we did not survey tribal museums because of incomplete data.
Web-Based Survey of Museums
To examine the reported physical conditions of the museum facilities in our scope and estimated costs and challenges to address facility repair needs, we designed and administered a survey to a generalizable stratified random sample of museum facilities. We sent the survey to museums and directed museums to forward the survey to representatives best equipped to answer questions related to the condition of museum facilities. We administered the survey from April 2025 through May 2025. The survey included questions for representatives to report about
· museum characteristics, including the governing authority of the museum and whether the museum occupies multiple buildings, as well as the year the museum building was constructed;[73]
· their perspectives on the physical conditions of museum building systems or features, including any planned repair or replacements projects in the next 5 years, sufficiency of available space, health or safety concerns with the condition or functionality of building systems, and challenges to addressing maintenance and repair needs;
· accessibility, including whether there are physical barriers to access for people with certain disabilities, such as mobility impairments;[74]
· estimated cost of deferred maintenance backlog and the funding sources that museums use to address facility repair needs; and
· experiences with facility damages from natural disasters and extreme weather.
We used IMLS’s 2025 National Museum Survey data, which consisted of 19,576 museums nationwide (as of February 2025), to identify in-scope museums eligible for our survey. For the purposes of our survey, we limited the sample frame to museums that were in the scope of our target population, which resulted in a sample frame of 16,686 museums. This included museums that
· have a primary discipline focused on nonliving collections or exhibitions (i.e., art museums, children’s museums, history museums or historic houses, natural history museums, science/technology centers, and general or specialized museums);
· are located in the 50 U.S. states and the District of Columbia;[75]
· do not have tribal government, tribal nonprofit, federal government, for-profit, and college or university as its legal basis or governing authority;[76] and
· were not temporarily or currently closed as of the time of our survey.
We assessed the reliability of the National Museum Survey data used in our sample frame by reviewing existing documentation about the data and by performing electronic testing on required data elements and determined they were sufficiently reliable for our purposes.
We used the museum discipline category within the National Museum Survey data to create a population frame and stratify museums in our population frame into mutually exclusive strata. We dropped all closed museums or museums that were otherwise found to be out of scope, resulting in a population of 16,686 in-scope museums. Of these, 324 were in our sample, and a total of 138 completed surveys (see table 1).[77] Our survey results are generalizable to this target population of 16,686 museums nationwide.
Table 1: Description of the Stratification, Population Sizes, Sample Sizes, and Numbers of Completed Surveys for the Stratified Random Sample of Museums
|
|
|
Stratum |
Population size (number of museums) |
Sample size |
Number of completed surveys |
|
1 |
Art museum |
3,255 |
38 |
13 |
|
|
2 |
Children’s museum |
402 |
9 |
5 |
|
|
3 |
General or specialized museums |
3,151 |
60 |
22 |
|
|
4 |
History museum/historic sites/historic house |
8,686 |
198 |
90 |
|
|
5 |
Natural history/anthropology museum |
404 |
3 |
1 |
|
|
6 |
Other or unknown |
346 |
9 |
4 |
|
|
7 |
Science/technology center/planetariums |
442 |
7 |
3 |
|
|
|
Total |
16,686 |
324 |
138 |
|
Source: GAO analysis of data from the Institute of Museum and Library Services’s 2025 National Museum Survey. | GAO‑26‑108485.
To determine the appropriate sample size for the survey, we first determined the minimum sample size needed to achieve overall precision levels of percentage estimates within +/- 7.5 percentage points, at the 95 percent confidence level, when using a proportionate allocation of the sample across the strata.[78] We then increased the sample size within each stratum to compensate for an expected response rate of 35 percent, to achieve the necessary number of completed surveys for our desired precision level. With an achieved response rate of 35 percent, our sample design would result in 95 percent confidence intervals, with margins of error that are within +/- 7.5 percentage points for the full in-scope sample. We used a 35 percent response rate in part because of IMLS’s prior experience with surveying museums.
We took additional steps to minimize other errors in our survey results that are not due to a random selection of a sample (i.e., nonsampling error). This included obtaining feedback from subject matter experts; pretesting draft instruments; and using a web-based questionnaire to aid survey navigation, perform validation, and notify respondents of potential mistakes to minimize response error.
We obtained feedback from five museum associations and pretested the draft instrument from October to December 2024 with representatives from seven museums in different states and from different museum disciplines. In the pretests, we asked about the clarity and interpretation of the questions, as well as asked about its reasonableness. On the basis of feedback from the pretests, we revised the survey instrument.
To obtain the maximum number of responses to our survey, and to minimize nonresponse error, we sent reminder emails to nonrespondents and contacted nonrespondents over the telephone. We tailored our messaging to museum contacts, and we also obtained support from six museum associations to encourage our target populations to respond to the survey.
We received 138 valid survey responses from the in-scope sample of 324 museums, resulting in weighted and unweighted response rates of 41 and 43 percent, respectively. We took steps to minimize survey error, in accordance with best practices in survey research and echoed in the Office of Management and Budget’s Standards and Guidelines for Statistical Surveys (September 2006). We analyzed the sample respondents and nonrespondents to our survey to identify potential sources of nonresponse bias. We examined the only factor available in our frame, museum discipline, which forms the stratification, to see whether it is associated with the propensity to respond and would then lead to bias if it was also associated with outcome measures in the survey. In a logistic regression, we found an insignificant association between the discipline strata and the propensity to respond.
Although we did not find evidence of nonresponse bias, we adjusted the sampling weights within the sampling strata and used adjusted analysis weights in our survey analyses to allow weights to sum to the in-scope population of museums. On the basis of the nonresponse bias analysis and resulting adjusted analysis weights, we determined that estimates using these weights are generalizable to the population of eligible museums and are sufficiently reliable for the purposes of our reporting objectives.
Finally, survey estimates and confidence intervals were obtained using survey analysis software and accounted for the sample design and analysis weights.
The survey results of museums can be found on the “Additional Data” link of our website for this report, GAO‑26‑108485.
Site Visits to Museums
To supplement information from the survey on museum facility conditions and estimated costs and challenges to addressing facility repair needs, we visited 17 museums, including two in federally recognized Tribal Nations and 15 in six states (Alaska, California, Georgia, Indiana, Maine, and Virginia), the District of Columbia, and a territory (Puerto Rico). We selected these jurisdictions for variation in the amount of funding the state or territory provided for museum facilities; the number of natural disasters experienced in the last 5 years; and geography, as well as resource considerations. The 17 museums we visited were selected to obtain variation in museum disciplines, experience with natural disasters, reported facility repair needs, and size of museum facilities, among other factors. During our site visits, we also met with three tribal entities that were in the planning phase of developing a museum facility; tribal museums were also selected based on funding from IMLS and proximity to visiting other museums and our field office locations for resource consideration, among other factors. We also selected the tribal museums and museums in Puerto Rico to obtain and supplement information that could not be collected from the survey.
We toured the museum facilities with museum directors and staff. The size of museums we visited varied widely, from a historic house museum to large, multistory, purpose-built museums. During these visits, we used a data collection instrument to ask representatives about museum building systems and features that were particularly in need of repair or replacement, as well as new or upgraded systems. We also photographed these systems and features, as appropriate.
Information we gathered from these interviews and firsthand observations provide insights into the conditions of museum facilities we visited at the time of our interviews. While they are not generalizable to all museums, they provide illustrative examples to complement findings from our survey.
Document Review and Interview Analysis
For all our objectives, we reviewed relevant laws and regulations. We also reviewed documents from IMLS and museum associations, including IMLS’s 2005 and 2019 studies on the condition and preservation needs of museums, and surveys of museum operations and costs from several associations, to understand the conditions of museum facilities and any estimated costs and challenges to addressing facility repair needs. We interviewed IMLS officials and representatives from 15 museum associations and analyzed their statements for common themes on the conditions of museum facilities, and challenges and estimated cost to address facility repair needs.[79] The museum associations were identified based on representation of the different museum disciplines, corresponding to the state or region of museums that we visited, and suggestions from stakeholders. We also held a discussion group at the 2025 Small Museum Association annual conference in February 2025 to corroborate our understanding on any unique challenges that small museums face in addressing facility repair needs.
We conducted this performance audit from January 2024 to March 2026 in accordance with generally accepted government auditing standards. Those standards require that we plan and perform the audit to obtain sufficient, appropriate evidence to provide a reasonable basis for our findings and conclusions based on our audit objectives. We believe that the evidence obtained provides a reasonable basis for our findings and conclusions based on our audit objectives.
GAO Contact
David Marroni, marronid@gao.gov
Staff Acknowledgments
In addition to the contact named above, Kyle Browning (Assistant Director), Jennifer Kim (Analyst in Charge), Sharon Dyer, Tania Uruchima, and Gregory Wong made key contributions to this report. Also contributing to this report were Breanne Cave, Emily Crofford, Melanie Diemel, Gabriel Jimenez-Barron, Michael Jones, Shannon Murphy, Carl Ramirez, Claire Saint-Rossy, Sonya Vartivarian, Erin Villareal, Michelle Weathers, and Chad J. Williams.
The Government Accountability Office, the audit, evaluation, and investigative arm of Congress, exists to support Congress in meeting its constitutional responsibilities and to help improve the performance and accountability of the federal government for the American people. GAO examines the use of public funds; evaluates federal programs and policies; and provides analyses, recommendations, and other assistance to help Congress make informed oversight, policy, and funding decisions. GAO’s commitment to good government is reflected in its core values of accountability, integrity, and reliability.
Obtaining Copies of GAO Reports and Testimony
The fastest and easiest way to obtain copies of GAO documents at no cost is through our website. Each weekday afternoon, GAO posts on its website newly released reports, testimony, and correspondence. You can also subscribe to GAO’s email updates to receive notification of newly posted products.
Order by Phone
The price of each GAO publication reflects GAO’s actual cost of production and distribution and depends on the number of pages in the publication and whether the publication is printed in color or black and white. Pricing and ordering information is posted on GAO’s website, https://www.gao.gov/ordering.htm.
Place orders by calling (202) 512-6000, toll free (866) 801-7077,
or
TDD (202) 512-2537.
Orders may be paid for using American Express, Discover Card, MasterCard, Visa, check, or money order. Call for additional information.
Connect with GAO
Connect with GAO on X,
LinkedIn, Instagram, and YouTube.
Subscribe to our Email Updates. Listen to our Podcasts.
Visit GAO on the web at https://www.gao.gov.
To Report Fraud, Waste, and Abuse in Federal Programs
Contact FraudNet:
Website: https://www.gao.gov/about/what-gao-does/fraudnet
Automated answering system: (800) 424-5454
Media Relations
Sarah Kaczmarek, Managing Director, Media@gao.gov
Congressional Relations
David A. Powner, Acting Managing Director, CongRel@gao.gov
General Inquiries
[1]Institute of Museum and Library Services, Protecting America’s Collections: Results from the Heritage Health Information Survey (Washington, D.C.: Feb. 2019).
[2]Liam Sweeney and Joanna Dressel, Art Museum Director Survey 2022: Documenting Change in Museum Strategy and Operations (New York City: ITHAKA S+R, Oct. 27, 2022).
[3]We use building systems or building features interchangeably throughout this report. We also previously reported that buildings and structures and their component systems (e.g., structural, electrical, heating, and air conditioning systems, and other systems) have finite, expected useful lives. These systems should be maintained and repaired during their useful lives, after which they can be reasonably expected to need replacement. GAO, Federal Real Property: Agencies Attribute Substantial Increases in Reported Deferred Maintenance to Multiple Factors, GAO‑23‑106124 (Washington, D.C.: Oct. 28, 2022).
[4]Deferred maintenance and repairs refer to maintenance and repair activity that was not performed when it should have been, or was scheduled to be, and that was put off or delayed for a future period. Throughout this report, we use deferred maintenance and repair and deferred maintenance interchangeably.
[6]The Museum and Library Services Act of 2018 authorized appropriations for the agency’s museum services through fiscal year (FY) 2025. Pub L. No. 115-410, § 20, 132 Stat. 5412, 5416 (2018) (codified 20 U.S.C. § 9176). Although this authorization for appropriations ended in FY 2025, appropriations acts can still provide funding to agencies for programs and activities. IMLS is currently funded through September 30, 2026. Pub. L. 119-75, div. B, tit. IV (2026). IMLS is headed by a Director, appointed by the President, with advice and consent of the Senate, who serves for a term of 4 years. 20 U.S.C. § 9103(a). The Museum and Library Services Board advises the Director on general policies and is made up of the Director, two Deputy Directors, and 10 members each who are specially qualified with respect to libraries and museums, respectively. Id. § 9105a(b)(1). Appointed board members generally serve a term of 5 years. Id. § 9105a(c).
[7]See Exec. Order 14238, 90 Fed. Reg. 13043 (March 2025). On June 16, 2025, we issued a legal decision based on publicly available data concluding that IMLS had failed to comply with the Impoundment Control Act (ICA) with regard to withheld funds, including some funds that were not eligible for ICA-based withholding. See GAO, Institute of Museum and Library Services—Applicability of the Impoundment Control Act to Reduction of Agency Functions, B-337375 (Washington, D.C.: June 16, 2025).
[8]Memorandum and Order, Rhode Island v. Trump, No. 1:25-cv-00128 (D.R.I. Nov. 21, 2025). The order has been appealed. See Notice of Appeal, Rhode Island, et al. v. Trump, No. 26-1070 (1st Cir. Jan. 21, 2026).
[9]“Statement of Agency’s Reinstatement of Terminated IMLS Grants,” News Releases, Institute of Museum and Library Services, accessed January 16, 2026, https://www.imls.gov/news/statement-agencys-reinstatement-terminated-imls-grants.
[10]Museum and Library Services Act of 2003, Pub. L. No. 108-81 § 104, 117 Stat. 991, 997 (codified 20 U.S.C. § 9109).
[11]The congressional directive also includes a provision for us to examine library facilities, which is discussed in a separate report; see GAO, Public Libraries: Many Buildings Are Reported to Be in Poor Condition, with Increasing Deferred Maintenance, GAO‑26‑107262 (Washington, D.C.: Dec. 18, 2025). We were also directed to examine differences in availability of museum facilities, but we were unable to do so, due to data limitations.
[12]Specifically, relevant provisions define a museum as “a public, tribal, or private nonprofit agency or institution organized on a permanent basis for essentially educational, cultural heritage, or aesthetic purposes, that utilizes a professional staff, owns or utilizes tangible objects, cares for the tangible objects, and exhibits the tangible objects to the public on a regular basis. Such term includes museums that have tangible and digital collections and includes aquariums, arboretums, botanical gardens, art museums, children's museums, general museums, historic houses and sites, history museums, nature centers, natural history and anthropology museums, planetariums, science and technology centers, specialized museums, and zoological parks.” See 20 U.S.C. § 9172(1), 2 C.F.R. § 3187.3.
[13]IMLS’s museum survey data does not include for-profit institutions, but it includes museums operated by colleges or universities and federal agencies. However, we did not include museums operated by colleges or universities and federal agencies, due to resource considerations. We had also initially considered including all museum disciplines in our review and interviewed stakeholders from national museum associations representing aquariums, zoos, and botanical gardens. However, we ultimately decided not to include museums whose primary discipline is focused on animate objects and living collections, such as aquariums, arboretums, botanical gardens, nature centers, and zoos, due to the distinctive infrastructure needs of those facilities. In addition, our review included selected tribal museums that are established in federally recognized Tribal Nations, but our survey’s in-scope population excluded tribal museums because of incomplete data. See app. I for more details.
[14]We used IMLS’s 2025 National Museum Survey data that contained a list of museums in the 50 states and in the District of Columbia. Our survey included questions about museum characteristics; physical conditions of museum building systems or features; physical barriers to access for people with certain disabilities, such as mobility impairments; estimated cost of deferred maintenance backlog and funding sources; and experience with facility damage from natural disasters and extreme weather. We did not include questions on other types of accessibility barriers, such as for people with visual or hearing impairments.
[15]The in-scope museum disciplines include institutions that have a primary discipline focused on nonliving collections or exhibitions (i.e., art museums, children’s museums, history museums or historic houses, natural history museums, science/technology centers, and general or specialized museums) that are located in the 50 U.S. states and the District of Columbia and were not temporarily or currently closed at the time of our review.
[16]The American Alliance of Museums is a nonprofit organization that represents all museum disciplines and provides museum professionals with resources and connections.
[17]The accreditation process consists of a museum self-study and peer review; it can take about 8-16 months to complete and is done every 10 years. The accreditation program is not federally affiliated, and accreditation is not a requirement for receiving IMLS funding. Additional accreditation tools and standards exist for specific museum disciplines, such as historic houses, zoos, and aquariums.
[18]According to IMLS, the Museum Assessment Program was previously supported through a cooperative agreement between the American Alliance of Museums and IMLS, which provided funding for the program. According to the American Alliance of Museums, the organization did not receive federal funding for this program in FY 2025; the organization plans to continue to offer versions of the program without federal funding. The Collections Assessment for Preservation is administered by the Foundation of the American Institute for Conservation under a cooperative agreement with IMLS, according to IMLS officials. Officials explained that funding for each program is dependent on the availability of federal funds.
[19]The applicable ADA standards depend on the date of construction or alteration of the museum facilities. See 28 C.F.R. § 36.406 for details about the different standards that apply to different construction/alteration dates.
[20]A facility condition assessment uses a standard method for recording observations about condition. See ASTM International, E2018-24, Standard Guide for Property Condition Assessments: Baseline Property Condition Assessment Process (2024).
[21]Museum and Library Services Act of 1996, Pub. L. No. 104-208, Div. A. Tit. VII, 110 Stat. 3009, 3009-293.
[22]Institute of Museum and Library Services, Annual Financial Report, Fiscal Year 2025 (Washington, D.C.: Feb. 2026).
[23]Under statute, the Director of IMLS “shall regularly support and conduct, as appropriate, policy research, data collection, analysis and modeling, evaluation, and dissemination of information to extend and improve the Nation’s museum, library, and information services.” 20 U.S.C. § 9108(a).
[24]H.R. Rep. 117-403, at 312 (incorporated by reference into the explanatory statement accompanying the Consolidated Appropriations Act, 2023).
[25]The National Park Service administers the Save America’s Treasures grant in conjunction with IMLS, the National Endowment for the Arts, and the National Endowment for the Humanities. Although IMLS supports the National Park Service’s administration of this program, it is not funded with IMLS grant funds and not subject to the prohibition on using IMLS funds for construction expenses. See 20 U.S.C. § 9109.
[26]Our survey asked respondents to identify whether the condition of a building system was a health or safety concern. To report on potential health or safety concerns, we combined two response options on our survey: “yes” and “somewhat,” among the museums for which the system was applicable. Each system was applicable for an estimated 86 percent or more of museums, except for elevators/lifts, which were applicable for an estimated 59 (51, 68) percent of museums. The other response options were “no” and “not sure.” Our survey estimates are made to a target population of approximately 16,700 museums; however, we did not include museums whose primary discipline is focused on animate objects and living collections (aquariums, arboretums, botanical gardens, nature centers, zoos) and those operated by colleges or universities, for-profit, federal, or tribal museums (as defined in app. I). The 95 percent confidence interval for the percentage estimate is (65, 80) and for the count estimate is (10,621, 13,142).
[27]Because each of our estimates is subject to variability due to sampling, we identify statistically significant differences between estimates at the 95 percent confidence level when their confidence intervals do not overlap. The 95 percent confidence interval for this estimate is (40, 59).
[28]GAO, K‑12 Education: School Districts Need Better Information to Help Improve Access for People with Disabilities, GAO‑20‑448 (Washington, D.C.: June 30, 2020).
[29]Survey respondents were asked to judge whether their museum had these barriers in their primary, public building. An estimated 46 (37, 55) percent of museums have more than one building, but we did not ask respondents to identify barriers in other buildings. We asked museums about physical elements of buildings that prevent movement or access for people with certain disabilities. We did not ask about other accessibility features, such as those related to visual or hearing impairments. The 95 percent confidence interval for the percentage estimate is (50, 68), and for the count estimate, (8,225, 11,024).
[30]The 95 percent confidence interval for this estimate is (37, 56).
[31]The 95 percent confidence intervals for these estimates are (21, 38) (parking), (19, 36) (entrance), and (18, 36) (bathroom).
[32]The 95 percent confidence intervals for these estimates are (7,382, 10,145) and (44, 61).
[33]The 95 percent confidence interval for this estimate is (47, 65).
[34]We asked respondents to identify whether the condition of a building system or building issue poses a risk to collections or exhibits, among those museums for which the system or issue is applicable. Each was applicable for an estimated 85 percent or more of museums, except for elevators/lifts, which were applicable for an estimated 60 (51, 69) percent of museums. To report on potential risk to collections, we combined two response options in our survey: “yes” and “somewhat.” Other response options were “no” and “not sure.” The 95 percent confidence intervals for these estimates are (68, 84) and (11,117, 13,572).
[35]The 95 percent confidence interval for this estimate is (55, 72).
[36]The 95 percent confidence interval for this estimate is (64, 81).
[37]Representatives from two Tribes we visited said that, while they have not yet constructed a museum building to hold their stored collections, their current storage areas do not have the needed environmental controls to protect the items.
[38]The 95 percent confidence interval for this estimate is (32, 51).
[39]The 95 percent confidence interval for this estimate is (66, 82).
[40]In our survey, we asked museums to self-assess the condition of 12 building systems in their primary public building (see fig. 8). An estimated 46 (37, 55) percent of museums have more than one building, and we did not ask respondents to identify the condition of systems in other buildings. Museums self-assessed that a system is in poor condition if it needs repair or replacement beyond routine maintenance and is not functioning as required or is not meeting the museum’s needs. The response options were “very good,” “good,” “fair,” “poor,” “building does not have this feature but needs it,” “not sure,” and “not applicable.” The 95 percent confidence interval for this 5,200 estimate is (3,856, 6,641) and, for the 32 percent estimate, (24, 41).
[41]Analysis includes only the systems that each museum had and rated. Each building system was applicable for an estimated 89 percent or more of museums, except for elevators/lifts, which were applicable for an estimated 54 (46, 63) percent of museums. Systems may also be rated as “fair,” “poor,” “not sure,” or “building does not have this feature but needs it.” We asked museums to identify the condition of systems in their primary, public building. However, an estimated 46 (37, 55) percent of museums have more than one building, and we did not ask respondents to identify the condition of systems in other buildings. The 95 percent confidence interval for the 19 percent estimate is (12, 27).
[42]An estimated 50 percent of museums with windows rated them in “good” or “very good” condition, with a 95 percent confidence interval of (41, 60); an estimated 56 percent of museums with an HVAC system rated it in “good” or “very good” condition, with a 95 percent confidence interval of (47, 66); and an estimated 60 percent of museums with elevators/lifts rated them in “good” or “very good” condition, with a 95 percent confidence interval of (47, 73). All other building systems had a lower bound of the 95 percent confidence interval of at least 50 percent.
[43]The 95 percent confidence interval for this estimate is (67, 84).
[44]The 95 percent confidence intervals for these estimates are (777, 2,695) and (6, 19), respectively.
[45]Sampled museums that responded that a building system is in poor condition is a subset of our sample. Due to smaller sample sizes for this subset, we cannot generalize to the entire population of museums with such a system in poor condition. Instead, we report about respondents to our survey in a nongeneralizable manner.
[46]The 95 percent confidence intervals for these estimates are (668, 2,571) and (5, 18), respectively.
[47]The 95 percent confidence interval for these estimates are (1,858, 4,208) and (12, 27).
[48]Mold grows with moisture, which can occur with water intrusion from different building systems, such as a leaking HVAC or roof. Mold exposure can cause health problems, such as allergic reactions or asthma attacks in some.
[49]The 95 percent confidence intervals for these estimates are (5,383, 8,316) and (32, 50).
[50]Federal Emergency Management Agency, Building Codes Save: A Nationwide Study (Washington, D.C.: revised May 2025).
[51]The 95 percent confidence interval for this estimate is (32, 50).
[52]Our survey asked whether there had been a full-building facility condition assessment of the museum’s primary, public building from 2014 through 2024. An estimated 46 (37, 55) percent of museums have more than one building, but we did not ask respondents to identify whether they have conducted a facility condition assessment in other buildings. The 95 percent confidence interval for this estimate is (24, 41).
[53]The 95 percent confidence intervals for these estimates are (18, 33) and (35, 53).
[54]Our survey asked respondents to estimate their museum’s amount of deferred facility maintenance backlog. The 95 percent confidence interval for these estimates are (78, 90) and (12,731, 14,579), respectively.
[55]The 95 percent confidence intervals for these estimates are (40, 58) and (6,410, 9,360).
[56]The 95 percent confidence interval for these estimates are (13, 28) and (4, 14), respectively.
[57]GAO‑23‑106124; and GAO, Federal Real Property: Government’s Fiscal Exposure from Repair and Maintenance Backlogs Is Unclear, GAO‑09‑10 (Washington, D.C.: Oct. 16, 2008); and Congressional Research Service, Deferred Maintenance and Repair at Civilian Agencies: Causes, Risks, and Policy Options, R48211 (Washington, D.C.: Oct. 4, 2024).
[59]The 95 percent confidence interval for this estimate is (70, 86).
[60]The 95 percent confidence intervals are (29, 47), (5, 18), and (31, 50), respectively.
[61]The 95 percent confidence interval for this estimate is (73, 87).
[62]The 95 percent confidence interval for this estimate is (30, 48).
[63]The 95 percent confidence intervals for these estimates are (78, 90) and (12,262, 14,256), respectively.
[64]Survey results are of museums that made repairs from 2020 through 2024; an estimated 5 percent of museums did not make any repairs in this period. The 95 percent confidence interval is (72, 86).
[65]The 95 percent confidence interval is (20, 41).
[66]According to a museum association stakeholder, most museums do not have a dedicated public revenue source, as many are not government entities. We estimate that the governing authority for 10 percent of museums is local government, 6 percent state/territorial government, and 81 percent nonprofit. The 95 percent confidence intervals for these estimates are (5,16) (local government); (3,11) (state/territorial government); and (74, 87) (nonprofit).
[67]The 95 percent confidence intervals for these estimates are (69, 85) and (10,807, 13,289).
[68]The 95 percent confidence interval for this estimate is (12, 27).
[69]The 95 percent confidence interval for this estimate is (61, 79).
[70]The 95 percent confidence interval for this estimate is (60, 78).
[71]We completed this work in response to a provision included in the Joint Explanatory Statement accompanying the Departments of Labor, Health and Human Services, and Education, and Related Agencies Appropriations Act, 2024. The congressional directive also included a provision for us to examine library facilities, which is discussed in a separate report; see GAO, Public Libraries: Many Buildings Reported to Be in Poor Condition, with Increasing Deferred Maintenance, GAO‑26‑107262 (Washington, D.C.: Dec. 18, 2025).
[72]Specifically, relevant provisions define a museum as “a public, tribal, or private nonprofit agency or institution organized on a permanent basis for essentially educational, cultural heritage, or aesthetic purposes, that utilizes a professional staff, owns or utilizes tangible objects, cares for the tangible objects, and exhibits the tangible objects to the public on a regular basis. Such term includes museums that have tangible and digital collections and includes aquariums, arboretums, botanical gardens, art museums, children's museums, general museums, historic houses and sites, history museums, nature centers, natural history and anthropology museums, planetariums, science and technology centers, specialized museums, and zoological parks.” See 20 U.S.C. § 9172(1), 2 C.F.R. § 3187.3.
[73]Our survey asked museums to consider and respond only for their primary, public building, if the museum occupies multiple buildings.
[74]We did not include questions on other types of barriers to access, such as for people with visual or hearing impairments.
[75]For the purposes of our survey, we did not include museums in American Samoa, Guam, the Northern Mariana Islands, Puerto Rico, and the U.S. Virgin Islands because IMLS officials told us that they did not include these territories in developing the museum data.
[76]We did not include museums whose governing authority is tribal government and tribal nonprofit because IMLS officials told us that they do not have complete data on tribal museums. We also did not include museums operated by federal agencies or by colleges or universities because of our resource considerations.
[77]We included museum disciplines that were out of scope for our sample (zoos, aquariums, botanical gardens, arboretums, and nature centers) in a separate sampling stratum and selected a random sample from this stratum to confirm that museums were classified accurately in our frame. Upon confirmation that the sample museums in this additional stratum were generally classified correctly, we dropped this stratum from our population and sample. In total, we found 2,890 ineligible (out of scope) museums, of which 2,721 were expected to be out of scope, due to their museum discipline (e.g., zoo), and an additional 169 were discovered to be closed or otherwise out of scope. These museums are not listed in table 1 counts.
[78]This includes the out-of-scope sample that was described in a previous footnote.
[79]The 15 museum associations were the (1) American Alliance of Museums; (2) American Association for State and Local History; (3) Association of Art Museum Directors; (4) Association of Children’s Museums; (5) Association of Indiana Museums; (6) Association of Midwest Museums; (7) Association of Science and Technology Centers; (8) Association of Tribal Archives, Libraries, and Museums; (9) California Association of Museums; (10) Coalition of State Museum Associations; (11) Instituto de Cultura Puertorriqueña; (12) Maine Archives & Museums; (13) Museums Alaska; (14) Alaska State Libraries, Archives, & Museums; and (15) Small Museum Association. Though museums with living collections were not included in our scope, we also interviewed representatives from the Association of Zoos and Aquariums and the American Public Gardens Association.