
Report to Congressional Addressees
United States Government Accountability Office
A report to congressional addressees
Contact: Alicia Puente Cackley, cackleya@gao.gov
What GAO Found
Most U.S. property owners are unprotected from flood risk. As of April 2026, 86 percent of high-risk properties did not have National Flood Insurance Program (NFIP) coverage. The number of NFIP policies declined from 5.5 million in 2010 to 4.5 million in 2026. Growth in the private market offset this decline, and private policies accounted for 14 percent of all policies in 2025.
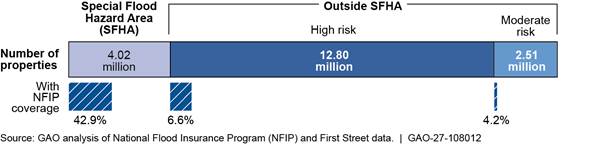
Federal law requires property owners with federally backed mortgages to purchase flood insurance if their property is in a special flood hazard area (SFHA) designated by the Federal Emergency Management Agency (FEMA). This mandatory purchase requirement is the primary reason consumers purchase flood insurance: an estimated 43 percent of properties in SFHAs had flood insurance, compared with 2 percent outside those areas. However, the requirement does not effectively ensure coverage for many at-risk properties. In particular, the FEMA maps used to determine the requirement do not capture all flood risks, especially heavy rainfall. GAO’s analysis of First Street data indicates that about 13 million high-risk properties are outside FEMA SFHAs.
Consumer misperceptions also can discourage flood insurance purchase. Consumers may underestimate their flood risk, overestimate the amount of federal disaster assistance after a flood, or believe that homeowners insurance covers flood damage when most policies specifically exclude it.
GAO identified four actions that could help increase NFIP and private flood insurance coverage. Each would require statutory authority from Congress.
· Incorporating all sources of flood risk into purchase requirement determinations could help ensure that more at-risk properties have coverage.
· Making property-level flood risk information publicly available could increase awareness of flood risk.
· Requiring lenders to provide flood insurance quotes for federally backed mortgages could better signal the need for coverage.
· Increasing NFIP coverage limits could allow property owners to obtain coverage better aligned with potential flood losses.
GAO previously recommended that any affordability assistance be means-based and reflected in the federal budget and that barriers to private flood insurance be removed. These actions could help ensure that more property owners are protected from flood risk.
Why GAO Did This Study
Flooding is the most common, costly, and destructive natural disaster in the United States, and its frequency and severity have increased in recent years. Flood insurance helps protect property owners from financial losses and supports recovery after floods.
This report examines (1) the extent to which consumers purchase flood insurance, (2) the effectiveness of the mandatory purchase requirement, (3) factors affecting consumers’ decisions to purchase flood insurance, and (4) potential actions to increase consumer purchase of flood insurance.
GAO analyzed 2008–2026 FEMA data on NFIP policies, 2018–2025 National Association of Insurance Commissioners data on private flood insurance policies, and property-level flood risk data from First Street—a risk modeling company. GAO also reviewed relevant reports and interviewed FEMA officials. In addition, GAO conducted three discussion sessions with 15 flood insurance stakeholders and reviewed its prior work and public research to identify potential actions to increase flood insurance purchase. GAO visited four flood-prone communities that reflected different flood types and income levels, and interviewed property owners, insurance agents, local officials, and other stakeholders.
What GAO Recommends
GAO recommends that Congress consider (1) updating the criteria for mandatory purchase requirement determinations to include all sources of flood risk, (2) directing FEMA to make property-level flood risk information publicly available, (3) requiring lenders to provide flood insurance quotes for federally backed mortgages prior to closing, and (4) increasing NFIP coverage limits.
|
Abbreviations |
|
|
|
|
|
|
|
FEMA |
Federal Emergency Management Agency |
|
|
NAIC |
National Association of Insurance Commissioners |
|
|
NFIP |
National Flood Insurance Program |
|
|
SFHA |
special flood hazard area |
|
This is a work of the U.S. government and is not subject to copyright protection in the United States. The published product may be reproduced and distributed in its entirety without further permission from GAO. However, because this work may contain copyrighted images or other material, permission from the copyright holder may be necessary if you wish to reproduce this material separately.
October 1, 2026
Congressional Addressees
Flooding is the most common, costly, and destructive natural disaster in the United States, and its frequency and severity have increased in recent years. The National Flood Insurance Program (NFIP), the federal program that provides most flood insurance coverage in the United States, has paid increasingly larger claims following major floods. From 1980 through 2004, NFIP paid an average of $1.2 billion in annual claims, adjusted for inflation, compared with $4.8 billion since then. Flooding in 2024 alone caused about $9 billion in NFIP claims, including about $7 billion from Hurricane Helene. In addition, flooding in Central Texas in July 2025 resulted in 139 deaths and more than $31 million in NFIP claims.
Flood insurance—whether through NFIP or a private insurer—helps protect property owners from flood-related financial risks and support recovery. Households, communities, and businesses that manage risk through insurance generally recover faster and more fully after disasters. The Federal Emergency Management Agency (FEMA) administers NFIP, which Congress created in 1968 to minimize flood-related property losses by making flood insurance available and encouraging its purchase in communities that agree to identify and manage their flood risk.
We added NFIP to GAO’s High Risk List in 2006 because the program is highly unlikely to generate sufficient revenue to cover flood claims, particularly in years with catastrophic losses.[1] Since then, FEMA has taken important steps to help move NFIP toward financial solvency. However, Congress has yet to enact comprehensive reforms to NFIP that would address all of the program’s challenges.[2]
Many at-risk properties, however, remain uninsured or underinsured. Federal law generally requires property owners to purchase flood insurance only when their property is in a FEMA-determined special flood hazard area (SFHA) and is financed by a federally backed mortgage. This is known as the mandatory purchase requirement. However, substantial flood damage occurs outside SFHAs, where property owners may choose not to purchase flood coverage. In addition, FEMA began implementing a new methodology in 2021 for setting flood insurance premiums that more closely aligned premiums with a property’s flood risk. The resulting premium increases, however, exacerbated affordability concerns and led some policyholders to drop coverage.
We performed our work at the initiative of the Comptroller General to address broad congressional concern about uninsured losses from floods. This report examines (1) the extent to which consumers purchase flood insurance, (2) the effectiveness of the mandatory purchase requirement, (3) factors affecting consumers’ decisions to purchase flood insurance, and (4) potential actions to increase consumers’ purchase of flood insurance.
For all objectives, we reviewed laws and regulations and interviewed FEMA officials. We also visited four flood-prone communities that reflected different flood types and income levels, and interviewed property owners, insurance agents, real estate agents, floodplain managers, and other local officials. We conducted site visits to Fort Myers, Florida; Asheville, North Carolina; New Orleans, Louisiana; and Sacramento, California.
For the first and second objectives, we analyzed 2008–2026 FEMA data on NFIP policies, 2018–2025 National Association of Insurance Commissioners (NAIC) data on private flood insurance policies, and First Street data on property-level flood risk.[3]
For the third objective, we interviewed 11 industry stakeholders, including insurance agents, engineering consultants, an academic, and a lenders’ association, and reviewed relevant reports on consumers’ perceptions of flood risk and flood insurance.[4] We also analyzed publicly available data from FEMA on NFIP claims and disaster assistance payments made through the Individuals and Households Program to estimate amounts paid to consumers following flood events.
For the fourth objective, we conducted three discussion sessions with 15 flood insurance stakeholders to obtain their views on the likely effectiveness of potential actions to increase flood insurance purchase and implementation considerations.[5] These included stakeholders in the insurance industry, research organizations, and lenders. We selected participants who participated in key flood insurance conferences, issued research or public statements on the topic, or testified before Congress. We also obtained input through individual interviews with nine additional stakeholders and FEMA and NAIC officials. We identified potential actions by leveraging our prior work and expertise on flood insurance, attending three flood conferences in which potential actions were discussed, reviewing issued research and public statements, and evaluating the input from the discussion sessions, site visits, and individual interviews. See appendix I for a detailed description of our scope and methodology. See appendix II for information on our econometric model, appendix III for site visit information and photos, and appendix IV for discussion session participants and interviewees.
We conducted this performance audit from January 2025 to October 2026 in accordance with generally accepted government auditing standards. Those standards require that we plan and perform the audit to obtain sufficient, appropriate evidence to provide a reasonable basis for our findings and conclusions based on our audit objectives. We believe that the evidence obtained provides a reasonable basis for our findings and conclusions based on our audit objectives.
Background
National Flood Insurance Program Premiums
Congress created NFIP in 1968 to help reduce the escalating costs of providing federal assistance to repair flood-damaged homes and businesses.[6] NFIP was also intended to identify flood risk, encourage program participation, and promote community-based floodplain management.
From 1968 until 2021, FEMA set NFIP insurance premiums primarily using its Flood Insurance Rate Maps, commonly referred to as FEMA floodplain maps. Under this legacy methodology, some policyholders paid discounted “subsidized” premiums because their properties were built before FEMA mapped the area. Others paid discounted “grandfathered” premiums after a new floodplain map placed their properties into a higher-risk flood zone that otherwise would have increased their premiums.
In October 2021, FEMA began implementing a new methodology for calculating flood insurance premiums, known as Risk Rating 2.0. The methodology more closely aligns premiums with the flood risk of individual properties rather than with broadly defined flood zones. It also integrates input from commercial catastrophe models, incorporates more sources of flooding, and accounts for a property’s replacement cost value.
Beginning October 1, 2021, new NFIP policyholders were required to pay full-risk premiums under Risk Rating 2.0, while renewing policyholders could opt in if the new methodology lowered their premiums. As of April 1, 2022, FEMA began transitioning all existing NFIP policyholders to full-risk premiums as their policies renewed. Premium increases for renewing NFIP policies are generally limited by statute. For most policies, FEMA is prohibited from increasing premiums by more than 18 percent per year.[7]
FEMA Floodplain Maps and the Mandatory Purchase Requirement
As a part of administering NFIP, FEMA creates floodplain maps. These maps delineate SFHAs, which determine which properties may be subject to the mandatory purchase requirement. FEMA defines an SFHA as a land area that would be submerged by the floodwaters of the “base flood,” meaning a flood event with a 1 percent chance of being equaled or exceeded in any given year. This translates to a 26 percent or greater chance of flooding over a 30-year mortgage. According to FEMA officials, FEMA primarily considers areas that are subject to fluvial (riverine) and coastal flooding when determining SFHAs.[8] Developing and adopting FEMA’s floodplain maps is a regulatory process involving extensive collection and analysis of environmental data, as well as a public review process.
The program also promotes community-based floodplain management by requiring participating communities to adopt and enforce minimum floodplain management regulations and construction standards before individuals in participating communities may purchase NFIP policies. FEMA floodplain maps serve as the basis for these local requirements. In developing the maps, FEMA obtains input from state, local, tribal, and territorial governments and their partners to incorporate local knowledge, areas of concern, and relevant data sources.
The mandatory purchase requirement generally applies to properties in an SFHA within an NFIP-participating community when the property is secured by a mortgage that was (1) issued by a federally regulated lender; (2) made, insured, or guaranteed by the Federal Housing Administration, U.S. Department of Agriculture, or Department of Veterans Affairs; or (3) purchased by one of the government-sponsored enterprises—Fannie Mae or Freddie Mac. In 2019, several federal financial regulators issued an interagency rule requiring lenders to accept qualifying private insurance to satisfy the mandatory purchase requirement.[9]
Several federal entities play a role in implementing and enforcing the mandatory purchase requirement. FEMA administers NFIP but has a limited statutory role in carrying out the requirement. In addition to creating the floodplain maps that designate SFHAs, FEMA develops the form lenders use to determine whether property owners are required to purchase flood insurance. However, FEMA does not have authority to enforce lender compliance. Instead, regulators monitor compliance through examinations of lenders.[10]
Most High-Risk Properties Do Not Have Flood Insurance Despite Growth in the Private Market
About 86 Percent of Properties with High Flood Risk Do Not Have Flood Insurance
Most U.S. properties are not covered by flood insurance, including the majority of properties with high flood risk. As a result, many property owners remain exposed to financial losses from flooding.[11] As of 2025, 4 percent of U.S. properties in the 50 states and the District of Columbia had flood insurance through NFIP or a private insurer.[12]
First Street classifies flood risk using a flood score from 1 to 10 based on a property’s likelihood and projected depth of flooding.[13] Flood scores of 4 to 10 roughly align with the 1 percent or higher annual chance of flood that FEMA uses to determine SFHAs.[14] We refer to properties with these scores as “high risk.” Flood scores of 2 to 3 roughly align with what FEMA considers moderate flood risk, and we refer to these properties with these scores as “moderate risk.”[15] We refer to properties with a flood score of 1 as “low risk.”
About 15 percent of U.S. properties were high risk, according to our analysis of First Street property-level data.[16] We estimated that 86 percent of these properties did not have NFIP coverage as of April 2026.[17]
NFIP coverage increases with flood risk but remains low even among properties at greater risk. We estimated that 6 percent of moderate-risk properties had NFIP coverage, compared with 14 percent of high-risk properties. Among properties with the highest flood risk—a flood score of 10—26 percent had NFIP coverage (see fig. 1).
Figure 1: Estimated Percentage of U.S. Properties with NFIP Coverage, by Flood Risk, as of April 30, 2026
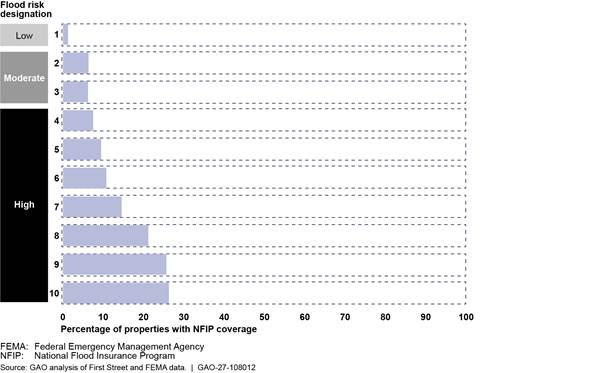
Notes: For this analysis, we classified properties with a flood score of 1 to be low risk, 2 or 3 to be moderate risk, and 4 through 10 to be high risk. Properties with moderate flood risk roughly correlate with FEMA’s 0.2 percent annual chance of flood designation. Properties with high flood risk roughly correlate with FEMA’s 1 percent annual chance of flood designation. This analysis includes properties in the 50 states and the District of Columbia. These calculations required matching NFIP data to First Street data. We matched 79.2 percent of NFIP contracts to a First Street property record. We accounted for unmatched contracts by dividing the coverage rate by the match rate.
According to our analysis of First Street data as of January 2024, U.S. flood risk was highest in Hawaii and along the Gulf, the East Coast, and the Appalachian corridor. The highest proportions of high-risk properties were in Louisiana (45 percent), West Virginia (34 percent), and Florida (26 percent). FEMA and NAIC data also show that the Gulf and East Coast had the greatest concentrations of NFIP and private policyholders (see fig. 2). Flood insurance coverage was highest in Louisiana (28 percent) and Florida (18 percent), as of December 2025. By contrast, some inland states with high flood risk had lower levels of flood insurance coverage. For example, less than 2 percent of West Virginia properties had flood insurance.
Figure 2: Percentage of U.S. Properties with NFIP or Private Flood Insurance, by State, as of December 31, 2025
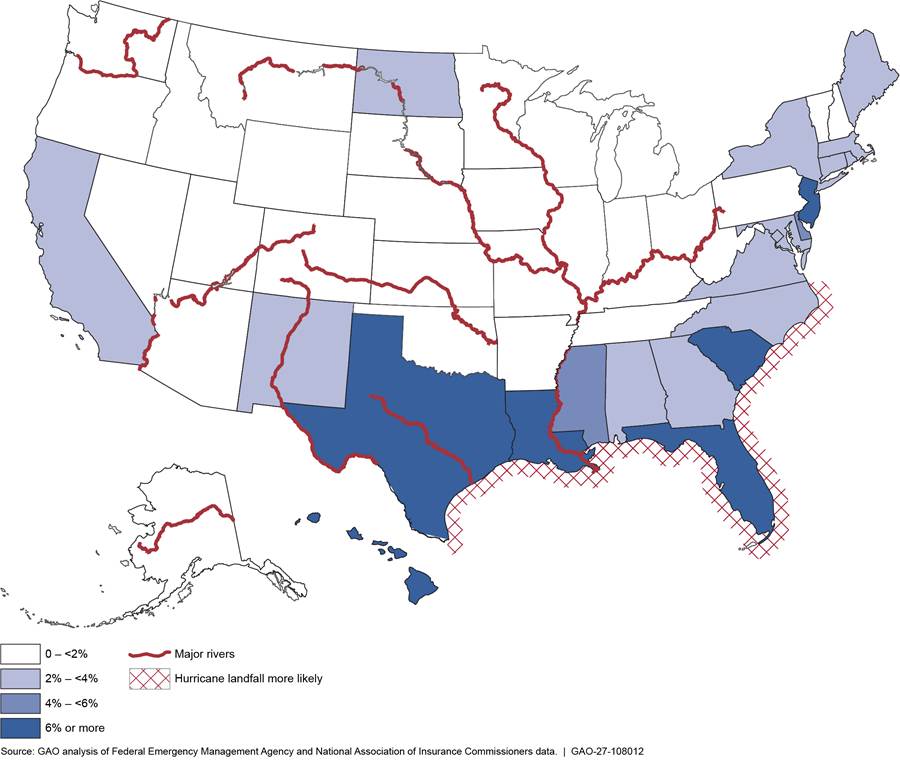
Notes: This analysis includes residential and nonresidential/commercial properties. It also includes endorsements on private residential policies as well as standalone private residential policies.
As discussed later, these trends could be related to how FEMA determines SFHAs and, therefore, which properties may be subject to the mandatory purchase requirement. In the Gulf and East Coast states, coastal flood risk is more prevalent and is reflected in FEMA’s floodplain maps, making properties there more likely to be in an SFHA. Properties in inland states do not face coastal risk and are more likely to face rainfall-related risk, which FEMA floodplain maps generally do not consider. For additional county-level information on SFHA status and flood coverage, see our interactive graphic available at http://www.gao.gov/products/gao-27-108012.
Growth in Private Flood Insurance Offset the Decline in NFIP Policies
From 2018—the earliest year for which private policy data are available—through 2025, the number of NFIP policies declined from approximately 5.1 million to 4.7 million, while private flood insurance policies increased from approximately 371,000 to 778,000 policies, according to NAIC data.[18] As a result, the total number of flood insurance policies remained near 5.4 million, although growth in residential private coverage did not fully offset the decline in residential NFIP policies.
Trends in the Number of NFIP Policies
The number of NFIP policies peaked in March 2010 at approximately 5.5 million and decreased to 4.5 million by April 2026 (see fig. 3). Declines followed enactment of the Biggert-Waters Flood Insurance Reform Act of 2012 and FEMA’s implementation of Risk Rating 2.0 in 2021, both of which increased premiums for many NFIP policyholders. In particular, from July 2012 (when the act was enacted) through July 2017, the number of NFIP policies decreased by 10 percent. From October 2021 (the start of implementation of Risk Rating 2.0) through October 2025, the number of NFIP policies decreased by 5 percent.
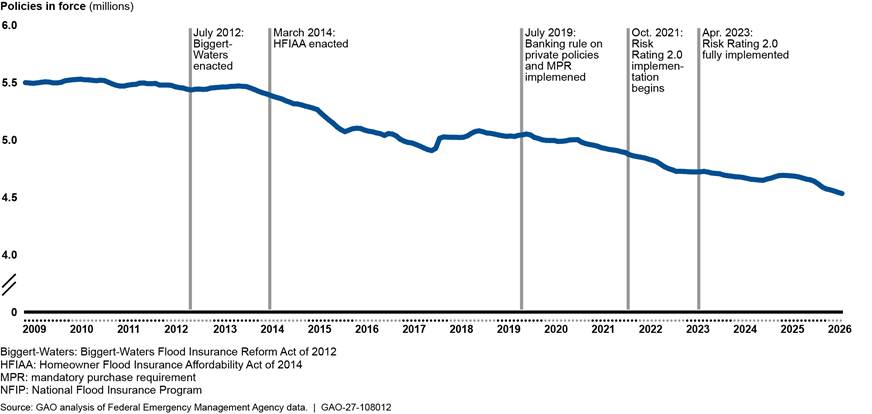
Notes: The number of policies represents policies in force as of the last day of each month in the 50 states and the District of Columbia. This analysis includes policies for residential and nonresidential buildings, including commercial buildings.
The decline in NFIP policies has varied by state (see fig. 4). From 2009 to 2025, policies declined by 13 percent in the eight more hurricane-prone states, compared with 21 percent in the rest of the United States.[19] One possible explanation is that these hurricane-prone states had a higher proportion of properties in SFHAs, where properties with federally backed mortgages may be subject to the mandatory purchase requirement and therefore required to maintain flood insurance coverage.
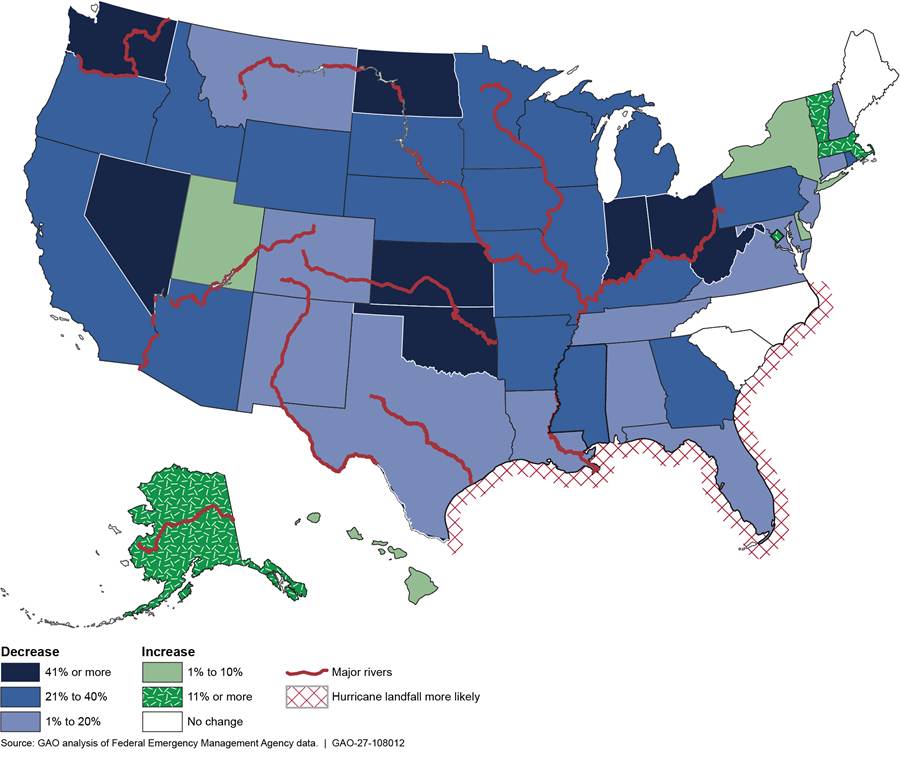
Notes: For this analysis, the number of policies in 2009 and 2025 represents the number of policies in force as of December 31 of each year in the 50 states and the District of Columbia. The analysis includes policies for residential and nonresidential buildings, including commercial buildings.
These states also had a higher share of NFIP policyholders paying discounted premiums (44 percent) compared with the rest of the United States (38 percent), as of April 2026.[20] Discounted premiums may encourage property owners to retain coverage, as stakeholders identified rising premiums and affordability concerns as primary reasons property owners may drop or decline to purchase flood insurance.
Trends in the Number of Private Insurance Policies
The number of private insurance policies has grown and offset the decline in NFIP policies, although private coverage remains limited. From 2018 through 2025, the total number of NFIP policies dropped by about 389,000, while private policies increased by about 406,000.[21] Over this same period, residential NFIP policies decreased by about 376,000, while residential private policies increased by about 260,000. Thus, growth in the private market offset the decline in commercial NFIP policies but not the decline in residential NFIP policies (see fig. 5).
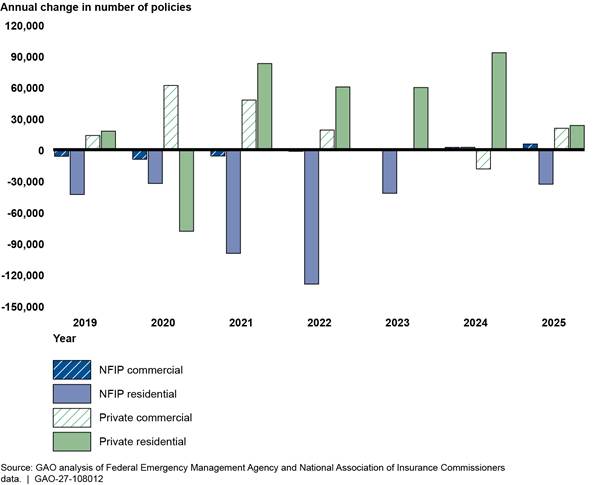
Notes: Data on private policies first became available in 2018. This analysis includes endorsements on private residential policies as well as standalone private residential policies. The number of policies reflects policies in force as of December 31 of each year in the 50 states and the District of Columbia.
Private flood insurance accounts for a larger share of the commercial market than of the residential market. From 2018 to 2025, the private share of commercial policies increased from 23 percent to 48 percent, while the private share of residential policies increased from 6 percent to 11 percent (see fig. 6). According to stakeholders, this difference partly reflects commercial property owners’ greater likelihood of voluntarily purchasing flood insurance. They also said private insurers typically offer a wider range of policy options, such as higher coverage limits.
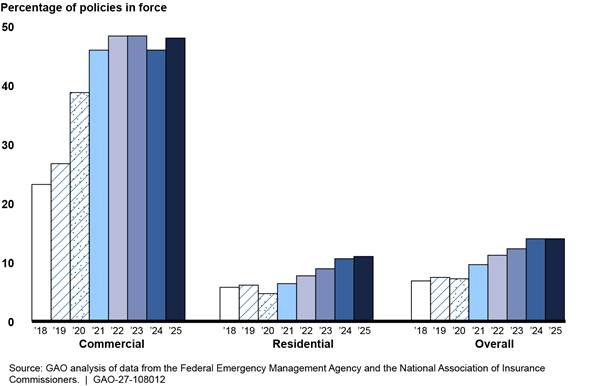
Notes: Data on private policies became available in 2018. This analysis includes endorsements on private residential policies as well as standalone private residential policies. The number of policies reflects policies in force as of December 31 of each year in the 50 states and the District of Columbia.
From 2018 to 2025, the private share of the flood insurance market increased from 7 percent to 14 percent. Some states with smaller private market shares had larger shares of NFIP policyholders receiving discounted premiums, which may make private policies less competitive. In the eight more hurricane-prone states, 44 percent of NFIP policyholders received discounted premiums, compared with 38 percent in the rest of the United States. In 2025, the private market share was 10 percent in those states, compared with 23 percent in the rest of the United States.
Stakeholders also told us that fewer private options may be available in very high-risk areas. For example, insurance agents around Fort Myers, Florida, said private carriers were less prevalent because they were unwilling to take on high-risk policies. Similarly, agents around Asheville, North Carolina, told us private carriers were likely to stop offering policies after a flood event.
The Mandatory Purchase Requirement Does Not Ensure Coverage for Most At-Risk Properties
The Mandatory Purchase Requirement Is the Primary Driver of Flood Insurance Purchase
The mandatory purchase requirement is the primary driver of flood insurance purchase, according to our analysis and stakeholder input. Although the purchase rate for properties in SFHAs was 43 percent in April 2026, it was significantly higher than the 2 percent rate for properties outside SFHAs, where flood insurance is not required. This difference suggests that the mandatory purchase requirement significantly influences whether property owners purchase flood insurance.
Notably, property owners were more likely to purchase flood insurance for a low-risk property in an SFHA than for a property with the highest risk but outside an SFHA (see fig. 7). As discussed later, FEMA uses SFHAs to designate high-risk properties. However, SFHAs as currently determined do not include all sources of risk, including heavy rainfall, and therefore do not identify many properties with high risk. First Street’s model accounts for flood risk from heavy rainfall and therefore identifies more properties at high and moderate risk.
Although NFIP coverage generally increases with flood risk both in and outside SFHAs, rates were higher in SFHAs at every risk level. In SFHAs, estimated purchase rates ranged from 32 percent for properties with a flood score of 1 to approximately 54 percent for properties with a flood score of 9, as of April 2026. Outside SFHAs, rates ranged from 1 percent for properties with a flood score of 1 to 12 percent for properties with a score of 8. Owners of high-risk properties outside SFHAs may be less likely to purchase flood insurance because they are not subject to the mandatory purchase requirement and may face high premiums.
Figure 7: Estimated Percentage of Properties with NFIP Coverage, by Flood Risk Designation and SFHA Status, as of April 30, 2026
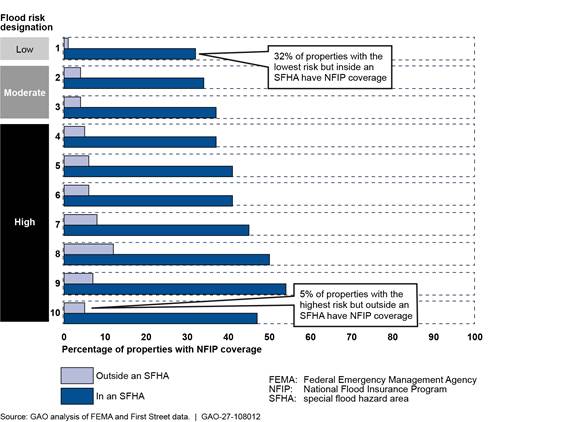
Notes: The percentages shown include NFIP policies only and exclude private flood insurance because property-level data on private policies were unavailable. Therefore, the percentages shown understate total flood insurance coverage. As of year-end 2025, private policies accounted for 14 percent of all flood insurance policies. For this analysis, we classified properties with a flood score of 1 to be low risk, 2 or 3 to be moderate risk, and 4 through 10 to be high risk. Properties with moderate flood risk roughly correlate with FEMA’s 0.2 percent annual chance of flood designation. Properties with high flood risk roughly correlate with FEMA’s 1 percent annual chance of flood designation. This analysis includes properties in the 50 states and the District of Columbia. These calculations required matching NFIP data to First Street data. We matched 81.6 percent of NFIP contracts outside an SFHA and 77.4 percent of contracts in an SFHA to a First Street property record. We accounted for unmatched contracts by dividing the coverage rate by the applicable match rate.
Stakeholders we interviewed consistently identified the mandatory purchase requirement as the primary reason homeowners purchase flood insurance and said voluntary purchase is rare. Stakeholders in each of the four flood-prone areas we visited similarly noted the requirement’s role in driving coverage. For example, a stakeholder in Asheville, North Carolina, told us very few property owners purchase flood insurance voluntarily because of the added cost and limited understanding of their flood risk. Other stakeholders said the requirement was a more significant driver for residential and small-business properties, where affordability concerns are greater, whereas large business owners are more likely to understand their flood risk and be able to afford voluntary coverage.
The following characteristics were associated with NFIP coverage, according to our econometric model.[22]
· SFHA status. A property’s SFHA status had the strongest association with NFIP coverage. Properties in an SFHA were approximately 24 percentage points more likely to have NFIP coverage than properties outside an SFHA with the same flood risk level and type (i.e., coastal, riverine, or rainfall-related) after controlling for other factors.
· Coastal flooding risk. Properties at risk of coastal flooding were substantially more likely to have NFIP coverage than properties at risk of riverine- or rainfall-related flooding. This may reflect greater property owner awareness of coastal flood risk.
· Properties at risk of coastal flooding with a flood score of 2 were approximately 10 percentage points more likely to have NFIP coverage than those with a flood score of 1. Those with a flood score of 8 were approximately 31 percentage points more likely. On the other hand, properties subject to riverine- or rainfall-related risk with any flood score were at most 3 percentage points more likely to have NFIP coverage than properties with low flood risk.
· NFIP coverage generally increased with the flood score for properties subject to coastal flooding but were generally uncorrelated with the flood score for properties subject to riverine- or rainfall-related risk. This suggests that property owners respond differently to different types of flood risk or may be more aware of or sensitive to coastal flood risk.
· Mortgage prevalence in an SFHA. Properties in an SFHA and in areas with higher mortgage prevalence (the percentage of housing units with a mortgage loan or similar debt) were more likely to have NFIP coverage. A one-standard-deviation increase in mortgage prevalence was associated with a 3-percentage-point increase in the likelihood of NFIP coverage. This is possibly because areas with higher mortgage prevalence have more properties with federally backed mortgages subject to the mandatory purchase requirement. Outside SFHAs, higher mortgage prevalence was not associated with a greater likelihood of NFIP coverage.
· Median household income. Median household income was positively associated with the likelihood of NFIP coverage, particularly in SFHAs. A 53 percent increase in an area’s median household income was associated with a 2-percentage-point increase in the likelihood of NFIP coverage in an SFHA.
Florida recently implemented its own mandatory purchase requirement, which may have increased the rate of flood insurance purchase. In 2023, the state enacted legislation requiring property owners insured by Florida Citizens Property Insurance Corporation, a state-run residual insurer, to purchase flood insurance if they have wind coverage regardless of whether their property is in an SFHA.[23] This requirement took effect in January 2024 for properties with replacement cost values greater than $600,000 and through a sliding scale will ultimately apply to all properties by January 2027. From 2022 through 2025, the number of NFIP and private flood insurance policies in Florida increased by 12 percent, compared with a 7 percent decline in the other seven more hurricane-prone states and a 2 percent increase in the rest of the United States.
Floodplain Maps Used for the Purchase Requirement Do Not Include Most At-Risk Properties
FEMA’s floodplain maps may understate flood risk for many properties, according to our analysis of First Street data. As discussed previously, First Street flood scores of 4 or higher roughly correspond to the 1 percent annual chance of flood that FEMA uses to designate SFHAs. As of 2024, First Street identified about 16 million properties as having a 1 percent or greater annual chance of flooding, while FEMA floodplain maps identified about 4 million properties in SFHAs (see table 1).[24] Combined with the more than 240,000 high-risk properties in unmapped areas, this totals about 13 million high-risk properties identified by First Street that FEMA does not consider as being in an SFHA.[25]
|
First Street flood score |
In an SFHA |
Outside an SFHA |
Unmapped |
Total |
Percentage in an SFHA |
|
1 (low risk) |
863,084 |
84,488,939 |
1,714,559 |
87,066,582 |
1.0 |
|
2–3 (moderate risk) |
165,049 |
2,509,620 |
46,451 |
2,721,120 |
6.1 |
|
4–10 (high risk) |
2,990,193 |
12,797,264 |
241,976 |
16,029,433 |
18.7 |
|
Total |
4,018,326 |
99,795,823 |
2,002,986 |
105,817,135 |
3.8 |
FEMA: Federal Emergency Management Agency
SFHA: special flood hazard area
Source: GAO analysis of First Street data. | GAO-27-108012
Note: FEMA identifies SFHAs through its floodplain maps. FEMA has not mapped the entire United States, and not all mapped areas have been digitized. Unmapped areas represent those for which digital FEMA maps are unavailable, either because the maps are only on paper or because FEMA has not mapped them. This analysis includes properties in the 50 states and the District of Columbia. Other flood risk models with different methodologies will produce different estimates.
FEMA maps likely do not designate some high-risk properties as being in an SFHA because the maps account for coastal and riverine flood risk but generally do not consider heavy rainfall flood risk. For example, First Street data show, among the nearly 12.8 million high-risk properties outside SFHAs, the predominant flood risk type for 62 percent is heavy rainfall alone, while the predominant flood risk type for the remaining 38 percent is riverine, coastal, or some combination of the three (see fig. 8).[26] By contrast, among the nearly 3 million high-risk properties in SFHAs, the predominant flood risk type for 19 percent is heavy rainfall alone, while the predominant risk for the remaining 81 percent is riverine, coastal, or some combination of the three.
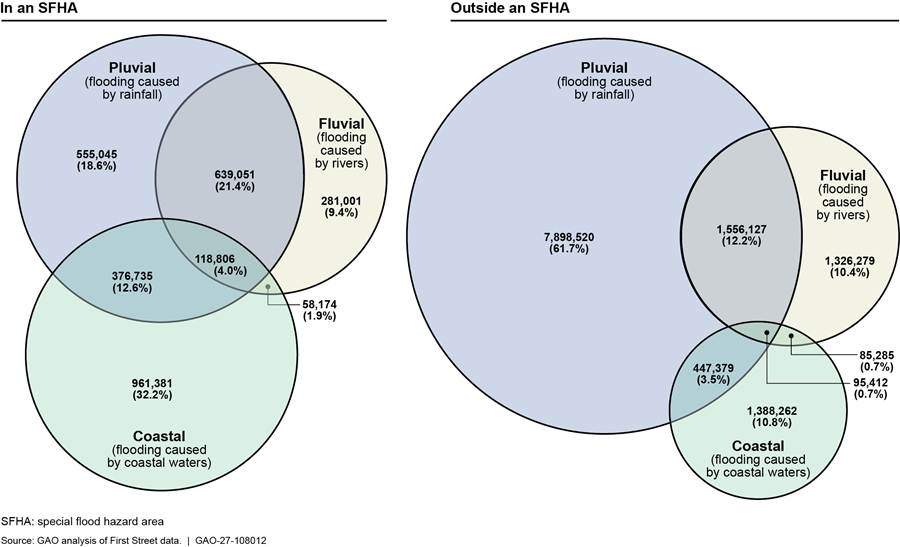
Note: First Street categorizes properties based on the predominant flood risk type or combination of types. However, properties may also be subject to flood risk from another risk type or types. This analysis includes properties in the 50 states and the District of Columbia.
Further, 18 percent of severe repetitive loss properties—properties that have flooded and incurred multiple NFIP claim payments—were outside SFHAs, according to FEMA. For county-level information on the distribution of flood risk and type across the United States, see our interactive graphic available at http://www.gao.gov/products/gao-27-108012.
Consumer Misconceptions May Discourage Flood Insurance Purchase
We identified multiple misconceptions that may deter consumers from purchasing flood insurance. These involve misperceptions of flood risk, overestimated expectations of federal disaster assistance, and a misunderstanding of insurance coverage.
Consumers may misperceive flood risk. According to stakeholders we interviewed, consumers may focus on short time frames; not fully understand low-probability, high-severity risks such as flooding; and believe areas outside SFHAs have no flood risk.
· Stakeholders told us that consumers may believe that a property will not flood if it has not flooded previously, even when the surrounding community experienced flooding. Those who have experienced flooding may also believe it will not happen again.
· Stakeholders also said many consumers perceive a 1 percent annual chance of flooding as low despite it being the threshold FEMA uses to identify SFHAs. In addition, because this threshold is also called the “100-year flood,” consumers may believe that a flood will not occur in their lifetime.
· Consumers may also mistake an SFHA as an “in-or-out” line indicating that properties outside it face no flood risk because flood insurance is not required, according to stakeholders. FEMA considers properties with a 0.2 percent annual chance of flooding as having moderate risk, but these properties are not subject to the mandatory purchase requirement. A 2022 Fannie Mae survey of households in or near an SFHA found that 39 percent of respondents in these moderate-risk areas did not believe they were near an SFHA.[27]
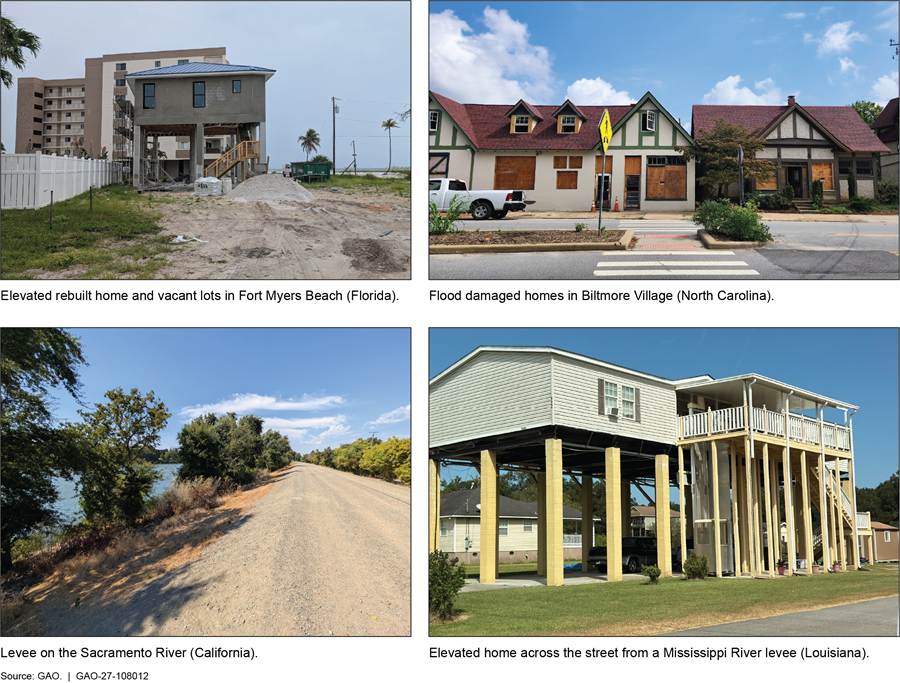
In each of the four communities we visited, most high-risk properties did not have flood insurance coverage despite recent flooding experience, proximity to water, or the presence of flood protection systems (see fig. 9).[28]
· Lee County, Florida, borders the Gulf and is subject to coastal flood risk. It experienced substantial flood damage from Hurricane Ian in September 2022. An estimated 39 percent of its high-risk properties have NFIP coverage.
· Buncombe County, North Carolina, is in the Appalachian Mountains and subject to heavy rainfall flood risk. It experienced substantial flood damage from Hurricane Helene in September 2024. An estimated 5 percent of its high-risk properties have NFIP coverage.
· Sacramento County, California, is in the Central Valley and subject to riverine flood risk. It experienced substantial flood damage in January 2023. An estimated 9 percent of its high-risk properties have NFIP coverage.
· Orleans Parish, Louisiana, located where the Mississippi River meets the Gulf, is subject to coastal flood risk. It experienced substantial flood damage from Hurricane Katrina in August 2005. An estimated 52 percent of its high-risk properties have NFIP coverage.
Consumers may overestimate federal disaster assistance. Individuals and households affected by natural disasters like flooding may be eligible for disaster assistance, including through FEMA’s Individuals and Households Program. Stakeholders told us that property owners may be less likely to purchase flood insurance if they expect to receive federal assistance after a flood. However, disaster assistance payments are substantially smaller than NFIP claim payments. For flood-related events from 2015 to 2025, the average inflation-adjusted disaster assistance payment was approximately $3,500.[29] Over the same period, the average inflation-adjusted NFIP claim payment for residential policies was approximately $88,700.[30] For selected major flood events, the average inflation-adjusted federal disaster assistance payment and NFIP residential claim payment were respectively:
· Hurricane Harvey (2017): $6,300, compared to $151,500.
· Hurricane Ian (2022): $3,300, compared to $136,700.
· Hurricane Helene (2024): $2,400, compared to $129,800.
Consumers may misunderstand insurance coverage. Some consumers believe homeowners insurance policies cover flood damage, when most policies specifically exclude it. In a 2023 survey of mortgage borrowers in or near an SFHA, approximately 24 percent mistakenly believed their homeowners insurance covered flood damage.[31] Similarly, a 2022 survey found that about 40 percent of respondents with homeowners insurance believed their policy covered flooding caused by heavy rainfall or storm surge.[32]
Consumers may view NFIP coverage as limited. NFIP building coverage is capped at $250,000 for 1–4 family residential properties and $500,000 for commercial and multifamily properties. According to data from the Census Bureau and the Department of Housing and Urban Development, the median home sales price of new houses sold in April 2026 was $416,500, or 67 percent more than the coverage limit for residential properties.[33] Stakeholders from North Carolina and northern California told us that the coverage limits were low relative to local property values and could discourage homeowners from buying policies.
Several Actions Could Increase Flood Insurance Purchase
When Congress established NFIP in 1968, one goal was to increase consumer purchase of flood insurance. In previous work on comprehensive NFIP reform, we identified five policy goals for evaluating reform options, one of which was encouraging consumer participation in the flood insurance market.[34] In addition, GAO’s Disaster Resilience Framework emphasizes the importance of federal efforts to provide reliable and authoritative information about current and future risk.[35]
Based on our analysis of industry reform proposals, discussion group responses, and industry stakeholder interviews, we identified six actions that could help increase flood insurance purchase: (1) incorporating all sources of flood risk into purchase requirement criteria; (2) collecting property-level flood risk information and making it publicly available; (3) requiring flood insurance quotes before closing on federally backed mortgages and signed disclosures when buyers decline coverage; (4) increasing NFIP coverage limits and allowing them to periodically adjust; (5) replacing discounted premiums with means-based affordability assistance that is reflected in the federal budget; and (6) removing barriers to private flood insurance.[36]
Congressional action would be needed to implement these actions because they would require statutory changes, explicit federal authority, or direction to agencies and other regulated entities.
Incorporating All Sources of Flood Risk into Purchase Requirement Criteria
FEMA floodplain maps designate SFHAs, which determine which properties may be subject to the mandatory purchase requirement. FEMA develops maps in collaboration with more than 22,000 U.S. communities. However, SFHAs do not fully represent flood risk because the maps generally do not account for pluvial (heavy rainfall) flooding, erosion, or coastal tsunamis.
When Congress first directed FEMA to identify SFHAs in the 1970s, available technology only allowed FEMA to identify primarily coastal and riverine risk.[37] Congress also applied the mandatory purchase requirement to these SFHAs. As technology and understanding of flood risk have advanced, Congress has not updated the criteria for determining SFHAs.
We have previously reported that the current process for developing and adopting FEMA flood maps is slow and resource intensive.[38] It requires a regulatory process involving collection and analysis of environmental data and a lengthy public review period.[39] FEMA and local officials told us that the public review involves property owners contesting FEMA’s determinations that their property is in an SFHA. As of February 2020, a single map took an average of 7 years to complete. FEMA has maintained maps for more than 22,000 communities at an annual cost up to about $480 million.
FEMA no longer uses floodplain maps for setting rates. Under Risk Rating 2.0, FEMA sets NFIP premium rates using a risk-based methodology that incorporates current technology and an updated understanding of flood risk, including pluvial flooding. FEMA could use this information to inform criteria for determining which properties are subject to the mandatory purchase requirement.
As discussed previously, the mandatory purchase requirement is the primary driver of flood insurance purchase. Owners of properties not subject to the requirement, including high-risk properties, may interpret the absence of a requirement as indicating that their flood risk does not warrant coverage.
Congress could revise the criteria for determining which property owners are required to purchase flood insurance without relying on the current process for adopting flood maps. For example, it could require all sources of flood risk to be incorporated when determining which properties are subject to the requirement. Floodplain maps could then primarily be used for floodplain management, potentially reducing the time and cost needed to produce them. However, FEMA does not have explicit authority to revise purchase requirement criteria on its own without congressional authorization.
Without incorporating all sources of flood risk into criteria for purchase requirement determinations, this primary driver of flood insurance purchase will continue to provide property owners with incomplete information about their flood risk and need for coverage.
Collecting Property-Level Flood Risk Information and Making it Publicly Available
Key stakeholders—including current and prospective property owners, insurance agents, real estate agents, and lenders—do not have easily accessible property-level flood risk information. Examples of such information include a metric indicating flood risk, such as a flood risk score; estimated average annual flood losses; NFIP flood claim history; and the probability of experiencing flood damage over a certain period, such as a 30-year mortgage.
FEMA currently provides property-level quotes for full-risk premiums on its FloodSmart.gov website after a user inputs information such as foundation type, year of construction, and construction type. However, FEMA and other federal entities have not been directed to collect property-level flood risk information and make it publicly available. In addition, federal privacy laws may restrict the disclosure of certain information, such as NFIP flood claim history, according to FEMA officials.
Stakeholders we interviewed said that potential consumers are more likely to purchase flood insurance when they are made aware of a property’s flood risk. If Congress were to require FEMA to collect property-level flood risk information and make it publicly available, current and prospective property owners, insurance agents, real estate agents, and lenders could be better informed about a property’s flood risk. If Congress wanted this information to include NFIP flood claim history, it could provide an applicable exception to federal privacy restrictions.
Without publicly available property-level flood risk information, property owners will continue to not have information that could help them make more informed flood insurance purchase and coverage decisions.
Including Flood Insurance Quotes Prior to Closing for Federally Backed Mortgages and Requiring Signed Disclosures
Most consumers do not receive a quote for flood insurance coverage when purchasing a property if they are not subject to the mandatory purchase requirement. They may take this as a signal that flood insurance is unnecessary. In contrast, for the 61 percent of homes with mortgages, lenders generally require that the properties are covered by homeowners insurance. As a result, prospective buyers obtain a homeowners insurance quote during the mortgage process.
A home with low or moderate flood risk is five times more likely to suffer flood damage than fire damage over a typical 30-year mortgage, according to FEMA. While homeowners insurance coverage is generally required, there is no lender requirement to ensure prospective homebuyers receive a quote for flood insurance coverage.
One option would be to require lenders providing federally backed mortgages to ensure that homebuyers receive a flood insurance quote prior to closing, alongside the homeowners insurance quote. Although this would not apply to properties without federally backed mortgages, it would reach a majority of properties.
Lenders could also be required to obtain a signed risk disclosure from the buyer when declining voluntary flood insurance coverage. The disclosure could include the property-level flood risk information discussed above, state that homeowners insurance generally does not cover flood damage, and indicate the likely amount of federal disaster assistance available following a flood. Congress could also consider consequences for declining coverage, such as making buyers ineligible for federal disaster assistance for flood damage or for certain federal affordability assistance.
Such actions would add steps to the homebuying process for consumers, lenders, and federal agencies. For example, consumers would need to obtain a flood insurance quote, lenders would need to verify insurance coverage or a signed declination prior to closing, and federal agencies would need to update oversight policies and procedures. However, they could reduce implementation burden by leveraging existing homebuying processes related to homeowners insurance coverage and the mandatory purchase requirement for flood insurance. Moreover, the benefits of increased risk awareness and protection from that risk would outweigh the implementation burden.
As discussed previously, consumers may underestimate their flood risk and misunderstand that homeowners insurance generally does not cover flood damage. Without receiving a flood insurance quote prior to closing and signing a risk disclosure when declining voluntary coverage, many homebuyers will continue to be unaware of flood risk and the need for separate coverage.
Increasing NFIP Coverage Limits and Allowing Periodic Adjustments
The current NFIP coverage limits of $250,000 for residential policies and $500,000 for commercial policies are set by statute and have not changed since 1994. If the limits had been adjusted for inflation, they would have been about $492,000 and $984,000, respectively, in 2025 dollars. The median home sales price of new houses sold in April 2026 was $416,500, about 67 percent more than the residential coverage limit. In addition, the conforming loan limit for mortgages accepted by Fannie Mae and Freddie Mac increased from $203,500 in 1994 to $832,750 in 2026.[40]
Lenders generally require homeowners insurance to cover the replacement cost of the insured property, which may differ from its market value or loan balance.[41] However, about 61 percent of residential NFIP policies are at their coverage limit, indicating they likely do not cover the property’s full replacement cost. This statutory limit prevents households that may otherwise choose to purchase greater coverage through NFIP from doing so.
Increasing NFIP coverage limits would allow more policies to cover a greater share of the insured property’s replacement cost. Congress could also establish a mechanism for periodically adjusting the limits to help them keep pace with changes in replacement costs while maintaining consistency and predictability.
Congress would also need to consider how the mandatory purchase requirement would apply to increased coverage limits. Options include the following:
· Option 1: Apply the mandatory purchase requirement to the previous coverage limits. This would limit required coverage and keep the associated premiums more affordable, thereby encouraging flood insurance purchase. However, treating coverage above those limits as optional would leave more of the property’s replacement cost uninsured.
· Option 2: Apply the mandatory purchase requirement to the new coverage limits. This would allow more of the property’s replacement cost to be insured but would increase required coverage and premiums. However, the cost per dollar of coverage generally declines as coverage increases. For example, the premium for $500,000 of coverage would be less than twice the premium for $250,000 for the same property.
Without increasing and periodically adjusting NFIP coverage limits, many consumers will remain unable to obtain coverage through NFIP that reflects the replacement cost of their properties, leaving them less protected from the financial consequences of flooding.
Improving Affordability Assistance by Making It Means-Based and Recognizing It in the Federal Budget
Efforts to increase flood insurance purchase—particularly any that would require more consumers to obtain coverage—would have implications for affordability. The affordability of flood insurance premiums is a major barrier to increasing flood insurance purchase, according to stakeholders and our prior work.[42] However, the current approach of addressing affordability through discounted premiums and caps on annual premium increases has several limitations:
· It is not cost-effective because the discounts are not targeted based on need.
· It does not effectively address affordability because some policyholders who need assistance do not receive it and assistance is temporary for those who do.
· It is not transparent because the costs are not recognized in the federal budget and become evident only when NFIP must borrow from the Department of the Treasury after a catastrophic flood event.
· It hinders private market growth by providing artificially low premiums.
In 2023, we recommended that Congress consider allowing FEMA to charge full-risk premiums for all policies and provide any affordability assistance through a means-based program reflected in the federal budget rather than through statutorily discounted premiums.[43] We noted that assistance could be used to purchase both private and NFIP policies to avoid undercutting the private market. We also identified options for limiting the cost of the assistance, including restricting eligibility to policyholders subject to the mandatory purchase requirement or excluding eligibility for repetitive loss properties. As of August 2026, no legislation had been enacted to address this recommendation.
Removing Barriers to Private Flood Insurance
Growth in the private flood insurance market could provide consumers with more coverage options and leverage the market to improve risk awareness and expand coverage while lowering prices. In 2023, we identified three key barriers to increasing the purchase of private flood insurance.[44]
· The primary barrier is NFIP’s discounted premiums.
· A second barrier is NFIP’s continuous coverage requirement for receiving discounted premiums. Under this requirement, policyholders must maintain continuous coverage through NFIP to continue receiving the discount, which may disincentivize customers from switching to a private policy.
· In addition, NFIP policyholders cannot receive partial refunds if they cancel their policy before the end of its term (typically 1 year) and replace it with a private policy. In practice, this may not allow enough time to switch to a private policy.
We recommended that Congress address all three of these barriers. As of August 2026, no legislation had been enacted to address these recommendations.
Conclusions
As flooding has become more frequent and severe in recent years, adequate flood insurance coverage has become increasingly important for protecting property owners and taxpayers from financial losses. Congress created NFIP and the mandatory purchase requirement to expand coverage, yet owners of most properties at risk of flooding remain uninsured.
Several statutory changes or other actions requiring explicit Congressional authorization could help ensure that efforts to expand coverage are affordable, transparent, and supportive of a broader flood insurance market:
· Updating the criteria for purchase requirement determinations to include all sources of flood risk would better align the requirement with actual risk and increase coverage among property owners at greater risk of flood losses.
· Requiring FEMA to collect property-level flood risk information and make it publicly available would improve understanding of flood risk and help consumers make more informed decisions about purchasing flood insurance and selecting coverage.
· Requiring lenders making federally backed mortgages to ensure homebuyers receive a flood insurance quote prior to closing and obtain a signed disclosure when buyers decline voluntary coverage would increase awareness of flood risk and the need for coverage separate from homeowners insurance.
· Increasing the statutory coverage limits and allowing them to adjust periodically would enable policyholders to obtain coverage that better reflects current replacement costs and potential flood losses.
· Improving affordability assistance, as we previously recommended, by replacing discounted premiums with means-based assistance that is reflected in the federal budget would more cost-effectively and transparently help property owners afford the coverage.
· Removing barriers to private flood insurance, as we previously recommended, would provide consumers with more coverage options and improve risk awareness.
Matters for Congressional Consideration
We are recommending the following four matters for congressional consideration:
Congress should consider updating the criteria for mandatory purchase requirement determinations to include all sources of flood risk, including pluvial (heavy rainfall) flooding. (Matter for Consideration 1)
Congress should consider directing FEMA to collect property-level flood risk information and make it publicly available. (Matter for Consideration 2)
Congress should consider requiring lenders making federally backed mortgages to ensure homebuyers receive a flood insurance quote prior to closing and to obtain a signed risk disclosure when a buyer declines voluntary flood insurance coverage. (Matter for Consideration 3)
Congress should consider increasing NFIP coverage limits and establishing a mechanism to adjust them periodically. (Matter for Consideration 4)
Agency Comments and Our Evaluation
We provided a draft of this report to the Departments of Agriculture, Homeland Security, Housing and Urban Development, and Veterans Affairs, and the Federal Housing Finance Agency for review and comment.
The Rural Housing Service provided comment via email on behalf of the Department of Agriculture stating it supported our second and fourth recommendations to Congress but not our first and third recommendations.
The Rural Housing Service stated that our first recommendation—for Congress to consider updating the criteria for mandatory purchase requirement determinations to include all flood risk sources—would significantly increase housing costs by requiring more homeowners to purchase flood insurance. Our recommendation is to ensure that the criteria accurately reflect flood risks. We acknowledge that flood insurance coverage can represent a substantial cost. However, we maintain that leaving homes uninsured exposes homeowners to the risk of being unable to repair flood damage, which is far less affordable. This highlights the importance of addressing affordability through means-based assistance when considering flood insurance reforms. In addition to making assistance means-based, it could also be targeted to homeowners that are required to purchase coverage.
The Rural Housing Service stated that our second recommendation—for Congress to consider directing FEMA to collect property-level flood risk information and make it publicly available—would empower consumers and insurers. It also cautioned that appropriate safeguards should exist to protect private data and ensure this flood risk information is separate from regulatory SFHA determinations.
The Rural Housing Service stated that our third recommendation—for Congress to consider requiring a preclosing flood insurance quote and signed declination—would create closing delays, documentation burdens, and legal exposure. We acknowledge that some additional steps will be needed. However, we also note that the implementation burden could be reduced by leveraging existing homebuying processes related to homeowners insurance and the mandatory purchase requirement for flood insurance. We maintain that the benefits of increased risk awareness and protection would outweigh any implementation burden.
The Rural Housing Service stated that our fourth recommendation for Congress to consider increasing NFIP coverage limits (instead of increasing the amount of coverage required) would expand consumer choice without raising the cost of obtaining a mortgage.
The Rural Housing Service also commented on our prior recommendations for Congress to consider removing barriers to private flood insurance. It said it strongly supports removing these barriers and considers this to be the highest priority action.
FEMA provided technical comments on the Department of Homeland Security’s behalf, which we incorporated as appropriate. The Departments of Housing and Urban Development and Veterans Affairs, and the Federal Housing Finance Agency did not provide comments on our draft report.
We are sending copies of this report to the appropriate congressional committees; the Secretaries of Agriculture, Homeland Security, Housing and Urban Development, and Veterans Affairs; the Director of the Federal Housing Finance Agency; and other interested parties. In addition, the report is available at no charge on the GAO website at https://www.gao.gov.
If you or your staff have any questions about this report, please contact me at CackleyA@gao.gov. Contact points for our Offices of Congressional Relations and Media Relations may be found on the last page of this report. GAO staff who made key contributions to this report are listed in appendix V.
Alicia Puente Cackley
Director, Financial Markets and Community Investment
List of Addressees
The Honorable Elizabeth Warren
Ranking Member
Committee on Banking, Housing, and Urban Affairs
United States Senate
The Honorable John Kennedy
Chairman
Subcommittee on Economic Policy
Committee on Banking, Housing, and Urban Affairs
United States Senate
The Honorable French Hill
Chairman
The Honorable Maxine Waters
Ranking Member
Committee on Financial Services
House of Representatives
This report examines (1) the extent to which consumers purchase flood insurance, (2) the effectiveness of the mandatory purchase requirement, (3) factors affecting consumers’ decisions to purchase flood insurance, and (4) potential actions to increase consumers’ purchase of flood insurance.
For all objectives, we reviewed relevant laws and regulations and our prior reports, and we interviewed Federal Emergency Management Agency (FEMA) officials.[45] We also attended three national flood insurance conferences to inform our work: the National Flood Association’s Annual Conference in April 2025 and March 2026, and the American Property Casualty Insurance Association’s National Flood Conference in June 2025. In addition, we visited four flood-prone communities that reflected different types of flood risk and income levels: Fort Myers, Florida; Asheville, North Carolina; New Orleans, Louisiana; and Sacramento, California. During these visits, we interviewed property owners, insurance agents, real estate agents, floodplain managers, and other local officials and stakeholders.
Data Sources and Reliability
To address the first and second objectives, we analyzed FEMA data on National Flood Insurance Program (NFIP) policies from January 2008 through April 2026, National Association of Insurance Commissioners (NAIC) data on private flood insurance policies from 2018 through 2025, and First Street data on property-level flood risk.[46] First Street property characteristics data used in our analyses were as of January 2024, and its flood risk data were as of March 2025.
We assessed the reliability of FEMA’s NFIP policy data by reviewing documentation; interviewing FEMA officials; testing the data by identifying missing data, outliers, and any obvious errors; and comparing our results to published data. We determined that FEMA’s NFIP data were sufficiently reliable for analyzing NFIP policies over time and property-level NFIP coverage.
We assessed the reliability of NAIC’s private flood insurance data by reviewing documentation; interviewing NAIC officials about the data’s accuracy and limitations and their process for ensuring data reliability; and testing the data by identifying missing data, outliers, and any obvious errors and comparing our results to published data, such as NAIC publications. We determined that NAIC’s data were sufficiently reliable for analyzing private flood insurance policies over time by state.
We assessed the reliability of First Street’s flood risk data by reviewing documentation, interviewing First Street representatives, and testing the data by identifying missing data, outliers, and any obvious errors. We determined that the First Street data were sufficiently reliable for analyzing property-level flood risk.
Analysis of Flood Risk and Insurance Coverage
We merged property-level data on NFIP policies active as of April 30, 2026, with First Street flood risk data to determine which properties had NFIP coverage on that date. We merged the two datasets in multiple stages based on a selection of address and geolocation variables, ordered from most to least precise. At each stage, properties that were successfully merged were removed from the process and the next stage was performed only on unmatched properties. The variables selected for each stage were:
1. Street address, zip code, city, state;
2. Street address, Census Bureau block group;
3. Street address, zip code;
4. Five-decimal longitude and latitude coordinates;[47] and
5. Four-decimal longitude and latitude coordinates.[48]
Using this process, we successfully matched 79 percent of NFIP policies as of April 30, 2026, to a property in First Street’s data. We excluded the remaining 21 percent of unmatched NFIP policies from our property-level analyses. We compared the special flood hazard area (SFHA) status and the average full-risk premium for matched and unmatched NFIP policies and found that a greater proportion of unmatched properties were in an SFHA, and unmatched properties had a higher full risk premium, which could indicate a higher flood risk. As a result, our model might understate the strength of the association of SFHA status and flood risk with NFIP purchase.
We used the merged dataset to analyze the number and proportion of properties with NFIP coverage as of April 30, 2026, by First Street’s flood score and FEMA’s SFHA designation in the 50 states and the District of Columbia. First Street classifies flood risk using a flood score ranging from 1 (minimal) to 10 (extreme) based on a property’s likelihood and projected depth of flooding. FEMA defines SFHAs as land areas that would be submerged by the floodwaters of the “base flood,” meaning a flood event that has a 1 percent chance of being equaled or exceeded in any given year (1 percent annual chance of flood). This is equivalent to at least a 26 percent chance of experiencing a flood during a 30-year mortgage.
According to First Street, a flood score of 4 or greater similarly represents at least a 26 percent chance of experiencing a flood during a 30-year mortgage. We therefore categorized properties with a flood score of 4 or greater as high-risk properties and analyzed the number and proportion of these properties with NFIP coverage by flood score and SFHA status. First Street also said that a flood score of 2 represents at least a 6 percent chance of experiencing a flood during a 30-year mortgage. FEMA considers properties with a 6 to 26 percent chance of flooding over that period—corresponding to an annual flood chance of between 0.2 percent and 1 percent—to have moderate flood risk. We therefore categorized properties with flood scores of 2 or 3 as moderate risk and properties with a flood score of 1 as low risk.
Calculating the percentage of properties with NFIP coverage by First Street flood risk characteristics, such as flood score, required using the matched NFIP and First Street data. We matched 79 percent of NFIP contracts to a First Street property record, including 82 percent of contracts outside an SFHA and 77 percent of contracts in an SFHA. We accounted for unmatched contracts by dividing the matched coverage rate by the match rate for SFHA, non-SFHA, and all contracts, as applicable. For county-specific coverage rates, we divided matched coverage rate by the county-specific match rate for all contracts. We indicate throughout the report that these are estimates.
To further address the first objective, we analyzed historical and current market trends in flood insurance purchase using FEMA data on NFIP policies from January 2009 through April 2026 and state-level NAIC data on private flood insurance policies from 2018 through 2025 for the 50 states and the District of Columbia. The 2018 and 2019 data were compiled from information provided by insurance regulators in the 50 states and the District of Columbia, while data from 2020 onward were collected through NAIC’s annual financial statements. Specifically, we analyzed
· the proportion of properties with flood insurance (including both NFIP and private policies) by state and nationally as of 2025,
· the private share of the flood insurance market from 2018 through 2025,
· the number of NFIP policies nationally from January 2009 through April 2026, and
· the change in the number of NFIP policies from 2009 to 2025 by state.
Finally, using First Street’s flood scores and flood risk type data, we analyzed the geographic distribution of flood risk across the United States. First Street categorizes properties with a flood score greater than 1 by one or a combination of three flood risk types: coastal, fluvial (riverine), and pluvial (rainfall-related).[49]
To further address the second objective, we used First Street flood risk data to analyze the number of properties by First Street flood score and flood risk type in and outside SFHAs. We also interviewed 11 industry stakeholders, including insurance agents, engineering consultants, an academic, and a lenders’ association on factors that influence flood insurance purchase decisions. We selected these interviewees because of their knowledge of flood insurance based on published work, scope of business, and our prior work on flood insurance. Also, during our four site visits we interviewed local officials and insurance and real estate agents about factors that influence flood insurance purchase decisions in their respective areas. We selected these interviewees based on their scope of business and roles in local government. In addition, we used FEMA and NAIC data to analyze NFIP and private flood insurance coverage in Florida and examine the effect of the Florida Citizens Property Insurance Corporation mandate.[50]
We also used the merged data and Census Bureau data to develop an econometric model to identify characteristics associated with whether a property had NFIP coverage. For more information on this model, see appendix II.
Analysis of Consumer Understanding and Purchase Decisions
To address the third objective, we used the stakeholder interviews described above to obtain perspectives on consumers’ understanding of flood risk and factors that may hinder that understanding. We also reviewed two studies on consumers’ perceptions of flood risk and flood insurance.[51]
We analyzed publicly available FEMA data on NFIP claims and disaster assistance payments made through the Individuals and Households Program to estimate the amounts paid to consumers following flood events. To assess the reliability of these data, we reviewed documentation and obtained written information from FEMA officials. We determined that the data were sufficiently reliable for estimating the amounts paid to consumers following flood events. In addition, we analyzed FEMA data on NFIP policies to determine the percentage of NFIP contracts with discounted premiums as of April 30, 2026, by state.[52]
Discussion Sessions, Interviews, and Site Visits
To address the fourth objective, we conducted three discussion sessions with 15 flood insurance stakeholders to obtain perspectives on potential actions to increase flood insurance purchase, the likely effectiveness and feasibility of these actions, and implementation considerations. To capture individuals and entities with a recognized point of view, opinion, or position on the topic, we considered those who participated in key flood insurance conferences; conducted or issued research, editorials, or other written statements on the topic; or testified before Congress on the topic. We included representatives of various stakeholders and interest groups in the final list of participants, including homeowners, lenders, insurers, insurance and real estate agents, researchers, and the federal government. We identified potential actions by leveraging our prior work and expertise on flood insurance, attending three flood conferences in which potential actions were discussed, reviewing issued research and public statements, and evaluating the input from the discussion sessions, site visits, and individual interviews.
We also interviewed nine additional industry stakeholders, including insurance agents, engineering consultants, an academic, and a lenders’ association, and FEMA and NAIC officials on the likely effectiveness of potential actions to increase flood insurance purchase and potential implementation challenges and considerations. See appendix IV for a full list of discussion session participants and interviewees.
We conducted this performance audit from January 2025 to October 2026 in accordance with generally accepted government auditing standards. Those standards require that we plan and perform the audit to obtain sufficient, appropriate evidence to provide a reasonable basis for our findings and conclusions based on our audit objectives. We believe that the evidence obtained provides a reasonable basis for our findings and conclusions based on our audit objectives.
This appendix describes the multivariate regressions we used to test the relationship between National Flood Insurance Program (NFIP) coverage and various flood risk and demographic characteristics.
We used address and flood risk data from First Street, demographic data from the American Community Survey, and NFIP policy data from the Federal Emergency Management Agency (FEMA) to estimate a linear probability model of the likelihood of having NFIP coverage. The sample includes all First Street addresses in the 50 states plus Washington, D.C., that have damageable structures and 1 to 4 units.
Variables
The specification for our model was:

For a property  with flood source
  and
flood score
and
flood score  and FEMA special flood hazard
area (SFHA) status
and FEMA special flood hazard
area (SFHA) status  in block group
  .
.
The dependent variable  is an indicator variable for
whether a property had NFIP coverage on April 30, 2026.
is an indicator variable for
whether a property had NFIP coverage on April 30, 2026.
 are three indicator variables
for in an SFHA, outside an SFHA, and missing information on SFHA status. In
particular:
are three indicator variables
for in an SFHA, outside an SFHA, and missing information on SFHA status. In
particular:
·  if a property’s FEMA flood zone
starts with “A” or “V”
if a property’s FEMA flood zone
starts with “A” or “V”
·  if a property’s FEMA flood zone
does not start with “A” or “V”
if a property’s FEMA flood zone
does not start with “A” or “V”
·  if a property’s FEMA flood zone
is “NA” or missing
if a property’s FEMA flood zone
is “NA” or missing
We omitted the indicator variable for  , thus the coefficients
  can be interpreted as the
expected change in likelihood of a property having NFIP coverage for a given
SFHA status relative to a property outside of an SFHA.
can be interpreted as the
expected change in likelihood of a property having NFIP coverage for a given
SFHA status relative to a property outside of an SFHA.
 are three indicator variables
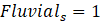
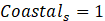
for pluvial (heavy rainfall), fluvial (riverine), and coastal flood risk that
are equal to 1 if a property has that specific type of flood risk:
are three indicator variables
for pluvial (heavy rainfall), fluvial (riverine), and coastal flood risk that
are equal to 1 if a property has that specific type of flood risk:
· 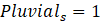 if the property had a flood
source equal to pluvial; pluvial and fluvial; pluvial and coastal; or pluvial,
fluvial, and coastal.
if the property had a flood
source equal to pluvial; pluvial and fluvial; pluvial and coastal; or pluvial,
fluvial, and coastal.
·  if the property had a flood
source equal to fluvial; fluvial and pluvial; fluvial and coastal; or fluvial,
pluvial, and coastal.
if the property had a flood
source equal to fluvial; fluvial and pluvial; fluvial and coastal; or fluvial,
pluvial, and coastal.
·  if the property had a flood
source equal to coastal; coastal and pluvial; coastal and fluvial; or coastal,
pluvial, and fluvial.
if the property had a flood
source equal to coastal; coastal and pluvial; coastal and fluvial; or coastal,
pluvial, and fluvial.
A property had no flood source if, and only if, its flood
score equaled 1, thus the reference category for was no flood source.
 are 11 indicator variables for
flood score values 1-10 and missing. The indicator variable for flood score 1,
which indicates low flood risk, was omitted, thus the reference category for was flood score 1. We included
missing flood scores because there may be information in First Street’s
decision not to provide these properties with flood risk estimates.
are 11 indicator variables for
flood score values 1-10 and missing. The indicator variable for flood score 1,
which indicates low flood risk, was omitted, thus the reference category for was flood score 1. We included
missing flood scores because there may be information in First Street’s
decision not to provide these properties with flood risk estimates.
Because the indicator variables for and were interacted and the
reference categories for flood source and flood score were no flood source and
flood score 1, the reference category for the interacted  was a property with no flood
source and flood score 1. We interpreted the coefficients
was a property with no flood
source and flood score 1. We interpreted the coefficients  as the expected change in
likelihood of having NFIP coverage for a given flood source and flood score
combination relative to a property with low flood risk (i.e., no flood source
and flood score equals 1).
as the expected change in
likelihood of having NFIP coverage for a given flood source and flood score
combination relative to a property with low flood risk (i.e., no flood source
and flood score equals 1).
 contains the census-block-group
peer average of SFHA status. The block-group peer average is the proportion of
properties within a property’s block group that are in an SFHA when excluding
the property’s own SFHA status from the calculation.
contains the census-block-group
peer average of SFHA status. The block-group peer average is the proportion of
properties within a property’s block group that are in an SFHA when excluding
the property’s own SFHA status from the calculation.
The vector  contains
census-block-group-level control variables from the American Community Survey.
The vector contains the following variables:
contains
census-block-group-level control variables from the American Community Survey.
The vector contains the following variables:
· Proportion of owner-occupied housing units within a census block group. We omitted the proportion of renter-occupied housing units.
· Proportion of owner-occupied housing units with a mortgage or similar debt within a census block group. We omitted the proportion without a mortgage.
· Proportion of the population 25 years and older with a bachelor’s degree or greater within a census block group. We omitted the proportion with less than a bachelor’s degree.
· The natural log of median household income in the past 12 months within a census block group, and an indicator variable for median income greater than $250,000 in 2024 inflation-adjusted dollars.
· Quadratic polynomial for median age within a census block group.
· Proportion of housing units that were urban within a census block group. We omitted the proportion of housing units that were rural.
· Quadratic polynomials for proportion Black, proportion Asian, and proportion other race within a census block group.[53] We omitted the proportion White.
· Quadratic polynomial for proportion Hispanic or Latino within a census block group. We omitted the proportion not Hispanic or Latino.
· Proportion of nonfamily households within a census block group. We omitted the proportion of family households.
· Unemployment rate within a census block group.
· Labor force participation rate within a census block group.
All values in and were demeaned and divided by
their standard deviation so that the coefficient could be interpreted as the
expected increase in the likelihood of having NFIP coverage for a one standard
deviation increase in the independent variable. Because and had a mean of zero, the constant
can be interpreted as the expected likelihood of a property having NFIP
coverage if it had low flood risk (no flood source and flood score equals 1)
and was located in a block group with characteristics that are equal to the
average. For the regressions that included all observations and limited
observations to properties outside of an SFHA, the constant had the additional
constraint that the property was outside an SFHA. For the regression that
limited observations to properties inside an SFHA, the constant had the
additional constraint that the property was in an SFHA.
Limitations
Although the data quality is sufficiently reliable for the purposes of our analysis, there were some limitations. Our model assumed that the likelihood of NFIP coverage increased linearly in our independent variables. However, it is possible that the relationships of the variables we included were nonlinear. Also, property-level demographic information was not available, so the block-group-level demographic variables may not accurately capture the demographics of the household making the purchasing decision. Our model did not account for individual characteristics that may influence a household’s purchasing decision, such as the homeowner’s prior experience with flooding.
Because the First Street data did not include address line 2 data (such as apartment numbers), we assumed all properties in the First Street data with a matching address in the FEMA data had NFIP coverage. This overestimated the number of properties with NFIP coverage because we considered all properties with the same address line 1, such as apartments, to have NFIP coverage if at least one property with that address had NFIP coverage. Thus, if an independent variable was positively correlated with the number of properties per address, the coefficient estimate was positively biased. If an independent variable was negatively correlated with the number of properties per address, the coefficient estimate was negatively biased.
Results
The coefficient estimates are presented in table 2 below.
The first column includes all observations. The second and third columns
include observations located in an SFHA and outside an SFHA, respectively. The
second and third columns omit the indicator variables  because there is no variation in
SFHA status in the sample. In each column, the coefficient estimates are
provided first followed by the standard errors in parentheses.
because there is no variation in
SFHA status in the sample. In each column, the coefficient estimates are
provided first followed by the standard errors in parentheses.
Table 2: Estimated Associations Between Flood Risk and Demographic Characteristics and NFIP Coverage as of April 30, 2026
|
Characteristics |
All properties Coefficient (S.E.) |
In an SFHA Coefficient (S.E.) |
Outside an SFHA Coefficient (S.E.) |
|
Constant |
0.012*** (0.000) |
0.313*** (0.004) |
0.012*** (0.000) |
|
Property characteristics |
|
|
|
|
In an SFHA |
0.244*** (0.002) |
|
|
|
Missing SFHA status |
0.006*** (0.001) |
|
|
|
Missing flood score |
0.027*** (0.005) |
-0.001 (0.007) |
0.053*** (0.005) |
|
Pluvial (heavy rainfall) risk |
|
|
|
|
Flood score 2 |
0.013 (0.036) |
0.120 (0.136) |
-0.005 (0.025) |
|
Flood score 3 |
0.019*** (0.000) |
0.026*** (0.004) |
0.018*** (0.000) |
|
Flood score 4 |
0.022*** (0.001) |
0.030*** (0.004) |
0.020*** (0.000) |
|
Flood score 5 |
0.019*** (0.001) |
0.022*** (0.005) |
0.018*** (0.001) |
|
Flood score 6 |
0.018*** (0.001) |
0.017*** (0.004) |
0.018*** (0.000) |
|
Flood score 7 |
0.015*** (0.001) |
0.003 (0.005) |
0.015*** (0.001) |
|
Flood score 8 |
0.019*** (0.001) |
0.022*** (0.005) |
0.019*** (0.001) |
|
Flood score 9 |
0.004*** (0.001) |
-0.023*** (0.004) |
0.011*** (0.000) |
|
Flood score 10 |
0.006*** (0.002) |
-0.015*** (0.006) |
0.011*** (0.001) |
|
Fluvial (riverine) risk |
|
|
|
|
Flood score 2 |
0.010*** (0.002) |
-0.008 (0.008) |
0.012*** (0.001) |
|
Flood score 3 |
0.008*** (0.001) |
-0.010 (0.007) |
0.011*** (0.001) |
|
Flood score 4 |
0.010*** (0.001) |
-0.019*** (0.006) |
0.016*** (0.001) |
|
Flood score 5 |
0.017*** (0.001) |
0.004 (0.005) |
0.020*** (0.001) |
|
Flood score 6 |
0.022*** (0.002) |
0.008* (0.005) |
0.025*** (0.001) |
|
Flood score 7 |
0.022*** (0.002) |
0.028*** (0.006) |
0.023*** (0.002) |
|
Flood score 8 |
0.006* (0.003) |
0.007 (0.007) |
0.010*** (0.003) |
|
Flood score 9 |
-0.000 (0.002) |
0.014*** (0.005) |
0.020*** (0.001) |
|
Flood score 10 |
-0.023*** (0.003) |
-0.010 (0.007) |
0.017*** (0.002) |
|
Coastal flood risk |
|
|
|
|
Flood score 2 |
0.098*** (0.004) |
0.121*** (0.021) |
0.091*** (0.004) |
|
Flood score 3 |
0.107*** (0.003) |
0.129*** (0.014) |
0.099*** (0.003) |
|
Flood score 4 |
0.131*** (0.003) |
0.140*** (0.012) |
0.121*** (0.003) |
|
Flood score 5 |
0.158*** (0.004) |
0.164*** (0.011) |
0.141*** (0.003) |
|
Flood score 6 |
0.191*** (0.004) |
0.180*** (0.008) |
0.171*** (0.003) |
|
Flood score 7 |
0.240*** (0.004) |
0.193*** (0.007) |
0.229*** (0.005) |
|
Flood score 8 |
0.311*** (0.005) |
0.232*** (0.006) |
0.320*** (0.006) |
|
Flood score 9 |
0.295*** (0.004) |
0.243*** (0.005) |
0.308*** (0.007) |
|
Flood score 10 |
0.232*** (0.006) |
0.205*** (0.007) |
0.214*** (0.010) |
|
Block group characteristics |
|
|
|
|
Peer proportion in an SFHA |
0.006*** (0.000) |
0.005*** (0.001) |
0.006*** (0.000) |
|
Proportion Black |
0.007*** (0.000) |
0.057*** (0.004) |
0.006*** (0.000) |
|
Proportion Black (squared) |
-0.002*** (0.000) |
-0.015*** (0.001) |
-0.002*** (0.000) |
|
Proportion Asian |
-0.003*** (0.000) |
0.013** (0.006) |
-0.003*** (0.000) |
|
Proportion Asian (squared) |
0.000 (0.000) |
-0.008*** (0.001) |
0.000 (0.000) |
|
Proportion other race |
-0.002*** (0.000) |
0.005 (0.004) |
-0.002*** (0.000) |
|
Proportion other race (squared) |
-0.001*** (0.000) |
-0.000 (0.002) |
-0.001*** (0.000) |
|
Proportion Hispanic |
0.010*** (0.000) |
0.027*** (0.005) |
0.009*** (0.000) |
|
Proportion Hispanic (squared) |
-0.001*** (0.000) |
0.000 (0.002) |
-0.002*** (0.000) |
|
Proportion with bachelor’s degree or higher |
0.009*** (0.000) |
0.048*** (0.003) |
0.008*** (0.000) |
|
Median income (natural log) |
0.002*** (0.000) |
0.024*** (0.003) |
0.001*** (0.000) |
|
Median income greater than $250,000 |
-0.001 (0.002) |
-0.008 (0.017) |
0.000 (0.002) |
|
Unemployment rate |
-0.001*** (0.000) |
-0.003** (0.002) |
-0.000 (0.000) |
|
Labor force participation rate |
-0.001*** (0.000) |
0.004* (0.002) |
-0.001*** (0.000) |
|
Median age |
0.003*** (0.000) |
0.023*** (0.002) |
0.002*** (0.000) |
|
Median age (squared) |
0.001*** (0.000) |
-0.007*** (0.001) |
0.002*** (0.000) |
|
Proportion of urban housing units |
0.005*** (0.000) |
0.052*** (0.002) |
0.003*** (0.000) |
|
Proportion of nonfamily households |
-0.002*** (0.000) |
-0.010*** (0.003) |
-0.002*** (0.000) |
|
Proportion owner-occupied |
0.002*** (0.000) |
0.023*** (0.003) |
0.002*** (0.000) |
|
Proportion with a mortgage |
-0.001*** (0.000) |
0.030*** (0.002) |
-0.003*** (0.000) |
|
|
|
|
|
|
Observations |
90,768,721 |
3,315,379 |
86,706,143 |
|
R-squared |
0.232 |
0.140 |
0.076 |
NFIP: National Flood Insurance Program
SFHA: special flood hazard area
Source: GAO analysis of data from the Federal Emergency Management Agency, First Street, and the Census Bureau. | GAO-27-108012
Notes: Statistical significance is denoted by the following significance levels: *** p<0.01, ** p<0.05, and * p<0.10. Standard errors (S.E.) clustered at the census block group level are in parentheses. The values of the independent variables from the American Community Survey are estimated based on a sample of housing units from census blocks in each year. The model does not incorporate this source of error into the standard error estimates. Therefore, the estimated standard errors are likely smaller than the true values. We included quadratic (squared) terms for race/ethnicity proportions and median age in our regression analysis to account for potential non-linear relationships between those variables and the likelihood of NFIP coverage.
Properties in SFHAs were much more likely to have NFIP coverage than properties outside of SFHAs. The relationship between flood risk (flood score) and the likelihood of having NFIP coverage differed by flood type. Properties with coastal flood risk were much more likely to have NFIP coverage than properties with low flood risk (flood score 1). There is also a strong positive correlation between flood score and the expected increase in NFIP coverage for properties with coastal risk. The likelihood of having NFIP coverage was lower for properties with pluvial and riverine risks than it was for properties with coastal risk. In the regression that included all observations, most properties with relatively higher pluvial or fluvial flood risk (flood scores 3–10 for pluvial and 2–8 for fluvial) were more likely to have NFIP coverage than properties with low flood risk (flood score 1).
Properties in SFHAs with a higher proportion of homeowners with mortgages were associated with a higher likelihood of NFIP coverage. This is likely due to the mandatory purchase requirement for federally backed mortgages in SFHAs.
The other variables were associated with small changes in the likelihood of NFIP coverage. The SFHA status of one’s peers in a block group was positively associated with having an NFIP policy, although the relationship was somewhat small. The proportion of residents with a bachelor’s degree or higher, medium income, proportion urban housing units, and proportion Hispanic were also positively associated with purchasing NFIP insurance within SFHAs. Median age and proportion Black had a nonlinear association within SFHAs. The association between NFIP coverage and the unemployment rate, labor force participation rate, and proportion of nonfamily households within a block group was consistently small.
Site Visit 1: Fort Myers, Florida (July 2025)
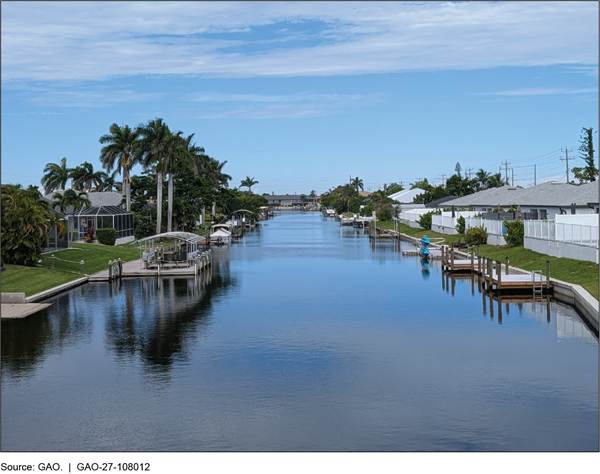
|
Predominant flood source |
Coastal |
|
Percentage of properties in an SFHA |
37% |
|
Percentage of properties at high risk |
62% |
|
Percentage of SFHA properties with NFIP coverage |
61% |
|
Estimated percentage of high-risk properties with NFIP coverage |
39% |
|
Percentage of all properties with NFIP coverage |
28% |
|
Median NFIP premium |
$1,386 |
|
Median full-risk NFIP premium |
$3,314 |
|
Percentage of NFIP contracts with a discounted premium |
66% |
FEMA: Federal Emergency Management Agency
NFIP: National Flood Insurance Program
SFHA: special flood hazard area
Source: GAO analysis of First Street and FEMA data. | GAO-27-108012
Note: Data on NFIP policies are as of April 30, 2026. For this analysis, we classified properties with a First Street flood score of 4 through 10 to be high risk. Properties with a high flood risk roughly correlate with FEMA’s 1 percent annual chance of flood designation. Calculating the percentage of high-risk properties with NFIP coverage required matching NFIP data to First Street data. We accounted for unmatched contracts by dividing the matched coverage rate by the county match rate.
Site Visit 2: Asheville, North Carolina (August 2025)
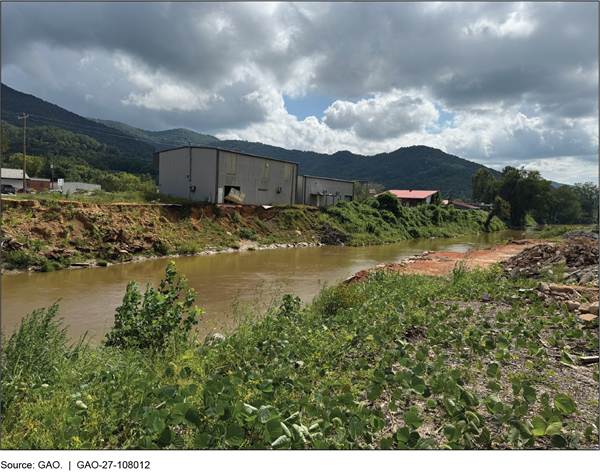
|
Predominant flood source |
Rainfall |
|
Percentage of properties in an SFHA |
1% |
|
Percentage of properties at high risk |
16% |
|
Percentage of SFHA properties with NFIP coverage |
50% |
|
Estimated percentage of high-risk properties with NFIP coverage |
5% |
|
Percentage of all properties with NFIP coverage |
1% |
|
Median NFIP premium |
$860 |
|
Median full-risk NFIP premium |
$964 |
|
Percentage of NFIP contracts with a discounted premium |
23% |
FEMA: Federal Emergency Management Agency
NFIP: National Flood Insurance Program
SFHA: special flood hazard area
Source: GAO analysis of First Street and FEMA data. | GAO-27-108012
Note: Data on NFIP policies are as of April 30, 2026. For this analysis, we classified properties with a First Street flood score of 4 through 10 to be high risk. Properties with a high flood risk roughly correlate with FEMA’s 1 percent annual chance of flood designation. Calculating the percentage of high-risk properties with NFIP coverage required matching NFIP data to First Street data. We accounted for unmatched contracts by dividing the matched coverage rate by the county match rate.
Site Visit 3: Sacramento, California (September 2025)
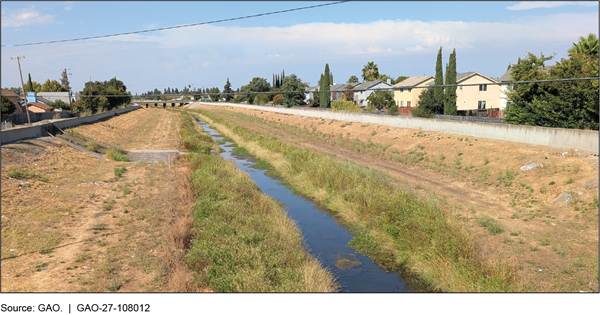
|
Predominant flood source |
Riverine |
|
Percentage of properties in an SFHA |
8% |
|
Percentage of properties at high risk |
15% |
|
Percentage of SFHA properties with NFIP coverage |
>80% |
|
Estimated percentage of high-risk properties with NFIP coverage |
9% |
|
Percentage of all properties with NFIP coverage |
10% |
|
Median NFIP premium |
$634 |
|
Median full-risk NFIP premium |
$639 |
|
Percentage of NFIP contracts with a discounted premium |
26% |
FEMA: Federal Emergency Management Agency
NFIP: National Flood Insurance Program
SFHA: special flood hazard area
Source: GAO analysis of First Street and FEMA data. | GAO-27-108012
Note: Data on NFIP policies are as of April 30, 2026. For this analysis, we classified properties with a First Street flood score of 4 through 10 to be high risk. Properties with a high flood risk roughly correlate with FEMA’s 1 percent annual chance of flood designation. Calculating the percentage of high-risk properties with NFIP coverage required matching NFIP data to First Street data. We accounted for unmatched contracts by dividing the matched coverage rate by the county match rate.
Site Visit 4: New Orleans, Louisiana (September 2025)
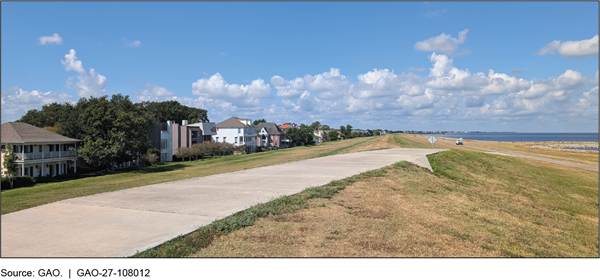
|
Predominant flood source |
Coastal |
|
Percentage of properties in an SFHA |
14% |
|
Percentage of properties at high risk |
100% |
|
Percentage of SFHA properties with NFIP coverage |
>80% |
|
Estimated percentage of high-risk properties with NFIP coverage |
52% |
|
Percentage of all properties with NFIP coverage |
52% |
|
Median NFIP premium |
$855 |
|
Median full-risk NFIP premium |
$1,040 |
|
Percentage of NFIP contracts with a discounted premium |
52% |
FEMA: Federal Emergency Management Agency
NFIP: National Flood Insurance Program
SFHA: special flood hazard area
Source: GAO analysis of First Street and FEMA data. | GAO-27-108012
Note: Data on NFIP policies are as of April 30, 2026. For this analysis, we classified properties with a First Street flood score of 4 through 10 to be high risk. Properties with a high flood risk roughly correlate with FEMA’s 1 percent annual chance of flood designation. Calculating the percentage of high-risk properties with NFIP coverage required matching NFIP data to First Street data. We accounted for unmatched contracts by dividing the matched coverage rate by the county match rate.
To obtain perspectives on potential actions to increase flood insurance purchase, we conducted three discussion sessions with 15 flood insurance stakeholders and individual interviews with nine additional stakeholders.[54] For each organization, we list one contact person, but in some cases others from the organization attended the discussion session or participated in the interview.
We met with the following individuals during three discussion sessions held in February and March 2026:
· Nicole Austin, Reinsurance Association of America
· Amy Bach, United Policyholders
· Chad Berginnis, Association of State Floodplain Managers, Inc.
· Tony Cotto, National Association of Mutual Insurance Companies
· Don Griffin, American Property Casualty Insurance Association
· Diane Horn, Congressional Research Service
· Keri Kish, Wholesale & Specialty Insurance Association
· Andy Neal, Aon
· Austin Perez, National Association of Realtors
· Joel Scata, Natural Resources Defense Council
· Lisa Sharrard, Choice Flood Insurance
· Sara Singhas, Mortgage Bankers Association
· Mike Skiados, National Association of Professional Insurance Agents
· Teshale Smith, American Bankers Association
· Nancy Watkins, Milliman
We interviewed the following stakeholders individually, from July 2025 to June 2026:
· Trevor Burgess, Neptune Flood
· Brad Hubbard, National Flood Experts
· Craig Poulton, XLNT Insurance Company
· Joe Rossi, Joe Flood Insurance Brokerage
· Delton Schwalls, PE, CFM, Schwalls Consulting LLC
· Leonard Shabman, Resources for the Future
· Patrick Sullivan, Assurant
· Leila Taha, National Flood Association
· Peter Waggonner, Greater New Orleans, Inc. / Coalition for Sustainable Flood Insurance
GAO Contact
Alicia Puente Cackley, CackleyA@gao.gov
Staff Acknowledgments
In addition to the contact named above, Christopher Forys (Assistant Director), Nathan Gottfried (Analyst in Charge), Kyle Abe, Conrad Belknap, Gita DeVaney, Kevin Donovan, Elizabeth Dretsch, Lijia Guo, Mohammed Mohammed, Marc Molino, Matthew Naven, Jessica Sandler, Erik Shive, and Mary Stack, made key contributions to this report.
The Government Accountability Office, the audit, evaluation, and investigative arm of Congress, exists to support Congress in meeting its constitutional responsibilities and to help improve the performance and accountability of the federal government for the American people. GAO examines the use of public funds; evaluates federal programs and policies; and provides analyses, recommendations, and other assistance to help Congress make informed oversight, policy, and funding decisions. GAO’s commitment to good government is reflected in its core values of accountability, integrity, and reliability.
Obtaining Copies of GAO Reports and Testimony
The fastest and easiest way to obtain copies of GAO documents at no cost is through our website. Each weekday afternoon, GAO posts on its website newly released reports, testimony, and correspondence. You can also subscribe to GAO’s email updates to receive notification of newly posted products.
Order by Phone
The price of each GAO publication reflects GAO’s actual cost of production and distribution and depends on the number of pages in the publication and whether the publication is printed in color or black and white. Pricing and ordering information is posted on GAO’s website, https://www.gao.gov/ordering.htm.
Place orders by calling (202) 512-6000, toll free (866) 801-7077,
or
TDD (202) 512-2537.
Orders may be paid for using American Express, Discover Card, MasterCard, Visa, check, or money order. Call for additional information.
Connect with GAO
Connect with GAO on X,
LinkedIn, Instagram, and YouTube.
Subscribe to our Email Updates. Listen to our Podcasts.
Visit GAO on the web at https://www.gao.gov.
To Report Fraud, Waste, and Abuse in Federal Programs
Contact FraudNet:
Website: https://www.gao.gov/about/what-gao-does/fraudnet
Automated answering system: (800) 424-5454
Media Relations
Sarah Kaczmarek, Managing Director, Media@gao.gov
Congressional Relations
David A. Powner, Acting Managing Director, CongRel@gao.gov
General Inquiries
[1]GAO, GAO’s High-Risk Program, GAO‑06‑497T (Washington, D.C.: Mar. 15, 2006).
[2]GAO, High-Risk Series: Heightened Attention Could Save Billions More and Improve Government Efficiency and Effectiveness, GAO‑25‑107743 (Washington, D.C.: Feb. 25, 2025).
[3]First Street is a climate risk financial modeling and analytics company that provides property-level data for flooding and other perils. First Street property characteristics data used in this analysis were as of January 2024, and its flood risk data were as of March 2025. We assessed the reliability of FEMA, NAIC, and First Street data by reviewing documentation; interviewing FEMA, NAIC, and First Street officials about the data’s accuracy and limitations and their process for ensuring data reliability; testing the data by identifying missing data, outliers, and any obvious errors; and comparing our results to published data. We determined that these data sources were sufficiently reliable for the purposes of our analyses.
[4]We chose these individuals because of their knowledge of the flood insurance market based on published work, scope of business, and our prior work on flood insurance.
[5]To capture individuals and entities with a recognized point of view, opinion, or position on the topic, we considered those who participated in key flood insurance conferences; conducted or issued research or other written statements on the topic; or testified before Congress on the topic. We included representatives of various stakeholders and interest groups in the final list of participants, including homeowners, lenders, insurers, insurance and real estate agents, researchers, and the federal government.
[6]Pub. L. No. 90-448, tit. XIII, 82 Stat. 476, 572 (1968).
[7]FEMA is also required by law to increase premiums for certain other policies by 25 percent per year until they reach full risk. Such policies include those covering secondary residences, businesses, and severe repetitive loss properties. Severe repetitive loss properties are those with four or more separate NFIP claim payments of more than $5,000 each or two or more separate claim payments for which the total exceeds the value of the property. FEMA is required to increase premiums from generally 5 to 15 percent per year for certain other policies, including those covering properties that were built before flood maps were available for their area.
[8]According to FEMA officials, FEMA floodplain maps generally do not consider flood risk from sources such as pluvial flooding (heavy rainfall), erosion, or coastal tsunamis.
[9]Specifically, the Biggert-Waters Flood Insurance Reform Act of 2012 required the federal regulators, which are agencies that supervise lending institutions that make loans secured by real estate, to issue a rule to direct regulated lenders to accept private-market policies that meet the statutory definition of “private flood insurance” and to notify borrowers of the availability of flood insurance coverage issued by private insurers. Five regulators, including the Board of Governors of the Federal Reserve System, Farm Credit Administration, Federal Deposit Insurance Corporation, National Credit Union Administration, and Office of the Comptroller of the Currency, implemented this requirement effective July 2019. Loans in Areas Having Special Flood Hazards, 84 Fed. Reg. 4953 (Feb. 20, 2019).
[10]Regulators monitoring compliance with the mandatory purchase requirement include the prudential regulators—the Board of Governors of the Federal Reserve System, the Federal Deposit Insurance Corporation, the National Credit Union Administration, and the Office of the Comptroller of the Currency—and the Farm Credit Administration.
[11]Unless noted otherwise, our analysis includes residential and commercial properties and excludes properties without buildings, such as agricultural, vacant, or open spaces.
[12]The First Street data we used did not have full coverage on properties in the five U.S. territories (American Samoa, Guam, the Commonwealth of the Northern Mariana Islands, Puerto Rico, and the U.S. Virgin Islands). As a result, we generally excluded these territories from our analyses unless otherwise noted. As of December 31, 2025, these territories had approximately 12,600 NFIP policies in force (87 percent of which were in Puerto Rico) and 39,000 private policies in force (99.8 percent of which were in Puerto Rico).
[13]According to First Street, some properties are not assigned a flood risk score because they are outside the model, do not have sufficient source data to produce a high-quality model, or are outliers in the model.
[14]A 1 percent annual chance of flooding is equivalent to a 26 percent chance of experiencing a flood during a 30-year mortgage. According to First Street, a flood score of 4 is equivalent to a 26 percent or greater chance of experiencing a flood during a 30-year mortgage.
[15]A 0.2 percent annual chance of flooding is equivalent to about a 6 percent chance of experiencing a flood during a 30-year mortgage. According to First Street, a flood score of 2 is equivalent to a 6 percent or greater chance of experiencing a flood during a 30-year mortgage.
[16]Other private models exist, each with a different methodology for estimating flood risk. We determined that First Street flood risk data were sufficiently reliable for the purposes of analyzing property-level flood risk to examine the extent to which consumers purchase flood insurance and the effectiveness of the mandatory purchase requirement. Our analysis of First Street data indicates that many properties at high risk of flooding do not have flood insurance coverage. Using another model for our analyses would produce different estimates. However, analyses using other models generally concluded that overall flood insurance coverage is low.
[17]Calculations of the percentage of properties with NFIP coverage by flood risk required matching NFIP data to First Street data. We matched 79.2 percent of NFIP contracts to a First Street property record. We accounted for unmatched contracts by dividing the coverage rate by the match rate for SFHA, non-SFHA, and all contracts, as applicable. We have indicated throughout that these are estimates. For more details on our methodology, see app. I.
[18]This analysis includes properties in the 50 states and the District of Columbia.
[19]The eight more hurricane-prone states, from west to east, are Texas, Louisiana, Mississippi, Alabama, Florida, Georgia, South Carolina, and North Carolina.
[20]For this analysis, premium discounts include only discounts for policies that have not reached the full Risk Rating 2.0 premium and Community Rating System discounts.
[21]This analysis includes properties in the 50 states and the District of Columbia.
[22]This analysis estimated the magnitude of the relationship between each characteristic and the likelihood that a property had NFIP coverage. For more details on our methodology, see app. I. For more detailed results, see app. II.
[23]As a residual insurer or insurer of last resort, Florida Citizens Property Insurance Corporation provides homeowners insurance to eligible Florida property owners unable to find insurance coverage in the private market.
[24]We excluded from these counts properties that First Street identifies as not damageable, such as vacant properties and agricultural land. This analysis includes properties in the 50 states and the District of Columbia. As discussed previously, other flood risk models with different methodologies will produce different estimates.
[25]Although FEMA uses a 1 percent annual chance of flooding as the threshold for SFHAs, many properties outside SFHAs are also at risk of flooding. According to First Street data, 2.7 million properties have moderate flood risk (flood score of 2 or 3), equivalent to at least a 0.2 percent annual chance of flooding, but 92 percent of these are located outside an SFHA. About 1 million properties are in an SFHA but have a flood risk below the 1 percent threshold. For these properties, FEMA’s floodplain maps might be overestimating their risk. Additionally, FEMA has not mapped the entire United States, and not all mapped areas have been digitized. Unmapped areas represent those for which digital FEMA maps are unavailable, either because the maps are only on paper or because FEMA has not mapped them.
[26]First Street categorizes properties based on the predominant flood risk type or combination of types. However, properties may also be subject to flood risk from the other risk type or types.
[27]Fannie Mae, Consumer Flood Risk Awareness and Insurance Study (Dec. 2023). This study reports findings from an online survey Fannie Mae conducted from November 15, 2022, to December 12, 2022, among a national panel sample whose addresses were in or near an SFHA. The sample included homeowners, mortgage borrowers, and renters.
[28]See app. III for more information on the communities we visited.
[29]These data are for FEMA’s Individuals and Households Program. This disaster assistance is intended to meet basic needs and supplement disaster recovery efforts but is not intended to return a disaster-damaged property to its predisaster condition. Additionally, homeowners, renters, and business owners can receive disaster loans from the Small Business Administration to cover losses not covered by insurance or funding from FEMA. However, Small Business Administration loans must be repaid, unlike NFIP claim payments. For this analysis, we considered the following event types to be flood-related: coastal storms, dam and levee breaks, floods, hurricanes, severe storms, tidal waves, tropical depressions, tropical storms, tsunamis, and typhoons. Dollar amounts are adjusted for inflation in 2025 dollars. This analysis includes payments to households in the 50 states and the District of Columbia.
[30]Dollar amounts are adjusted for inflation in 2025 dollars. This analysis includes claims for properties in the 50 states and the District of Columbia.
[31]Lynn Conell-Price, Eva Nagypal, and Georgia Ronis von Helms, Mortgage Borrower Flood Risk Experiences and Perceptions, Consumer Financial Protection Bureau Office of Research Working Paper No. 2025-12 (Aug. 20, 2025). This paper reports findings from the 2023 American Survey of Mortgage Borrowers on the flood risk experiences and perceptions of mortgage borrowers who live in or near floodplains. The Federal Housing Finance Agency and the Consumer Financial Protection Bureau sponsored the survey. The survey sample was selected from loans in the National Mortgage Database and seeks to produce nationally representative information about the population of closed-end, first-lien mortgage loans for properties in or near SFHAs.
[32]Fannie Mae, Consumer Flood Risk Awareness. According to Federal Housing Finance Authority officials, Fannie Mae and Freddie Mac require homeowners hazard insurance on all loans, covering fire, windstorm, and hail.
[33]Flood insurance policies cover the replacement cost of the insured property, which may differ from the sales price.
[34]GAO, Flood Insurance: Comprehensive Reform Could Improve Solvency and Enhance Resilience, GAO‑17‑425 (Washington, D.C.: Apr. 27, 2017). The other four policy goals were (1) promoting flood risk resilience, (2) minimizing fiscal exposure to the federal government, (3) requiring transparency of federal fiscal exposure, and (4) minimizing transition and implementation challenges.
[35]GAO, Disaster Resilience Framework: Principles for Analyzing Federal Efforts to Facilitate and Promote Resilience to Natural Disasters, GAO‑20‑100SP (Washington, D.C.: Oct. 2019).
[36]We held three discussion groups with a total of 15 insurance, lending, and real estate association representatives, actuaries, and other industry stakeholders to discuss how the existing proposals addressed the policy goals. We also interviewed additional national and local stakeholders, attended three flood conferences, reviewed available research, and leveraged our data analyses. For a list of discussion session participants and interviewees, see app. IV.
[37]Prior to FEMA’s creation in 1979, the Department of Housing and Urban Development was responsible for administering NFIP.
[38]GAO, FEMA Flood Maps: Better Planning and Analysis Needed to Address Current and Future Flood Hazards, GAO‑22‑104079 (Washington, D.C.: Oct. 25, 2021).
[39]Stakeholders from all levels of government and the private sector may participate in all stages of the mapping process. For example, at the beginning of the process, FEMA relies on local jurisdictions to inform FEMA about changes in a community that could pose new or changed flood hazards, and to work with state, territorial, tribal, or other partners to collect the information needed to create or update flood maps. Later, FEMA and governmental leaders are to meet to review these data and preliminary maps to understand the area’s flood risk and potential effects and to guide local mitigation and outreach efforts. The regulatory process for developing a flood map also provides a 90-day period for local government officials or individuals to review and appeal the scientific or technical accuracy of preliminary maps.
[40]Fannie Mae and Freddie Mac are restricted by law to purchasing single-family mortgages with origination balances below a specific amount known as the “conforming loan limit.” A permanent formula for the annual establishment of the conforming loan limit was established under the Housing and Economic Recovery Act of 2008.
[41]According to FEMA, factors that drive replacement cost include structure size, construction type, materials, labor costs, local building codes, and the extent of damage.
[42]GAO, Flood Insurance: FEMA’s New Rate-Setting Methodology Improves Actuarial Soundness but Highlights Need for Broader Program Reform, GAO‑23‑105977 (Washington, D.C.: July 31, 2023). Mitigation efforts, including elevation and flood proofing, reduce flood risk and can be helpful in making flood insurance premiums more affordable.
[45]GAO, Flood Insurance: FEMA’s New Rate-Setting Methodology Improves Actuarial Soundness but Highlights Need for Broader Program Reform, GAO‑23‑105977 (Washington, D.C.: July 31, 2023); FEMA Flood Maps: Better Planning and Analysis Needed to Address Current and Future Flood Hazards, GAO‑22‑104079 (Washington, D.C.: Oct. 25, 2021); and Flood Insurance: Comprehensive Reform Could Improve Solvency and Enhance Resilience, GAO‑17‑425 (Washington, D.C.: Apr. 27, 2017).
[46]First Street is a climate risk financial modeling, data, and analytics company that provides property-level data for flooding, wildfire, hurricane wind, extreme heat, and poor air quality risk.
[47]Five-decimal coordinates provide a level of accuracy of 1.1 meters.
[48]Four-decimal coordinates provide a level of accuracy of 11.1 meters.
[49]According to First Street, a property with a flood score of 1 is one for which First Street’s model does not predict any flooding, or for which the annual chance of flooding in the current and future scenarios is less than 1 in 500 (or 0.2 percent). First Street does not assign a flood risk type to these properties.
[50]In 2023, Florida enacted legislation requiring all property owners with home insurance policies and wind coverage from the Florida Citizens Property Insurance Corporation, a state-run residual insurer, to purchase flood insurance regardless of whether their property is in an SFHA. This requirement went into effect in January 2024 for properties valued greater than $600,000 and through a sliding scale will ultimately apply to all properties by January 2027.
[51]Fannie Mae, Consumer Flood Risk Awareness and Insurance Study (Dec. 2023); and Lynn Conell-Price, Eva Nagypal, and Georgia Ronis von Helms, Mortgage Borrower Flood Risk Experiences and Perceptions, Consumer Financial Protection Bureau Office of Research Working Paper No. 2025-12 (Aug. 20, 2025).
[52]Premium discounts include discounts for policies that have not reached the full Risk Rating 2.0 premium and Community Rating System discounts.
[53]Other includes American Indian and Alaska Native alone; Native Hawaiian and other Pacific Islander alone; some other race alone; and two or more races.
[54]In addition to the interviewees listed here, we interviewed property owners, insurance agents, local officials, and other stakeholders during our visits to four flood-prone communities. We also interviewed officials from the Federal Emergency Management Agency and the National Association of Insurance Commissioners.