
Report to Congressional Committees
United States Government Accountability Office
A report to congressional committees
For more information, contact: Courtney LaFountain at lafountainc@gao.gov
What GAO Found
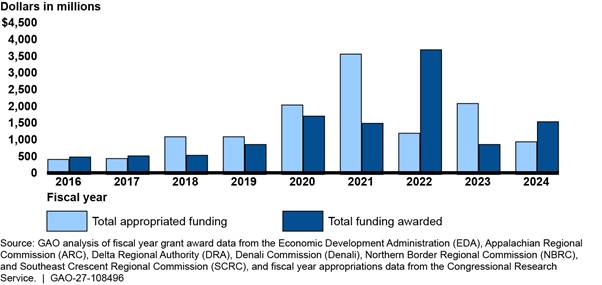
The Economic Development Administration (EDA) and five regional commissions—the Appalachian Regional Commission, Delta Regional Authority, Denali Commission, Northern Border Regional Commission, and Southeast Crescent Regional Commission—awarded more than $12 billion in grants during fiscal years 2016 through 2024 (Southwest Border Regional Commission awarded its first grants in fiscal year 2025). GAO found that economic conditions, such as poverty and unemployment rates, generally improved in regional commission areas, although these changes were difficult to attribute to EDA or regional commission funding. Grantees and local development officials GAO selected for interviews described benefits, including improved infrastructure and expanded job and business opportunities.
Total Dollar Amount of EDA and Regional Commission Grants Awarded and Appropriations, Fiscal Years 2016–2024
EDA and most regional commissions have procedures for collecting grant performance information to assess progress toward goals and communicate results, which are key performance management practices. The Denali Commission has strategic goals but does not have guidance and procedures for collecting standardized, objective, and measurable performance information across its grants, limiting its ability to assess grant and program performance. In addition, EDA has not systematically validated key performance measure data since 2020, limiting the reliability of these data for assessing and reporting results.
EDA does not have a comprehensive framework for coordinating with the regional commissions. Instead, its coordination arrangements vary––from formal agreements and regular communication to little or no project-level coordination. EDA is statutorily required to coordinate activities related to the preparation and implementation of comprehensive economic development strategies with federal entities carrying out federal programs (including regional commissions). Without a coordination framework, EDA has less assurance that data and resources are being effectively leveraged, and that limited funds for economic development are being used efficiently.
Why GAO Did This Study
The Department of Commerce’s EDA provides grants to support economic development in distressed areas and promote growth and job creation. Federal regional commissions are intended to support economic development and infrastructure projects in distressed portions of designated geographic regions.
The Thomas R. Carper Water Resources Development Act of 2024 includes a provision for GAO to review EDA and regional commission programs. This report examines (1) trends in EDA and regional commission grants and economic conditions in the areas they serve, (2) EDA and regional commission performance management practices, and (3) EDA’s coordination with regional commissions.
GAO analyzed EDA and regional commission award data for fiscal years 2016 through 2024 and data from the Bureau of Labor Statistics and Census on economic conditions in regional commission areas. GAO also reviewed agency documentation and procedures related to grant performance. GAO visited projects in Maryland, Vermont, and Louisiana and interviewed agency officials and a nongeneralizable sample of grantees and local stakeholders about grant effects, performance, and coordination between EDA and the regional commissions.
What GAO Recommends
GAO recommends that the Denali Commission establish guidance and procedures for collecting and validating performance information from grantees over time across its grants. GAO also recommends that EDA resume procedures for validating grantee-reported performance data and implement a framework for coordinating with federal regional commissions. Denali and EDA agreed with the recommendations.
|
Abbreviations |
|
|
|
|
|
|
|
ARC |
Appalachian Regional Commission |
|
|
Denali |
Denali Commission |
|
|
DRA |
Delta Regional Authority |
|
|
EDA |
Economic Development Administration |
|
|
HUD |
Department of Housing and Urban Development |
|
|
NBRC |
Northern Border Regional Commission |
|
|
SBRC |
Southwest Border Regional Commission |
|
|
SCRC |
Southeast Crescent Regional Commission |
|
|
USDA |
U.S. Department of Agriculture |
|
This is a work of the U.S. government and is not subject to copyright protection in the United States. The published product may be reproduced and distributed in its entirety without further permission from GAO. However, because this work may contain copyrighted images or other material, permission from the copyright holder may be necessary if you wish to reproduce this material separately.
October 7, 2026
The Honorable Shelley Moore Capito
Chairman
The Honorable Sheldon Whitehouse
Ranking Member
Committee on Environment and Public Works
United States Senate
The Honorable Sam Graves
Chairman
The Honorable Rick Larsen
Ranking Member
Committee on Transportation and Infrastructure
House of Representatives
Federal economic development programs seek to help distressed communities overcome barriers to growth by investing in infrastructure, workforce development, and business creation. The Department of Commerce’s Economic Development Administration (EDA) received $466 million in appropriations in fiscal year 2026 to fund its programs and expenses to support business growth, job creation, and expanded investment in economically distressed areas.[1] Congress reauthorized EDA for fiscal years 2025 through 2029 in the Thomas R. Carper Water Resources Development Act of 2024.
That act also authorized appropriations for federal regional commissions and authorities for fiscal years 2025 through 2029 to support projects aimed at alleviating economic distress in targeted geographic areas. Six regional commissions are currently active: the Appalachian Regional Commission (ARC), Delta Regional Authority (DRA), Denali Commission (Denali), Northern Border Regional Commission (NBRC), Southeast Crescent Regional Commission (SCRC), and Southwest Border Regional Commission (SBRC).[2] We refer to these entities collectively as regional commissions in this report.[3] In fiscal year 2026, these regional commissions each received appropriations ranging from $5.5 million to $400 million.
The act includes a provision for us to review EDA and regional commission economic development programs.[4] This report
1. describes trends in EDA and regional commission awards and economic conditions in areas receiving awards during fiscal years 2016 through 2024, and examines evidence on the effects of selected grants on local economic conditions;
2. examines EDA and regional commission performance management efforts and the extent to which they align with selected leading practices; and
3. examines EDA’s coordination with regional commissions and the extent to which those efforts align with leading practices and statutory requirements.[5]
To describe trends in EDA and regional commission awards, we analyzed data on grants awarded in fiscal years 2016 through 2024.[6] We assessed the reliability of the data by reviewing documentation, interviewing agency officials, and conducting electronic data testing. We determined that the data were sufficiently reliable for the purpose of analyzing the number and dollar value of grants awarded during our review period.
To assess economic conditions in areas that received EDA and regional commission awards, we analyzed data from the Census Bureau and the Bureau of Labor Statistics on unemployment rates, labor force participation, poverty levels, income, and wages by county and state, and by calendar year. We assessed the reliability of the data by reviewing technical documentation and testing the data for errors. We found the data to be sufficiently reliable for describing economic conditions in U.S. counties and nationally over time.
To obtain perspectives on the effects of EDA and regional commission awards on local economic conditions, we selected a nongeneralizable sample of 12 projects in regional commission areas that had received EDA grants, regional commission grants, or both. These projects represented a range of economic development programs and project types. We visited three project sites and interviewed representatives of grant recipients, local development organizations, and other stakeholders associated with all 12 projects.
To assess the procedures EDA and the regional commissions use to document the performance of funded projects, we analyzed data and documentation from each entity, interviewed agency officials, and compared these procedures against selected leading practices and actions for performance management we identified in prior work.[7] We also interviewed selected grant recipients and local development organizations associated with the 12 projects.
To assess coordination between EDA and the regional commissions, we reviewed agreements between them and interviewed agency officials and representatives of selected grant recipients and local development organizations, including from our 12 selected project locations. We compared this information with statutory requirements for EDA coordination and GAO’s leading practices for collaboration.[8] We also assessed fragmentation and overlap among EDA and regional commissions in the geographic areas they serve and the activities they carry out.[9] See appendix I for a detailed description of our objectives, scope, and methodology.
We conducted this performance audit from April 2025 to October 2026 in accordance with generally accepted government auditing standards. Those standards require that we plan and perform the audit to obtain sufficient, appropriate evidence to provide a reasonable basis for our findings and conclusions based on our audit objectives. We believe that the evidence obtained provides a reasonable basis for our findings and conclusions based on our audit objectives.
Background
Economic Development Administration
EDA is a Department of Commerce bureau established in 1965 and reauthorized in 2025 to help state and local stakeholders develop the conditions and infrastructure needed to grow businesses, create jobs, and expand investment, among other things.[10] EDA has offices in Washington, D.C., and six regions. Within these regions, economic development representatives provide technical assistance to potential grantees in each state and U.S. territory. EDA’s programs usually are funded through annual appropriations that remain available until expended, and Congress may sometimes appropriate additional funding through supplemental appropriations bills. In fiscal year 2026, Congress appropriated $466 million to EDA.[11]
EDA provides funding to state and local governments, Tribes, nonprofit organizations, regional economic development organizations (known as economic development districts), public-private partnerships, and institutions of higher education. These programs include grants for revolving loan funds.[12] EDA uses a competitive application process to help ensure projects align with its investment priorities, which include critical infrastructure, workforce, innovation and entrepreneurship, economic recovery resilience, and manufacturing.[13] Projects include construction or repair of basic infrastructure facilities, such as water treatment or wastewater systems; support for workforce training providers; and business development programs. Appendix II provides additional information on EDA programs.
Federal grants for economic development, including EDA grants, generally require recipients to contribute matching funds from nonfederal sources. These cost-sharing requirements may vary by program, determination of special need, or applicant type. Generally, grantees may use funding received from state or local governments or other nonfederal sources to meet the matching requirement. The Thomas R. Carper Water Resources Development Act of 2024 also allowed regional commission funding to be used for the nonfederal match in EDA projects.[14]
Other federal agencies, including the Department of Transportation, Department of Housing and Urban Development (HUD), and U.S. Department of Agriculture (USDA), also administer grant programs to support economic development.
Federal Regional Commissions
Regional commissions support infrastructure development and direct resources toward wealth generation and economic growth in economically distressed portions of specified geographic regions (see fig. 1). They are federally chartered entities that receive congressional appropriations for administration and activities, and their service areas and authorities are described in statute. While their exact service areas have shifted over time, the general areas and services provided have not changed significantly. Appendix II provides additional information on selected commission programs.
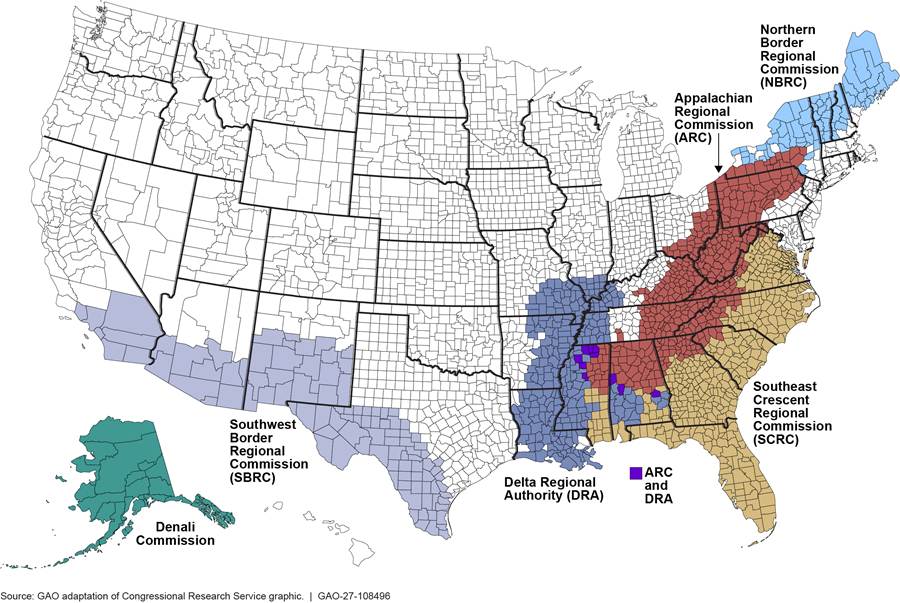
Note: Counties within regional commissions vary over time.
As of March 2026, four additional regional commissions are authorized but
inactive and do not have a confirmed federal cochair, which is required for
them to operate: the Great Lakes Authority, Mid-Atlantic Regional Commission,
Northern Great Plains Regional Authority, and Southern New England Regional
Commission.
The regional commissions are partnerships between the federal government and constituent states. Each regional commission includes an appointed federal representative in its leadership structure, such as a federal cochair and, as applicable, an alternate. The regional commissions, except for Denali, are modeled after ARC, which is composed of a presidentially appointed and Senate-confirmed federal cochair and the member state governors, one of whom is the appointed state cochair (see table 1).[15] Denali’s federal cochair is appointed by the Secretary of Commerce from among lists of nominees submitted to the Secretary by the President pro tempore of the Senate and the Speaker of the House of Representatives.
|
Regional Commission |
States |
Year founded |
Initial fiscal year for appropriated funding |
Initial appropriated funding (dollars in millions) |
Fiscal year 2026 appropriations (dollars in millions) |
|
Appalachian Regional Commission |
Alabama, Georgia, Kentucky, Maryland, Mississippi, New York, North Carolina, Ohio, Pennsylvania, South Carolina, Tennessee, Virginia, and West Virginia |
1965 |
1965 |
$252.4 |
$400.0a |
|
Delta Regional Authority |
Alabama, Arkansas, Illinois, Kentucky, Louisiana, Mississippi, Missouri, and Tennessee |
2000 |
2001 |
$20.0 |
$32.0 |
|
Denali Commission |
Alaska |
1998 |
1999 |
$20.0 |
$18.0 |
|
Northern Border Regional Commission |
Maine, New Hampshire, New York, and Vermont |
2008 |
2010 |
$1.5 |
$42.0 |
|
Southeast Crescent Regional Commission |
Alabama, Florida, Georgia, Mississippi, North Carolina, South Carolina, and Virginia |
2008 |
2010 |
$0.25 |
$20.0 |
|
Southwest Border Regional Commission |
Arizona, California, New Mexico, and Texas |
2008 |
2021 |
$0.25 |
$5.5 |
Source: GAO summary of information from the Congressional Research Service and relevant statutes. | GAO‑27‑108496
aThe Appalachian Regional Commission was appropriated $200 million in FY2026 and had an additional $200 million of advance appropriations provided for fiscal years 2022 through 2026 in the Infrastructure Investment and Jobs Act, Pub. L. No. 117-58, 135 Stat. 429, 1380 (2021), that also become available.
Federal Economic Development Programs and Activities
EDA and regional commissions, like other federal entities that provide economic development grants to eligible beneficiaries, generally organize their grant activities through programs.[16] These programs vary according to statute and agency mission priorities. In prior work, we categorized these activities into the following nine areas:[17]
1. Planning and implementing workforce development strategies, including strategies for job creation and retention
2. Constructing and renovating commercial buildings
3. Establishing business incubators
4. Constructing industrial parks
5. Developing infrastructure by constructing and repairing roads, water and sewer systems, transportation nodes (including ports, rail, and airports), and other critical infrastructure
6. Planning and implementing innovation and entrepreneurship activities, including related infrastructure, business development, and commercialization of new technologies
7. Promoting the development of new markets for existing products
8. Developing telecommunications and broadband infrastructure and enabling technology transfer
9. Developing and improving areas for tourism
Program Performance Management
As we have previously reported, federal decision–makers need evidence about whether federal programs and activities are achieving intended results.[18] Performance management helps an organization define what it is trying to achieve, determine how well it is performing, and identify what it could do to improve results. The Government Performance and Results Act of 1993 established a framework of program performance reform through which federal agencies can improve program effectiveness and accountability, service delivery, congressional decision-making, and internal management of the federal government.[19] Our prior work has defined organizational performance management as a three-step process that includes
1. setting goals to identify the results an organization seeks to achieve,
2. collecting performance information (a type of evidence) to measure progress, and
3. using that information to assess results and inform decisions to ensure progress towards achieving those goals.[20]
This prior work also identified key practices and actions for implementing these steps. For example, organizations should establish both long-term outcomes, known as strategic goals or objectives, and near-term performance goals to assess results. Performance goals are target levels of performance to be accomplished within a specified time frame and are generally expressed as tangible measurable objectives, or as quantitative standards, values, or rates. Performance information includes quantitative or qualitative data used to track progress toward these goals. To collect performance information, organizations should establish evidence-building plans and ensure that evidence will meet quality standards. Finally, organizations can use performance information through key actions such as assessing progress toward goals and communicating performance information internally and externally.
Awards Increased and Economic Conditions Improved, but Effects of Individual Grants Are Difficult to Measure
EDA and Regional Commission Awards Increased from Fiscal Years 2016–2024
EDA and five regional commissions awarded more than $12 billion in grants for infrastructure, planning, and workforce training projects during fiscal years 2016 through 2024.[21] The number, total dollar amount, and median dollar amount of grants awarded generally increased over this period.
Number of awards. The total number of grants EDA and regional commissions awarded increased from 1,253 in fiscal year 2016 to 1,434 in fiscal year 2024, peaking during fiscal years 2020 through 2022, which corresponds with supplemental funding EDA received in fiscal years 2020 and 2021 in response to the COVID-19 pandemic (see table 2). EDA and ARC awarded the majority of grants each year. Among the regional commissions, Denali had the largest percent increase, growing by more than 300 percent from fiscal year 2016 through fiscal year 2024. See appendix III for additional information on the number of awards by county.
|
Fiscal year |
EDA |
ARCa |
DRA |
Denali |
NBRC |
SCRCb |
Total |
|
2016 |
644 |
441 |
107 |
19 |
42 |
–– |
1,253 |
|
2017 |
575 |
562 |
93 |
27 |
36 |
–– |
1,293 |
|
2018 |
417 |
495 |
85 |
26 |
43 |
–– |
1,066 |
|
2019 |
581 |
443 |
100 |
22 |
65 |
–– |
1,211 |
|
2020 |
1,324c |
437 |
100 |
42 |
56 |
–– |
1,959 |
|
2021 |
995c |
430 |
84 |
38 |
60 |
–– |
1,607 |
|
2022 |
1,172c |
533 |
106 |
48 |
60 |
–– |
1,919 |
|
2023 |
482 |
677 |
150 |
97 |
87 |
–– |
1,493 |
|
2024 |
569 |
524 |
121 |
81 |
84 |
55 |
1,434 |
|
Total |
6,759 |
4,542 |
946 |
400 |
533 |
55 |
13,235 |
–– = not applicable
Source: GAO analysis of fiscal year grant award data from the Economic Development Administration (EDA), Appalachian Regional Commission (ARC), Delta Regional Authority (DRA), Denali Commission (Denali), Northern Border Regional Commission (NBRC), and Southeast Crescent Regional Commission (SCRC). | GAO-27-108496
Note: Grants awarded may include grants that were partially or fully rescinded, terminated, or deobligated.
aExcludes 130 awards that ARC did not fund but supported in partnership with other agencies from fiscal years 2016 through 2024.
bNo data are available for fiscal years 2016 through 2023 because SCRC did not award grants before fiscal year 2024.
cEntity received supplemental appropriations through the CARES Act and the American Rescue Plan Act.
Total amount awarded. The total nominal value of grants that EDA and regional commissions awarded generally increased from fiscal year 2016 through fiscal year 2024, peaking in fiscal year 2022 because of supplemental funding provided to EDA in fiscal years 2020 and 2021 in response to the COVID-19 pandemic.[22] The award funding generally reflects changes in appropriations (see fig. 2). Awards totaled about $500 million in fiscal year 2016, increased to nearly $1.6 billion in fiscal year 2024, and peaked at nearly $4 billion in fiscal year 2022, according to available data.[23]
Figure 2: Total Dollar Amount of EDA and Regional Commission Grants Awarded and Appropriations, Fiscal Years 2016–2024
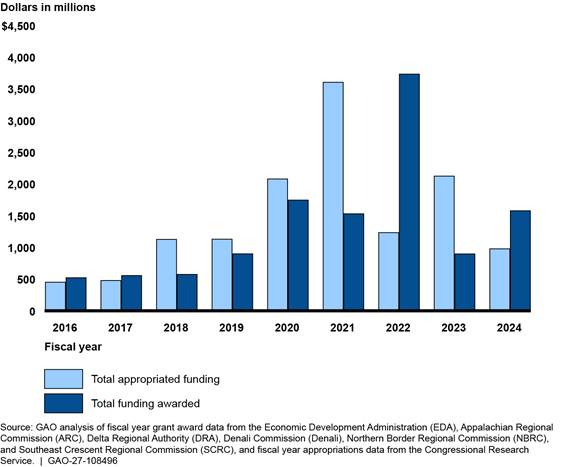
Notes: Grants awarded may include grants that were partially or fully rescinded, terminated, or deobligated. Appropriations data may include supplemental funding. Data are not adjusted for inflation. Trends in inflation-adjusted amounts were similar.
While the total value of grants awarded generally increased across all entities from fiscal year 2016 through fiscal year 2024, EDA accounted for most of the money awarded (see table 3). In contrast to EDA’s awards, which peaked in fiscal years 2020 through 2022 as noted previously, regional commission awards were higher in fiscal year 2024 than fiscal year 2016. In percentage terms, NBRC increased the amount of grants awarded the most, increasing by more than 700 percent from fiscal year 2016 through fiscal year 2024. See appendix III for additional information on the amount of awards by county.
|
Dollars in millions |
|||||||
|
Fiscal year |
EDA |
ARC |
DRA |
Denali |
NBRC |
SCRCa |
Total |
|
2016 |
$362 |
$110 |
$26 |
$16 |
$7 |
–– |
$521 |
|
2017 |
$325 |
$149 |
$22 |
$51 |
$9 |
–– |
$556 |
|
2018 |
$406 |
$119 |
$22 |
$16 |
$11 |
–– |
$574 |
|
2019 |
$662 |
$169 |
$23 |
$20 |
$24 |
–– |
$898 |
|
2020 |
$1,516b |
$154 |
$28 |
$22 |
$25 |
–– |
$1,745 |
|
2021 |
$1,303b |
$152 |
$28 |
$14 |
$32 |
–– |
$1,529 |
|
2022 |
$3,406 b |
$223 |
$51 |
$20 |
$31 |
–– |
$3,731 |
|
2023 |
$409 |
$316 |
$64 |
$52 |
$55 |
–– |
$896 |
|
2024 |
$1,052 |
$329 |
$68 |
$48 |
$61 |
$19 |
$1,577 |
|
Total |
$9,441 |
$1,721 |
$332 |
$259 |
$255 |
$19 |
$12,027 |
–– = not applicable
Source: GAO analysis of fiscal year grant award data from the Economic Development Administration (EDA), Appalachian Regional Commission (ARC), Delta Regional Authority (DRA), Denali Commission (Denali), Northern Border Regional Commission (NBRC), and Southeast Crescent Regional Commission (SCRC). | GAO-27-108496
Notes: Grants awarded may include grants that were partially or fully rescinded, terminated, or deobligated. Grant amounts are not adjusted for inflation.
aNo data are available for fiscal years 2016 through 2023 because SCRC did not award grants before fiscal year 2024.
bEntity received supplemental appropriations through the CARES Act and the American Rescue Plan Act.
Individual award amounts. From fiscal year 2016 through fiscal year 2024, individual award amounts generally increased for EDA and three regional commissions—ARC, DRA, and NBRC (see table 4). For example, EDA’s median nominal award increased from approximately $210,000 in fiscal year 2016 to $500,000 in fiscal year 2024. When adjusted for inflation, the 2016 median was approximately $267,000 in 2024 dollars, meaning the 2024 nominal median was still nearly twice as large. In contrast, median Denali award amounts decreased from 2016 through 2024 (SCRC awarded its first grants in fiscal year 2024).
Table 4: Median Nominal Amount of EDA and Regional Commission Grants Awarded, Fiscal Years 2016 and 2024
|
Fiscal year |
EDA |
ARC |
DRA |
Denali |
NBRC |
SCRCa |
|
2016 |
$210,000 |
$103,000 |
$155,500 |
$458,276 |
$188,332 |
–– |
|
2024 |
$500,000 |
$300,000 |
$450,000 |
$305,000 |
$500,000 |
$350,000 |
–– = not applicable
Source: GAO analysis of fiscal year grant award data from the Economic Development Administration (EDA), Appalachian Regional Commission (ARC), Delta Regional Authority (DRA), Denali Commission (Denali), Northern Border Regional Commission (NBRC), and Southeast Crescent Regional Commission (SCRC). | GAO-27-108496
Notes: Grants awarded may include grants that were partially or fully rescinded, terminated, or deobligated. Grant amounts are not adjusted for inflation. When adjusting for inflation, median award amounts in fiscal year 2016 were still smaller than the 2024 median amounts.
aNo data are available for fiscal years 2016 because SCRC did not award grants before fiscal year 2024.
Awards for infrastructure projects were generally larger than awards for noninfrastructure awards. In fiscal year 2024, NBRC’s median infrastructure award was $1 million, compared with $475,000 for its median noninfrastructure projects. Similarly, ARC’s median infrastructure award was $700,000, compared with $140,000 for noninfrastructure projects.
Economic Outcomes Generally Improved, but Effects of Individual Grants Are Difficult to Measure
Most regional commission areas experienced improvement in most economic indicators from calendar year 2016 through calendar year 2024, including SCRC (though SCRC awarded its first grants in fiscal year 2024). To understand economic conditions in regional commission areas during our review period, we analyzed selected federal economic indicators for the five regional commission areas that awarded grants during fiscal years 2016 through 2024. These indicators included data on unemployment and labor force participation, poverty, wages, and the number of business establishments, such as factories, stores, and offices.[24] We analyzed these data by regional commission service area and compared changes in regional commission areas with changes in counties outside regional commission areas and nationwide trends.[25]
Improvements in regional commission areas were similar to those in counties outside regional commission areas and to nationwide trends. For example, consistent with national trends, estimated annual poverty rates decreased in calendar year 2024 compared with calendar year 2016 in all areas except Denali. However, Denali’s poverty rate remained lower than those of nonregional commission areas, a difference that was statistically significant to the 90-percent confidence level (see fig. 3).
Figure 3: Estimated Annual Poverty Rates in Regional Commission Areas, Nonregional Commission Areas, and Nationally, Calendar Years 2016 and 2024
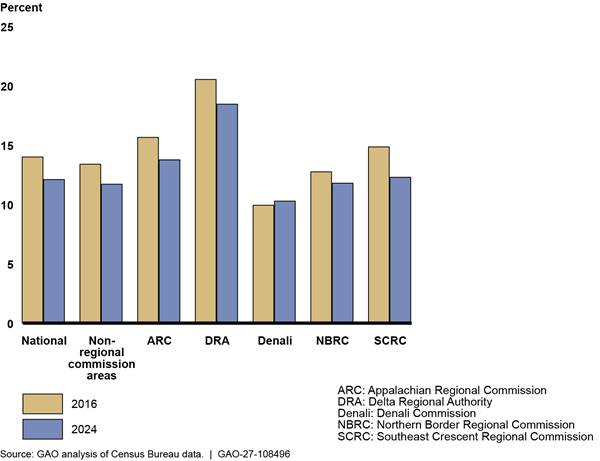
Notes: We estimated poverty rates for each area by dividing the total estimated number of people in poverty in all counties and county equivalents in each area by the estimated total number of people for whom poverty status could be determined in all counties and county equivalents in each area. The estimates for poverty rates in this figure have margins of error at the 90-percent confidence level within 0.60 percentage points. Differences in estimated annual poverty rates in 2024 compared with 2016 are statistically significant for all areas except Denali. SCRC awarded its first grants in fiscal year 2024. See app. IV for more information on our analysis.
Additionally, estimated unemployment rates decreased in all regional commission areas and in areas outside regional commissions, according to available data for 2012–2016 and 2020–2024 (see fig. 4). See appendix IV for additional information on our analysis.
Figure 4: Five-Year Estimated Unemployment Rates in Regional Commission Areas, Nonregional Commission Areas, and Nationally, Calendar Years 2012–2016 and 2020–2024
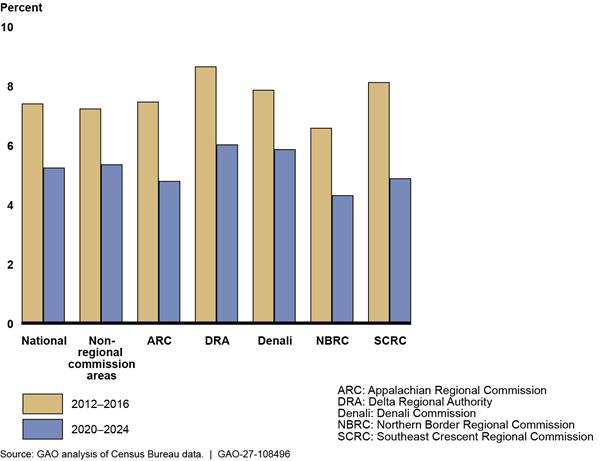
Notes: We estimated unemployment rates for each area by dividing the total estimated number of unemployed people in all counties and county equivalents in each area by the total estimated number of people in the labor force in all counties and county equivalents in each area. The estimates for unemployment rate in this figure have margins of error at the 90-percent confidence level within 0.32 percentage points. All changes in unemployment rate estimates from the 2012–2016 sample to the 2020–2024 sample were statistically significant at the 90-percent level. SCRC awarded its first grants in fiscal year 2024. See app. IV for more information on our analysis.
In line with national trends, labor force participation rates generally changed modestly between the 2016 and 2024 samples. Specifically, labor force participation increased modestly in two regional commission areas (ARC and SCRC) and decreased in three regional commission areas (DRA, Denali, NBRC). Additionally, total establishments and total annual wages also increased nationally and in all regional commission areas from 2016 through 2024. See appendix IV for more details.
Although economic conditions generally improved in regional commission areas from 2016 through 2024, multiple factors likely contributed to those improvements. These factors include the effects of EDA or regional commission funded projects, national trends, and other funding sources. Subject-matter experts, agency officials, grantees, and literature we reviewed also identified challenges in linking individual economic development projects to changes in local economic conditions.
National economic trends. Population changes, technological advancements, and broader economic shifts may affect local economic conditions. For example, the population in SCRC areas increased by nearly 10 percent from 2016 through 2024, while the population in DRA areas decreased by more than 2 percent. Such changes could affect job and business opportunities or other economic conditions.
Multiple sources of funding. As noted earlier, economic development projects may use multiple local, state, and federal funding sources. For example, other agencies, including the Department of Transportation, HUD, and USDA, obligated $32.9 billion for economic development grant programs in fiscal year 2024, compared with the $270 million EDA obligated.[26] In addition, according to available EDA and regional commission data, grantees reported receiving approximately $7.6 billion from other funding sources during fiscal years 2016 through 2024.[27] As a result, it is difficult to isolate the effects of EDA and regional commission grants from those of other funding sources supporting the same areas.
Small funding amounts. Stakeholders and subject-matter experts we interviewed stated that the small size and wide geographic spread of EDA and regional commission awards make the effects of individual awards on economic conditions difficult to measure. In addition, most economic data are aggregated and reported at the county, state, or national level. Thus, even a relatively large infrastructure project may not produce effects measurable at the county level.
Indirect effects. Stakeholders, agency officials, and subject-matter experts told us that infrastructure projects can provide a wide range of community benefits, but certain effects are difficult to identify or quantify because they are indirect. For example, according to one grantee, upgrading a community sewer system may not directly create jobs but is a basic prerequisite for economic development and prevents residents relocating.
Long time horizons. Stakeholders and agency officials told us that the effects of infrastructure projects may not generate measurable effects for many years, or even decades. For example, EDA regional office staff stated that one EDA-funded industrial park developed over 35 years into the economic engine for the surrounding town, which expanded around it.
Proprietary data. Grantees reported difficulty obtaining investment data and documentation because local businesses, who may be reluctant to share business-sensitive information. We discuss challenges related to collecting performance information later in the report.
Grantees Described Positive Effects of Economic Development Projects in Their Communities
According to grantees and other stakeholders we interviewed, EDA and regional commission grants have had positive effects on communities, including improved access to basic infrastructure, support for business and job creation, and increased capacity to pursue additional economic development activities. We interviewed grantees and representatives from local development organizations in each of the 12 project locations we selected for review.[28] Grantees’ and stakeholders’ views are not generalizable but provide perspectives on potential benefits and the rationale underlying those perspectives. Stakeholders in 10 of these locations said grants enabled projects that otherwise would not have occurred. According to stakeholders and experts, state and local funding sources (such as tax revenue) were insufficient to maintain or build infrastructure or fund other needed economic development projects. Grantees and stakeholders in the 12 locations described the following benefits:
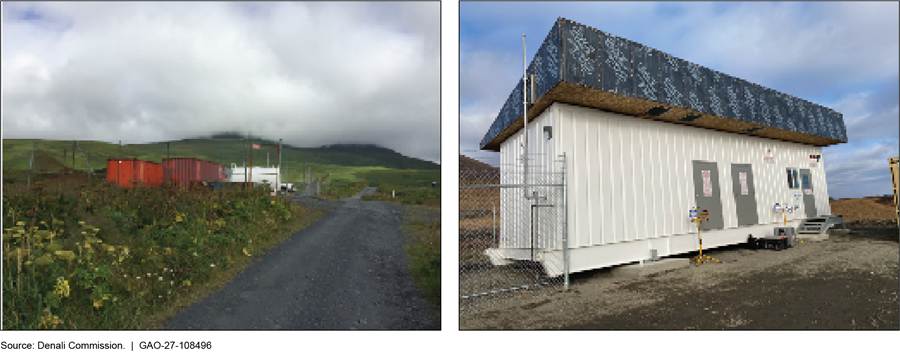
Improving access to basic infrastructure services. According to stakeholders in seven project locations, grants funded projects that improved basic public infrastructure in their distressed rural communities. For example, a grantee that received Denali funding to upgrade a power plant in remote Alaska that serves an Alaska Native Village, among others, stated that the project improved the community’s access to reliable power (see fig. 5).[29] Another grantee said a DRA-funded residential sewer system upgrade ended frequent sewage backups in residents’ homes and yards.
Sustaining or creating businesses and attracting private investment. According to stakeholders in eight project locations, grants funded projects that created or sustained businesses in their communities. For example, ARC and EDA jointly funded a wastewater treatment plant project for an industrial park district that enabled several businesses to keep operating, including a restaurant, convenience store, and automotive shop, according to grantees (see fig. 6). The project also enabled several new businesses to locate in the area, including a manufacturing firm and a retail delivery facility.
Figure 6: Wastewater Treatment Plant Serving an Industrial Park That the Appalachian Regional Commission and Economic Development Administration Jointly Funded
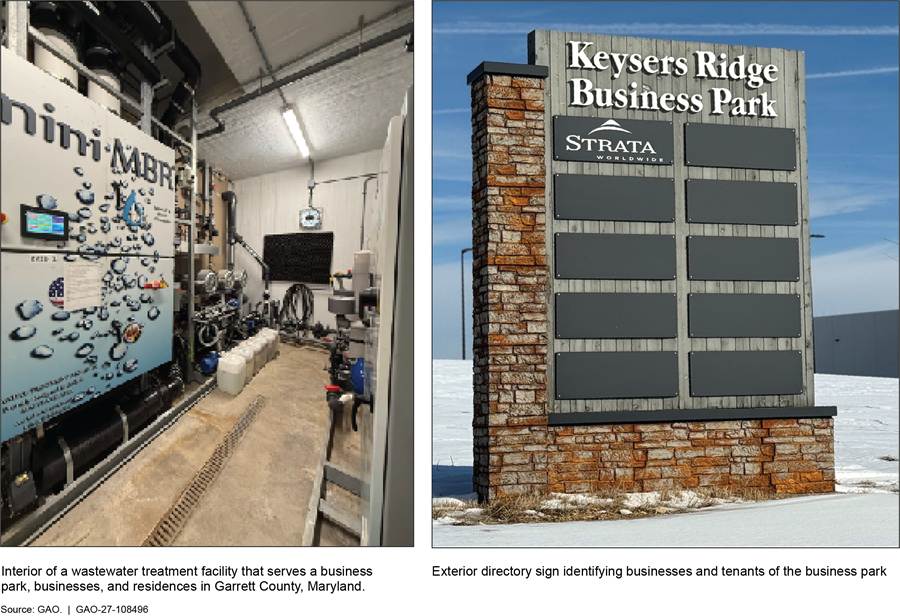
Creating or retaining jobs. According to grantees in seven project locations, grants funded projects that created or retained jobs in their communities. For example, one grantee estimated that a project that ARC and EDA jointly funded enabled a delivery company to move into a business park, bringing 40 new jobs to the area, with plans to hire about 50 more employees. In addition, a DRA-funded utilities extension enabled a graphite processing facility to move to the area and provide 25 new jobs, according to local development officials.[30] Another grantee told us that a multipurpose recreational trail attracted new businesses, such as a brewery and restaurants, which led to additional employment opportunities for residents.
Developing workforce skills. Three grantees told us that grants for vocational education or workforce training centers provided training opportunities and certifications that helped residents obtain necessary skills and higher-paying jobs. One grantee reported that a DRA-funded workforce training center served 255 individuals across six counties, providing certifications needed by employers and internship opportunities at local businesses. Another said NBRC funds supported professional development and digital inclusion training for 10,000 adult learners, improving participants’ employability. Additionally, an economic development district in Alaska used Denali funds to design a website connecting residents to local jobs, training resources, and scholarships. Grantees said the website especially benefited high school students seeking well-paying jobs.
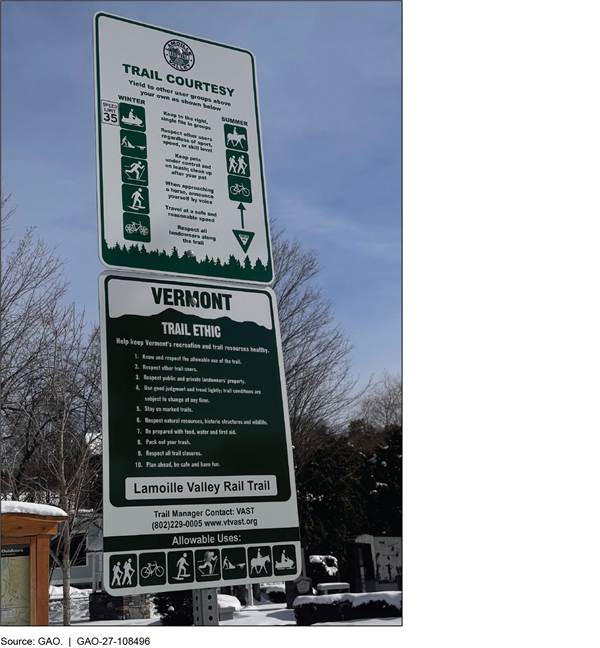
Improving community services. Stakeholders also described projects that improved leisure, health care, or wellness services. For example, NBRC funded the conversion of a defunct railroad corridor in Vermont into a four-season recreational trail (see fig. 7). According to the grantee, the trail attracted businesses and provided space for physical education classes, physical therapy, and safer commuting.
Improving local capacity to manage economic development projects. Stakeholders for five projects reported that grants helped rural communities apply for and manage economic development projects. For example, one grantee representing an EDA University Center stated that the center assists low-capacity communities develop the economic development plans required to receive EDA funding.
Selected Studies Found Some Positive Effects of Economic Development Projects
Our review of 18 independent studies found limited research quantifying the effects of EDA and regional commission projects on economic outcomes. However, some studies identified potential positive effects on income, employment, and other local economic conditions:[31]
· A 2021 study examined DRA’s effects on employment, income, migration, and poverty using data from 1997 to 2016.[32] The study found that DRA counties were associated with income gains and decreases in unemployment, but not with differences in poverty or migration. Specifically, this study estimated that annual median household income increased by about $1,000 for DRA counties.
· A 1995 evaluation of ARC programs in 391 counties found that Appalachia grew faster than its control group in income, earnings, and population.[33] Using data from 1965 to 1991, the study found that income and earnings grew 48 percentage points faster, population grew 5 percentage points faster, and per capita income grew 17 percentage points faster in Appalachian counties than in the control group. However, the study could not attribute these outcomes to ARC programs with certainty.
· A 2019 study used counterfactual analysis to quantify the effects of the ARC-funded Appalachian Development Highway System.[34] Using digitized maps of the highway network and county-level data from 1960, 1985, and 2010, this study estimated that the highway system was associated with reduced trade costs and aggregate gains of about $54 billion, or about 0.4 percent of national income. The study also found that the region’s share of national income would have been 11 percent lower without the highway system.
Most Entities Follow Key Performance Management Practices, but EDA and Denali Have Gaps
Most regional commissions have generally implemented key performance management practices, but EDA and Denali have not fully done so. EDA has implemented most key practices for performance management but does not regularly validate certain grantee-reported performance measures. Denali has not established standardized performance goals and measures across its grants, systematically collected or validated performance data to assess progress toward goals, or included comprehensive details in public reports to demonstrate grant projects’ performance.
EDA and Most Regional Commissions Generally Follow Key Performance Management Practices
We found that EDA and five of the six regional commissions generally implemented the selected key performance management practices. We assessed each entity against practices associated with three performance management steps: setting goals, collecting performance information, and using that information to assess results and inform decisions.[35] Table 5 summarizes the extent to which each entity implemented these practices. As we have previously reported, federal decision-makers need evidence about whether federal programs and activities are achieving intended results.[36] However, as we note in this report, isolating the economic effects of EDA and regional commission funds using regional-level economic data is methodologically difficult. By following key performance management practices, EDA and the regional commissions can assess progress toward their strategic goals and missions.[37]
Table 5: Extent to Which EDA and Regional Commissions Implemented Selected Key Performance Management Practices
|
Performance management step |
Key practices and actions |
EDA |
ARC |
Denali |
DRA |
NBRC |
SBRC |
SCRC |
|
Set goals to identify the results the organization seeks to achieve |
Identify both long-term outcomes (strategic goals) and near-term measurable results (performance goals) |
● |
● |
◑ |
● |
● |
● |
● |
|
Collect performance information to measure progress |
Develop an evidence-building implementation plan Ensure new evidence will meet quality standards |
◑ |
● |
◑ |
● |
● |
● |
● |
|
Use information to assess results and inform decisions to ensure further progress toward achieving goals |
Assess progress toward goals Communicate information internally and externally |
● |
● |
◑ |
● |
● |
● |
● |
● = Generally implemented ◑ = Partially implemented ○ = Not implemented
Source: GAO analysis of information from the Economic Development Administration (EDA), Appalachian Regional Commission (ARC), Delta Regional Authority (DRA), Denali Commission (Denali), Northern Border Regional Commission (NBRC), Southwest Border Regional Commission (SBRC), and Southeast Crescent Regional Commission (SCRC), and GAO‑23‑105460. | GAO-27-108496
Note: We assessed each entity’s documented practices against the selected key practices and actions and rated each performance measurement step as generally, partially, or not implemented.
Setting Goals
EDA and all six regional commissions we reviewed have established long-term strategic goals and objectives for their programs. EDA and five regional commissions also set standardized near-term performance goals and measures for individual grant projects.
Strategic goals. EDA and the regional commissions have common long-term strategic goals and objectives generally related to economic development and quality of life (see table 6). The goals address areas such as public infrastructure, workforce development, and capacity building for local governments and institutions. Regional commissions also have goals related to improving the quality of life in economically distressed areas, such as access to affordable health care and housing, environmental protection and conservation, and support for regional culture and tourism. Regional commissions generally describe these goals in their strategic plans.[38]
|
Strategic goal or objective |
EDA |
ARC |
Denali |
DRA |
NBRC |
SCRC |
SBRC |
|
Broadband |
X |
X |
X |
X |
X |
X |
X |
|
Infrastructure |
X |
X |
X |
X |
X |
X |
X |
|
Transportation |
X |
X |
X |
X |
X |
X |
X |
|
Workforce development |
X |
X |
X |
X |
X |
X |
X |
|
Business development |
X |
X |
— |
X |
X |
X |
X |
|
Capacity building |
X |
X |
X |
X |
X |
X |
X |
|
Energy and utilities |
— |
X |
X |
X |
X |
— |
X |
|
Environmental protection and conservation |
— |
— |
X |
X |
X |
X |
X |
|
Health care services |
— |
X |
X |
X |
X |
X |
– |
|
Housing access and affordability |
— |
X |
X |
X |
X |
X |
X |
|
Regional culture and tourism |
— |
X |
— |
X |
X |
X |
X |
|
Economic competitiveness |
X |
— |
— |
X |
— |
X |
X |
|
Childcare services |
— |
X |
— |
— |
X |
X |
— |
|
Fuel storage and affordability |
— |
— |
X |
— |
— |
— |
— |
X = Strategic goal or objective included in entity documentation.
— = Strategic goal or objective not in entity documentation.
Source: GAO analysis of documentation from the Economic Development Administration (EDA), Appalachian Regional Commission (ARC), Delta Regional Authority (DRA), Denali Commission (Denali), Northern Border Regional Commission (NBRC), Southwest Border Regional Commission (SBRC), and Southeast Crescent Regional Commission (SCRC). | GAO-27-108496
Note: The selected strategic goals and objectives are not comprehensive, and some categories may overlap.
Performance goals and measures. EDA and most regional commissions establish standardized, quantifiable performance measures for assessing progress toward performance goals. Grantees select from lists of these measures to establish expected performance outcomes for individual grant projects (see table 7).[39] These measures include jobs and businesses created or retained, workers trained, private investment leveraged, and individuals, households, businesses, or communities benefiting from a project.[40] Most regional commissions also use project-specific measures, such as fuel storage, energy capacity, patients served, or land and facilities improved.
EDA and the regional commissions also collect qualitative descriptions of expected project outcomes and progress. Officials and stakeholders told us this information is important because some project benefits—such as those involving infrastructure, public services, or capacity building efforts—may be difficult to quantify or may not occur until years after the performance reporting period ends. For example, basic infrastructure grants can indirectly provide essential services to communities or businesses and may not immediately create jobs, but they enable businesses to invest in an area in the future.
Table 7: Performance Information That Selected Grantees Reported and EDA and Regional Commissions Used
|
|
EDA |
ARC |
Denali |
DRA |
NBRC |
SBRC |
SCRC |
|
Quantitative performance measures |
|
|
|
|
|
|
|
|
Jobs created and retained |
X |
X |
— |
X |
X |
X |
X |
|
Workers trained |
X |
X |
— |
X |
X |
— |
X |
|
Private investment leveraged |
X |
X |
— |
X |
X |
X |
X |
|
Individuals or households benefiting from project |
— |
X |
— |
X |
X |
X |
X |
|
Businesses, households, or communities with access to improved infrastructure |
X |
X |
— |
X |
X |
X |
X |
|
Areas, facilities, or buildings developed or improved |
— |
X |
— |
— |
X |
X |
— |
|
Businesses supported |
X |
X |
— |
— |
X |
X |
X |
|
Communities with enhanced capacity |
X |
X |
— |
— |
— |
— |
X |
|
New customer or business relationships developed (noninfrastructure) |
X |
— |
— |
— |
— |
— |
X |
|
New technologies marketed (noninfrastructure) |
X |
— |
— |
— |
— |
— |
— |
|
Additional project-specific measures |
X |
X |
X |
— |
X |
X |
X |
|
Qualitative performance information |
|||||||
|
Description of project’s intended goals |
X |
X |
X |
X |
X |
X |
X |
|
Project progress and results |
X |
X |
X |
X |
X |
X |
X |
X = Performance information reported and used.
— = Performance information not reported or not used.
Source: GAO analysis of documentation from the Economic Development Administration (EDA) and the Appalachian Regional Commission (ARC), Delta Regional Authority (DRA), Denali Commission (Denali), Northern Border Regional Commission (NBRC), Southwest Border Regional Commission (SBRC), and Southeast Crescent Regional Commission (SCRC). | GAO-27-108496
Collecting Performance Information
EDA and five of the six regional commissions have standardized procedures for collecting objective, measurable performance information from grantees to assess progress toward estimated performance goals.[41] Grantees are generally required to report on both quantitative measures—such as jobs created or households served—and qualitative descriptions of project outcomes. EDA collects data on their performance measures at 3, 6, and 9 years after infrastructure grants are awarded and annually for 5 years after capacity-building and other noninfrastructure grants are awarded. Five regional commissions collect performance measures during grant implementation and at project completion. ARC and SCRC require performance reporting for up to 3 and 5 years after project completion, respectively. Officials from EDA and all regional commissions stated that during the grant performance period, they collect quarterly or annual reports to monitor project information including implementation, expenditures, or progress toward completion and that they communicate with grantees to fully understand the performance of grant projects.
Five regional commissions—ARC, DRA, NBRC, SBRC, and SCRC—also have procedures for validating grantee-reported performance measure data to ensure the quality of information they use to assess progress towards estimated performance goals. These procedures can include reviewing samples of grantees’ documentation and providing guidance or assistance on validating reported data (see table 8).[42]
Table 8: EDA and Regional Commission Procedures for Ensuring Quality of Grantee-Reported Performance Measures
|
Entity |
Validation of grantee-reported performance measures |
Grantee guidance and requirements |
|
EDA |
· Site visits or desk reviews to verify project completion · Has not validated performance measure data since 2020 |
· Requires retention of supporting documentation |
|
ARC |
· Surveys of sampled completed grants · Office of Inspector General audits |
· Requires supporting documentation for certain performance measures |
|
Denali |
· Site visits or desk reviews to verify project completion |
· Requires retention of supporting documentation |
|
DRA |
· Site visits or desk reviews of performance measures |
· Guidance on measuring and verifying certain quantitative metrics · Training for local development districts and grantees |
|
NBRC |
· Site visits or desk reviews of performance measures |
· Guidance on measuring and verifying certain quantitative metrics · Requires retention of supporting documentation · Training for local development districts and grantees |
|
SBRC |
· Has not begun validation reviews because no grants have concluded |
· Training for grantees on performance measurement |
|
SCRC |
· Has not begun validation reviews because no grants have concluded |
· Guidance on retaining supporting documentation · Technical assistance · Verification of data local development districts reported |
Source: GAO analysis of information from the Economic Development Administration (EDA), Appalachian Regional Commission (ARC), Delta Regional Authority (DRA), Denali Commission (Denali), Northern Border Regional Commission (NBRC), Southwest Border Regional Commission (SBRC), and Southeast Crescent Regional Commission (SCRC). | GAO-27-108496
Note: Local development districts are organizations that regional commissions may designate to help coordinate projects within their jurisdictions.
Ensuring that performance information meets quality standards is a key performance management action and is particularly important because some grantees face challenges collecting reliable data. Representatives of regional commissions, local development organizations, and grantees told us that limited resources and technical capacity, staff turnover, or difficulty obtaining information from private businesses can affect grantees’ ability to collect and report data on performance measures such as jobs created or retained. Officials from ARC, DRA, and two local development organizations said that grantees with limited capacity may require training or assistance to understand how to collect and report performance information.
Using Performance Information to Assess Goals and Communicate Progress
EDA and all six of the regional commissions use grantee-reported performance information to monitor project progress and inform program management. EDA and five regional commissions also communicate details on grant projects and expected outcomes through public reports.
Assessing progress. EDA and the regional commissions use grantees’ reported performance information for purposes including monitoring project completion and progress toward goals, identifying implementation challenges, informing future grant decisions, or strategic planning.[43] EDA officials told us that they use performance measures to estimate and assess projects’ performance outcomes and they aggregate the data to report performance across programs, but do not treat the measures as strict requirements. EDA, ARC, Denali, and DRA representatives said staff may contact grantees when reported results differ from expected outcomes to understand the reasons and, when needed, take corrective action.
Communicating results. EDA, ARC, DRA, NBRC, and SCRC publicly report quantitative performance measures and qualitative descriptions of selected grant projects.[44] Some also report results from completed projects or conduct evaluations of selected programs. For example:
· ARC reports expected outcomes for new awards, results from a sample of completed grants, and progress toward 5-year performance goals, such as number of jobs created or retained, among other grant project information.[45] ARC has also contracted with external consultants to conduct annual evaluation and research on selected types of grants, programs, operations, and regional economic issues.[46]
· DRA annual reports include expected project outcomes based on grant application data. In 2021, DRA published a study assessing the challenges, goals, and outcomes of its workforce development grant programs.[47] DRA representatives told us that limitations in its current grants management systems have constrained analysis of completed projects’ performance information, but DRA plans to procure and implement a new system by spring 2027 to enhance its ability to evaluate and monitor performance measures over time.
· NBRC annual reports include information such as descriptions and outcomes of selected grant projects and descriptions of counties’ economic distress levels. NBRC also provides annual lists of grant projects awarded in each state and their expected outcomes. Officials told us they implemented a new grants management system in 2024 to track an updated and expanded set of key performance measures, which will result in new grantee metrics by 2027.
EDA Does Not Validate Key Grantee-Reported Performance Measure Data
EDA does not currently validate the performance measure data it collects from grantees to assess progress toward goals such as job creation or private investment leveraged. Examples of data validation include requesting supporting documentation or reviewing grantee records. EDA officials said the agency reviews and validates project compliance and implementation through progress reports and site visits during the implementation phase. EDA guidance requires grantees to retain supporting performance documentation for at least 3 years.[48] However, EDA officials said that grantee-submitted data may have limitations, such as overstated project outcomes.
EDA previously conducted random annual site visits to validate performance measures of completed infrastructure projects but stopped in 2020 because of staffing and resource constraints. EDA staff now conduct informal reviews of these performance measures when they identify outliers, such as unusually large job-creation figures compared with similar projects. For example, an EDA representative told us that after one grantee reported an unusually large number of jobs created in its 9-year performance report, EDA requested an explanation and payroll documentation. However, such informal reviews are not systematic or regularly required.
This finding is consistent with our prior work. In July 2026, we reported that the reliability of performance measures for EDA’s disaster recovery programs is unknown because EDA does not validate grantee-reported data. We recommended that EDA resume procedures for validating those data.[49]
EDA officials said they are considering the feasibility of completing desk reviews of performance measure reports but have not established plans or timelines because staffing and resource constraints continue. However, although these constraints may make random annual site visits difficult to resume, EDA has not established a less resource-intensive alternative, such as risk-based desk reviews or requiring supporting documentation for selected submissions.
Ensuring that performance information meets quality standards is a key performance management practice.[50] A systematic validation process would provide decision-makers and stakeholders greater assurance that reported outcomes accurately reflect project performance and progress toward strategic and project goals. Implementing such procedures would improve confidence in the accuracy of EDA’s reported outcomes and make the information more useful for decision-making.
Denali Does Not Have a Standardized Process to Collect and Evaluate Grant Performance
Denali has implemented some key performance management practices but does not have guidance and procedures for collecting and validating standardized, objective, and quantifiable performance measures across its grants to assess progress toward goals. Our prior work has found that implementing leading practices for performance management can help an organization define what it is trying to achieve, determine how well it is performing, and identify what it could do to improve results.[51]
· Setting performance goals and measures. Denali officials told us that they establish goals for individual grant projects to ensure grantees complete their scope of work and achieve project objectives and deliverables. Because most Denali grants fund infrastructure, these goals may address matters such as energy transmission, fuel storage, electricity costs, and road safety and reliability. However, Denali has not documented a standardized set of performance measures in its strategic plans, annual reports, or grantee guidance that it and its grantees could use to establish measurable goals and assess results across grants.
· Collecting performance information. Denali collects information from grantees on project spending, progress, and completion but does not systematically collect measurable performance information from grant recipients, such as jobs created or retained or households and communities benefiting from improved infrastructure. Denali’s Office of Inspector General similarly reported for fiscal years 2024, 2025, and 2026 that the commission did not have the performance metrics and quantitative information needed to demonstrate program value and assess the benefits of previous grants.[52]
· Validating performance information. Denali officials told us they verify the completion of infrastructure projects through occasional site visits, reviews of documents and photographs, and communication with grantees and partner organizations. However, these activities verify project completion rather than validate standardized performance measures.
· Communicating results. Denali’s public reports also provide limited information on how grant projects are achieving performance goals or advancing Denali’s strategic goals and mission. For example, its most recent strategic plan reports the number of communities served since 1998, and officials said Denali collects information on communities served by individual projects. However, its recent annual reports for fiscal year 2024 and 2025 do not present the number of communities served by individual projects or any other grant performance information.[53] In late 2025, Denali contracted with the University of Alaska to evaluate the effects of selected grant programs. Although this evaluation may provide useful information, it does not substitute for an ongoing process to collect, validate, and report performance information over time.
Denali officials cited limitations in its grants management system and staffing and resource constraints as challenges to improving performance management.[54] They said the system cannot track or analyze standardized performance information across grants over time and replacing it would require additional funding, a new contractor, and 2 to 3 years. The officials said they are pursuing a new grants management contract. Denali’s Office of Inspector General identified performance management as a top management challenge in its 2024 and 2025 reports to Congress and noted that recent losses of staff and resources have hindered improvements.[55]
Practices used by other regional commissions illustrate potential approaches Denali could consider as it develops performance management processes. For example, the other commissions use standardized, objective, and quantifiable performance measures to define goals and measure progress across grants. Defining a standardized set of objective performance measures could also inform the development of a new grants management tool for tracking grant performance over time. Denali could also use a risk-based approach and use its current project monitoring practices to validate grantee-reported performance measures. Additionally, Denali could consistently communicate grant projects’ performance by including in annual reports information that it currently collects, such as communities served and qualitative descriptions of projects’ activities and outcomes.
Without documented guidance and procedures for collecting and validating standardized, measurable performance information from grantees over time across grants, Denali has limited ability to systematically manage grant performance and evaluate program results. Establishing such guidance and procedures would better position Denali to assess progress toward its goals, evaluate its grant program results, and use reliable performance information for decision-making and to communicate results to stakeholders.
EDA Does Not Consistently Coordinate Across Regional Commissions
EDA and Regional Commissions Programs Are Fragmented and Overlap
EDA and regional commission programs are fragmented––that is, more than one federal agency or organization within a federal agency is involved in the same broad area of national need.[56] Their programs also overlap––that is, multiple agencies or programs share similar goals, engage in similar activities or strategies to achieve them, or target similar beneficiaries.[57] Our analysis found that during fiscal years 2016 through 2024, approximately 13 percent of counties that were awarded regional commission or EDA funding were awarded funding from both at least once in the same fiscal year.[58]
Overlap in activities. EDA and the regional commissions fund many of the same types of economic development activities through their grant programs (see table 9). Among the eight activity categories we identified, workforce development and critical infrastructure were supported by the largest number of EDA and regional commission grant programs.
Table 9: Number of Programs Across Selected Economic Development Activities Administered by EDA and Regional Commissions, as of July 2026
|
Economic development activity |
EDA |
ARC |
DRA |
Denali |
NBRC |
SBRC |
SCRC |
Total |
|
Planning and implementing workforce development
strategies, |
4 |
5 |
5 |
2 |
2 |
1 |
4 |
23 |
|
Constructing and renovating commercial buildings |
4 |
3 |
2 |
0 |
2 |
1 |
0 |
12 |
|
Establishing business incubators |
6 |
3 |
2 |
0 |
0 |
1 |
3 |
15 |
|
Constructing Industrial parks |
4 |
3 |
3 |
0 |
1 |
1 |
1 |
13 |
|
Developing infrastructure by constructing and
repairing |
4 |
4 |
3 |
4 |
3 |
1 |
1 |
20 |
|
Planning and implementing innovation and |
6 |
0 |
2 |
1 |
0 |
1 |
1 |
11 |
|
Promoting the development of |
6 |
3 |
1 |
0 |
1 |
1 |
3 |
15 |
|
Developing telecommunications and broadband |
4 |
1 |
2 |
1 |
1 |
1 |
1 |
11 |
Source: GAO analysis of information from the Economic Development Administration (EDA), Appalachian Regional Commission (ARC), Delta Regional Authority (DRA), Denali Commission (Denali), Northern Border Regional Commission (NBRC), Southeast Crescent Regional Commission (SCRC), and Southwest Border Regional Commission (SBRC). | GAO-27-108496
Note: Numbers represent the number of programs administered by each entity that support the listed activity. We identified 37 federal economic development programs that EDA and regional commissions administered. Programs may support more than one type of activity.
Overlap in beneficiaries. EDA and regional commission programs also target similar beneficiaries based on geographic or economic conditions and individual or business characteristics (see table 10).
Table 10: Number of Programs by Intended Beneficiaries Across Selected EDA and Regional Commission Programs, as of July 2026
|
Beneficiaries |
EDA |
ARC |
DRA |
Denali |
NBRC |
SBRC |
SCRC |
Total |
|
Rural communities |
7 |
5 |
6 |
9 |
3 |
1 |
3 |
34 |
|
Small businesses (including entrepreneurs) |
7 |
3 |
1 |
1 |
0 |
1 |
3 |
16 |
|
Economically distressed areas |
7 |
5 |
6 |
9 |
1 |
1 |
3 |
32 |
|
Urban communities |
7 |
5 |
5 |
8 |
2 |
1 |
1 |
29 |
|
Primarily Tribal/Native American |
7 |
0 |
0 |
9 |
0 |
1 |
0 |
17 |
|
Primarily low-moderate income |
0 |
5 |
0 |
9 |
0 |
1 |
4 |
19 |
|
Specific groups of workers (such as youth or displaced workers) |
0 |
5 |
1 |
1 |
1 |
0 |
1 |
9 |
|
Other |
5 |
2 |
6 |
3 |
2 |
1 |
3 |
22 |
Source: GAO analysis of information from the Economic Development Administration (EDA), Appalachian Regional Commission (ARC), Delta Regional Authority (DRA), Denali Commission (Denali), Northern Border Regional Commission (NBRC), Southeast Crescent Regional Commission (SCRC), and Southwest Border Regional Commission (SBRC). | GAO-27-108496
Note: Numbers represent the number of programs administered by each entity that target the listed beneficiary type. We identified 37 federal economic development programs that EDA and regional commissions administered. Programs may target more than one beneficiary type.
Program overlap does not necessarily result in program duplication. Additionally, fragmentation and overlap can have positive or negative effects. They may help beneficiaries fill gaps and obtain specialized services relevant to an agency’s expertise, but they can also increase costs when entities separately manage similar programs.[59]
Some grantees and local development organizations involved in projects jointly funded by EDA and a regional commission described both benefits and administrative challenges. For example, representatives of one local development organization told us that although the regional commission and EDA designated their respective roles, the organization had to submit separate performance reports because the agencies had different reporting requirements. Staff from another organization said jointly funded projects proceeded smoothly, but it was unclear whether the regional commission and EDA communicated with one another.
EDA Coordination with Regional Commissions is Inconsistent
EDA relies on a mix of formal agreements and informal communication to coordinate with the regional commissions and its practices vary by commission:
· Grant administration. EDA and ARC have an agreement under which EDA may facilitate the administration of jointly funded projects and provide grant administration and technical assistance for ARC.[60] This arrangement may improve efficiency and reduce administrative burden for grantees. For example, one grantee we interviewed said that communicating only with EDA for a jointly funded project reduced the administrative burden.
· Informal communication. Coordination also occurs through informal meetings or information sharing. For example, EDA officials told us they meet with ARC at least monthly. Denali officials said they regularly communicate and share project information with EDA’s Alaska representative and cooperate to provide nonfederal matching funds.[61]
· Congressionally directed arrangements.[62] Congress has previously directed EDA to transfer funds to DRA, most recently in fiscal years 2023 and 2024.[63] EDA used a memorandum of agreement that established requirements for funds and processes for DRA.[64] DRA officials said the transfers could be used to support smaller rural projects that otherwise might not have qualified for EDA grants. EDA also said it transferred $2.25 million to NBRC to fund three projects and entered into a similar agreement most recently in fiscal year 2024.[65]
These coordination activities reflect several leading collaboration practices we have identified, including leveraging resources and information, developing and updating written agreements, and clarifying roles and responsibilities.[66]
However, EDA has not applied these practices consistently across the regional commissions. In addition, the practices have changed over time. For example, its grant administration agreement currently applies only to ARC, although EDA officials said these services are similarly available to other regional commissions.
Communication also appears inconsistent across regional commissions. Denali and ARC officials described regular coordination, such as referring grant applicants and identifying match funding. In contrast, officials from other regional commissions reported no project-level coordination with EDA. DRA officials said coordination was effective for projects supported by transferred funds, but communication has been limited since fiscal year 2024.
EDA’s authorizing statute, as amended, requires the agency to coordinate activities related to the preparing and implementing of comprehensive economic development strategies with other federal agencies carrying out other federal programs, states, economic development districts, Tribes, and other appropriate organizations.[67] The Thomas R. Carper Water Resources Development Act of 2024 also amended the Public Works and Economic Development Act to require EDA to convene periodic meetings with the active regional commissions to strengthen the connections between them.
Consistent with this requirement, in 2026, EDA took initial steps toward establishing a more formal coordination process. For example, EDA officials met with representatives of the six active regional commissions in February 2026. Participants identified communication, collaboration, and coordination as areas for improvement, and quarterly meetings were subsequently planned between EDA and regional commission leadership. An additional meeting was held in May 2026 on topics related to data utilization and match funding coordination. However, as of July 2026, EDA had not developed formal plans or procedures for implementing the matters discussed, according to some regional commission officials.
EDA officials told us that staff potential reductions and changes in agency appropriations make it difficult to plan, establish relationships, and commit to jointly funding projects. Several regional commission officials similarly cited limited EDA staff and resources as constraints. EDA and regional commission officials also said differences among the commissions—including their histories and relationships with EDA—have presented challenges to developing a common approach.
However, these differences do not prevent a coordinated approach. Some regional commission officials said the commissions have similar bylaws, communicate regularly, and share effective practices with each other despite differences in their regions and resources. For example, SCRC and SBRC officials said they drew on the experiences and leveraged the expertise of other regional commissions when developing their grant management and reporting practices.
Formal coordination mechanisms among regional commissions also show that differences in jurisdiction and structure can be addressed. For example, ARC officials stated that ARC and DRA share program staff and coordinate program implementation in overlapping areas. In Schoharie County, where ARC and NBRC jurisdictions overlap, NBRC’s authorizing statute allows grantees to receive funding from only one commission in a given fiscal year.[68]
We have previously identified leading practices for interagency collaboration that can help agencies mitigate the negative effects of fragmented and overlapping programs.[69] Although EDA and the regional commissions have identified opportunities to improve coordination, EDA has not developed a comprehensive framework for coordinating across all six active commissions. Without such a framework EDA is not well-positioned to manage reported problems resulting from fragmentation and overlap with regional commissions, such as increased administrative burden on grantees and inconsistent communication across commissions. EDA is also not well-positioned to ensure that data and resources are effectively leveraged. Developing and implementing a framework that reflects statutory requirements and leading collaboration practices would help EDA and the regional commissions better coordinate their efforts to achieve shared common economic development goals.
Conclusions
EDA and the regional commissions play important roles in supporting economic development in distressed and underserved communities. However, we have identified opportunities to strengthen performance management and coordination. More specifically, EDA does not have procedures for validating grantee-reported performance data. As a result, the agency has limited assurance that the data it uses to assess and report program results are accurate and reliable. Further, because the Denali Commission does not have guidance and procedures for collecting and validating objective, measurable, and quantifiable performance information across its grants, it has limited ability to systematically manage grant performance and evaluate outcomes and benefits. In addition, EDA has not developed a comprehensive framework for coordinating with federal regional commissions. Without such a framework, EDA may be less able to manage fragmentation and overlap and use federal economic development resources efficiently.
Recommendations for Executive Action
We are making a total of three recommendations, including two to the Department of Commerce and one to Denali.
The Secretary of Commerce should ensure that EDA resumes procedures for validating grantee-reported performance data. (Recommendation 1)
The Federal Cochair of the Denali Commission should establish guidance and procedures for collecting and validating standardized, measurable performance information from grant recipients over time across Denali’s grants. (Recommendation 2)
The Secretary of Commerce should ensure that EDA implements a framework for coordinating with federal regional commissions. The framework should reflect statutory requirements and reflect leading collaboration practices. (Recommendation 3)
Agency Comments
We provided a draft of this report to the Secretary of Commerce, the Federal Cochairs of ARC, Denali, NBRC, SBRC, SCRC, and the Executive Director of DRA for review and comment.
ARC, DRA, SBRC, and SCRC informed us that they did not have comments.
EDA agreed with our recommendations. Regarding our first recommendation, EDA stated that adopting procedures to validate grantee-reported data is dependent on resources, which are finite and determined by congressional appropriations. Denali agreed with our recommendation and provided written comments, which are reproduced in appendix V.
EDA, Denali, and NBRC provided technical comments, which we incorporated as appropriate.
We are sending copies of this report to the appropriate congressional committees, the Secretary of Commerce, and the Federal Cochairs of the Appalachian Regional Commission, the Denali Commission, the Northern Border Regional Commission, the Southwest Border Regional Commission, the Southeast Crescent Regional Commission, and the Executive Director of the Delta Regional Authority. In addition, this report will be available at no charge on GAO’s website at https://www.gao.gov.
If you or your staff have any questions about this report, please contact me at LaFountainC@gao.gov. Contact points for our Offices of Congressional Relations and Media Relations may be found on the last page of this report. GAO staff who made key contributions to this report are listed in appendix V.

Courtney L. LaFountain
Director, Financial Markets and Community Investment
This report (1) describes trends in Economic Development Administration (EDA) and regional commission awards and economic conditions in areas receiving awards during fiscal years 2016 through 2024 and examines evidence on the effects of selected grants on local economic conditions; (2) examines EDA and regional commission performance management efforts and the extent to which they align with selected leading practices; and (3) examines EDA’s coordination with regional commissions and the extent to which those efforts align with leading practices and statutory requirements.
For our first objective, we reviewed EDA and regional commission data on grants awarded during fiscal years 2016 through 2024. We compiled EDA data from three grant management systems. We also obtained data from the grant management systems of the Appalachian Regional Commission (ARC), Delta Regional Authority (DRA), Denali Commission (Denali), Northern Border Regional Commission (NBRC), and Southeast Crescent Regional Commission (SCRC).[70] We merged these data, standardized the combined dataset, and calculated summary statistics on grant awards. We assessed the reliability of the data by interviewing agency officials responsible for managing the data, reviewing technical documentation, and testing the data for errors. We found the data to be sufficiently reliable for describing the number and dollar value of grants awarded by each entity.
We also analyzed national and county-level data on population, unemployment and labor force participation rates, poverty rates, business establishments, and wages during our review period. Specifically, we compiled Census Bureau population data for calendar years 2016 through 2024; American Community Survey 5-year samples of unemployment and labor force participation rates across counties for calendar years 2012–2016 and 2020–2024; Small Area Income and Poverty Estimates for calendar years 2016 through 2024; and Bureau of Labor Statistics Quarterly Census of Employment and Wages data on establishments and wages for calendar years 2016 through 2024.
We assessed the reliability of the data by reviewing technical documentation and testing the data for errors. We found the data to be sufficiently reliable for describing economic conditions in U.S. counties and nationally over time.
To describe economic conditions in regional commission areas, we grouped each county by whether it was in the jurisdiction of one of the five regional commissions active in 2024: ARC, DRA, Denali, NBRC, and SCRC.[71] We also grouped all counties that were not in any regional commission area together. We then compared economic conditions in each regional commission area to conditions in nonregional commission areas and nationally and examined changes between fiscal years 2016 and 2024. See appendix IV for additional details of our analysis and results.
We also conducted a literature review to identify any studies or independent research on the effects of EDA and regional commission programs on economic outcomes. We searched databases of scholarly publications and other sources for reports and studies generally published within the last 10 years. Examples of databases searched include ProQuest, Economic Development Quarterly, and Scopus. We searched for terms including “Economic Development Administration,” “regional commissions,” “economic development,” “effect,” and “outcome.” From these searches, we identified 18 potentially relevant studies. We then conducted reviews of each study’s scope and research methodology. Based on this review, we identified three studies applicable to our report.
We also interviewed grantees and economic development officials associated with 12 projects funded by EDA, a regional commission, or both to obtain examples of how the grants affected local communities (see table 11). We visited three infrastructure projects that received EDA, ARC, DRA, or NBRC funding. We generally selected projects in Maryland, Vermont, and Louisiana that (1) received awards during fiscal years 2015 through 2021 to provide time for potential effects of the projects to emerge; (2) represented a variety of geographic areas, project types, and grant amounts; (3) when possible, received funding from both EDA and a regional commission. We did not select projects funded by SCRC or SBRC because their grants had not been completed during our fiscal years 2015 through 2021 review period.
|
Project |
Fiscal Year |
Funding entity |
State |
Award Amount |
|
Wastewater Treatment Plant |
2017 |
ARC and EDA |
Maryland |
ARC: $500,000 EDA: $1,275,000 |
|
State Technical Assistance |
2019 |
ARC |
New York |
$263,305 |
|
Sewer Upgrade |
2019 |
DRA |
Louisiana |
$144,500 |
|
Workforce Training Program |
2020 |
DRA |
Missouri |
$147,300 |
|
Power Plant Upgrade |
2018 |
Denali |
Alaska |
$1,458,490 |
|
Workforce Development Website |
2019 |
Denali |
Alaska |
$15,000 |
|
Trail Construction |
2017 |
NBRC |
Vermont |
$200,000 |
|
Workforce Training Program |
2019 |
NBRC |
Maine |
$79,136 |
|
Community Loan Fund |
2019 |
NBRC |
Vermont |
$250,000 |
|
University Center Technical Assistance |
2021 |
EDA |
Alaska |
$150,000 |
|
CEDS Planning |
2017 |
EDA |
Missouri |
$70,000 |
|
Regional Innovation Strategies |
2017 |
EDA |
Maine |
$454,532 |
Source: GAO analysis of fiscal year grant data from the Economic Development Administration (EDA), Appalachian Regional Commission (ARC), Delta Regional Authority (DRA), Denali Commission (Denali), and Northern Border Regional Commission (NBRC) award data. | GAO-27-108496
For additional perspectives, we spoke to representatives of selected research organizations and others that provide economic development technical assistance, including the Brookings Institution, the International Economic Development Council, the National Association of Development Organizations, Urban Institute, and the W.E. Upjohn Institute for Employment Research.
For our second objective, we reviewed EDA and regional commission documentation describing processes for managing grant performance, including strategic plans, annual reports, guidance for grantees, and performance reporting forms. We also interviewed EDA and regional commission officials about their grant performance management practices. We interviewed representatives of grant recipients and local development organizations associated with the 12 selected projects about their experiences collecting and reporting performance information. We compared EDA and regional commissions’ performance management practices against selected leading performance management practices and actions described in our prior work.[72] We selected these performance management practices and actions based on their relevance to the three-step performance management process described in our prior work, which includes setting goals, collecting performance information, and using information to assess results.
For our third objective, we analyzed EDA and regional commission grant award data and program information to determine the extent of fragmentation and overlap across their programs based on purposes, activities, and intended beneficiaries. We generally selected programs using agency information and interviews with agency officials.
To assess the extent of coordination, we reviewed documentation related to EDA and regional commission coordination efforts, including memorandums of agreement on projects with shared costs and defined roles. We interviewed EDA and regional commission officials about their communication and coordination experiences. We also interviewed representatives of selected grant recipients and local development organizations about their experiences working with EDA and regional commissions and their perspectives on coordination. We compared this information with statutory requirements for EDA to coordinate with other federal economic development agencies and leading practices for collaboration identified in our prior work.[73] We also assessed fragmentation and overlap among EDA and regional commissions in the geographic areas they serve and the activities they carry out.[74]
We conducted this performance audit from April 2025 to October 2026 in accordance with generally accepted government auditing standards. Those standards require that we plan and perform the audit to obtain sufficient, appropriate evidence to provide a reasonable basis for our findings and conclusions based on our audit objectives. We believe that the evidence obtained provides a reasonable basis for our findings and conclusions based on our audit objectives.
|
Entity |
Program Name |
Program Description |
|
Economic Development Administration |
Economic Adjustment Assistance (EAA) |
Assists communities and regions in the development of public facilities, public services, business development, planning, technical assistance, training, and any other assistance to alleviate long-term economic deterioration and sudden and severe economic dislocation. |
|
Partnership Planning |
Supports a national network of economic development districts as well as local organizations with long-term strategic economic development planning efforts, and helps communities undertake focused, project-specific planning activities. |
|
|
Public Works |
Designed to fund projects for the development of public works, public services, or development facilities or for the improvement of waste management and recycling systems, among other types of projects. |
|
|
Recompete Pilot |
Provides grants and cooperative agreements to alleviate persistent economic distress and support long-term comprehensive economic development and job creation in eligible areas. |
|
|
Regional Technology and Innovation Hubs |
Supports technology development, job creation, and expanding U.S. innovation capacity. |
|
|
Research and National Technical Assistance |
Funds research, evaluation, and national technical assistance projects that promote competitiveness and innovation in distressed rural and urban regions. |
|
|
Trade Adjustment Assistance for Firms |
Provides technical assistance to import-affected U.S. manufacturing, production, and service firms through the development and implementation of adjustment plans. |
|
|
Local Technical Assistance |
Provides grants for management and technical services, including feasibility studies or impact analyses. |
|
|
Build 2 Scale |
Funds efforts to facilitate innovation and entrepreneurship and increase access to risk capital. |
|
|
Appalachian Regional Commission |
Area Development Program |
Funds building community capacity and supporting economic growth, as well as funding for local development districts, access to capital initiatives, and revolving loan funds. |
|
Appalachian Regional Initiative for Stronger Economies (ARISE) |
Supports large-scale, multi-state projects. |
|
|
Investments Supporting Partnerships in Recovery Ecosystems Initiative (INSPIRE) |
Supports creation and expansion of recovery ecosystems and workforce entry or reentry to address the substance use disorder crisis. |
|
|
Partnerships for Opportunity and Workforce and Economic Revitalization Initiative (POWER) |
Provides funding for ARC communities disproportionately affected by the downturn of the coal industry. |
|
|
Appalachian Regional Energy Hub Initiative |
Grant program that funds energy hub research and implementation projects. |
|
|
Delta Regional Authority |
State’s Economic Development Assistance Program (SEDAP) |
Provides investments to support basic public infrastructure, workforce development, business expansion and community development projects. |
|
Community Infrastructure Fund |
Invests in critical infrastructure projects, including water and wastewater systems, transportation, broadband, and public facilities. |
|
|
Public Works and Economic Adjustment Assistance (PWEAA) |
Supports infrastructure and economic development projects that enhance regional competitiveness, create jobs, and build resilient local economies. |
|
|
Delta Health Collaborative Programs (e.g., Delta Doctors Program, Delta Region Community Health Systems Development Program) |
Strengthens healthcare access: builds local healthcare capacity; and supports the recruitment, retention, and sustainability of healthcare providers and systems. |
|
|
Delta Leadership Institute |
Develops a network of regional leaders by providing executive leadership training, government relations, and collaborative learning opportunities. |
|
|
Delta Capacity Building Programs (e.g., LDD Community Support Pilot Program, Strategic Planning Program) |
Provides planning resources, enhanced technical assistance, leadership development, and strategic partnerships. |
|
|
Denali Commission |
Broadband |
Primarily provides broadband technical assistance with some construction support. |
|
Transportation System Improvements |
Provides surface and waterfront improvements for efficient movement of goods and services, supporting commerce and economic growth. |
|
|
Energy and Bulk Fuel |
Rural power generation, distribution, and bulk fuel infrastructure provide reliable energy that powers homes, businesses, critical facilities, and local economies. |
|
|
Crime Victim Services |
Strengthens tribal community capacity by expanding victim services, improving public safety, and supporting the workforce and social infrastructure needed for long-term economic development. |
|
|
General Economic Development |
Supports sustainable economic growth by investing in community infrastructure, planning, and local assets that improve quality of life, strengthen regional capacity, and attract future investment. |
|
|
Training |
Builds local workforce capacity through technical and administrative training that supports infrastructure reliability, local hire, and long-term economic resilience. |
|
|
Health Facilities |
Expands access to essential healthcare through investments in clinics, wellness centers, and related facilities that improve community health and resilience. |
|
|
Village Infrastructure Protection |
Strengthens community resilience by protecting critical infrastructure, supporting strategic relocation and development, and advancing long-term planning for sustainable growth. |
|
|
Other Infrastructure |
Other Infrastructure |
|
|
Northern Border Regional Commission |
Catalyst Program |
Supports a broad range of economic development initiatives such as projects that modernize and expand water and wastewater systems; revitalize transportation infrastructure; establish workforce development programs and facilities; grow outdoor recreation infrastructure and economies; and construct new childcare and healthcare facilities. |
|
Forest Economy Program |
Supports the forest-based economy and assists in the industry’s evolution to include new technologies and viable business models across the region. |
|
|
Timber for Transit Program |
Supports projects that use wood-based materials and composites for transportation infrastructure. |
|
|
Southeast Crescent Regional Commission |
State Economic and Infrastructure Development Program |
Encourages and supports economic and infrastructure development activities across the Southeast Crescent region. |
|
Local Development District Capacity Building |
Strengthens the operational capacity of local development districts to assist the regional commission in providing aid to communities (e.g., assisting in the payment of development planning and administrative expenses). |
|
|
State Capacity Cooperative Program |
Assists with grant monitoring and ensuring compliance of grantees within their state who have received grant awards. |
|
|
Crescent Care Collaborative |
Provides J-1 visa waivers to allow foreign physicians, who trained in the United States, to work in medically underserved areas. |
|
|
Southwest Border Regional Commission |
Economic and Infrastructure Development Program |
Supports transportation and basic public infrastructure, telecommunications infrastructure, job skills training, skills development, employment-related education, entrepreneurship, technology, and business development, resource conservation, tourism, recreation, development of renewable and alternative energy sources, and the growth of economic development capacity. |
Source: GAO analysis of statutes and information provided by Economic Development Administration, Appalachian Regional Commission, Delta Regional Authority, Denali Commission, Northern Border Regional Commission, Southeast Crescent Regional Commission, and Southwest Border Regional Commission. | GAO-27-108496
The maps below present data compiled from the Economic Development Administration (EDA) and the five regional commissions active in 2016 and 2024: the Appalachian Regional Commission, Delta Regional Authority, Denali Commission, Northern Border Regional Commission, and Southeast Crescent Regional Commission.[75] Figure 8 shows the number of grants awarded to single counties, by the six entities, to each county in fiscal years 2016 and 2024. Figure 9 shows the total nominal dollar amount awarded to single counties, by the six entities, to each county in those years. Data exclude grants awarded to multiple counties or states, as well as those with missing location information, which accounted for 39 percent of fiscal year 2016 awards and 24 percent of fiscal year 2024 awards.
Figure 8: Number of Economic Development Administration and Regional Commission Grants Awarded to Individual Counties by County, Fiscal Years (FY) 2016 and 2024
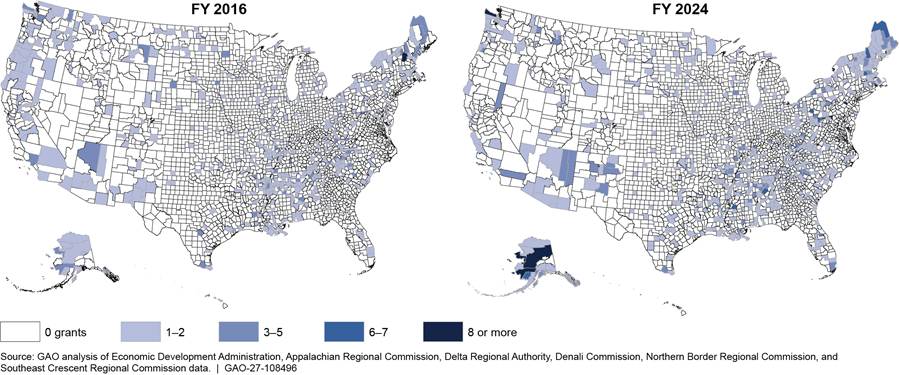
Notes: Grants awarded may include awards later rescinded, terminated, or deobligated. Data exclude 39.5 percent of grants awarded in fiscal year 2016 and 24 percent of grants awarded in fiscal year 2024 due to missing data or because the grant was awarded to multiple counties. Data also excludes Economic Development Administration grants to territories: six grants totaling $5.8 million in fiscal year 2016 and 16 grants totaling $35 million in fiscal year 2024. Accordingly, the maps may not show all counties served.
Figure 9: Total Nominal Amount of Economic Development Administration and Regional Commission Grants Awarded by County, Fiscal Years (FY) 2016 and 2024
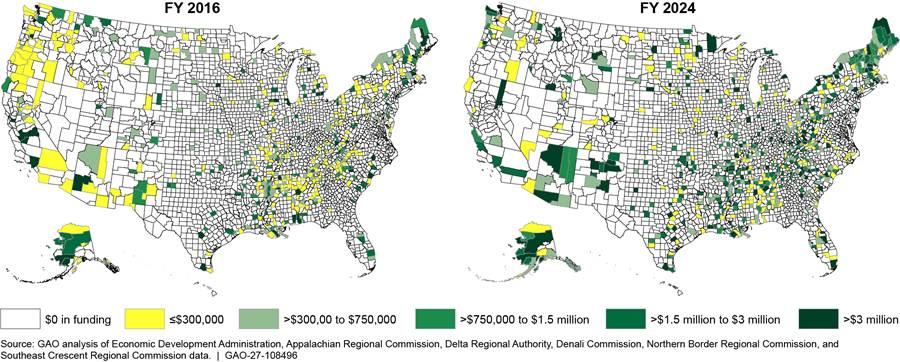 Notes: Total nominal dollar amount of
awarded grants may include funding that was fully or partially rescinded,
terminated, or deobligated after the award was approved. Data exclude 39.5
percent of grants awarded in fiscal year 2016 and 24 percent of grants awarded
in fiscal year 2024 due to missing data or because the grant was awarded to
multiple counties. Data also excludes Economic Development Administration
grants to territories: six grants totaling $5.8 million in fiscal year 2016 and
16 grants totaling $35 million in fiscal year 2024. Accordingly, the maps may
not show all counties served.
Notes: Total nominal dollar amount of
awarded grants may include funding that was fully or partially rescinded,
terminated, or deobligated after the award was approved. Data exclude 39.5
percent of grants awarded in fiscal year 2016 and 24 percent of grants awarded
in fiscal year 2024 due to missing data or because the grant was awarded to
multiple counties. Data also excludes Economic Development Administration
grants to territories: six grants totaling $5.8 million in fiscal year 2016 and
16 grants totaling $35 million in fiscal year 2024. Accordingly, the maps may
not show all counties served.
This appendix describes the data, methods, limitations, and results of our analysis of economic conditions in regional commission and nonregional commission areas from calendar years 2016 through 2024.
Data and Economic Indicators
To analyze changes in economic conditions in regional commission areas from calendar year 2016 through 2024, we analyzed data from the Census Bureau and the Bureau of Labor Statistics. Specifically, we examined county-level data on population, unemployment and labor force participation rates, poverty rates, business establishments, and wages.[76]
· American Community Survey. Five-year county-level samples from calendar years 2012–2016 and 2020–2024 for unemployment and labor force participation rates, obtained from the Census Bureau. The unemployment rate is the percentage of people age 16 and older in the civilian labor force who are not employed but are actively looking for work. The labor force participation rate is the percentage of people age 16 and older who are in the civilian labor force, which includes people who are working or actively seeking work.
· Small Area Income and Poverty Estimates. Annual county-level poverty rate obtained from the Census Bureau for calendar years 2016 and 2024. The poverty rate is the percentage of people living in households with income below the poverty threshold. The Census Bureau uses poverty thresholds that are generally equal to three times the cost of a minimum food diet from 1963 measured in current dollars and adjusted for family size and composition.
· Quarterly Census of Employment and Wages. Quarterly count of establishments and total wages, obtained from the Bureau of Labor Statistics for calendar years 2016 and 2024.[77] A business establishment is defined as an economic unit that produces goods or services and is typically a single physical location, such as a factory, store, or office, engaged in predominantly one type of economic activity. The annual average number of establishments is an average of the counts for the four quarters for each year. The Quality Census of Employment and Wages national estimates are calculated as the sum of county-level estimates.
We assessed the reliability of the data by reviewing technical documentation and testing the data for errors. We found the data to be sufficiently reliable for describing economic conditions in U.S. counties and nationally over time.
Analysis and Limitations
We estimated poverty rate, unemployment rate, and labor force participation rate for the service areas of five regional commissions—Appalachian Regional Commission (ARC), Delta Regional Authority (DRA), Denali Commission (Denali), Northern Border Regional Commission (NBRC), and Southeast Crescent Regional Commission (SCRC)—and for counties not in any regional commission area. Each regional commission’s service area includes counties that are eligible, but not required, to receive funding from that commission. Fifteen counties fall within the service areas of more than one regional commission. For the purposes of our analyses, we included each of these counties in every applicable regional commission area.
For each year, we estimated the poverty rate for each area as the total number of people in poverty for all counties in the area divided by the total number of people in all counties in the area. We estimated the unemployment rate and the labor force participation rate for each area similarly.
We compared poverty rates in calendar year 2016 with those in calendar year 2024 for each regional commission area and for nonregional commission areas. We used statistical tests to determine whether differences in the 2016 and 2024 estimates were statistically significant at the 90 percent level. We did the same for unemployment rates and labor force participation rates for 2012–2016 and 2020–2024 samples.
We also estimated the number of establishments and total annual wages for the service areas of the five regional commissions and for nonregional commission areas. For each year, we estimated the number of establishments in each area by summing up the number of establishments for all counties in the area. We estimated total annual wages in each area similarly. We adjusted total annual wages in 2016 for inflation and expressed them in 2024 dollars. To compare changes in establishments and total annual wages, we calculated the percent change from calendar year 2016 through calendar year 2024 for each area.
Our analysis has limitations and our results should be interpreted with caution. For example, multiple factors affect economic conditions, including differential impacts of the COVID-19 pandemic, and we did not evaluate the causal link between regional commission funding and county economic conditions. Furthermore, some counties in regional commission areas may not have received commission funding from calendar years 2016 through 2024.[78] Our analysis captures economic conditions across the service area as a whole and economic conditions of individual counties within each service region may vary.
Results
Unemployment. Estimated unemployment rates decreased in each regional commission area and in nonregional commission areas from calendar years 2012–2016 through calendar years 2020–2024 (see fig. 10). Among these areas, the decreases were approximately 2 to 3 percentage points. Unemployment rates in four regional commission areas (ARC, DRA, NBRC and SCRC) fell by more than national unemployment rates and unemployment rates in nonregional commission areas. Changes in unemployment for Denali and areas not in any regional commission were in line with national changes.
Figure 10: Five-Year Estimated Unemployment Rates in Regional Commission Areas, Nonregional Commission Areas, and Nationally, Calendar Years 2012–2016 and 2020–2024
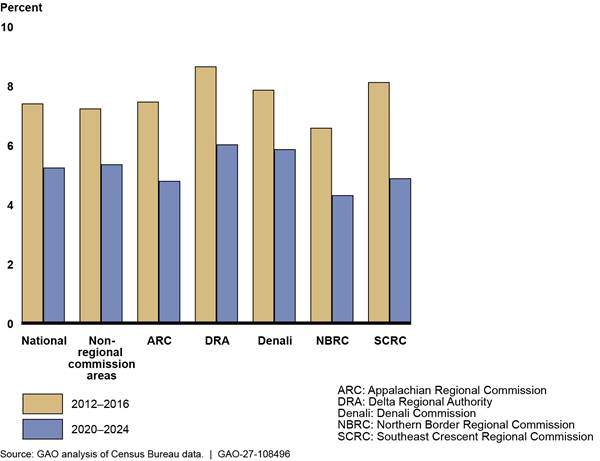
Notes: We estimated unemployment rates using American Community Survey (ACS) data. ACS is a nationwide survey that collects and produces data every year. The U.S. Census Bureau combines 5 consecutive years of ACS data to produce multiyear estimates for geographic areas with fewer than 65,000 residents. Unemployment rate estimates the unemployment rate for the population 16 years and older in the civilian labor force. We estimated unemployment rates for each area by dividing the total estimated number of unemployed people in all counties and county equivalents in each area by the total estimated number of people in the labor force in all counties and county equivalents in each area. The estimates for unemployment rate in this figure have margins of error at the 90-percent confidence level within 0.32 percentage points. All changes in unemployment rate estimates from the 2012–2016 sample to the 2020–2024 sample were statistically significant at the 90-percent level. SCRC awarded its first grants in fiscal year 2024.
Labor force participation. Estimated labor force participation rates increased modestly in two regional commission areas and decreased in three regional commission areas (see fig. 11). While labor force participation modestly decreased nationally (0.09 percentage points) and outside regional commission areas (0.2 percentage points), it modestly increased by about 0.35 and 0.15 percentage points in the areas ARC and SCRC served. Labor force participation decreased in DRA by 0.59 percentage points. It fell the most in the Denali area—more than 5 percentage points—and declined in the NBRC area by 1.4 percentage points. Despite its larger decline, Denali had a higher labor force participation rate than nonregional commission areas and nationally in 2016, a difference that was statistically significant at the 90-percent confidence level.
Figure 11: Five-Year Estimated Labor Force Participation Rates in Regional Commission Areas, Nonregional Commission Areas, and Nationally, Calendar Years 2012–2016 and 2020–2024
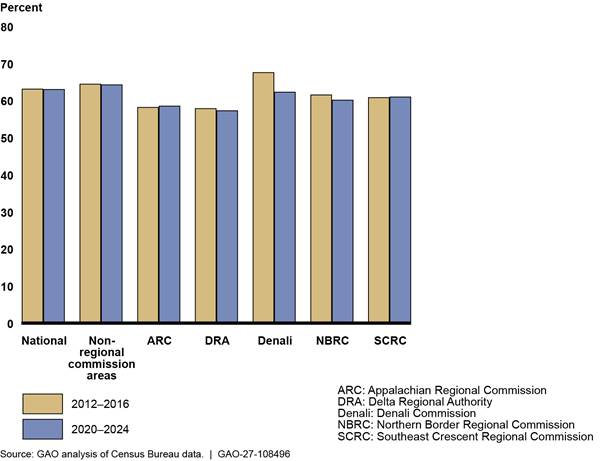
Notes: We estimated labor force participation rates using American Community Survey (ACS) data. ACS is a nationwide survey that collects and produces data every year. The Census Bureau combines 5 consecutive years of ACS data to produce multi-year estimates for geographic areas with fewer than 65,000 residents. Labor force participation rate estimates the labor force participation rate for the population 16 years and older in the civilian labor force. We estimated the labor force participation rate for each area by dividing the total estimated number of people in the civilian labor force in all counties and county equivalents in each area by the total estimated number of people 16 years and older in all counties and county equivalents in each area. The estimates for the 5-year labor force participation rate in this figure have margins of error at the 90-percent confidence level within 0.56 percentage points. All changes in labor force participation rate estimates from the 2012-2016 sample to the 2020-2024 sample were statistically significant at the 90-percent level. SCRC awarded its first grants in fiscal year 2024.
Poverty. Estimated poverty rates decreased in four regional commission areas from calendar year 2016 to calendar year 2024 (see fig. 12). Poverty rates in areas served by ARC and DRA declined by approximately 2 percentage points, similar to national poverty rates and rates in nonregional commission areas, while the rate in the area served by NBRC decreased by 1 percentage point. The poverty rate in SCRC declined by about 2.5 percentage points, the largest drop among regions analyzed, however SCRC awarded its first grants in fiscal year 2024. The poverty rate in the area served by Denali increased by 0.4 percentage points, but this change was not statistically significant at the 90-percent confidence level and poverty rates in Denali remained lower than poverty rates in the other areas in both 2016 and 2024.
Figure 12: Estimated Annual Poverty Rates in Regional Commission Areas, Nonregional Commission Areas, and Nationally, Calendar Years 2016 and 2024
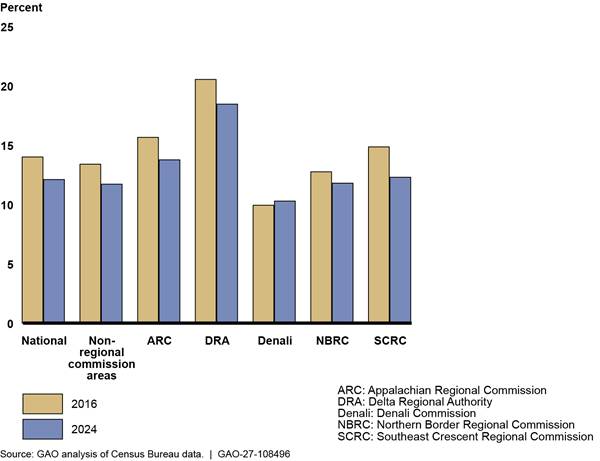
Notes: We estimated poverty rates using U.S. poverty thresholds for individuals and households, which are updated annually. A person or household is considered in poverty if their total income before taxes is below the applicable threshold. We estimated poverty rates for each area by dividing the total estimated number of people in poverty in all counties and county equivalents in each area by the estimated total number of people for whom poverty status could be determined in all counties and county equivalents in each area. The estimates for poverty rates in this figure have margins of error at the 90-percent confidence level within 0.60 percentage points. Changes in poverty rate estimates from calendar year 2016 through calendar year 2024 were statistically significant at the 90-percent level in all areas except Denali. SCRC awarded its first grants in fiscal year 2024.
Total Annual Wages. After adjusting for inflation, total annual wages increased in all five regional commission areas from calendar year 2016 through calendar year 2024, with the largest increase in the area served in 2024 by SCRC (25 percent) and the smallest in the areas served by Denali and DRA (about 6 percent in each area) (see fig. 13). Total annual real wages in one regional commission area (SCRC) increased in percentage terms by more than total annual wages nationally and in nonregional commission areas. Increases in total wages in a region are driven by a combination of increasing real wages and increasing employment.
Figure 13: Percent Change in Total Annual Real Wages for Counties in Regional Commission Areas and Nonregional Commission Areas from Calendar Years 2016–2024
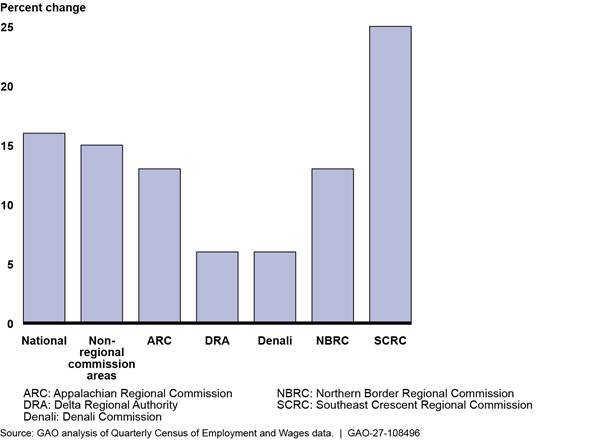
Notes: Data on total wages come from the Quarterly Census of Employment and Wages, which is drawn from administrative data, primarily from state unemployment insurance programs, and covers more than 95 percent of U.S. jobs. We calculated the total annual wages, adjusted to 2024 dollars using the Gross Domestic Product price index, for regional commission areas and nonregional commission areas using all counties or county equivalents within each area and calculated percent change from calendar year 2016 through 2024. Changes in total wages in service areas reflect both changes in wages earned and changes in employment in the service area. SCRC awarded its first grants in fiscal year 2024.
Establishments. From calendar year 2016 through calendar year 2024, the total number of establishments increased in all five regional commission areas, from 8 percent in the Denali area to 28 percent in the SCRC area (see fig. 14). Establishment growth in two regional commission areas exceeded national establishment growth and growth in nonregional commission areas.
Figure 14: Percent Change in Total Number of Establishments for Counties in Regional Commission Areas and Nonregional Commission Areas, Calendar Years 2016 and 2024
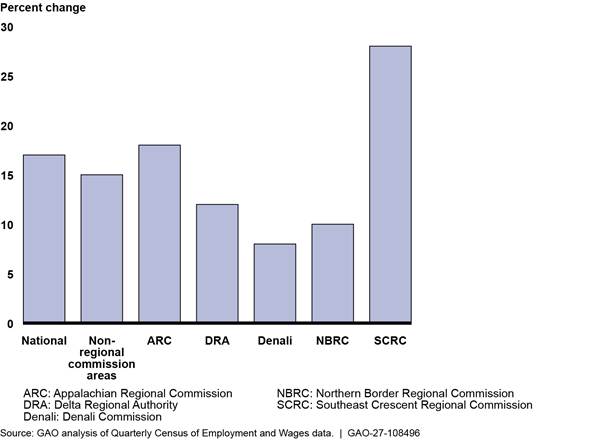
Notes: Establishment data are from the Quarterly Census of Employment and Wages and are drawn from administrative data, primarily from state unemployment insurance programs and covers more than 95 percent of U.S. jobs. We calculated the total annual number of establishments for each regional commission area and for nonregional commission areas using all counties or county equivalents within each area and calculated percent change from calendar year 2016 through 2024. SCRC awarded its first grants in fiscal year 2024.
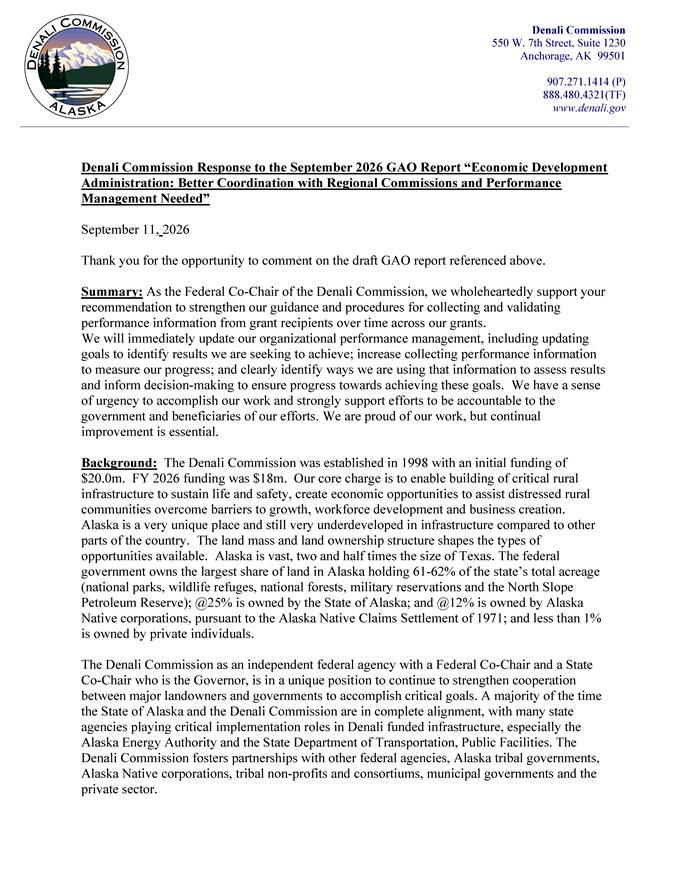
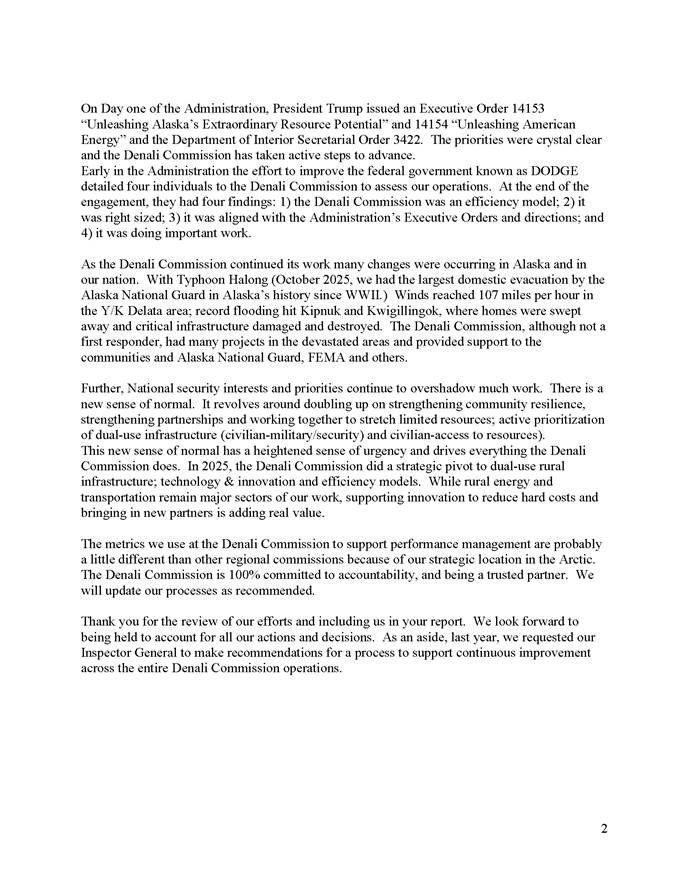
GAO Contact
Courtney LaFountain, LaFountainC@gao.gov
Staff Acknowledgments
In addition to the contact named above, Catherine Gelb (Assistant Director), Jordan Anderson (Analyst in Charge), Kaitie Brown, Kathleen Drennan, Daniel Horowitz, Jill Lacey, Carly McCann, Marc Molino, Kathleen Padulchick, Eric Schwab, and Mary Stack made key contributions to this report.
The Government Accountability Office, the audit, evaluation, and investigative arm of Congress, exists to support Congress in meeting its constitutional responsibilities and to help improve the performance and accountability of the federal government for the American people. GAO examines the use of public funds; evaluates federal programs and policies; and provides analyses, recommendations, and other assistance to help Congress make informed oversight, policy, and funding decisions. GAO’s commitment to good government is reflected in its core values of accountability, integrity, and reliability.
Obtaining Copies of GAO Reports and Testimony
The fastest and easiest way to obtain copies of GAO documents at no cost is through our website. Each weekday afternoon, GAO posts on its website newly released reports, testimony, and correspondence. You can also subscribe to GAO’s email updates to receive notification of newly posted products.
Order by Phone
The price of each GAO publication reflects GAO’s actual cost of production and distribution and depends on the number of pages in the publication and whether the publication is printed in color or black and white. Pricing and ordering information is posted on GAO’s website, https://www.gao.gov/ordering.htm.
Place orders by calling (202) 512-6000, toll free (866) 801-7077,
or
TDD (202) 512-2537.
Orders may be paid for using American Express, Discover Card, MasterCard, Visa, check, or money order. Call for additional information.
Connect with GAO
Connect with GAO on X,
LinkedIn, Instagram, and YouTube.
Subscribe to our Email Updates. Listen to our Podcasts.
Visit GAO on the web at https://www.gao.gov.
To Report Fraud, Waste, and Abuse in Federal Programs
Contact FraudNet:
Website: https://www.gao.gov/about/what-gao-does/fraudnet
Automated answering system: (800) 424-5454
Media Relations
Sarah Kaczmarek, Managing Director, Media@gao.gov
Congressional Relations
David A. Powner, Acting Managing Director, CongRel@gao.gov
General Inquiries
[1]EDA was created by the Public Works and Economic Development Act of 1965 to support economically distressed areas by providing financial assistance to help regions establish stable diversified local economies and improved local conditions. Pub. L. No. 89-136, 79 Stat. 552 (1965) (codified at 42 U.S.C. §§ 3121–3233).
[2]Pub. L. No. 118-272, §§ 2241, 2251, 2253, 138 Stat. 2992, 3202, 3210, 3213 (2025). The Appalachian Regional Commission did not receive an authorization of appropriations in the Thomas R. Carper Water Resources Development Act of 2024; its current annual appropriations of $200 million are authorized through fiscal year 2026. See 40 U.S.C. § 14703(a)(6).
[3]As of March 2026, four additional regional commissions had been authorized but were inactive and did not have a confirmed federal cochair, which is required for them to operate: the Great Lakes Authority, Mid-Atlantic Regional Commission, Northern Great Plains Regional Authority, and Southern New England Regional Commission.
[4]Pub. L. No. 118-272, § 2233, 138 Stat. 2992, 3198 (2025).
[5]Agencies sometimes use the terms “coordination” and “collaboration” interchangeably to describe interagency activities. There are no commonly accepted definitions for these terms. For the purposes of this work, we use “coordination” to refer to any joint activities intended to produce more public value than agencies could produce acting alone, except when describing requirements that specifically use “collaborate” or “collaboration.”
[6]Grant recipients receive payment in cash or in kind for a specified purpose and must use award funds for allowable purposes or risk collection of unallowable costs by the federal government. Recipients are not required to repay grant funds used for allowable purposes. Grant programs may support narrowly or broadly defined purposes. Data for fiscal years 2016 through 2024 were the most recent available at the time of our review.
[7]GAO, Evidence-Based Policymaking: Practices to Help Manage and Assess the Results of Federal Efforts, GAO‑23‑105460 (Washington, D.C.: July 12, 2023).
[8]See 42 U.S.C. § 3133; GAO, Government Performance Management: Leading Practices to Enhance Interagency Collaboration and Address Crosscutting Challenges, GAO‑23‑105520 (Washington, D.C.: May 24, 2023).
[9]GAO, Fragmentation, Overlap, and Duplication: An Evaluation and Management Guide, GAO‑15‑49SP (Washington, D.C.: Apr. 14, 2015).
[10]The Public Works and Economic Development Act of 1965 established EDA to create and retain jobs and to help stimulate industrial and commercial growth in distressed rural and urban communities across the nation. EDA’s focus subsequently expanded to include entrepreneurship, innovation, and disaster recovery. The Thomas R. Carper Water Resources Development Act of 2024 further expanded the types of economic development activities applicable to EDA programs, including project predevelopment, capacity building, outdoor recreation, and sustainable use of marine and coastal resources. It also created new program authorities and expanded the scope of several existing programs.
[11]EDA’s appropriation included $400 million for grants and $66 million for salaries and expenses. Pub. L. No. 119-74, 140 Stat. 7, 7–8 (2026). In its fiscal year 2027 budget request, the administration requested $20 million for the second year of expenses associated with closing the agency and consolidating or eliminating certain programs.
[12]Regional economic development organizations, referred to as district organizations, can request that EDA designate a region as an economic development district under certain conditions. Economic development districts are EDA-designated multijurisdictional entities (commonly consisting of multiple counties) that coordinate regional economic development. Revolving loan funds are grants that provide capital to organizations that make loans to borrowers, who repay the loans with interest. The repaid funds may then be to make additional loans.
[13]EDA’s investment priorities were previously determined by each administration. The current priorities were codified in law in January 2025. Pub. L. No. 118-272, § 2218, 138 Stat. 2992, 3182–83 (2025) (codified at 42 U.S.C. § 3148).
[14]Pub. L. No. 118-272, § 2215, 138 Stat. 2992, 3181 (2025) (codified at 42 U.S.C. § 3144).
[15]Congressional Research Service, Federal Regional Commissions and Authorities: Structural Features and Functions, R45997 (Washington, D.C.: Sep. 17, 2026).
[16]Appendix II provides additional information on selected EDA programs.
[17]We have prior work examining duplication, overlap, fragmentation, and coordination in federal economic development grant programs other than those administered by regional commissions and describes economic development activities supported by those programs. Economic Development Administration: Additional Collaboration with Other Agencies Could Reduce Risks Associated with Overlap, GAO-26-107826 (Washington, D.C.: September 17, 2026).
[19]Pub. L. No. 103-62, 107 Stat. 285. Congress later updated and amended the statutory performance management framework. GPRA Modernization Act of 2010, Pub. L. No. 111-352, 124 Stat. 3866 (2011).
[21]SBRC did not award its first grants until fiscal year 2025. SCRC awarded grants only in fiscal year 2024.
[22]When adjusted for inflation, the total amount awarded in fiscal year 2016 was still less than fiscal year 2024, totaling about $660 million.
[23]We analyzed data from EDA and the five regional commissions—ARC, Denali, DRA, NBRC, and SCRC—that awarded grants before fiscal year 2025. SBRC’s first grant cycle occurred in fiscal year 2025. Grants awarded may include amounts that were partially or fully rescinded, terminated, or deobligated after the award was approved.
[24]We analyzed American Community Survey estimates for two calendar year periods: 2012–2016 and 2020–2024, and Small Area Income and Poverty Estimates and Quarterly Census of Employment and Wages data for 2016 and 2024. The Bureau of Labor Statistics defines an establishment as the physical location of a certain economic activity, such as a factory, store, or office, that generally produces a good or service.
[25]We separated counties into groups based on whether they were located within the jurisdiction of ARC, DRA, Denali, NBRC, SCRC or outside a regional commission area. We assessed changes in economic conditions in each service area from 2016 to 2024.
[26]GAO, Economic Development Administration: Additional Collaboration with Other Agencies Could Reduce Risks Associated with Overlap, GAO‑26‑107826 (Washington, D.C.: Sept. 17, 2026).
[27]Total other funding does not include any other funding that DRA grantees may have received from fiscal years 2016 through 2020.
[28]EDA and the regional commissions can generally designate local development organizations to coordinate regional economic development activities. EDA may designate an organization as an economic development district and a regional commission may designate an organization as a local development district. EDA and the regional commissions may confer their respective designations on the same organization. These districts commonly comprise multiple counties and sometimes cross state borders. They may also lead, coordinate, and assist with project development; and provide outreach, technical assistance, and grant support to applicants and grantees. According to EDA, there are approximately 400 economic development districts, although some regions of the United States are not served by an EDA-designated district. Some regional commissions designate at least one local development district per county within their jurisdictions.
[29]We previously reported on federal economic development programs available to tribal entities and on the Department of Energy’s Tribal Energy Financial Program, which finances a variety of energy projects related to energy production and economic development on tribal lands. GAO, Tribal Economic Development: Action is Needed to Better Understand the Extent of Federal Support, GAO‑22‑105215 (Washington, D.C.: Aug. 30, 2022); and Tribal Energy Finance: Changes to DOE Loan Program Would Reduce Barriers for Tribes, GAO‑25‑107441 (Washington, D.C.: Aug. 11, 2025). We also previously reported on challenges the Denali Commission faced in fulfilling its statutory purpose of providing economic development services to rural communities and options for addressing them. GAO, Denali Commission: Options Exist to Address Management Challenges, GAO‑15‑72 (Washington, D.C.: Mar. 25, 2015).
[30]Although we did not select this DRA-funded project for a site visit, it was in the same county as projects we did select, and local officials discussed it during our visit.
[31]EDA and some regional commissions also report on the effects of their respective economic development programs in annual reports. We discuss these annual reports later in this report.
[32]Tyler Morin and Mark Partridge, “The Impact of Small Regional Economic Development Commissions: Is There Any Bang After Just a Few Bucks?” Economic Development Quarterly, vol. 35, no. 1 (2021): 22-39, https://doi.org/10.1177/0891242420972475.
[33]Andrew Isserman and Terance Rephann, “The Economic Effects of the Appalachian Regional Commission: An Empirical Assessment of 26 Years of Regional Development Planning,” Journal of the American Planning Association, vol. 61, no. 3 (1995): 345–364, http://dx.doi.org/10.1080/01944369508975647.
[34]Taylor Jaworski and Carl T. Kitchens, “National Policy for Regional Development: Historical Evidence from Appalachian Highways,” The Review of Economics and Statistics, vol. 101, no. 5, (2019): 777-790, https://doi.org/10.1162/rest_a_00808.
[35]We have identified key practices and actions that organizations can use to manage performance (GAO‑23‑105460). We selected relevant practices and actions to evaluate the extent to which EDA and the regional commissions measure grant programs’ performance. For setting goals, key actions include identifying both long-term strategic goals and near-term measurable results for individual projects. For collecting performance information, key actions include developing an evidence-building plan that describes key questions and information to be collected and ensuring new evidence meets quality standards. For using performance information, key practices include using evidence to learn by assessing progress toward goals and communicating relevant information internally and externally.
[37]GAO, Economic Development: Opportunities Exist for Further Collaboration among EDA, HUD, and USDA, GAO‑21‑579 (Washington, D.C.: July 30, 2021), 26. While empirical studies and state evaluations of business incentives have generated a variety of findings, researchers and state officials have identified challenges that limit their ability to accurately determine and evaluate the effects of these incentives.
[38]Appalachian Regional Commission, Appalachia Envisioned: ARC Strategic Plan Fiscal Years 2022–2026 (Washington, D.C.: Oct. 2021); Delta Regional Authority, Navigating the Currents of Opportunity: DRA Regional Development Plan IV (Baton Rouge, LA: Feb. 2023); Denali Commission, Strategic Plan FY 2023–2027 (Anchorage, AK: March 2024); Northern Border Regional Commission, Strategic Plan 2024–2029 (2023); Southeast Crescent Regional Commission, Strategic Plan (2023-2027) (Dec. 2022); and Southwest Border Regional Commission, Strategic Plan 2025 (Las Cruces, NM: 2025).
[39]Performance goals are target levels of performance to be accomplished within a specified time frame. They are generally expressed as tangible, measurable objectives or as quantitative standards, values, or rates and are linked to strategic goals and objectives. Related goals may exist at multiple organizational levels, from individual projects and programs to efforts that cross multiple departments and agencies. Clearly showing how those goals align can help illustrate and assess how individual activities contribute to broader outcomes. GAO‑23‑105460.
[40]EDA requires all infrastructure grantees to report on the performance measures of job creation and private investment leveraged. ARC, DRA, NBRC, SBRC, and SCRC generally allow grantees to select from the standardized lists of performance measures, depending on the project type.
[41]Performance information is quantitative or qualitative data used to track progress toward achieving agency goals or objectives or to assess the overall performance of a program, operation, or project. It is generally collected regularly—such as monthly, quarterly, or annually—to support monitoring and oversight by federal agencies and outside parties, such as Congress, the public, and other stakeholders. GAO‑23‑105460.
[42]As discussed later in this report, Denali officials told us they verify projects’ completion through occasional site visits and document reviews, but this does not include validation of performance measure data. EDA previously conducted random annual site visits to validate performance measures of completed infrastructure projects but stopped in 2020 because of staffing and resource constraints.
[43]EDA officials noted that performance measure data to assess project outputs and outcomes are distinct from the project financial and progress reports used to monitor compliance and implementation.
[44]Because SBRC began awarding grants in fiscal year 2025, it has not yet completed an annual report. SBRC officials told us they plan to report on performance measures collected from grantees. EDA submits data to the Department of Commerce, which displays grant data on its online performance dashboard. The dashboard with EDA data was last updated at the end of fiscal year 2024. EDA representatives told us that the Department of Commerce is reviewing performance data collected across the agency’s divisions to update the dashboard.
[45]A nonfederal entity that expends $1 million or more in federal awards during its fiscal year must have a single or program-specific audit conducted for that year in accordance with Office of Management and Budget uniform grant guidance. 2 C.F.R. § 200.501(a).
[46]See, for example, Jessica Pugil, Bret Sinclair, Paul Wright, Angelica Torres, and Kim Ross, Evaluation of ARC’s Business Development Grants Closed Between 2017–2021 (Washington, D.C.: Appalachian Regional Commission, Oct. 30, 2023) and Jeff Hughes et al., An Evaluation of Appalachian Regional Commission Drinking Water and Wastewater Infrastructure Projects: Fiscal Year 2009–Fiscal Year 2016 (Washington, D.C.: Appalachian Regional Commission, May 12, 2020).
[47]Center for Regional Economic Competitiveness with EntreWorks Consulting, Delta Regional Authority Labor Market and Workforce Report (Clarksdale, MS: Delta Regional Authority, Oct. 2021).
[48]EDA requires that grantees submit these performance measures to assess project outcomes in accordance with the Government Performance and Results Act of 1993, Pub. L. No. 103-62, 107 Stat. 285.
[49]GAO, Economic Development Administration: Actions Needed to Assess Disaster Recovery Outcomes, GAO‑26‑107742 (Washington, D.C.: July 2, 2026). EDA generally agreed with the recommendation but noted that adopting procedures to validate grantee-reported data is dependent on resources, which are finite and determined by congressional appropriations.
[52]Denali Commission, Office of Inspector General, Top Management and Performance Challenges Fiscal Year 2024, 2024-03 (Anchorage, AK: Nov. 2023); Top Management and Performance Challenges Fiscal Year 2025, MR-2025-03 (Anchorage, AK: Nov. 2024); and Top Management and Performance Challenges Fiscal Year 2026, 2026-MGL-02 (Anchorage, AK: Oct. 2025).
[53]Denali Commission, Agency Financial Report Fiscal Year 2024 (Anchorage, AK: Nov. 2024) and Agency Financial Report Fiscal Year 2025 (Anchorage, AK: Nov. 2025).
[54]We previously reported that Tribes may have limited staffing and administrative capacity which makes it challenging to identify, apply for, and monitor funding from federal programs. We found that managing administrative burdens such as reporting requirements can strain Tribes’ staffing capacity and that Tribes may not have program staff or may require additional technical assistance. GAO, Tribal Issues: Barriers to Access to Federal Assistance, GAO‑25‑107674 (Washington, D.C.: Dec. 3, 2024).
[55]Denali Commission, Office of Inspector General, Top Management and Performance Challenges Fiscal Year 2024, and Top Management and Performance Challenges Fiscal Year 2025.
[56]As we have reported, addressing duplication, overlap, and fragmentation among federal programs and activities could save the government tens of billions of dollars. GAO‑15‑49SP; and GAO, 2026 Annual Report: Opportunities to Reduce Duplication, Overlap, and Fragmentation and Achieve an Additional One Hundred Billion Dollars or More in Future Financial Benefits, GAO‑26‑108505 (Washington, D.C.: May 12, 2026). Additionally, we have prior work examining duplication, overlap, fragmentation, and coordination in federal economic development grant programs other than those administered by regional commissions. See GAO-26-107826.
[57]EDA requires applicants to disclose any other applications for federal funding or any federal funding already received that will constitute the nonfederal matching share, though EDA can use this information to find potentially duplicative funding. Additionally, as noted previously, regional commission awards may serve as the nonfederal match for EDA-funded projects, allowing the entities to pursue shared goals without separately funding the same activities which may be complementary rather than duplicative.
[58]As previously discussed, regional commission funds may be used as the nonfederal match in EDA projects. Therefore, a county may receive funding from both EDA and a regional commission for the same project. These data exclude awards for which location data were missing or that covered multiple counties or states.
[59]We have previously reported on the potentially positive effects of fragmentation and overlap. For example, in 2025, we found that certain USDA programs overlap with Department of Health and Human Services programs for older adults. The USDA programs provide nutrition assistance through food packages and vouchers, while the Department of Health and Human Services programs fund home-delivered and congregate meals. Together, these programs serve older adults in different circumstances and help ensure their needs are met. GAO, Older Americans: HHS Should Apply Leading Practices as It Coordinates Overlapping Programs, GAO‑25‑107020 (Washington, D.C.: Jan. 8, 2025).
[60]According to ARC officials, ARC does not have express statutory authority to manage construction grant projects. Rather, ARC’s construction projects are managed by Registered State Basic Agencies or Federal Basic Agencies as set forth in Section 8.1 of the ARC Code.
[61]EDA officials told us the agency refers about 20 percent of Alaska-based grant applications to Denali when Denali is a better fit.
[62]EDA is authorized to transfer funds to other agencies, including regional commissions, for certain economic development projects. 42 U.S.C. § 3124(b). Congress has also directed EDA to transfer funds appropriated for disaster relief to DRA, American Relief Act, 2025. Pub. L. No. 118-158, 138 Stat. 1722, 1734.
[63]See Explanatory Statement for the Departments of Commerce and Justice, Science, and Related Agencies Appropriations Bill, 2023 at 11; Pub. L. No. 117-328, § 4, 136 Stat. 4459, 4462 (2022); S. Rept. No. 118-62, at 13–14 (2023). EDA’s most recent memorandum of agreement for fiscal years 2023 through 2024 establishes that EDA provide DRA with funds assist DRA to assist distressed communities. EDA’s most recent memorandum of agreement for fiscal years 2023 through 2024 establishes that EDA provide DRA with funds to assist distressed communities.
[64]EDA officials told us that it had memorandums of agreement with DRA to facilitate fund transfers beginning in fiscal year 2016. The officials said that the transfers were discontinued after fiscal year 2024 because Congress no longer required them.
[65]EDA officials told us that it had memorandums of agreement with NBRC to facilitate fund transfers beginning in fiscal year 2019. The officials said that the transfers were discontinued after fiscal year 2024 because Congress no longer required them.
[67]42 U.S.C. § 3133.
[68]Where certain commission jurisdictions overlap, the recipients in the overlapping area may select the commission from which they would like to receive funding in a given fiscal year. 40 U.S.C. § 15703. ARC officials stated that as of July 2026, Schoharie County had no active ARC awards in fiscal year 2026 and remained eligible for NBRC funding in that year.
[70]SBRC did not award its first grants until fiscal year 2025.
[71]Fifteen counties are served by more than one regional commission. For the purposes of this analysis, each such county is included in the estimate for every service area in which it is located.
[72]GAO, Evidence-Based Policymaking: Practices to Help Manage and Assess the Results of Federal Efforts, GAO‑23‑105460 (Washington, D.C.: July 2023). For that review, we developed leading performance management practices by examining federal laws and guidance and synthesizing relevant actions from about 200 prior reports. We then refined the practices based on input from officials at 24 major federal agencies and the Office of Management and Budget.
[73]42 U.S.C. § 3133; GAO, Government Performance Management: Leading Practices to Enhance Interagency Collaboration and Address Crosscutting Challenges, GAO‑23‑105520 (Washington, D.C.: May 24, 2023).
[74]GAO, Fragmentation, Overlap, and Duplication: An Evaluation and Management Guide, GAO-15-49SP (Washington, D.C.: Apr. 14, 2015).
[75]SCRC awarded grants only in fiscal year 2024.
[76]Our analysis does not allow changes in economic conditions to be attributed to Economic Development Administration or regional commission grants.
[77]Quarterly Census Employment and Wages data are drawn from administrative data, primarily state unemployment insurance records, and cover more than 95 percent of U.S. jobs at the county, state, and national levels.
[78]SCRC awarded its first grants in fiscal year 2024.