
Report to Congressional Requesters
United States Government Accountability Office
A report to congressional requesters
Contact: David Marroni at MarroniD@gao.gov
What GAO Found
Most of the Department of Commerce’s (Commerce) office space was underutilized in early 2026 when compared to the Utilizing Space Efficiently and Improving Technologies (USE IT) Act target of 60 percent utilization. Specifically, GAO found that about 59 percent of Commerce’s 351 office locations were underutilized across the department and its 13 bureaus. This is consistent with the General Services Administration’s (GSA) 2026 utilization report for Commerce over the same time period. In fiscal year 2025 Commerce spent over $220 million on underutilized office locations.

Commerce collected occupancy data for its largest offices using badge swipes, but most of its office locations reported using a daily check-in survey. However, some bureaus that reported using the daily survey method varied in how they collected occupancy data, and their procedures did not align with GSA’s guidelines. This has affected the accuracy of data collected at some office locations. For example, one bureau reported the number of employees assigned to an office rather than the number of employees physically in the office daily, which overstates the utilization rate. Without implementing survey procedures that align with GSA guidelines, Commerce may continue to provide inaccurate occupancy data for certain locations. This could lead to inaccurate decisions and unnecessary costs for underutilized office locations.
Commerce has some efforts underway to increase utilization, but it has not identified department-wide consolidation opportunities or incorporated them into its real property capital plan. The plan indicates that several bureaus have completed or plan to reduce space. However, GAO’s review of Commerce’s utilization data found that there are 10 metropolitan areas with multiple Commerce bureaus in underutilized office locations, where further consolidation might help the department meet the USE IT Act utilization target. Commerce’s space-matching program, which placed employees in spaces as they returned to the office after the pandemic, has shown that department-wide efforts can be successful. By incorporating a department-wide consolidation plan into its real property capital plan, Commerce would be better positioned to meet utilization requirements in more locations and potentially save tens of millions of dollars by further consolidating or eliminating its office locations.
Why GAO Did This Study
Managing federal real property has been on GAO’s High Risk List for 23 years. In 2023, GAO reported that Commerce and other federal agencies’ headquarters spaces were underutilized and costly. In 2025, Commerce implemented policy changes to bring employees back to the office full-time.
GAO was asked to review Commerce’s office space use nationwide. This report examines (1) the utilization of Commerce’s office space department-wide and the costs of that office space, (2) how Commerce collects occupancy data for its office space, and how that approach affects the accuracy of the data, and (3) the extent to which Commerce is addressing underutilization.
GAO analyzed Commerce’s USE IT Act data submissions for 351 office locations from January 12 through March 6, 2026. GAO calculated average daily utilization of each location by dividing its average daily occupancy over the period by the location’s capacity. GAO also reviewed Commerce real property guidance and summarized cost and collection method data for Commerce’s office space. GAO also visited Commerce office spaces to observe office layouts and use of space in the national capital region, Colorado, and Georgia. GAO selected these areas based on the variety of bureaus present and other factors. Lastly, GAO interviewed GSA and Commerce officials.
What GAO Recommends
GAO is recommending that Commerce (1) develop and implement procedures that align with GSA guidelines for the daily occupancy survey method, and (2) incorporate a department-wide space consolidation plan into its real property capital plan. Commerce concurred with our recommendations.
|
Abbreviations |
|
|
|
|
|
|
|
Census |
U.S. Census Bureau |
|
|
EDA |
Economic Development Administration |
|
|
FY |
fiscal year |
|
|
GSA |
General Services Administration |
|
|
ITA |
International Trade Administration |
|
|
NIST |
National Institute of Standards and Technology |
|
|
NOAA |
National Oceanic and Atmospheric Administration |
|
|
OMB |
Office of Management and Budget |
|
|
USE IT Act |
Utilizing Space Efficiently and Improving Technologies Act |
|
|
USPTO |
U.S. Patent and Trademark Office |
|
This is a work of the U.S. government and is not subject to copyright protection in the United States. The published product may be reproduced and distributed in its entirety without further permission from GAO. However, because this work may contain copyrighted images or other material, permission from the copyright holder may be necessary if you wish to reproduce this material separately.
November 19, 2026
The Honorable Ted Cruz
Chairman
Committee on Commerce, Science, and Transportation
United States Senate
The Honorable Joni K. Ernst
United States Senate
Federal agencies have faced challenges in identifying and disposing of underused buildings for decades. Managing federal real property has remained on GAO’s High Risk List for 23 years, in part because of the government’s large amount of underutilized property.[1] In 2023, we reported that the Department of Commerce and other federal agencies’ headquarters buildings were underutilized and costly.[2] Officials from multiple agencies identified the lack of an agreed-upon way of measuring utilization as a main challenge to increasing utilization, and we recommended that a utilization benchmark be developed and put into use.[3]
Enacted in January 2025, the Utilizing Space Efficiently and Improving Technologies (USE IT) Act established such a benchmark, required Commerce and certain other agencies to collect occupancy data and measure building utilization, and directed the General Services Administration (GSA) and the Office of Management and Budget (OMB) to plan for the reduction of underused space.[4] Specifically, it requires that certain agencies measure the utilization of public buildings by comparing each space’s usable square footage to the building’s occupancy based on a 150 usable square feet per person benchmark. If a tenant agency’s building utilization remains below 60 percent capacity for 2 consecutive years, GSA, in consultation with OMB, must take steps to reduce the amount of underused space.[5] Agencies have reported their utilization data to OMB since May 2025, and GSA released USE IT Act reports for federal agencies in March 2026. As we and GSA have recently reported, office space at federal agencies remains significantly underutilized even after implementing return-to-office policies.[6]
You asked us to review Commerce’s utilization of its office space across the United States. We examined:
· the average daily utilization of Commerce’s office space department-wide and the costs of that space;
· how Commerce collects occupancy data for its office space, and how that approach affects the accuracy of the data; and
· the extent to which Commerce is addressing underutilized office space department-wide.
To determine Commerce’s average daily utilization of its owned and leased office space, we analyzed the department’s USE IT Act occupancy data and usable square feet submissions for the 351 Commerce locations identified as offices for USE IT Act tracking purposes.[7] To calculate the average daily utilization rates for Commerce office locations, we used occupancy data reports for the first four pay periods of 2026 (January 12th–March 6th), the most recent data available at the time of our analysis. This is the same time period used in GSA’s published 2026 USE IT Act reports.
We assessed the reliability of these occupancy data by reviewing related documentation, interviewing Commerce and GSA officials, and reviewing the data for obvious errors and omissions. To ensure consistency, we used the same files that GSA used to publish Commerce data in March 2026 and compared selected results to that data to confirm our analysis. We determined that Commerce occupancy data were sufficiently reliable for the purpose of calculating average daily utilization rates in Commerce office locations, but noted some data collection issues which are discussed in the report.
To calculate the average daily utilization rates for Commerce office space, we:
1. calculated the capacity of each location by dividing the office usable square footage of the space by the 150 usable square feet per person benchmark set by the USE IT Act,
2. analyzed Commerce occupancy data reports to calculate average daily occupancy at each location over the reporting period (40 days), and
3. calculated the average daily utilization rate for each location by dividing its average daily occupancy by its capacity.[8]
This formula is similar to how the USE IT Act defines building utilization.[9]
To identify the costs of Commerce office space, we collected and analyzed available rent, operations, and maintenance cost data for those locations from Commerce and GSA. For federally owned space, we collected annual operations and maintenance costs for fiscal year (FY) 2025, the most recent full-year data available. For federally leased space, we collected annual rent data for FY 2025 from Commerce and GSA, and operations and maintenance costs if available. We assessed the reliability of these data by conducting tests during our own analysis, reviewing related documentation, and interviewing Commerce and GSA officials. We determined the data were sufficiently reliable to summarize the cost of Commerce’s office space.
To examine how Commerce collects occupancy data for its office space, and how that approach affects the accuracy of the data, we reviewed the data submitted by Commerce as part of USE IT Act requirements discussed above. These submissions included the method each office reports using to collect occupancy data. In addition, we reviewed OMB and GSA guidelines on USE IT data collection tools. We also interviewed Commerce and bureau officials about the data collection tools they use for occupancy data reports. We compared Commerce’s data collection efforts to guidelines provided by GSA on these tools. We assessed the reliability of these data by conducting tests during analyses, reviewing related documentation, and interviewing Commerce officials, and found the data to be sufficiently reliable for summarizing the data collection methods Commerce office locations report using for USE IT Act data submissions.
To evaluate the extent to which Commerce is addressing underutilization department-wide, we interviewed officials from Commerce and selected bureaus, including the four bureaus with the largest real property portfolios.[10] We visited a non-generalizable selection of 15 Commerce and bureau headquarters and field locations in the National Capital Region, Colorado, and Georgia to observe the layout and use of office space. We selected field offices based on the variety of bureaus present in a location and a range of average daily utilization rates reported over two pay periods in September and November 2025. Further, we reviewed Commerce’s FY 2025 and FY 2026 real property capital plans and internal guidance on space sharing. We compared Commerce’s actions to requirements outlined in OMB’s guidance on real property capital planning.[11]
We conducted this performance audit from December 2025 to November 2026 in accordance with generally accepted government auditing standards. Those standards require that we plan and perform the audit to obtain sufficient, appropriate evidence to provide a reasonable basis for our findings and conclusions based on our audit objectives. We believe that the evidence obtained provides a reasonable basis for our findings and conclusions based on our audit objectives.
Background
Commerce Real Property Portfolio
Commerce and its 13 bureaus hold approximately 17.6 million square feet of owned and leased space, according to the department’s FY 2026 real property capital plan.[12] This includes space that Commerce owns or directly leases and GSA-owned or -leased space that the department occupies. About 89 percent of Commerce’s real property footprint is occupied by four bureaus: the National Oceanic and Atmospheric Administration (NOAA), the U.S. Patent and Trademark Office (USPTO), the U.S. Census Bureau (Census), and the National Institute of Standards and Technology (NIST). Commerce’s real property portfolio includes office buildings (such as the Herbert C. Hoover Building, the department’s headquarters), warehouses, and laboratories, as well as non-occupied facilities like radio towers and boat docks.
Commerce and its bureaus have office locations in 49 states that are subject to USE IT Act requirements.[13] These spaces include several bureau headquarters locations in the National Capital Region, as well as smaller regional bureau offices and buildings with specific missions like Weather Forecasting offices. GSA officials told us that they put together the initial list of Commerce office spaces for USE IT Act reporting, and Commerce officials said they later removed warehouses and data centers from that list.
Commerce Office Space
Under the USE IT Act reporting guidelines established by GSA, agencies report the usable square footage of each office space (described as “office usable square feet” in GSA’s public USE IT Act reports) along with occupancy data each pay period. The usable square feet of an office space affects the estimated capacity of that space; with a smaller footprint and the same number of employees, utilization increases. GSA guidelines allow agencies to exclude certain spaces that are not considered “typical office space.” For example, agencies may exclude laboratories, fitness centers, mail centers, and secure storage from a location’s usable square feet.
Commerce’s reported USE IT Act office space totaled over 6 million usable square feet, as of March 2026. Commerce officials told us that they went through an iterative process to exclude certain spaces based on GSA guidelines and adjust the usable square feet of the department’s office locations. Officials focused on the largest locations during this process, and the department expects to make further changes to usable square feet for future USE IT Act submissions.[14]
Occupancy Data Collection Tools
GSA provided federal agencies with a list of 11 data collection tools that can be used to collect occupancy data for USE IT Act reporting. In 2025, OMB released guidance stating that federal agencies must implement one or more of these tools to ensure consistent measurement across buildings.[15] The approved methods include badge swipes, timecard analysis, daily check-in surveys, and reservation systems.
Most of Commerce’s Office Space Is Underutilized and Costs Hundreds of Millions of Dollars Annually
Most Commerce Office Locations Were Underutilized in Early 2026
In our review of Commerce’s occupancy data, we found that most of Commerce’s office locations were underutilized from January 12 through March 6, 2026.[16] Specifically, about 59 percent of Commerce’s 351 office locations (207) were underutilized compared to the USE IT Act target of 60 percent. The average daily utilization rate of all Commerce office locations was approximately 41 percent department-wide, which aligned with Commerce’s utilization rate reported in GSA’s March 2026 USE IT Act report.[17]
We also found that the average daily utilization rates between owned and leased office locations were similar. Of the 351 office locations used by Commerce, the agency owned 161 office locations and leased 32, while GSA owned 49 office locations and leased 109. During the reporting period, leased office locations had an average daily utilization rate of approximately 39 percent on average while owned office locations had an average daily utilization rate of approximately 43 percent.
Average daily utilization rates varied by the size of the space. Our analysis showed that Commerce’s largest office locations had the lowest average daily utilization rates for the reporting period (see fig. 1). We divided Commerce’s office locations into four equal groups (quartiles) based on the usable square feet of each location, and labeled the quartiles as very small, small, medium, and large. Large office locations —ranging from 8,095 to 852,858 usable square feet —had the lowest average daily utilization rate of approximately 38 percent. However, small office locations between 2,094 and 4,008 usable square feet reported an average daily utilization rate of approximately 76 percent, which would meet the USE IT Act target.
Figure 1: Average Daily Utilization Rate of Department of Commerce Office Locations from January 12 through March 6, 2026, Divided into Quartiles by Usable Square Feet

Note: Capacity is calculated by dividing the location’s usable square feet by 150, the benchmark established by the Utilizing Space Efficiently and Improving Technologies (USE IT) Act. A location’s average daily utilization rate is its average daily attendance divided by its capacity. We used the Department of Commerce’s occupancy data from January 12 through March 6, 2026. The period included two federal holidays, which may affect utilization rates. According to General Services Administration reporting guidelines, federal holidays are counted as reporting days. To generate quartiles by size, we sorted the 351 unique office locations by usable square feet and grouped them into four quartiles of about equal size. Usable square feet is rounded to the nearest foot.
Officials we interviewed from 10 Commerce bureaus said resource constraints, existing building configurations, and mission needs make it challenging to increase utilization. We observed some of these challenges at several office locations:
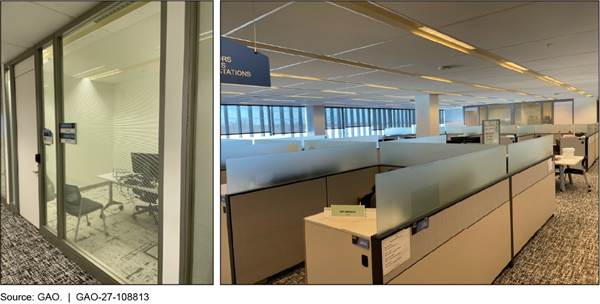
· Herbert C. Hoover Building (Commerce Headquarters), Washington, D.C. Commerce headquarters officials said that it would cost at least $850 million to configure the building for more employees and meet the USE IT Act’s 150 usable square feet per person benchmark. Officials said the estimate was based on design options to ensure the building’s historical preservation and the unique layout of the building. While Commerce began an eight-phase remodel of the building in 2008, only four phases were completed.[18] They also said that without further construction, sections of the building cannot house additional employees (see fig. 2). In early 2026, the building’s average daily utilization rate was approximately 28 percent.
Figure 2: Examples of Underutilized Space – Former Library Spaces at the Department of Commerce Headquarters (Washington, D.C.)

· NIST Boulder Labs, Boulder, CO. NIST officials told us that office space in this location is designed around the bureau’s laboratories. If a person is a scientist, they often are assigned both a lab and an office space, which is built close to the lab to allow for ease of movement between spaces. Consolidating these facilities, according to officials, would not be cost-effective.
· Bureau of Industry and Security, Atlanta, GA. Bureau officials said meeting the 150 usable square feet per person benchmark in the office was not possible given the specialized law enforcement spaces it requires to meet its mission. They said these spaces include the need for private offices for each agent as well as offices for attorneys, partner law enforcement agency personnel, and U.S. attorney personnel.
Commerce Spends Hundreds of Millions of Dollars Each Year on Underutilized Office Locations
Commerce spends hundreds of millions of dollars annually on operations and maintenance and rent for its office space.[19] In FY 2025, Commerce spent over $240 million on operations and maintenance and rent on the 351 office locations in our analysis.[20] Specifically, Commerce spent over $28 million on operations and maintenance for owned office locations and paid over $197 million in rent to GSA. Commerce spent the remaining funds (nearly $15 million) on costs for Commerce-leased locations.
Our analysis found that underutilized office locations (207 of 351) cost Commerce $220 million in FY 2025. As shown in table 1, nearly all of Commerce’s most expensive office locations (nine of 10) were underutilized in early 2026.[21] Those nine buildings cost Commerce over $160 million in FY 2025.
Table 1: Commerce Office Locations with the Highest Combined Rent and Operations and Maintenance Costs for Fiscal Year 2025, with Average Daily Utilization Rate for the First Reporting Period of 2026
|
Office location |
Owned or leased |
Usable square feet |
Estimated |
Total costs in |
Average daily |
||
|
U.S. Patent and Trademark |
GSA-leased |
843,924 |
5,626 |
$65,208,543 |
43% |
||
|
U.S. Department of Commerce Headquarters |
GSA-owned |
852,858 |
5,686 |
$41,188,877 |
28% |
||
|
National Oceanic and Atmospheric Administration
(NOAA) |
GSA-leased |
370,247 |
2,468 |
$18,424,294 |
27% |
||
|
NOAA |
GSA-leased |
221,319 |
1,475 |
$10,203,548 |
15% |
||
|
NOAA |
GSA-leased |
156,202 |
1,041 |
$7,466,331 |
32% |
||
|
Bureau of Economic Analysis, U.S. Census Bureau |
GSA-owned |
142,379 |
949 |
$6,228,546 |
37% |
||
|
U.S. Census Bureau |
GSA-owned |
521,716 |
3,478 |
$5,320,978 |
45% |
||
|
NOAA |
Commerce-leased |
92,727 |
618 |
$ 3,389,613 |
43% |
||
|
NOAA |
Commerce-leased |
68,615 |
457 |
$ 2,812,590 |
47% |
||
|
NOAA |
Commerce-leased |
12,601 |
84 |
$2,590,961 |
68% |
||
Source: GAO analysis of Department of Commerce (Commerce) and General Services Administration (GSA) data. | GAO‑27‑108813
aBuilding capacity is calculated by dividing the location’s usable square feet by 150, the benchmark established by the Utilizing Space Efficiently and Improving Technologies (USE IT) Act.
bFor buildings Commerce owns, Commerce pays operations and maintenance costs such as custodial, utility, and other maintenance related expenses. For office space Commerce leases directly, Commerce pays annual rent and may pay operations and maintenance costs, depending on the terms of the lease. Lastly, for office space Commerce leases from GSA, Commerce pays annual rent to GSA, which includes operations and maintenance costs.
cAverage daily utilization rate is based on GAO’s analysis of Commerce USE IT Act occupancy data submissions from January 12 through March 6, 2026.
dThe NOAA Silver Spring campus is comprised of four buildings: Silver Spring Metro Center Campus (SSMC) 1; SSMC 2; SSMC 3; SSMC 4.
eThe Bureau of Economic Analysis and the U.S. Census Bureau are co-located in the South building in Suitland, MD.
Commerce is also responsible for deferred maintenance and liabilities for some of its buildings. For instance, NIST officials told us that as of February 2026, deferred maintenance for one building on the Gaithersburg campus was over $105 million. Additionally, both Commerce and GSA officials told us that GSA delegated the responsibility for operations and maintenance to Commerce for the headquarters building. In January 2026, GSA officials said that deferred liabilities for the headquarters building were approximately $588 million, which represented most of the value of the building.
Commerce has considered several ways to address real property costs and the department’s deferred maintenance backlog. In the department’s FY 2025 real property capital plan, the department proposed a shift to leasing certain office and mission critical facilities rather than owning them. However, in its FY 2026 real property capital plan Commerce’s priorities have shifted to consolidating spaces and addressing deferred maintenance. Commerce officials told us that moving to leasing is not a current priority as Commerce and other federal agencies are focusing on eliminating underutilized properties.
Commerce Survey Data Overstated Some Locations’ Occupancy, Reducing the Accuracy of Its Calculated Utilization Rates
Most Commerce office locations reported collecting occupancy data via a daily check-in survey. Nearly all the office locations that reported using a survey belonged to three bureaus: NOAA, the International Trade Administration (ITA), and the Economic Development Administration (EDA). Overall, Commerce reported using three GSA-approved tools for collecting occupancy data: daily check-in surveys; badge card readers; and timecard analysis (see figure 3).[22]
Figure 3: Number of Department of Commerce and Bureau Office Locations Using Identified Data Collection Tools to Collect Occupancy Data, January 12 through March 6, 2026
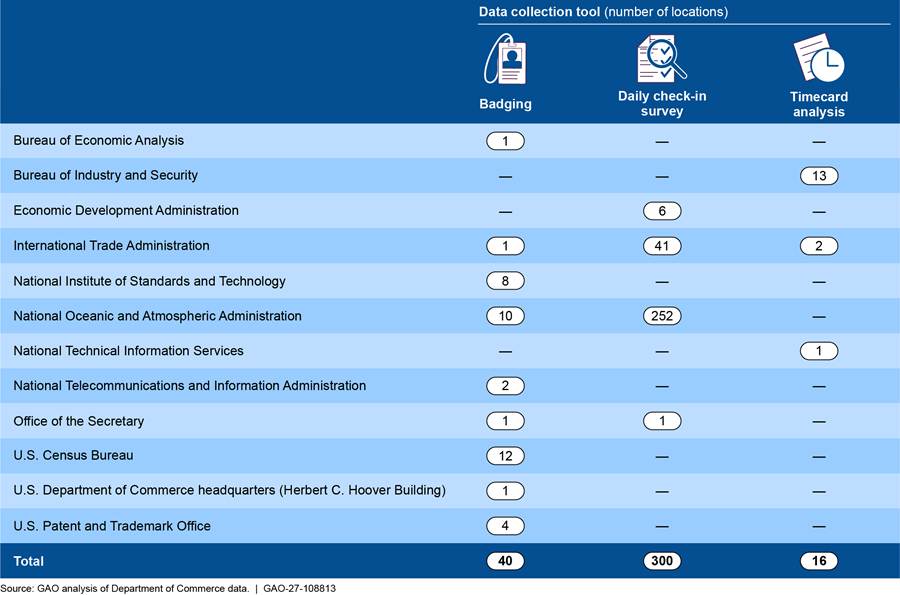
Note: For certain Commerce office locations, two bureaus may be in the same office building. For example, the U.S. Census Bureau and the Bureau of Economic Analysis headquarters are co-located in the South Suitland Federal Building, Suitland, MD. As a result, locations may be overcounted in this table. In addition, the National Oceanic and Atmospheric Association provided revised data for these locations in November 2026, which is reflected in this figure.
Across Commerce’s portfolio the data collection method chosen generally aligned with building size. For example, nearly all (92 percent) of Commerce’s smallest office locations reported using the survey method, while large headquarters buildings, such as the Herbert C. Hoover building, used badge card readers. The badge swipe method captured more employees than any other method, since larger locations that were most likely to use badge swipes tended to have more employees.[23]
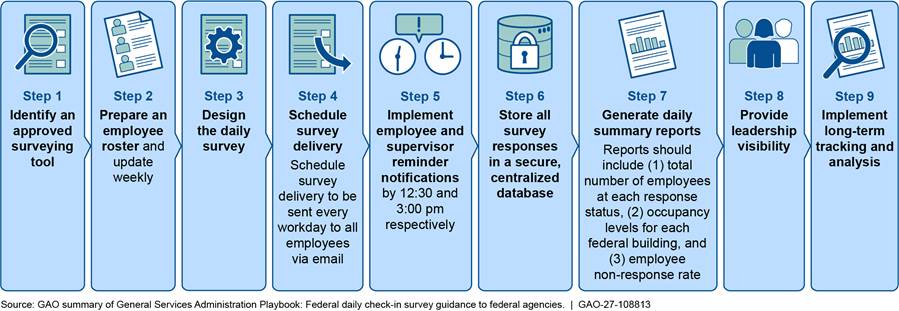
GSA has issued guidelines to federal agencies that choose to implement a daily check-in survey tool. Specifically, GSA identified nine steps for federal agencies to monitor employee occupancy using this method (see fig. 4). For example, employees are required to respond to a daily email asking where they are located for that day. According to GSA, federal agencies that implement these steps will be considered to have accurately monitored building occupancy.
During our site visits to offices from three bureaus that reported using the daily check-in survey, we observed different methods of collecting occupancy data:
· ITA. An employee at one ITA field office we visited said that a supervisor outside of the state remotely monitored daily occupancy by looking at employees’ calendars or speaking with them. According to this employee, the supervisor entered the information on a shared spreadsheet daily or at the end of the pay period. The spreadsheet was then sent to ITA’s point of contact who submitted it to Commerce. The use of calendars may result in inaccuracies in tracking, as not all employees may indicate where they are located that day.
· EDA. Officials at one EDA field office said they used visual analysis to collect occupancy data. Specifically, they said an employee verified employees’ in-office presence through visual observation twice a day during the reporting period. While visual analysis is on GSA’s list of occupancy data collection tools, it is not the method the bureau reported using. Additionally, the field office relied on one supervisor, rather than employees self-reporting if they were in the office. EDA officials later told us that the bureau reported using visual analysis because it was the most common data collection method used across its offices.
· NOAA. NOAA did not collect daily occupancy data at many of its field locations, including Weather Forecasting Offices. Instead the bureau reported the total number of employees assigned to a building, leading to overstated utilization rates. For example, NOAA employees at a Weather Forecasting Office we visited told us that approximately 12 to 15 employees were in the office at one time each day. However, NOAA’s reported occupancy data indicated that 40 employees were in that office daily, which was incorrect, as the agency based its reporting on the total number of employees assigned to the location rather than the number of employees who were physically present. As a result, NOAA reported that the building was 72 percent utilized when it should have reported the building was about 27 percent utilized if an average of 15 employees were in the office each day. NOAA officials later told us that with 24-hour shifts, the total number of employees in the Weather Forecasting Office, each day, is closer to the assigned number for the building. While NOAA reported using the survey method, NOAA did not apply the survey method in its data submissions to Commerce.
At each of these three locations, bureaus did not follow GSA survey guidelines, with various explanations provided by officials. For example, NOAA officials said the bureau’s leadership did not want to have employees divert time from their primary mission to collect daily occupancy data. Officials also said resource constraints affected occupancy data collection, and NOAA leadership did not want to use funding to install expensive badge card readers at small Weather Forecasting Offices. In September 2026, NOAA officials told us that they plan to develop a compliant methodology to account for staff in remaining offices without badge readers but did not provide details or a timeline for doing so. In addition, officials told us in November 2026 that in general ITA field offices follow procedures similar to GSA’s guidance, but that the bureau is taking steps to further improve documentation and align with GSA’s recommended practices. Commerce headquarters officials, who submit occupancy data to GSA, said that bureaus are ultimately responsible for how they measure employee occupancy.
If Commerce bureaus continue to use incorrect survey methods, they will report inaccurate calculated utilization rates. For example, reporting the number of assigned employees instead of the actual personnel in the space will overstate utilization rates. Our analysis found that at least 49 Commerce office locations were submitting the same number of employees for each day of the reporting period, with no variation. This indicates these locations were likely reporting the number of personnel assigned to them rather than daily occupancy data as required.[24]
Commerce is responsible for providing GSA with accurate occupancy data and utilization rates, which determines whether a location meets the USE IT Act target. Without implementing daily check-in survey procedures that align with GSA’s guidelines, bureaus may continue to provide inaccurate occupancy data for some office locations. As a result, Commerce and GSA may continue to incur unnecessary costs for office locations with underutilized space.
Despite Some Efforts, Commerce Has Not Identified Department-Wide Consolidation Opportunities
Some Efforts Underway to Increase Utilization
Officials we interviewed from Commerce and selected bureaus have some efforts underway to increase utilization through approaches like co-locating employees, consolidation into smaller space, reducing field office space, and disposing of space.
· Co-locating employees. Commerce has created a space-matching program across the department’s bureaus to accommodate return to office mandates following the COVID-19 pandemic. Officials stated that nearly 3,000 employees were placed in existing offices as part of the department’s return to office. We observed this in offices we visited; for example, officials at the EDA office in Denver, Colorado told us that the office hosts three National Telecommunications and Information Administration staff. In addition, the National Telecommunications and Information Administration FirstNet office in Boulder, Colorado hosts nine employees from other federal agencies as well as one Department of Commerce employee.
Commerce’s Office of General Counsel finalized a template memorandum of understanding in November 2025 for Commerce bureaus to use to share space. This allows bureaus to enter into agreements for employees of one bureau to work in another bureau’s office space without further legal review. Officials told us that this memorandum has improved the space sharing process across bureaus, as it allows employees to share space without an interagency agreement or GSA approval.
· Consolidation into smaller spaces. Census now shares its headquarters complex of two buildings with the Bureau of Economic Analysis, and Census officials said the Bureau of Labor Statistics was also moving into the complex. Census officials told us that the bureau reduced space by 40 percent to allow the Bureau of Labor Statistics to move into the building, then brought all Census employees back into the smaller remodeled space with return-to-office requirements. This significantly increased utilization for the remodeled space (see fig. 5). Our analysis estimates that Census’ average daily utilization in one building in the complex would have been less than 9 percent in the early 2026 reporting period without these consolidations, compared to the 59 percent reported in our analysis.[25]
In addition, NOAA officials told us that they plan to significantly reduce space in the bureau’s Silver Spring headquarters to meet USE IT Act requirements. However, this will require a significant resource investment. NOAA officials said that GSA estimates the reconfiguration may cost over $100 million.
· Reducing field office space. EDA officials told us the Atlanta field office will vacate its current space in 2027 and will move into another GSA-owned building. The current office location has about 9,000 usable square feet, while the new location will have about 3,750 usable square feet. Officials told us the new office will provide workspaces for almost 75 percent of the number of people (25 compared to 35 previously) in less than half the space and is projected to meet the 150 square feet per person USE IT Act benchmark when all workspaces are occupied. As illustrated in figure 6 below, the average daily utilization rate could potentially increase from 19 percent to 44 percent in the smaller office space (assuming current occupancy levels). With four additional people on-site per day, the new office would meet the 60 percent utilization target.
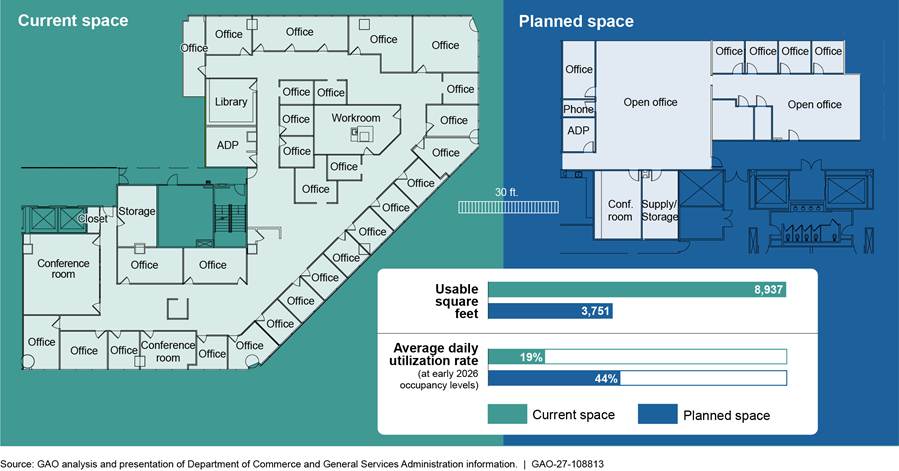
Note: With early 2026 occupancy levels, the planned space will not meet the 60 percent utilization target. Our analysis estimates that the Economic Development Administration would meet the target with four additional people on site per day.
Commerce officials stated that they are also drafting a department-wide administrative order that will require bureaus to meet the USE IT Act benchmark of 150 usable square feet per person when designing new or renovated office spaces.[26] Officials told us that after this order is published, bureaus will draft their own administrative orders implementing this requirement. This order is intended to increase utilization of future office spaces and ensure that, with some flexibility, Commerce meets USE IT Act requirements. In September 2026, officials told us the administrative order is going through the internal review process.
· Disposing of space. In March 2026, USPTO closed its Denver field office, which bureau officials said was not occupied at a high enough rate to meet utilization requirements. The bureau plans to open three community outreach centers to replace this office, shrinking its footprint and potentially saving around $3.3 million annually.
At the department level, Commerce’s FY 2025 and FY2026 real property capital plans outline efforts to dispose of warehouse space as well as office space in the near future. For example, Census plans to significantly shrink the footprint of its Jeffersonville, Indiana, campus. The total square footage of the warehouses and offices there is expected to be reduced from 700,000 to approximately 300,000 square feet; most of this is industrial space.[27]
Commerce Has Not Identified Department-Wide Consolidation Opportunities
Our review of Commerce data shows that there are 10 metropolitan areas with multiple bureaus in underutilized office locations, where consolidation could potentially help the department meet the USE IT Act utilization target. For example, Atlanta, Georgia; Portland, Oregon; and San Jose, California, each have at least three Commerce bureaus in underutilized office space, as of early 2026.[28] Depending on mission needs, these offices could be consolidated to increase utilization rates and use office space more efficiently.
While Commerce is taking some steps to increase utilization department-wide through administrative orders and employee space-sharing, the department has not developed a broader plan that identifies opportunities to consolidate space across bureaus. The department also does not incorporate space-maximizing strategies, such as a desk reservation system or reconfiguring offices, into its FY 2025 or FY 2026 real property capital plans. As we have previously reported, GSA and architectural firms have found that these strategies can increase space utilization.[29] We observed some of these strategies at the remodeled Census headquarters, where officials told us they have reconfigured spaces to primarily focus on cubicles and have converted storage areas to workspaces. Communicating these strategies could better position Commerce as it reduces space.
In its FY 2025 and FY 2026 real property capital plans, Commerce instead outlines what individual bureaus are doing to identify their own property needs and reduce space. Commerce states in the plans that the annual budget process does not allow for a department-wide prioritization of facility investments, because each bureau receives an individual budget appropriation from Congress. However, the department has proven that department-wide efforts are possible, as demonstrated by the success of the department’s space-matching program. In addition, a holistic review of space utilization across its bureaus and offices may help Commerce identify further opportunities to consolidate and share space that may not be readily apparent at the bureau or office level.
OMB’s guidance instructs agencies including Commerce to assess and dispose of unneeded space. Specifically, OMB’s Capital Programming Guide, which outlines best practices for capital asset management, states that federal agencies are expected to dispose of unneeded assets to ensure that real property inventory is maintained at the right size, cost, and condition.[30] In addition, OMB’s memorandum on Implementation of Agency-wide Real Property Capital Planning states that an agency’s capital plan must include 1) a needs assessment that identifies gaps in an agency’s portfolio (including space utilization) and 2) performance goals and metrics that address those gaps.[31] In Commerce’s FY 2025 and FY 2026 real property capital plans, the department lists “reducing owned office and warehouse space” as a performance goal. Developing a department-wide consolidation plan with space-maximizing strategies, measurable goals, and an implementation timeline would create actionable steps that Commerce can measure against while working towards USE IT Act utilization targets.
Occupancy data collected for the USE IT Act provides Commerce with an opportunity to analyze utilization across bureaus and work towards meeting USE IT Act requirements. The USE IT Act requires GSA and OMB to take steps to reduce unneeded space if tenant agencies have failed to meet 60 percent utilization for that space for 2 consecutive years. In addition, in July 2026 the Federal Real Property Council directed federal agencies to outline how they are implementing USE IT Act requirements in their real property capital plans. Commerce included these requirements and its 2026 utilization data in the agency’s FY 2026 real property capital plan, as a target for the agency to make progress toward in future years. By incorporating a department-wide consolidation plan into the department’s real property capital plan, Commerce would be better positioned to meet USE IT Act utilization requirements in more locations and could potentially save tens of millions of dollars by further consolidating or eliminating office buildings.
Conclusions
Commerce’s office space is significantly underutilized and costs hundreds of millions of dollars each year to operate and maintain. Commerce has taken steps to address this problem by beginning to measure the occupancy of its office space department-wide and reducing some unneeded space.
However, several Commerce bureaus are collecting occupancy data using methods that do not follow GSA guidelines, resulting in inaccurate and overstated utilization rates for certain office spaces. Without implementing survey procedures that align with GSA guidelines, Commerce and GSA may not have data of sufficient quality to make well-informed decisions about Commerce’s real property portfolio and may continue to incur unnecessary costs for underutilized office locations.
While Commerce has taken steps to help bureaus increase utilization, the agency could do more to facilitate these efforts across the department. Incorporating a department-wide consolidation plan and space-maximizing strategies into the agency’s real property capital plan could help Commerce meet utilization requirements in the future, leading to cost savings of potentially tens of millions of dollars.
Recommendations for Executive Action
We are making the following two recommendations to Commerce:
The Secretary of Commerce should ensure that the bureaus that use the daily check-in survey method for collecting occupancy data develop and implement procedures that align with those listed within the U.S. General Services Administration-Playbook: Federal daily check-in-survey. (Recommendation 1)
The Secretary of Commerce should incorporate into the department’s real property capital plan a department-wide office space consolidation plan that includes space-maximizing strategies, measurable goals, and an implementation timeline, to assist in meeting utilization benchmarks and disposing of unneeded office space. (Recommendation 2)
Agency Comments
We provided a draft of this report to Commerce and GSA for review and comment. Commerce concurred with the recommendations and provided technical comments, which we incorporated as appropriate. GSA did not have any comments on the report.
We are sending copies of this report to the appropriate congressional committees, the Secretary of Commerce, and the Administrator of the General Services Administration. In addition, the report is available at no charge on the GAO website at https://www.gao.gov.
If you or your staff have any questions about this report, please contact me at MarroniD@gao.gov. Contact points for our Offices of Congressional Relations and Media Relations may be found on the last page of this report. GAO staff who made significant contributions to this report are listed in appendix I.

David Marroni
Director, Physical Infrastructure
GAO Contact
David Marroni at MarroniD@gao.gov
Staff Acknowledgments
In addition to the contact named above, Keith Cunningham (Assistant Director); Melissa Greenaway (Analyst in Charge); Melissa Bodeau; Emily Crofford; Regina Morrison; Josh Ormond; Minette Richardson; and Kelly Rubin made key contributions to this report.
The Government Accountability Office, the audit, evaluation, and investigative arm of Congress, exists to support Congress in meeting its constitutional responsibilities and to help improve the performance and accountability of the federal government for the American people. GAO examines the use of public funds; evaluates federal programs and policies; and provides analyses, recommendations, and other assistance to help Congress make informed oversight, policy, and funding decisions. GAO’s commitment to good government is reflected in its core values of accountability, integrity, and reliability.
Obtaining Copies of GAO Reports and Testimony
The fastest and easiest way to obtain copies of GAO documents at no cost is through our website. Each weekday, GAO posts on its website newly released reports, testimonies, and correspondence. You can also subscribe to GAO’s email updates to receive notification of newly posted products.
Connect with GAO
Connect with GAO on X,
LinkedIn, Instagram, and YouTube.
Subscribe to our Email Updates. Listen to our Podcasts.
Visit GAO on the web at https://www.gao.gov.
To Report Fraud, Waste, and Abuse in Federal Programs
Contact FraudNet:
Website: https://www.gao.gov/about/what-gao-does/fraudnet
Automated answering system: (800) 424-5454
Media Relations
Sarah Kaczmarek, Managing Director, Media@gao.gov
Congressional Relations
David A. Powner, Acting Managing Director, CongRel@gao.gov
General Inquiries
[1]GAO, High Risk Series: Heightened Attention Could Save Billions More and Improve Government Efficiency and Effectiveness, GAO‑25‑107743 (Washington, D.C.: Feb. 25, 2025). Since the early 1990s, the high-risk program has focused attention on government operations with significant vulnerabilities to fraud, waste, abuse, and mismanagement or that need transformation to address economy, efficiency, or effectiveness challenges.
[2]GAO, Federal Real Property: Agencies Need New Benchmarks to Measure and Shed Underutilized Space, GAO‑24‑107006 (Washington, D.C.: Oct. 26, 2023) and GAO, Federal Real Property: Agencies Should Provide More Information about Increases in Deferred Maintenance and Repair, GAO‑24‑105485 (Washington, D.C.: Nov. 16, 2023).
[3]Another challenge to increasing utilization cited by officials in 2023 was uncertainty about the future of in-office attendance policies. At that time, agency officials said that their in-office workforce had not returned to pre-pandemic levels due to increased use of telework and remote work. Since then, a 2025 presidential memorandum directed federal agencies to take steps to terminate remote work agreements and required most employees to return to work in person on a full-time basis. Return to In-Person Work, 90 Fed. Reg. 8251 (Jan. 20, 2025). That same year, Commerce implemented policy changes to bring its employees back to the office full-time.
[4]Thomas R. Carper Water Resources Development Act of 2024, Pub. L. No. 118-272, div. B, tit. III § 2302, 138 Stat. 2992, 3218 (2025).
[5]A tenant agency is a federal agency that has an occupancy agreement to occupy a government-owned office space or government-leased commercial space.
[6]GAO, Federal Real Property: Further Consolidating DOT Office Space Could Save Hundreds of Millions of Dollars, GAO‑26‑108089 (Washington, D.C.: July 15, 2026).
[7]Commerce reports utilization by occupancy agreement; we aggregated office spaces located in the same building. For example, if more than one bureau is in the same building or a bureau has multiple leases for spaces in a building, Commerce submits separate occupancy data on each space. In this report, we report the average daily utilization of a location as a whole. We also excluded three locations that report zero usable square feet of office space, because Commerce officials told us they zeroed out this number for locations that were not actually offices.
[8]Agencies report both the total usable square feet and the reduced “office usable square feet” of each location to GSA. For office usable square feet, agencies remove areas not considered “typical office space” such as public-facing waiting areas. Our analysis uses the reported office usable square feet for each location, without these areas included.
[9]In our analysis, we define occupancy as the daily average number of employees actually performing duties in person over 40 days, while the USE IT Act defines occupancy as average number of employees actually performing duties in person for 40 hours a week over a 2-month period. The pay periods we analyzed included two federal holidays, which may have affected utilization rates. GSA reporting guidelines state that federal holidays count as reporting days. Agencies must monitor and report occupancy data to OMB every two weeks. See OMB, Memorandum: Implementation of the Utilizing Space Efficiently and Improving Technologies Act (Washington, D.C.: April 21, 2025).
[10]Commerce has 13 bureaus. The four largest bureaus, in terms of reported usable square feet, include the National Oceanic and Atmospheric Administration (NOAA), U.S. Patent and Trademark Office (USPTO), U.S. Census Bureau (Census), and the National Institute of Standards and Technology (NIST). We also interviewed officials from the Bureau of Economic Analysis (BEA), Bureau of Industry and Security (BIS), Economic Development Administration (EDA), International Trade Administration (ITA), and National Telecommunications and Information Administration (NTIA).
[11]See Office of Management and Budget, M-20-03, Memorandum: Implementation of Agency-wide Real Property Capital Planning (Nov. 6, 2019); Office of Management and Budget, Capital Programming Guide (Washington: D.C.: Aug. 2025).
[12]Commerce’s 13 bureaus are: the BEA, BIS, EDA, ITA, Minority Business Development Agency (MBDA), NIST, NOAA, National Technical Information Service (NTIS), NTIA, Census, USPTO, Office of the Under Secretary for Economic Affairs (OUS/EA), and the Office of the Secretary (OS).
[13]Commerce has additional office locations in several U.S. territories, which were included in our overall analysis.
[14]In October 2026, we reported on how GSA guidelines affect the measurement of utilization across federal agencies. GAO, Federal Real Property: New Occupancy Data Help Agencies Shed Unneeded Office Space But Gaps Limit the Full Picture, GAO‑27‑108503 (Washington, D.C.: Oct. 15, 2026).
[15]Office of Management and Budget, M-25-25, Memorandum: Implementation of the Utilizing Space Efficiently and Improving Technologies Act (April 21, 2025).
[16]In this report, underutilized means the average daily utilization rate was below 60 percent on average, which is the target established by the USE IT Act.
[17]While our utilization rates generally matched GSA’s published data, our analysis summarized utilization at the office location level (combining multiple occupancy agreements), thus the number of locations will not align with GSA’s published data. As directed by OMB, GSA reported utilization rates for the Department of Commerce by occupancy agreement for owned and leased office spaces. An agency may have multiple occupancy agreements within a single building.
[18]According to Commerce officials, the project was not completed as Congress has not appropriated funding for the final four phases.
[19]For buildings Commerce owns, Commerce pays operations and maintenance costs such as custodial, utility, and other maintenance-related expenses. For office space Commerce leases directly, Commerce pays annual rent and may pay operations and maintenance costs, depending on the terms of the lease. Lastly, for office space Commerce leases from GSA, Commerce pays annual rent to GSA, which includes operations and maintenance costs.
[20]We used fiscal year 2025 data because it was the most recent full-year data available.
[21]As previously noted, the reporting period for our utilization analysis was from January 12 through March 6, 2026.
[22]Federal agencies subject to the USE IT Act are required to use Personal Identity Verification (PIV) card technology, also referred to as badge swipes, and other technologies that the GSA Administrator determines to be appropriate. In May 2025, GSA posted guidelines on its website that included a list of approved occupancy data collection technologies and methods.
[23]Our references to small and large office locations are from the quartiles identified in figure 1.
[24]As we reported in July 2026, according to architecture/engineering firms we spoke to, about 60 to 70 percent of employees assigned to an office are likely to be present on any given day due to vacation, sick days, and off-site work duties, among other reasons. GAO‑26‑108089.
[25]The 59 percent utilization number is calculated for Census’ office space within one building. Utilization calculations for each building as a whole are presented in table 1 earlier in this report.
[26]Officials said they are drafting this order in response to OMB’s USE IT guidance. Office of Management and Budget, M-25-25, Memorandum: Implementation of the Utilizing Space Efficiently and Improving Technologies Act (April 21, 2025).
[27]Warehouse space is not considered typical office space under the GSA’s USE IT Act reporting guidelines. While there may be financial or practical benefits in reducing this unused space, the warehouse portion will not affect Commerce’s utilization rates.
[28]As described earlier in this report, we calculated average daily utilization rates from January 12 through March 6, 2026, the same period used in GSA’s 2026 USE IT Act reports. The other seven metropolitan areas are Boulder, Colorado; Miami, Florida; Philadelphia, Pennsylvania; Salt Lake City, Utah; San Diego, California; Seattle, Washington; and the National Capital Region.
[30]Office of Management and Budget, Capital Programming Guide (Washington: D.C.: Aug. 2025). The Capital Programing Guide is a supplement to the OMB’s Circular A-11, which provides agencies detailed guidance on preparing annual budget submissions. Office of Management and Budget, Circular A-11: Preparation, Submission, and Execution of the Budget (Washington: D.C., Aug. 2025).
[31]Office of Management and Budget, M-20-03, Memorandum: Implementation of Agency-wide Real Property Capital Planning (Nov. 6, 2019).