
Report to Congressional Requesters
United States Government Accountability Office
A report to congressional requesters
Contact: Elizabeth Repko at repkoe@gao.gov
What GAO Found
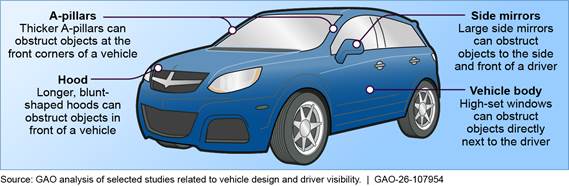
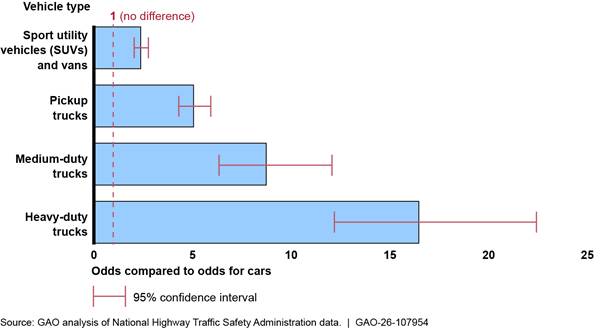
The size of passenger vehicles on U.S. roads has grown over the past 30 years. Selected studies that GAO reviewed generally found that larger vehicles, certain design features (see figure), and turning maneuvers may limit a driver’s visibility and pose greater risks to pedestrians and cyclists. Data on driver visibility, such as the size of blind zones around a vehicle, are not readily available. As such, GAO used turning maneuvers to analyze the potential relationship between vehicle type and involvement in fatal pedestrian crashes. GAO found that larger vehicles had higher odds of turning compared with going straight in fatal pedestrian crashes than cars in the same scenarios. For example, heavy-duty trucks (e.g., semi-trucks) had at least 12 times the odds compared with cars.
Vehicle Design Features and Their Potential Relationship to Driver Visibility
Auto and truck manufacturers that GAO interviewed have developed technologies to help mitigate limited driver visibility, such as side bicyclist alerts and pedestrian automatic emergency braking. Manufacturers have also conducted testing and benchmarking of their vehicles to assess driver visibility.
Two selected foreign jurisdictions—the European Union (EU) and London, England—have taken steps to reduce risks to pedestrians and cyclists related to limited driver visibility. The EU has adopted driver visibility standards that auto and truck manufacturers must meet. While similar regulations also apply in the United Kingdom, London has developed a driver visibility standard that requires some commercial truck operators to install additional safety equipment.
The Department of Transportation (DOT) has recognized risks to pedestrians and cyclists related to driver visibility but has not fully analyzed those risks or developed responses. DOT has conducted some research and begun to collect data that could be useful in conducting such an analysis. However, it has not analyzed specific risks that limited driver visibility may pose to pedestrians and cyclists, such as those related to turning maneuvers or vehicle design features. DOT has not done so because, in part, it has not determined a method to measure driver visibility in cars and trucks. Such a method could provide data on the size of blind zones and enable DOT to fully analyze the extent to which they pose risks to pedestrians and cyclists. Fully analyzing specific risks would also provide DOT with the information it needs to respond to them, and would better position DOT to meet its goal of reducing roadway fatalities.
Why GAO Did This Study
In 2024, about 9,200 pedestrians and cyclists were killed on U.S. roadways—an increase of about 65 percent since 2010. A range of factors can contribute to increased pedestrian and cyclist fatalities, including larger vehicles, which make up an increasing share of vehicles on U.S. roadways and may limit driver visibility.
GAO was asked to review issues related to driver visibility. This report examines (1) what studies and federal data show about the relationship between vehicle characteristics, driver visibility, and pedestrian and cyclist fatalities; (2) actions selected auto and truck manufacturers have taken related to driver visibility; (3) approaches selected foreign jurisdictions have used to reduce driver visibility–related risks to pedestrians and cyclists; and (4) the extent to which DOT has analyzed and responded to potential driver visibility–related risks to pedestrians and cyclists.
GAO reviewed selected studies published from 2015 to 2025, analyzed DOT pedestrian fatality data, and selected and interviewed five auto and five truck manufacturers. GAO also reviewed driver visibility standards adopted by the EU and London and interviewed officials about their approaches. Finally, GAO reviewed DOT studies and planning documents and interviewed DOT officials.
What GAO Recommends
GAO is recommending that DOT (1) determine a method to measure driver visibility, and (2) fully analyze risks that limited driver visibility poses to pedestrians and cyclists and develop responses to those risks. DOT concurred with the first recommendation and did not concur with the second. GAO continues to believe DOT should fully implement both recommendations, as discussed in the report.
Abbreviations
CCFP Crash Causal Factors Program
CISS Crash Investigation Sampling System
CRSS Crash Report Sampling System
DOT Department of Transportation
EU European Union
Euro NCAP European New Car Assessment Program
FARS Fatality Analysis Reporting System
FMCSA Federal Motor Carrier Safety Administration
FMVSS Federal Motor Vehicle Safety Standards
IIHS Insurance Institute for Highway Safety
NCAP New Car Assessment Program
NHTSA National Highway Traffic Safety Administration
OR odds ratio
PAEB pedestrian automatic emergency braking
SUV sport utility vehicle
UK United Kingdom
UN United Nations
UNECE United Nations Economic Commission for Europe
Volpe Center John A. Volpe National Transportation Systems Center
This is a work of the U.S. government and is not subject to copyright protection in the United States. The published product may be reproduced and distributed in its entirety without further permission from GAO. However, because this work may contain copyrighted images or other material, permission from the copyright holder may be necessary if you wish to reproduce this material separately.
July 21, 2026
The Honorable Robert Garcia
Ranking Member
Committee on Oversight and Government Reform
House of Representatives
The Honorable Jamie Raskin
House of Representatives
The number of pedestrians and cyclists killed annually in motor vehicle crashes in the U.S. has increased since 2010. About 9,200 pedestrians and cyclists were killed in traffic crashes in 2024—an increase of about 65 percent since 2010—according to the most recent data available from the National Highway Traffic Safety Administration (NHTSA). During the same period, pedestrians and cyclists also represented an increasing share of all highway fatalities. Specifically, from 2010 to 2024, the percentage of highway fatalities involving vehicle occupants dropped from 71 percent to 62 percent, while the share of fatalities involving pedestrians, cyclists, and other non–vehicle occupants increased from 15 percent to 22 percent, according to NHTSA.[1]
A range of complex factors can contribute to increased pedestrian and cyclist fatality rates. For example, we have previously reported that driver and pedestrian behavior, roadway design, and factors that can affect a driver’s ability to see pedestrians—such as darkness—can affect pedestrian fatality rates.[2] We have also previously reported that crashes involving larger, heavier passenger vehicles—such as sport utility vehicles (SUVs)—are more likely to result in fatalities or injuries to pedestrians due to their greater mass, and that these vehicles make up an increasing share of vehicles on U.S. roadways.[3] In addition, according to roadway safety organizations such as the Insurance Institute for Highway Safety (IIHS), larger vehicles may limit driver visibility.[4] The parallel trends of larger vehicles and higher numbers of pedestrian and cyclist fatalities have raised questions about the relationship between vehicle size and risks to pedestrians and cyclists, including risks related to drivers’ ability to adequately see pedestrians and cyclists in front of and beside these vehicles (referred to as forward visibility).
The U.S. Department of Transportation (DOT) is responsible for improving roadway safety and has prioritized the reduction of crash-related fatalities across all modes of transportation. Within DOT, NHTSA is responsible for prescribing motor vehicle safety standards, conducting safety research and development, and carrying out various highway safety programs. The Federal Motor Carrier Safety Administration (FMCSA) is responsible for issuing and enforcing safety regulations for commercial vehicle operators, among other responsibilities.
You asked us to review U.S. vehicle safety design standards and their effects on vulnerable road users, such as pedestrians and cyclists. This report
· examines what studies and federal data show about the relationship between vehicle characteristics, driver visibility, and pedestrian and cyclist fatalities;
· describes actions that selected auto and commercial truck manufacturers have taken related to driver visibility of pedestrians and cyclists;
· describes approaches that selected foreign jurisdictions have used to reduce driver visibility–related risks to pedestrians and cyclists; and
· evaluates the extent to which DOT has analyzed and responded to potential driver visibility–related risks to pedestrians and cyclists.
To examine the relationship between vehicle characteristics (including size, design, and turning maneuvers), driver visibility, and pedestrian and cyclist injuries and fatalities, we identified and reviewed 18 selected studies published from 2015 to 2025. We identified these studies using multiple search methods and reviewed them to ensure relevance and methodological sufficiency. We analyzed the studies to identify common themes regarding driver visibility and pedestrian and cyclist fatalities. See appendix I for more information on how we identified and analyzed the selected studies.
We also analyzed pedestrian fatality data from NHTSA’s Fatality Analysis Reporting System (FARS) to determine whether a relationship exists between a vehicle turning—a crash scenario in which driver visibility of pedestrians may be affected—and vehicle type among fatal pedestrian crashes. We specifically examined whether any such relationship varied across certain characteristics that could be related to driver visibility, including vehicle type, turning direction, and pedestrian characteristics. See appendix II for full information on the method we used to conduct our analysis. We analyzed data for 2016 through 2023, the most recent data available at the time of our analysis. We assessed the reliability of these data by interviewing NHTSA officials and conducting electronic testing, among other steps. We determined the data to be reliable and sufficient for the purpose of analyzing relationships between vehicle characteristics related to driver visibility and pedestrian fatalities. We did not conduct a similar analysis for cyclist fatalities because there was not a sufficiently large sample size.
To describe actions that selected auto and commercial truck manufacturers have taken related to driver visibility of pedestrians and cyclists, we interviewed a nongeneralizable sample of five passenger vehicle manufacturers and five commercial truck manufacturers.[5] We selected these manufacturers by analyzing 2024 U.S. vehicle sales data and identifying those manufacturers with large shares of sales. These manufacturers represented approximately 43 percent and 64 percent of passenger vehicle and commercial truck market share respectively, based on 2024 U.S. vehicle sales data.
To describe approaches that selected foreign jurisdictions have used to reduce risks to pedestrians and cyclists related to limited driver visibility, we conducted a literature search scoped to English-language academic and trade publications, a search of the internet, and interviews with federal and other stakeholders to identify foreign entities that have implemented or planned to implement driver visibility standards. Selection criteria included such things as whether the foreign jurisdiction had taken or was planning to take steps related to driver visibility and pedestrian and cyclist safety, and whether the action focused on passenger or commercial vehicles. Using this methodology, we selected two jurisdictions as having taken actions to address driver visibility and pedestrian and cyclist safety—the European Union and London, England—and reviewed laws, regulations, and other documents related to their approaches to driver visibility. We also interviewed officials from these jurisdictions about how they developed their approaches, how the approaches were implemented, and any challenges they encountered.
To evaluate the extent to which DOT has analyzed and responded to potential risks to pedestrians and cyclists related to driver visibility, we reviewed DOT documentation and interviewed officials from NHTSA, FMCSA, and the John A. Volpe National Transportation Systems Center (Volpe Center) about work they have conducted on driver visibility.[6] We also reviewed studies these organizations have conducted, as well as descriptions of NHTSA and FMCSA data collection efforts related to driver visibility. In addition, we examined DOT’s fiscal year 2026 Annual Performance Plan, in which DOT set performance goals to reduce annual roadway fatalities, as well as NHTSA’s December 2024 Roadmap for the New Car Assessment Program (NCAP), the most recent documents available at the time of our review.[7] We reviewed these documents to identify initiatives related to risk management principle 7 in Standards for Internal Control in the Federal Government, which states that management should identify and analyze risks to achieving defined objectives.[8] Appendix I provides a more detailed discussion of our scope and methodology.
We conducted this performance audit from November 2024 to July 2026 in accordance with generally accepted government auditing standards. Those standards require that we plan and perform the audit to obtain sufficient, appropriate evidence to provide a reasonable basis for our findings and conclusions based on our audit objectives. We believe that the evidence obtained provides a reasonable basis for our findings and conclusions based on our audit objectives.
Background
Pedestrian and Cyclist Fatality Trends
The number of pedestrians and cyclists killed on U.S. roadways increased by 65 percent over 15 years, from about 5,500 in 2010 to nearly 9,200 in 2024, according to the most recent NHTSA data available. Pedestrian and cyclist fatalities increased across crashes involving nearly all vehicle types, such as cars and pickup trucks.
Though crashes involving cars resulted in the largest share of pedestrian and cyclist fatalities in 2010 and 2024, fatalities from crashes involving large vehicles—including SUVs, pickup trucks, and large trucks—increased the most during this period.[9] For example, from 2010 to 2019, pedestrian and cyclist fatalities from crashes involving SUVs increased 70 percent, compared with an increase of 45 percent for cars.[10] Pedestrian and cyclist fatalities from crashes involving SUVs continued to increase from 2020 to 2024, growing 27 percent, while such fatalities from cars decreased 3 percent during this period. While pedestrian and cyclist fatalities decreased 5 percent overall between 2023 and 2024, such fatalities increased 3 percent for crashes involving SUVs.[11] (See fig. 1.)
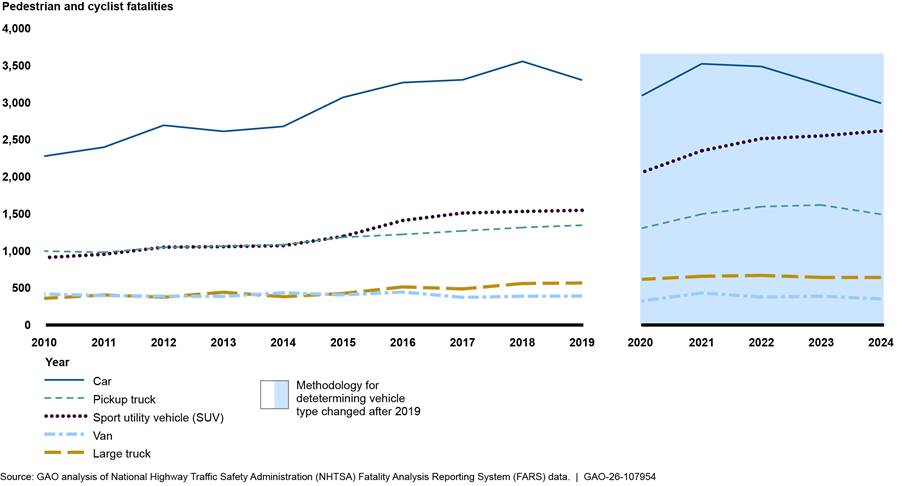
Note: NHTSA changed its FARS vehicle classification methodology in 2020. According to NHTSA, the vehicle type classifications in FARS for 2020 and later are not comparable to the vehicle type classifications for 2019 and earlier. NHTSA stated that most of the changes appear in passenger vehicles, with the new methodology showing declines in cars and increases in light trucks, especially SUVs (a type of light truck).
We have previously reported that a range of factors can affect pedestrian and cyclist crashes and fatalities, including pedestrian and cyclist exposure to vehicle traffic, roadway design, road user behavior, and vehicle characteristics.[12]
· Pedestrian and cyclist exposure to vehicle traffic. The prevalence of walking and cycling can affect the extent to which pedestrians and cyclists are exposed to crash risk. A greater number of people walking or cycling can result in an increased potential for pedestrian and cyclist fatalities and injuries.[13]
· Roadway design. Roadways designed primarily for motor vehicles may contribute to pedestrian and cyclist fatalities. Certain types of roadways, such as wider, straighter highways, can lead to speeding, which increases the likelihood of a crash with pedestrians or cyclists and the probability of serious injury or death.[14]
· Road user behavior. Driver behavior, like speeding, drug and alcohol use, and distracted driving can affect the risk and severity of crashes. For example, research has established a clear connection between high driving speed and the likelihood of severe collisions with pedestrians and cyclists.[15] Pedestrian and cyclist behavior—like distractions, lack of helmet use, or improperly crossing a roadway or intersection—can also contribute to pedestrian or cyclist fatalities.
· Vehicle characteristics. Characteristics such as age and type of vehicle can affect the risk of pedestrian crashes and fatalities. Specifically, we have reported that older and larger passenger vehicles—such as light trucks and SUVs—are associated with greater increases in pedestrian fatalities.[16]
Vehicle Types and Design Trends
Vehicle types vary based on their weight, body type, and passenger capacity. While NHTSA’s FARS data does not classify vehicles based on their dimensions (e.g., length, width, and height), NHTSA’s vehicle types generally correspond to vehicle size, with cars representing the smallest vehicles and heavy-duty trucks representing the largest vehicles.[17] (See fig. 2.)
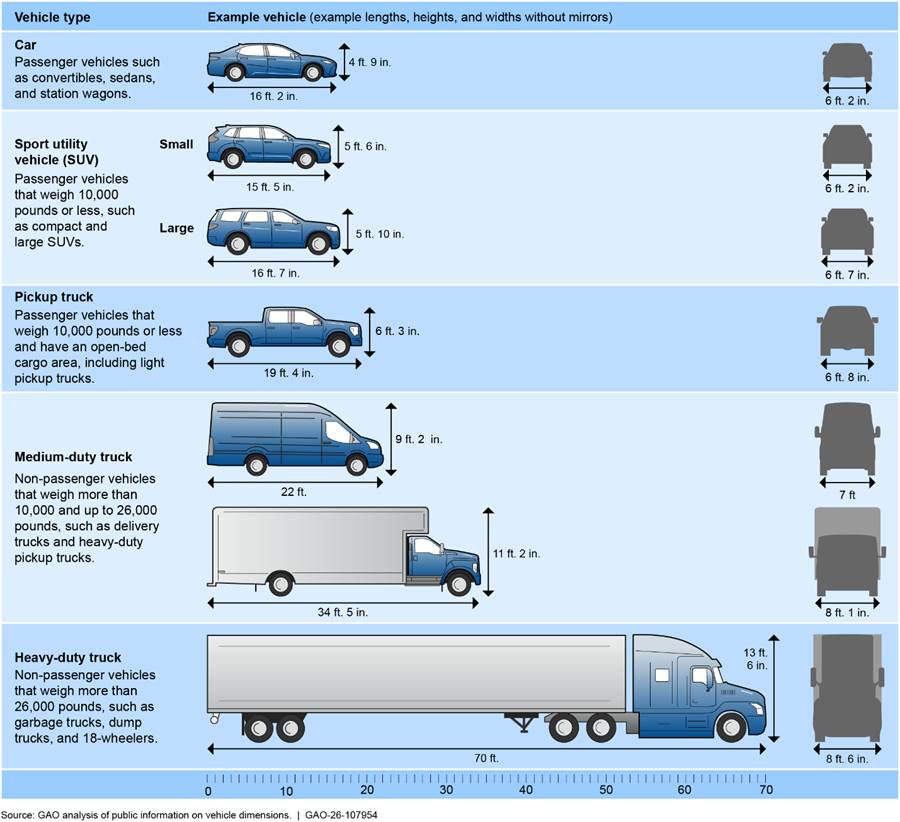
Note: The size and design of vehicles can vary widely within vehicle types. GAO developed these illustrations based on vehicles in each category that were among the top-selling vehicles in the U.S. in 2025. The National Highway Traffic Safety Administration’s (NHTSA) Fatality Analysis Reporting System classifies vehicle types based on gross vehicle weight and body type. NHTSA, Fatality Analysis Reporting System Analytical User’s Manual, 1975-2024, DOT HS 813 794 (Washington, D.C.: April 2026).
As shown in figure 2, the size and design of vehicles can vary widely between and within vehicle types. For example, cars include compact, hatchback-style vehicles that can be around 4 feet shorter in length than large sedans. Similarly, small pickup trucks can be around 3 feet shorter in length and 1 foot shorter in height than larger pickup trucks. Design features, such as window and hood shape and height, as well as the size and placement of “A-pillars”—the pillars that support a vehicle’s windshield and connect the roof to its body—can also vary between and within vehicle types, and sometimes across model years for the same vehicle.
While the characteristics, such as size and design, of individual vehicles vary, passenger vehicles in the U.S. have generally increased in size over time. In 2024, IIHS reported that the average passenger vehicle on U.S. roads had grown by about 4 inches in width and 8 inches in height over the previous 30 years.[18] This growth in average vehicle size has occurred as specific vehicle types have gotten larger, and as larger vehicle types make up an increasing share of the total U.S. vehicle fleet. For instance, the IIHS study reported that pickup trucks have grown in both popularity and size, with the average pickup truck in 2022 measuring 3.3 feet longer than its equivalent in 1992. We have also previously reported that SUVs grew from 30 percent of the U.S. vehicle market in model year 2008 to 48 percent of the market in model year 2018.[19] (See fig. 3.)
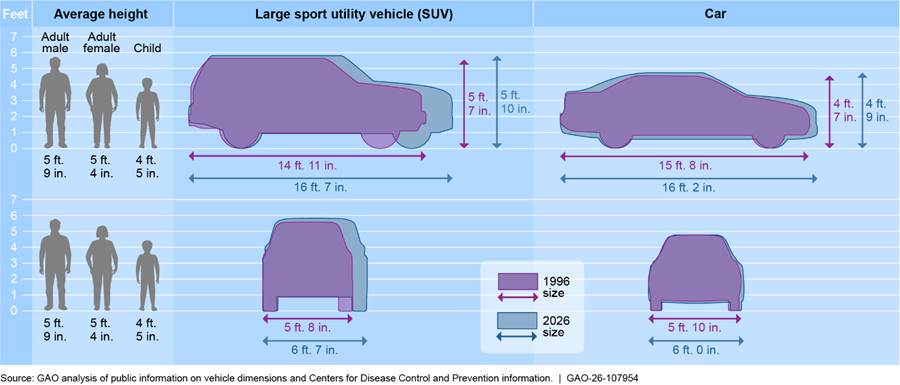
Note: The average height of individuals represents averages for 2023, the most recent data available. Average heights for children were differentiated between males and females, but the average heights for 8- to 9-year-old males and females were roughly the same. GAO developed these illustrations based on vehicles in each category that were among the top-selling vehicles in the U.S. in 1996 or 2025, the most recent full year of sales data available.
Driver Visibility
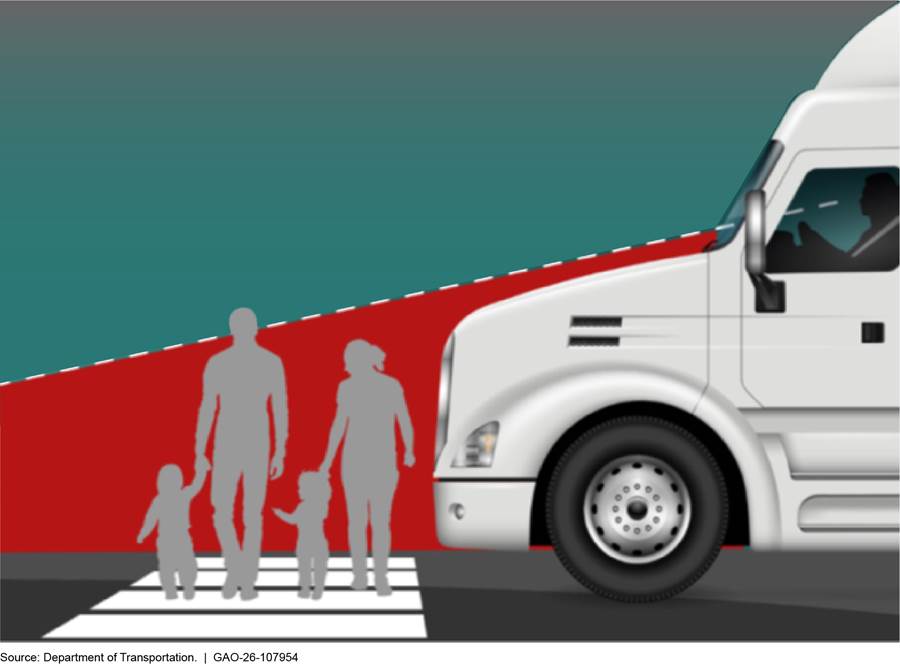
The ability of a driver to have a clear and reasonably unobstructed view of the area around their vehicle can reduce deaths and injuries due to crashes, according to NHTSA. Driver visibility includes a driver’s ability to see the area forward of the driver (forward visibility) and behind the driver (rear visibility), either through windows (direct visibility) or mirrors or cameras (indirect visibility). For the purposes of our report, forward visibility includes a 180-degree arc around the driver, including areas forward and to the side of the driver. Any areas around the vehicle that are obstructed from the driver’s direct view are called blind zones.[20] Driver visibility can vary due to a range of factors, such as driver and pedestrian height, light conditions, vehicle speed, and vehicle design. For example, a driver that is higher off the ground may have limited visibility of shorter pedestrians directly in front of a vehicle, as shown in figure 4.
Roles and Responsibilities Related to Motor Vehicle Safety and Design
DOT is responsible for ensuring the safety and efficiency of the U.S. transportation system, including the motor vehicles that operate on the nation’s roadways. DOT uses the Safe System Approach to guide its efforts to address roadway safety. This approach recognizes that crashes are often caused by a complex combination of factors, such as driver and pedestrian behavior, roadway and vehicle design, and policy (see fig.5). Through the Safe System Approach, DOT seeks to address these factors systemically.
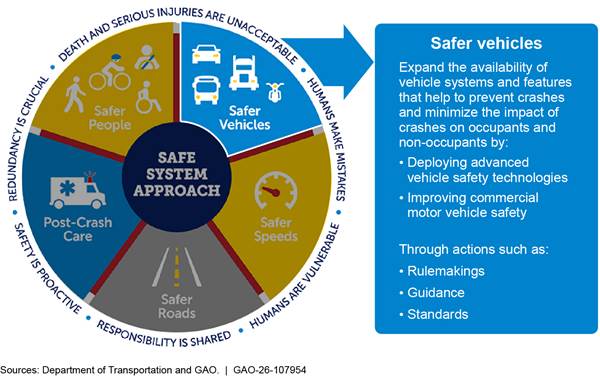
Within DOT, NHTSA is responsible for motor vehicle safety, and FMCSA is responsible for motor carrier safety and compliance. These components execute their missions through various programs and regulations.
· NHTSA. NHTSA’s mission is to save lives, prevent injuries, and reduce the economic costs associated with road traffic crashes. To carry out its mission, NHTSA issues Federal Motor Vehicle Safety Standards (FMVSS), administers the New Car Assessment Program (NCAP), and provides data and resources on vehicle safety, among other things. The FMVSS are minimum performance standards that NHTSA establishes in regulation for new vehicles and equipment.[21] Manufacturers must certify to the distributor or dealer that their motor vehicles or motor vehicle equipment comply with applicable FMVSS upon delivery of their motor vehicles or equipment for sale in the U.S.[22] Through NCAP, NHTSA tests and rates vehicles based on safety and provides its results to consumers, along with recommended safety technologies. In 2024, NHTSA announced its intent to incorporate vehicle pedestrian crash and technology testing into the NCAP program.[23]
· FMCSA. FMCSA’s mission is to reduce large truck and bus crashes, injuries, and fatalities. As such, FMCSA is responsible for developing and enforcing Federal Motor Carrier Safety Regulations, setting standards for commercial driver’s licenses, and conducting audits and inspections of vehicle operators for compliance. FMCSA also conducts public awareness campaigns.
NHTSA and FMCSA also collect data and conduct research on vehicle safety and outcomes, including on crashes, fatalities, injuries, and crash circumstances. For example, NHTSA collects nationwide data on all motor vehicle traffic crashes resulting in fatal injuries through FARS. These data include some data elements, such as those measuring environmental factors like light conditions, that could affect a driver’s visibility. NHTSA also collects crash injury data through its Crash Report Sampling System (CRSS). According to DOT, CRSS is a statistical sample of police-reported crashes involving all types of motor vehicles, as well as pedestrians and cyclists. These data range from crashes involving only damage to property to those resulting in serious injuries and fatalities.
DOT’s Volpe Center supports DOT’s research efforts by conducting research across a range of topics, including safety. It acts as an expert resource to help DOT and other federal, state, local, and private entities address emerging transportation issues.
Larger Vehicles May Pose Greater Fatality Risk to Pedestrians and Cyclists When Turning, Partly Due to Limited Driver Visibility
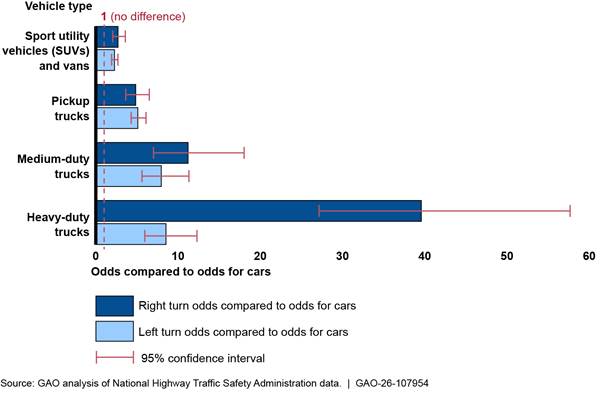
Selected studies we reviewed generally found that larger vehicles, certain design features, and turning vehicles were associated with more limited driver visibility of pedestrians and cyclists and may pose greater risks to them, among other findings. Similarly, our analysis of federal crash data found that larger vehicles had higher odds of turning compared with going straight while involved with fatal pedestrian crashes than the odds for cars in the same scenarios. We also found that heavy-duty trucks had significantly higher odds of turning right compared with going straight during fatal crashes with pedestrians than the odds for cars executing the same maneuver.
Studies Found Larger Vehicles, Certain Design Features, and Turning Maneuvers May Result in Larger Blind Zones
The 18 studies we reviewed identified or discussed relationships between vehicle characteristics—the size and design of vehicles, and certain driving maneuvers—and driver visibility, or pedestrian and cyclist fatalities. See table 1 for examples of the types of relationships that studies identified.
Table 1: Examples of the Relationships Between Vehicle Characteristics, Driver Visibility, and Pedestrian and Cyclist Fatalities in Selected Studies
|
Vehicle characteristic |
Example of relationship to driver visibility |
Example of relationship to pedestrian and cyclist fatalities |
|
Vehicle size The length, height, and width of the vehicle |
Larger vehicles reduced driver visibility compared with smaller vehicles. |
Larger vehicles were associated with increased likelihood of pedestrian and cyclist fatalities in crashes. |
|
Design features Features such as the shape of the hood or front end, side mirrors and windows, and “A-pillars,” which hold up the windshield and connect a vehicle’s roof to its body |
Long hoods and large side mirrors and A-pillars may obstruct the driver’s view, reducing driver visibility. |
Blunt-shaped front ends were associated with increased risk of pedestrian fatalities in crashes. |
|
Driving maneuvers Left and right turns |
Turning may limit driver visibility compared with driving straight. |
Far turns (right turns in the U.S., left turns in the United Kingdom) may result in more severe cyclist injury. |
Source: GAO analysis of selected studies. | GAO‑26‑107954
Note: GAO included 18 studies in this report. Ten studies assessed or discussed potential relationships between vehicle characteristics and driver visibility. Thirteen studies assessed or discussed potential relationships between vehicle characteristics and pedestrian or cyclist fatalities or injuries. Some of the studies assessed or discussed both outcomes. Not all studies looked at comparable design features or outcomes. However, GAO summarized the findings across studies to illustrate the factors that may be associated with these outcomes.
Vehicle size. Though not all the studies we reviewed addressed vehicle size, seven studies reported that larger vehicles may reduce driver visibility.[24] For example, one study found that as passenger vehicles have gotten larger, the size of their associated blind zones has also grown. Researchers found that the size of blind zones increased among six selected pickup trucks, SUVs, and sedans they tested across model years 1997 to 2023, decreasing driver visibility.[25] The study showed that SUVs and pickup trucks, the largest vehicles tested, had the largest increases in blind zone size and decreases in visibility.
Ten studies we reviewed also reported that larger vehicle size generally increased the severity of pedestrian and cyclist injury and risk of fatalities in crashes.[26] For example, one study found that larger, high-fronted vehicles—including vans and SUVs—were generally associated with more severe injury for pedestrians.[27] Another study found that taller vehicle front ends were associated with a greater likelihood of pedestrian fatalities in the event of a crash.[28] The study noted that the association is stronger for certain pedestrian characteristics, including older adults, women, and children, due to their size in relation to the vehicle.[29]
Vehicle design features. Seven of the selected studies reported that, among other factors, certain design features may reduce driver visibility.[30] These studies described relationships between driver visibility and vehicle design features like hood length, side-mirror size, window height, and A-pillar size. See figure 6 for an example of vehicle design features that can affect driver visibility, based on our analysis of selected studies.
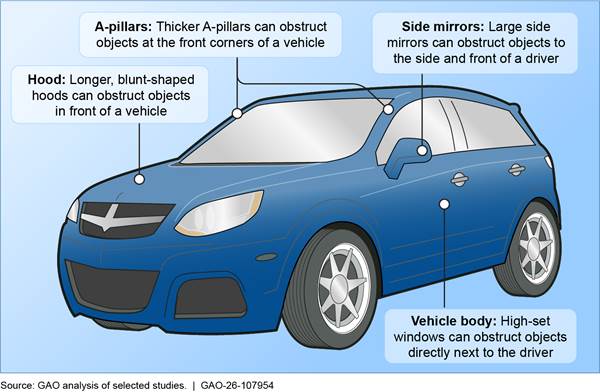
These design features can be related to vehicle size, and features often found in larger vehicles may limit driver visibility. For instance, one study found that increases in the size of the driver’s side mirror in selected vehicle models increased the size of blind zones over time.[31] Larger, blunt front ends may also contribute to larger front blind zones, according to another study.[32]
Additionally, four studies reported that certain vehicle design features, including front-end shapes, may increase the risk of pedestrian fatalities or injuries.[33] One study found that taller, blunt front ends were associated with increased risk of crash-related pedestrian fatalities compared with lower, shorter, and sloped front ends. The study found that vehicles with blunt front ends strike pedestrians in areas of the body that can result in more severe injury.[34]
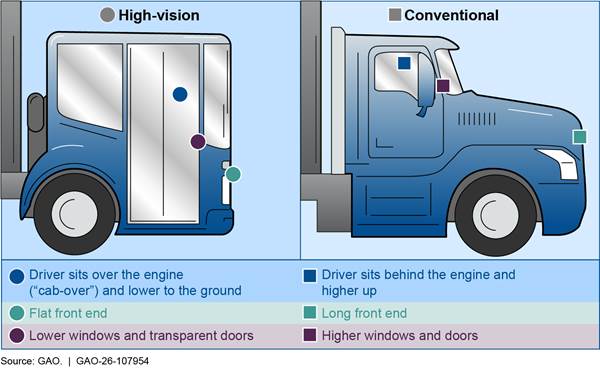
Four of the seven studies that reported that certain design features may reduce driver visibility particularly noted that the height and size of commercial trucks can make it hard for truck drivers to see people or objects directly next to or in front of them.[35] For example, a study conducted by the Vision Zero Vehicle Safety and Technology Working Group stated that a commercial dump truck with a conventional cab may have blind zones that hide a bike lane or the entire width of a crosswalk at an intersection. However, high-vision designs—which place the cab over the engine, and feature a lower driver seat and dashboard, and additional windows—can reduce blind zones in commercial trucks.[36] For instance, locating the cab over the engine (referred to as “cab-over” design) can reduce the length of the hood and reduce the size of front blind zones, compared with designs that place the cab behind the engine (referred to as “conventional” cab design). (See fig. 7.)
Vehicle maneuvers. Half of the studies suggested that maneuvers like turning may affect driver visibility or increase the risk of pedestrian or cyclist injuries or fatalities.[37] For example, one study of commercial trucks in the United Kingdom found that the most common factor associated with cyclist and pedestrian crashes was limited driver visibility. The study found that most crashes with pedestrians occurred when a truck started moving from a stopped position (moving off), while most crashes with cyclists occurred when trucks were turning left (the equivalent of a right-hand turn in the U.S.).[38] According to another study, turning may limit visibility because a driver turning might not be able to see and react to a pedestrian partially blocked by the vehicle blind zone in time to avoid a crash. In contrast, a driver in a straight-moving vehicle would be able to see a pedestrian sooner.[39]
Most of the studies we reviewed described complex interrelationships between vehicle characteristics, driver visibility, and pedestrian and cyclist crashes and fatalities. For example, according to a study by IIHS, larger vehicles, like vans, pickup trucks, and SUVs, were more likely than cars to be involved in fatal crashes with pedestrians when turning left or right at an intersection compared with going straight.[40] The researchers stated that design features common among larger vehicles, like larger A-pillars, could have contributed to larger vehicles’ involvement in these fatal crashes because of their associated blind zones, though the authors did not evaluate their hypothesis in the study. Additionally, some studies found that vehicle speed, in combination with design features, driver visibility, or maneuvers, may contribute to crash outcomes. For example, one study found that while blunt-shaped front ends were more likely to result in pedestrian fatalities, higher speeds substantially increased the risk of such fatalities.[41]
Data Show Larger Vehicles May Pose a Greater Risk to Pedestrians and Cyclists When Turning, Partly Due to Factors Related to Driver Visibility
Our analysis of NHTSA’s FARS data identified relationships between factors associated with limited driver visibility and fatal pedestrian crashes. We found that, among fatal pedestrian crashes, larger vehicles had higher odds of turning—a maneuver that may affect driver visibility—compared with going straight while being involved with a fatal pedestrian crash than cars executing the same maneuvers. The odds for the largest vehicles compared with cars increased when we considered the direction of the turn. We also identified increased odds of a vehicle turning during a fatal pedestrian crash that involved older, younger, and female pedestrians. While our analysis did not include data on cyclist fatalities, a few studies have reported potential relationships between large vehicles turning and increased risk to cyclists.
|
GAO’s Odds Ratio Analysis To identify potential relationships between driver visibility and pedestrian fatalities, GAO used data on fatal pedestrian crashes to calculate the odds of vehicles turning during these crashes compared with going straight, controlling for other factors such as vehicle type. For example, among fatal crashes, GAO calculated the odds of an SUV turning compared with going straight during a fatal pedestrian crash as follows:
To identify whether these odds were related to the type of vehicle involved (which may be related to driver visibility), GAO calculated the odds ratio by dividing the odds for each type of vehicle by those for cars. GAO assumed cars to be the smallest vehicle body type and therefore to have the fewest limitations on driver visibility. For example, to calculate the odds ratio of an SUV turning during a fatal pedestrian crash, GAO divided the odds identified using the approach above by the odds identified for cars, using the same formula (turning crashes divided by crashes going straight). Source: GAO. | GAO‑26‑107954 |

We analyzed data on crashes resulting in pedestrian fatalities that occurred at or near intersections, using characteristics related to driver visibility such as vehicle type, turning maneuvers, and pedestrian characteristics.[42] We assessed the differences in the odds of different vehicle types turning compared with going straight while being involved with a fatal pedestrian crash, among all such crashes and controlling for other factors.[43] See appendix II for more information on our analysis.
Vehicle type. We found that larger vehicles had higher odds of turning versus going straight during fatal pedestrian crashes, compared with the odds for cars in the same scenarios. Specifically, among fatal pedestrian crashes, SUVs and vans, pickup trucks, medium-duty trucks, and heavy-duty trucks had higher odds of involvement in such crashes when turning compared with going straight than cars executing the same maneuvers.[44] Further, our analysis found that the odds increased as the vehicle type increased in size. For example, SUVs and vans had more than twice the odds of turning during fatal pedestrian crashes than cars, while heavy-duty trucks had 16 times higher odds than cars. (See fig. 8.)
Figure 8: Odds of Larger Vehicles Turning Versus Going Straight During Fatal Pedestrian Crashes, Compared with Odds for Cars Executing the Same Maneuver
Notes:
GAO controlled for other factors, such as weather and time of day. For example, while GAO included crashes with varying weather and time of day in its analysis, GAO held such factors constant when assessing the relationship between vehicle types and the odds of vehicles turning versus going straight during a fatal pedestrian crash.
In this analysis, a turning vehicle is used as a proxy for fatal pedestrian crashes that are related to blind zones, while a vehicle going straight is used as a proxy for fatal pedestrian crashes that are not.
The odds ratios are derived by dividing the odds of a non-car being involved in a fatal pedestrian crash while turning versus going straight by the odds of a car being involved in a fatal pedestrian crash while turning versus going straight. An odds ratio of 1 denotes that the odds are the same as the odds for cars. The results consist of estimates and 95-percent confidence intervals and do not allow for comparisons of risk or prevalence of an outcome. A confidence interval is a measure of precision expressed as an interval within which the underlying parameter is expected to be located. The confidence interval accounts for uncertainty in the results of statistical analysis by providing an upper and lower limit.
Right and left turns. We found that heavy-duty trucks had significantly higher odds of turning right during fatal crashes with pedestrians, compared with cars executing the same maneuver. Among turning vehicles, we assessed whether there were differences in the odds of vehicles turning left or right during a fatal pedestrian crash, and whether these odds varied by vehicle type. There was a significant relationship between the type of turn and the odds of a fatal crash involving a pedestrian for heavy-duty trucks.[45] (See fig. 9.)
Figure 9: Odds of Different Vehicle Types Turning Right or Left Versus Going Straight During Fatal Pedestrian Crashes, Compared with Cars Executing the Same Maneuver
Notes:
GAO controlled for other factors, such as weather and time of day. For example, while GAO included crashes with varying weather and time of day in its analysis, GAO held such factors constant when assessing the relationship between vehicle types and the odds of vehicles turning versus going straight during a fatal pedestrian crash.
In this analysis, a turning vehicle is used as a proxy for fatal pedestrian crashes that are related to blind zones, while a vehicle going straight is used as a proxy for fatal pedestrian crashes that are not.
The odds ratios are derived by dividing the odds of a non-car being involved in a fatal pedestrian crash while turning versus going straight by the odds of a car being involved in a fatal pedestrian crash while turning versus going straight. An odds ratio of 1 denotes that the odds are the same as the odds for cars. The results consist of estimates and 95-percent confidence intervals and do not allow for comparisons of risk or prevalence of an outcome. A confidence interval is a measure of precision expressed as an interval within which the underlying parameter is expected to be located. The confidence interval accounts for uncertainty in the results of statistical analysis by providing an upper and lower limit.
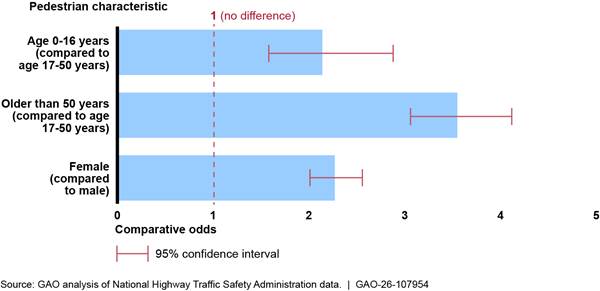
Pedestrian characteristics. We found that fatal pedestrian crashes that occurred while vehicles were turning had higher odds of involving older, younger, and female pedestrians compared with such crashes that occurred while vehicles were going straight during fatal pedestrian crashes. Specifically, the odds of a vehicle turning during a fatal pedestrian crash that involved pedestrians 16 years of age and younger were more than twice the odds of such crashes that involved pedestrians 17 to 50 years old.[46] Additionally, the odds of a vehicle turning during a fatal pedestrian crash that involved female pedestrians were more than twice the odds of such crashes that involved male pedestrians. As previously discussed, pedestrian age and sex may relate to a pedestrian’s size, which could affect a driver’s ability to see the pedestrian.
We also found that the odds of a vehicle turning during a fatal pedestrian crash that involved pedestrians over 50 were roughly 3.5 times the odds of such crashes that involved pedestrians 17 to 50 years old. These increased odds could be due to a range of factors. For instance, the authors of one study theorized that older pedestrians may be less able to move out of the way of a vehicle entering their path.[47] See figure 10 for the results of our analysis related to pedestrian characteristics.
Figure 10: Odds of a Vehicle Turning During Fatal Pedestrian Crashes, Comparing Characteristics of Pedestrian Involved
Notes:
GAO controlled for other factors, such as weather and time of day. For example, while GAO included crashes with varying weather and time of day in its analysis, GAO held such factors constant when assessing the relationship between pedestrian characteristics and the odds of vehicles turning versus going straight during a fatal pedestrian crash.
In this analysis, a turning vehicle is used as a proxy for fatal pedestrian crashes that are related to blind zones, while a vehicle going straight is used as a proxy for fatal pedestrian crashes that are not.
The odds ratios are derived by dividing the odds of a non-car being involved in a fatal pedestrian crash while turning versus going straight by the odds of a car being involved in a fatal pedestrian crash while turning versus going straight. An odds ratio of 1 denotes that the odds are the same as the odds for cars. The results consist of estimates and 95-percent confidence intervals and do not allow for comparisons of risk or prevalence of an outcome. A confidence interval is a measure of precision expressed as an interval within which the underlying parameter is expected to be located. The confidence interval accounts for uncertainty in the results of statistical analysis by providing an upper and lower limit.
While our analysis allowed us to identify potential relationships between characteristics related to driver visibility and fatal pedestrian crashes, our approach had some limitations, largely due to limitations in available data. Specifically, the results of our analysis do not allow for accurate estimates or comparisons of the odds or probability of a fatal pedestrian crash for a given vehicle type (i.e., the risk of a crash versus no crash).[48] Our analysis also does not directly measure the extent of driver visibility in the vehicle types we included. However, it assesses one maneuver (turning) that is related to visibility. We did not include other maneuvers that could be affected by driver visibility, such as crashes between vehicles starting from a stopped position and pedestrians. We also do not identify underlying causes for the associations we identify. There could be many causal factors that interact in any given fatal crash, such as vehicle speed.
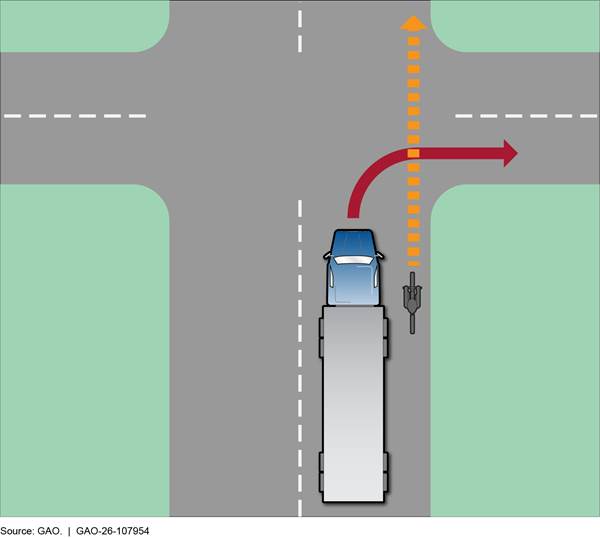
Additionally, our analysis does not account for cyclist fatalities, because there was not sufficient data within our sample to perform our statistical analysis. NHTSA’s FARS data show that cyclist fatalities within our scope increased by 38 percent from 2016 (907 fatalities) through 2023 (1,251 fatalities). The increase in cyclist fatalities overall was driven by a roughly 124-percent increase in fatal crashes between cyclists and SUVs during this period, from 142 fatalities in 2016 to 318 fatalities in 2023. Further, a few of the studies we reviewed identified relationships between cyclist fatalities and large vehicles executing turning maneuvers. Specifically, three studies found that commercial trucks executing right turns (left turns in the United Kingdom) are particularly dangerous for cyclists, likely due to these vehicles’ large blind zones, which increase when turning.[49] (See fig. 11.)
Figure 11: Example of a Common Right-Hand Turning Crash Scenario Between a Heavy-Duty Truck and a Cyclist
Selected Auto and Truck Manufacturers Have Developed Technologies and Taken Other Actions Related to Driver Visibility
Manufacturers Identified Vehicle Design Features That May Limit Driver Visibility
Similar to the studies discussed above, manufacturers we interviewed said that certain design features, such as A-pillars, hoods, and side mirrors, may limit driver visibility. Manufacturers reported that they have taken some steps to mitigate the effects of these design features on driver visibility, but that they face constraints in doing so.
A-pillars. Representatives from all five selected auto and five selected truck manufacturers we spoke with told us that A-pillars can create blind zones for drivers and potentially limit visibility. Four auto manufacturers told us A-pillars have gotten larger as vehicles have gotten larger. According to the manufacturers, larger vehicles need larger A-pillars to meet federal crashworthiness standards that aim to protect vehicle occupants during a crash.[50] One auto manufacturer said that heavier vehicles require thicker A-pillars to ensure safety during a roll-over crash.
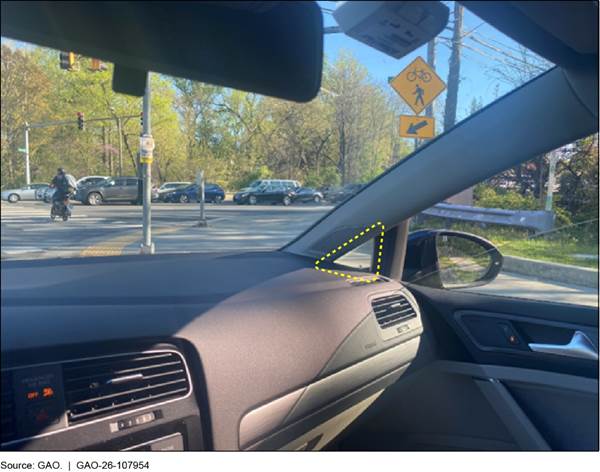
To improve visibility, one auto manufacturer told us they added a window between the A-pillar and the side mirror on all their models sold in the U.S. (see fig. 12). Another auto manufacturer told us they build their vehicles with new high-strength materials, which allows them to keep their A-pillars relatively narrow as their vehicles have increased in size.
Hoods. Representatives from four auto manufacturers and four commercial truck manufacturers told us that the design of the hood, such as the hood’s length, height, and shape, affects visibility. For example, according to one auto manufacturer, on a larger vehicle such as an SUV or pickup truck, the hood must be long enough to cover the larger engine, and it is designed to absorb energy in a crash to protect occupants. Similarly, one commercial truck manufacturer told us the hood height and design are affected by the size of the components below the hood, including the engine, emissions systems, and cooling systems. The larger these components are, the larger the hood will be, which in turn affects driver visibility, according to the representatives. Although the hood can affect driver visibility, this can potentially be mitigated by a driver’s seating position. For example, representatives from one auto manufacturer said that generally, a higher seating position provides better visibility around the vehicle than a lower seating position, and that ensuring that the driver’s seating position can be adequately adjusted vertically promotes visibility.[51]
Representatives from one auto manufacturer and one commercial truck manufacturer we interviewed said the design of their hoods did not limit visibility on their vehicles, as they designed the hoods to be shorter than those of their competitors. Representatives of this commercial truck manufacturer said they only sell cab-over designs, described above. This design, with a flat front end and cab located on top of the engine, provides good visibility, especially compared with commercial trucks with conventional cabs, which have long hoods, according to the manufacturer.
Side mirrors. Representatives from three auto manufacturers and five truck manufacturers told us that the size and placement of side mirrors affect driver visibility.[52] One auto manufacturer representative said that while larger mirrors are better for ensuring visibility of pedestrians and cyclists, they can also create blind zones. The representative said manufacturers must ensure mirrors minimize blind zones for drivers while also meeting federal regulatory requirements.[53] Representatives from a commercial truck manufacturer told us they test the placement of mirrors on their vehicles to determine how to improve driver visibility and address obstructed visibility.
Manufacturers Offer Driver Assistance and Other Technologies to Help Mitigate Vehicles’ Blind Zones
Selected auto and truck manufacturers reported using technologies to help mitigate blind zones caused by design features. These technologies include driver assistance systems, which can increase drivers’ awareness of pedestrians and cyclists, as well as camera monitor systems, which can directly increase driver visibility.
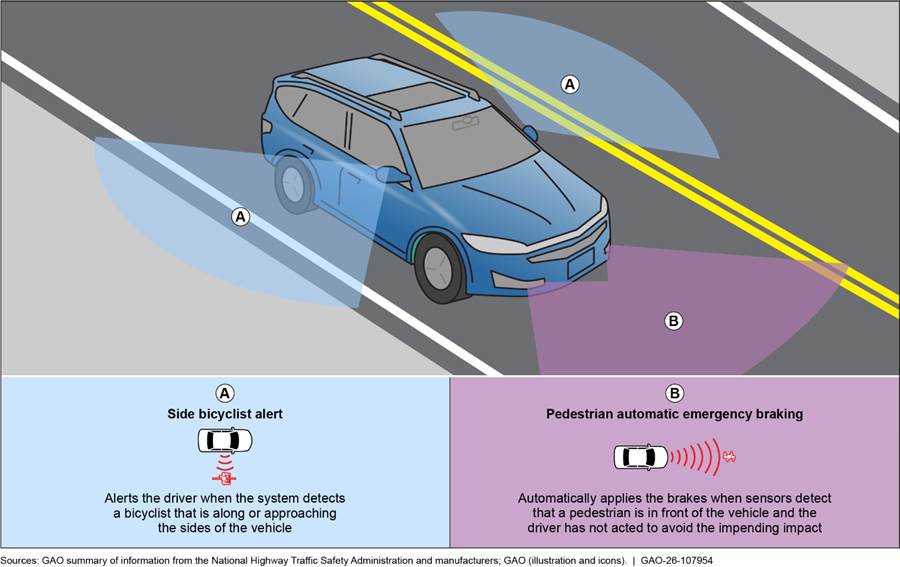
Representatives from selected auto and truck manufacturers told us they were implementing driver assistance technologies to help mitigate blind zones and increase drivers’ awareness of pedestrians and cyclists (see fig. 13).[54] These technologies can alert the driver of an imminent crash and, in some cases, slow or stop the vehicle to help avoid a crash. As we have previously reported, these technologies can vary by manufacturer, vehicle model, and trim level, and there is no standard terminology for these features.[55]
Figure 13: Selected Driver Assistance Technologies That Can Help Increase Drivers’ Awareness of Pedestrians and Cyclists
Representatives of selected auto and truck manufacturers we interviewed said they offer these technologies on some of their vehicles. Specifically:
· Side bicyclist alert. Representatives of two auto manufacturers and four commercial truck manufacturers told us they offer technology that improves awareness of bicyclists along the sides of the vehicle, such as side bicyclist alerts or blind spot information systems. For example, according to representatives from one auto manufacturer, their side bicyclist alert technology uses sensors located in the side and rear bumpers of the vehicle to detect bicyclists that are either in or approaching the vehicle’s side blind zone and to alert the driver. The technology is intended to prevent crashes with bicyclists, particularly when a vehicle is turning, as well as to prevent the driver from opening the door when a vehicle is parked and a bicyclist is passing. Representatives of the manufacturer said this technology is available on some of their vehicles, depending on the vehicle’s trim and package.
· Pedestrian automatic emergency braking (PAEB). PAEB is a type of automatic emergency braking that uses sensors to detect when a pedestrian is in front of the vehicle and apply the brakes if the driver has not acted.[56] Representatives of four auto manufacturers told us they offered PAEB in their vehicles. For example, representatives from one auto manufacturer said they offered PAEB and noted this technology is particularly useful at stopping a vehicle traveling at low speed when a pedestrian or cyclist is detected in front of it. Starting September 1, 2029, NHTSA will require that most passenger vehicles be equipped with PAEB.[57] To satisfy the requirements of this FMVSS as currently written, PAEB must detect and react to a crash that is imminent with a pedestrian when the vehicle is traveling above 6.2 miles per hour.[58] According to officials, NHTSA plans a supplemental rulemaking, which could include changes to these requirements. Currently, FMVSS do not require trucks or buses weighing greater than 10,000 pounds to be equipped with PAEB.
Manufacturers have also developed technologies that, although not specifically intended to detect pedestrians and cyclists, make drivers aware of obstacles and other vehicles, including those in their blind zones. For example, lane assist systems alert the driver if they unintentionally depart from their lane. Two commercial truck manufacturers and one auto manufacturer we interviewed have or are developing this technology. For example, representatives from one truck manufacturer said they were developing lane assist technologies that could mitigate visibility-related safety risks to pedestrians and cyclists.
Manufacturers offer other technologies, such as camera monitor systems, that can facilitate increased driver visibility. Representatives from three auto manufacturers told us they offered an optional forward camera to mitigate front blind zones on their vehicles.[59] Representatives of four truck manufacturers told us they offered camera monitor systems. For example, representatives of one truck manufacturer said that they mount camera display monitors to the A-pillar on both sides of the vehicle, and that the camera feed shows the side views of both sides of the vehicle and the blind zone located at the right-hand front side of the vehicle.
Manufacturers Have Conducted Testing and Benchmarking Related to Driver Visibility
In addition to using technologies to help mitigate blind zones, selected manufacturers have conducted testing and benchmarking of their vehicles to assess driver visibility. Representatives of four auto manufacturers told us they internally assess the blind zones for their vehicles and compare them with the blind zones in similar models produced by competitors. For example, representatives of one auto manufacturer said they establish internal benchmarks for their vehicles to better understand blind zones. Using this information, the manufacturer compares its vehicles with similar models built by its competitors. Another manufacturer calculates the dimensions of blind zones for each of its current vehicle models using Computer Aided Design and compares the dimensions with those of its prior-year models and its competitors’ models, according to the representatives.
Some manufacturers also test their vehicles for driver visibility. Representatives of three truck manufacturers told us they test visibility in their models and follow industry performance metrics. Specifically, the Society of Automotive Engineers has developed a standard to evaluate the extent of a truck driver’s visibility, and the Technology and Maintenance Council of the American Trucking Associations has recommended best practices for minimum commercial vehicle driver vision requirements.[60] According to representatives of one truck manufacturer we interviewed, they measure their vehicles’ blind zones and develop metrics based on these industry standards, to assess the amount of space visible to the driver and the potential effect of blind zones. The manufacturer also uses Computer Aided Design simulations to assess whether vehicles meet its metrics.
Selected Foreign Jurisdictions Have Regulated Driver Visibility to Reduce Risks to Pedestrians and Cyclists
The two foreign jurisdictions we selected—the European Union (EU) and London, England—have taken steps to reduce driver visibility–related risks to pedestrians and cyclists. The EU adopted regulations related to driver visibility for both passenger cars and trucks that vehicle manufacturers must meet. While similar regulations also apply in the United Kingdon (UK), in London, the city transportation agency developed additional required driver visibility standards for operators of commercial trucks. Some stakeholders told us they faced challenges in implementing the regulations, including potentially having to redesign truck cabs to meet EU direct vision requirements.
The European Union Has Adopted Regulatory Driver Visibility Standards That Manufacturers Must Meet
The EU sets minimum standards that manufacturers must meet to sell vehicles in the EU, including safety standards for driver visibility. As part of its regulatory scheme, the EU has chosen to apply and incorporate a number of United Nations (UN) Regulations that address driver visibility in passenger vehicles and trucks. These UN Regulations cover a range of features related to indirect and direct vision, such as minimum fields of vision in passenger cars and direct vision (i.e., what a driver can actually see) for larger vehicles, among other things.[61] They also include visibility-related technology for some larger vehicles, such as blind spot and
|
Development of UN Vehicle Regulations The United Nations Economic Commission for Europe (UNECE), a regional commission of the United Nations (UN), promotes pan-European integration, as well as norms, standards, and conventions to facilitate cooperation within and outside the region. Members include European and non-European countries, such as the U.S., the European Union (EU), and the United Kingdom (UK). Within the UNECE, the World Forum for Harmonization of Vehicle Regulations (World Forum) allows for administration of three major international UN agreements on motor vehicles. World Forum documentation explains that one of these three agreements—the 1958 Agreement—provides a legal and administrative framework for developing harmonized technical UN Regulations. According to World Forum guidance, contracting parties to the 1958 Agreement may choose which, if any, of the UN Regulations they would like to apply. Current contracting parties include the EU and the UK, but not the U.S. GAO’s review focused on the regulations related to driver visibility that the EU has chosen to incorporate as part of its regulatory scheme for vehicle manufacturers and distributors. Source: GAO analysis of UNECE agreements and documentation and EU regulations. | GAO‑26‑107954 |
moving-off information systems designed to detect and alert drivers of pedestrians and cyclists.[62]
Beyond regulatory standards, a consumer advocacy group called the European New Car Assessment Program (Euro NCAP) conducts safety tests of vehicles in the EU that include driver visibility. Euro NCAP assigns vehicle star ratings from 0 to 5 based on their performance on crash protection, crash avoidance, and other tests.[63] According to Euro NCAP, a rating of 0 stars indicates a vehicle meets the minimum type-approval standards but lacks modern safety technology. A rating of 5 stars indicates a vehicle has excellent performance in crash tests and uses state-of-the-art crash avoidance technology.[64]
In July 2025, Euro NCAP issued protocols for evaluating visibility for its truck rating system. According to Euro NCAP officials, vision represents 50 percent, and direct vision 35 percent, of the total score for the Safe Driving component of this system.[65] In addition, the officials said they expect to add driver visibility tests for passenger vehicles, similar to those for trucks, sometime in 2029.
|
EU Type Approvals To market vehicles in the European Union (EU), manufacturers must ensure their vehicles comply with regulatory requirements and receive required approvals. Manufacturers must obtain “type-approvals,” which generally involve pre-market evaluations of vehicles, as well as some vehicle components and systems, to ensure compliance with applicable regulatory requirements. EU member states also conduct regular checks that vehicles, systems, components, and separate technical units comply with regulatory requirements. Vehicles or systems that are subsequently found to not meet requirements are subject to recall, and manufacturers, importers, and distributors may be subject to penalties. Source: GAO analysis of UNECE agreements and documentation and EU regulations. | GAO‑26‑107954 |
Stakeholders we spoke with highlighted some challenges they may face in meeting the EU standards and incorporated UN Regulations, particularly with regard to the need to possibly redesign truck cabs to comply with UN Regulation 167, related to visibility requirements. These standards apply to all new designs of applicable vehicles approved after January 7, 2026, and all new applicable vehicles sold after January 7, 2029.
Several truck manufacturers we spoke with, as well as Euro NCAP officials, told us cab designs do not change often; in some cases, the same design may be used for 30 years. However, some stakeholders said it may be necessary to redesign truck cabs to meet EU regulatory requirements. For example, a representative from one trade association we spoke with representing some of the largest truck manufacturers in Europe told us EU manufacturers are working to comply with the regulation on direct vision. This effort may include redesigning truck cabs to lower windshields, dashboards, and cab heights. Officials from Euro NCAP said truck cab redesigns are a major investment for manufacturers but will likely be necessary to comply with direct vision requirements.
However, not all truck manufacturers told us they may need to redesign their truck cabs. Representatives from one truck manufacturer we spoke with that produces cab-over trucks told us they were evaluating compliance with all type approvals by 2029 and, depending on the evaluation, may not need to make changes to their vehicles to comply with the regulation. Other truck manufacturers we spoke with either said that they were not familiar enough with European regulations to comment on them, or that the regulations did not apply to their vehicles.
Other challenges that stakeholders mentioned for the EU included balancing the need to meet safety requirements with the need to design vehicles to be aesthetically appealing to customers, and difficulties meeting the different safety requirements of the U.S., EU, and other markets.
London Rates and Permits Commercial Trucks Based on Driver Visibility, but Faced Implementation Challenges
|
UK Vehicle Regulations in Relation to the EU Like the European Union (EU), the United Kingdom (UK) is also a contracting party to the World Forum 1958 Agreement. While no longer a member of the EU, the UK’s own type-approval scheme is in part based upon the EU’s type-approval regulation and incorporates the same visibility-related UN Regulations as the EU. This includes UN Regulation 167, which, when fully in effect, will impose certain direct vision requirements on new trucks. Source: GAO analysis of UNECE documentation and UK guidance and regulations. | GAO‑26‑107954 |
The same visibility-related regulations we previously identified as part of the EU type-approval requirements also apply to manufacturers selling vehicles in the UK. The city of London has taken additional steps to directly regulate driver visibility for certain commercial trucks. While the UK type-approval regulations—and the incorporated UN Regulations—seek to address visibility before vehicles enter the market, London has developed a permit system based on driver visibility in the existing fleet of commercial trucks. If a particular vehicle does not meet a minimum safety standard based on visibility, additional safety equipment must be installed.
Transport for London, the designated traffic authority in the Greater London Area, has developed a permit scheme for Heavy Goods Vehicles over 12 tonnes (i.e., commercial trucks) to operate in the Greater London Area, according to Transport for London documentation.[66] According to Transport for London guidance, each commercial truck must obtain a permit, which requires meeting a minimum standard for direct field of vision or installing additional safety equipment. Transport for London determines what, if any, additional safety equipment is required by assigning a safety rating using the Direct Vision Standard, which assigns safety ratings based on how much a driver can directly see in relation to vulnerable road users, according to relevant guidance. According to Transport for London documentation, the Direct Vision Standard was developed in response to data showing commercial trucks were disproportionately involved in more fatal collisions with vulnerable road users compared with other motor vehicles.[67]
To develop the Direct Vision Standard, Transport for London told us that they worked with researchers at Loughborough University to define a methodology for accurately measuring driver visibility in commercial trucks. To develop the standard, the researchers used information provided by truck manufacturers, three-dimensional scans of truck cabs, and other information. According to program guidance, Transport for London adopted a star-rating system to rate truck models based on a driver’s visibility of pedestrians, cyclists, and others. The ratings range from 5 stars (excellent visibility) to 0 stars (poor visibility) (see fig. 14).[68]
Figure 14: Transport for London’s 5-Star Rating System for Commercial Trucks Based on a Driver’s Visibility of Pedestrians and Cyclists
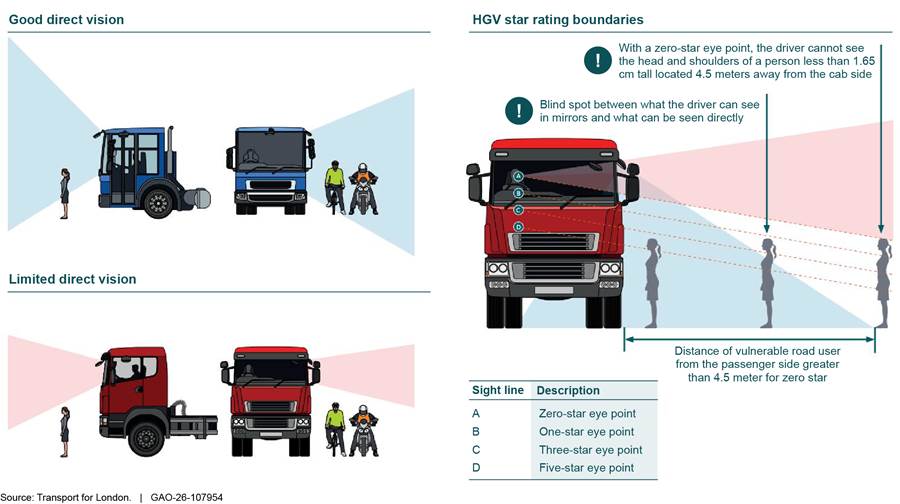
Note: HGVs are heavy goods vehicles (i.e., commercial trucks) with a gross vehicle weight of 12 tonnes (approximately 26,455 pounds) or more.
Transport for London documentation explains that when the permit scheme was launched in 2019, commercial trucks that were unrated or received a rating of 0 stars were required to install additional safety equipment to obtain a permit (referred to as the Safe System). According to implementation guidance, to further reduce crashes where visibility is a contributing factor, the more expansive Progressive Safe System was launched in 2024. Under this version of the permit scheme, commercial trucks with a rating below 3 stars were required to install additional safety equipment, according to relevant guidance. Transport for London officials told us they made this change because Progressive Safe System equipment had advanced enough to improve driver visibility of pedestrians and cyclists, and because there was greater equipment availability in the aftermarket. The officials said there were supply chain issues at the end of 2024, but this improved over time.
According to Transport for London guidance, and as reflected in figure 15, the Progressive Safe System generally requires commercial trucks below 3 stars to install seven components of safety equipment on areas of the vehicle, including mirrors, specific types of sensors, and audible alerts and signage. According to Transport for London officials, as of March 2026, 90 percent of all Progressive Safe System safety permits were issued to vehicles with 0, 1, or 2 stars.
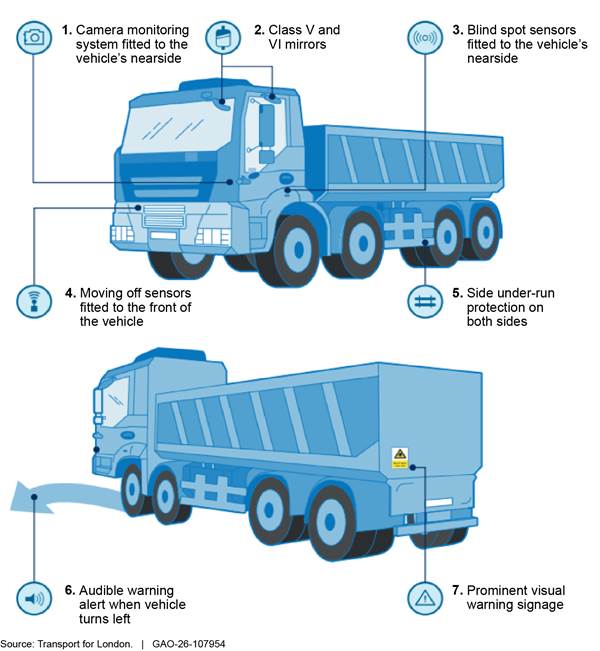
Note: According to Transport for London guidance, the Progressive Safe System generally requires commercial trucks below 3 stars to install this equipment. A Class V mirror is a close-proximity view device with a field of view such that a driver can see a flat horizontal portion of the road along the side of the vehicle. A Class VI mirror is a front-view device that provides a field of view such that a driver can see a flat horizontal portion of the road bounded by a transverse vertical plane through the outermost front of a vehicle, among other things.
The Direct Vision Standard is enforced through a variety of means, according to Transport for London officials. Operating permits are registered to individual vehicles and linked to specific license plates. Enforcement is monitored through use of a city-wide camera system (called Automatic Number Plate Recognition) that captures vehicle registration data (vehicle license plate number) and can track all vehicles coming into or leaving London, according to officials. They explained that if a truck does not have an operating permit or does not have required equipment, the vehicle owner is subject to a fine. Transport for London officials also told us that London police conduct roadside vehicle inspections to check that the Progressive Safe System equipment is installed and functioning correctly.[69]
Implementation of the Direct Vision Standard has involved challenges, including the following:
· Equipment cost. Some stakeholders we spoke with, including associations representing fleet operators, said the cost of equipment to comply with the current Progressive Safe System was a challenge. Transport for London officials estimated the cost of complying with the Progressive Safe System at about £1,500 (about $2,000) per vehicle. Representatives from one association representing smaller fleet operators (20 vehicles or fewer) told us compliance with the Progressive Safe System increased costs for their members due to the requirements for more equipment and more sophisticated equipment. Representatives from another association representing truck operators that varied in size agreed. They said Progressive Safe System equipment is more expensive and sophisticated than the previous Safe System equipment, particularly the blind spot information system and moving-off information system, which depend on advanced technology such as artificial intelligence.
· Equipment availability. Stakeholders said the availability of Progressive Safe System equipment was also a challenge. Representatives from the association representing small fleet operators said their members were expected to comply with the Progressive Safe System by October 2024, but the initial lack of equipment specifications made it difficult to know what to buy. Representatives from the association representing operators that varied in size also told us procuring equipment for the Progressive Safe System was difficult because of the late issuance of equipment specifications by Transport for London. They said having equipment specifications was important, because the nature of the equipment that needed to be obtained changed from passive (e.g., sensors and alerts) under the original requirements, to active (e.g., blind spot information system, which relies on more sophisticated technology to identify pedestrians and cyclists) under the current requirements.[70]
Transport for London officials told us operators had raised concerns about the Progressive Safe System, including insufficient information about what technology and equipment to use. However, the officials said that in developing the specifications, they did not want to be too prescriptive and create a list of approved technologies. Instead, they wanted the equipment specifications to encourage innovation in the type of equipment purchased, and to demonstrate the performance that any safety equipment is expected to achieve. According to Transport for London officials, supply chain–related delays ultimately led Transport for London to extend the deadline for complying with the Progressive Safe System in certain circumstances by 6 months for truck operators who had taken action, but needed more time to procure, install, and verify the safety equipment.
· Equipment quality. Finally, some stakeholders expressed concerns about the quality of some Progressive Safe System equipment. For example, representatives from one fleet operator association stated there was no quality assurance or quality control process related to the Progressive Safe System equipment. Transport for London officials told us they initially invited operators to meet with agency compliance officers and have their equipment checked, but they ultimately decided it was too expensive to check every piece of equipment. Instead, they said Transport for London controls the quality of aftermarket equipment installed under the Progressive Safe System through equipment performance specifications. Further, police conduct spot checks to ensure operators are complying with the Direct Vision Standard. According to Transport for London officials, these checks have shown an approximately 75-percent compliance rate (i.e., that correct equipment was installed). They added that the approximate compliance rate with the safety scheme as a whole is around 94 percent to 98 percent.
Transport for London officials said they planned to conduct a complete review and assessment of the Direct Vision Standard implementation in 2028 to determine whether they need to make any changes, and would implement any such changes starting in 2030. The officials said it was not yet clear whether the Direct Vision Standard had been effective in reducing pedestrian and cyclist fatalities. They said they would examine the results of the Direct Vision Standard in their 2028 program review.[71]
DOT Has Not Fully Analyzed or Addressed the Risks That Limited Driver Visibility Poses to Pedestrians and Cyclists
DOT has conducted some research and begun collecting data on the relationship between driver visibility and risks to pedestrians and cyclists. However, DOT has not fully analyzed or addressed risks. Determining a method to measure driver visibility, including the size of blind zones in cars and trucks, would enable DOT to more fully analyze any relationships between vehicle blind zones and pedestrian and cyclist fatalities, and to assess any risks that specific turning maneuvers and other factors may pose. Taking these steps would position DOT to more fully respond to risks and help DOT meet its goal of reducing roadway fatalities.
DOT Has Conducted Some Research and Begun Collecting Data That Could Be Useful in Analyzing Driver Visibility Risks to Pedestrians and Cyclists
DOT has conducted some research that could be useful in analyzing risks to pedestrians and cyclists related to driver visibility. This research includes studies on changes in blind zones over time, as well as more targeted studies on using a web-based tool to measure blind zones. Examples of this research include the following:
· In 2025, DOT and the Volpe Center participated in a study on blind zones in six top-selling vehicles—one pickup truck, three SUVs, and two cars.[72] The study found that over time, the forward visibility (forward 180-degree arc around the driver) had decreased in all six vehicle models, with the SUVs showing the largest decrease in visibility. However, DOT officials told us this study did not examine whether decreased forward visibility was linked to real-world safety outcomes. Such safety outcomes may include pedestrian and cyclist fatalities or injuries.
· In 2024, the Volpe Center produced a report for the Massachusetts Department of Transportation that studied the range of direct vision afforded to fleet vehicle drivers, among other things.[73] In conducting the study, the project team developed two approaches to represent blind zones of vehicles. One approach used the distance at which a person walking or biking first becomes visible to the forward direction of a driver. The second approach used the area visible to the driver within the forward 180-degree field of view. According to the study, either approach can be generalized to assess blind zones of all passenger and commercial vehicles.
· In 2023, researchers at the Volpe Center evaluated the effectiveness of a web-based application to measure blind zones.[74] The study found the tool offered a fast way to obtain blind zone measurements and could inform potential future driver visibility standards.
· In March 2025, FMCSA officials described a project they had underway examining the relationship between pedestrian fatalities and crashes with large trucks. The project involved reviewing FARS data to identify the most prevalent and risky crash categories involving vulnerable road users, including those at intersections, and causal factors for these crashes. Such factors included vehicles’ blind zones. In addition, as part of the project, FMCSA was conducting a literature review, engaging with stakeholders, and identifying potential crash countermeasures, including those associated with vehicle design and in-vehicle technologies. As of February 2026, DOT had not released the results of this project.
In addition, DOT has begun collecting data that may be useful to analyze the relationship between driver visibility and pedestrian and cyclist safety. These efforts include:
· NHTSA’s Crash Investigation Sampling System (CISS). NHTSA’s CISS collects data from crash scene evidence, crash victims, medical records, and other sources for a representative sample of minor, serious, and fatal crashes involving at least one motor vehicle traveling on a roadway. The Infrastructure Investment and Jobs Act provided additional flexibilities for CISS funding to include additional crash sites, and required NHTSA to collect information on all crash types, including non-motorists (e.g., pedestrians and cyclists).[75] In December 2025, NHTSA reported that the number of sites from which they collect crash information had increased from 32 to 40, and that the scope for CISS investigations included crashes in which at least one non-motorist sustained an injury.[76] According to NHTSA officials, CISS is a useful source of information to analyze driver visibility.[77]
· FMCSA’s Crash Causal Factors Program (CCFP). According to program documents, starting in 2026 and running through 2028, this program will collect and analyze data on a sample of 2,000 fatal crashes involving heavy-duty trucks (those weighing 26,001 pounds or more).[78] This program will examine data on driver, vehicle, motor carrier, and environmental factors related to fatal crashes involving commercial vehicles, to identify the causes of truck crashes. These data will help FMCSA better understand the key factors that contribute to crashes involving large trucks. FMCSA published the results of its last crash causal study involving large trucks in 2006. According to FMCSA officials, driver visibility will be part of this study.
However, DOT officials told us that it has not yet determined whether CISS or CCFP will have the statistical power to fully analyze driver visibility risks to pedestrians and cyclists.
DOT Has Not Fully Analyzed or Addressed Risks to Pedestrians and Cyclists Related to Limited Driver Visibility
While DOT has begun to research and collect data on blind zones and other aspects of driver visibility, it has not fully analyzed or addressed risks as they relate to pedestrians and cyclists. DOT has stated that ensuring safety is one of its primary objectives. In addition, in its fiscal year 2026 Annual Performance Plan, DOT set performance goals to reduce annual roadway fatalities and the annual number of fatalities resulting from crashes involving large trucks and buses.[79] Roadway fatalities include those of pedestrians and cyclists.
Further, Standards for Internal Control in the Federal Government states that conducting risk assessments is critical to achieving agency goals.[80] Risk is defined as the possibility that an event will occur and adversely affect the achievement of objectives. The standards call for management to not only identify risks but also analyze them, develop appropriate responses, and document the results of their risk analysis. Such an analysis can help an agency mitigate those risks and meet goals and objectives, such as improving safety for pedestrians and cyclists.
In our discussion with DOT officials, they indicated that they have not fully analyzed risks that limited driver visibility poses for pedestrian and cyclist safety. In its December 2024 Roadmap for the New Car Assessment Program (NCAP), NHTSA recognized driver visibility as a potential risk to pedestrians and cyclists and stated that it was considering including driver visibility in NCAP in future years.[81] Further, in its Roadmap, NHTSA said it needed to conduct more research on driver visibility to better understand the problem, especially for crashes involving front blind zones. NHTSA said this research, which it described as part of a long-term effort extending from 2024 through 2033, would help develop accurate and rigorous methods of evaluating driver visibility.[82] However, in February 2026, NHTSA officials told us they had not yet analyzed the risks of limited driver visibility related to vehicle size or design. In addition, NHTSA did not indicate whether it planned to evaluate potential risks associated with different types of vehicles (e.g., SUVs and pickup trucks) or driving maneuvers, such as turning. Moreover, NHTSA’s NCAP focuses on passenger vehicles and does not include commercial trucks.
DOT has not fully analyzed or addressed risks to pedestrians and cyclists related to driver visibility because, in part, it has not determined an appropriate method of measuring driver visibility in passenger vehicles and commercial trucks, such as the size of blind zones. Officials said DOT had research underway assessing methods for measuring vehicle visibility, and that this research could be used to potentially examine the correlation between visibility and pedestrian crashes. According to DOT officials, DOT initiated this work in 2025 and expects to complete it in 2027.
Although this research effort is a step in the right direction, it has limitations. For example, the effort does not include medium or heavy-duty commercial trucks, only light vehicles. As discussed earlier, our analysis shows that larger vehicles may pose a greater risk to pedestrians and cyclists when turning compared with cars, partly due to factors related to driver visibility. Further, DOT documentation describing the effort makes no mention of measuring the visibility of pedestrians or cyclists, only the visibility of objects. However, DOT officials told us that this study would include test objects a driver could commonly see while driving, including pedestrians and cyclists.
Specifically measuring the visibility of pedestrians and cyclists is a critical step in mitigating potential risks to these groups. Without a measure, DOT cannot quantify or compare the size of blind zones of different vehicles, to determine the extent to which pedestrians and cyclists are visible to drivers. Having a method to measure driver visibility could give DOT data on the size of blind zones in vehicles that DOT could analyze with its existing data to investigate any relationships between the extent of driver visibility and risks to pedestrians and cyclists.
In addition, having a method to measure driver visibility would facilitate a fuller analysis of the risks that limited driver visibility poses to pedestrians and cyclists and help DOT develop responses to address these risks. Such an analysis would examine the significance of the risk, its likelihood of occurrence, and the magnitude of its effect. For example, with data on the size of blind zones, DOT could leverage the data collected through NHTSA’s FARS, CISS, and CRSS, and FMCSA’s CCFP, to more fully analyze driver visibility risks in real-word crash reports and investigation data. Also, analysis of specific risks related to passenger vehicles and large trucks, such as in different turning maneuvers, would help DOT develop responses that address these risks. By fully analyzing the risks that limited driver visibility poses to the safety of pedestrians and cyclists, DOT will be better able to identify actions to respond to risks. This can help DOT achieve its safety goal of reducing roadway fatalities, including those of pedestrians and cyclists.
Conclusions
The 65-percent increase in the number of pedestrians and cyclists killed annually in motor vehicle crashes from 2010 through 2024 presents a persistent safety challenge to DOT and the nation. The literature we reviewed, and our analysis of federal crash data, highlight potential driver visibility–related risks to pedestrians and cyclists and demonstrate the need for DOT to take steps to address this challenge. Further, DOT’s own research has shown that blind zones in certain vehicles have increased, which may pose risks to pedestrians and cyclists. By determining the appropriate methods for measuring driver visibility for passenger vehicles and commercial trucks, DOT would have a baseline to assess driver visibility limitations and better understand the relationship between visibility and pedestrian and cyclist fatalities. It is particularly important that DOT understand risks posed by larger passenger vehicles and commercial trucks when turning—a maneuver that may reduce a driver’s ability to see pedestrians and cyclists.
DOT also has resources available to address driver visibility risks to pedestrians and cyclists. NHTSA and FMCSA have ongoing research and data collection efforts that could be useful in more fully analyzing risks that both passenger vehicles and commercial trucks pose, including in different driving situations, such as turning maneuvers or starting to move from a stopped position. By fully analyzing risks to pedestrians and cyclists related to limited driver visibility, DOT will be positioned to determine their significance and address them. These steps are critical for enabling DOT to apply its Safe System Approach to this persistent safety challenge and achieve its goal of reducing pedestrian and cyclist fatalities.
Recommendations for Executive Action
We are making the following two recommendations to DOT:
The Secretary of Transportation should determine the appropriate method or methods for measuring driver visibility of pedestrians and cyclists, including the size of blind zones, for passenger vehicles and commercial trucks. (Recommendation 1)
The Secretary of Transportation should take steps to fully analyze and address risks that limited driver visibility poses to the safety of pedestrians and cyclists. Such steps include analyzing the factors related to driver visibility that may pose risks to pedestrians and cyclists, such as type of vehicle, different driving scenarios, and turning maneuvers, and determining actions to reduce risks. (Recommendation 2)
Agency Comments and Our Evaluation
We provided a draft of this report to DOT for review and comment. DOT provided written comments, reproduced in appendix III, and technical comments, which we incorporated as appropriate.
In its written response, DOT stated that it is fully committed to reducing traffic safety risks to pedestrians and cyclists and promoting programs and countermeasures to reduce injuries and fatalities among all users of our nation’s roadways. DOT concurred with the first recommendation and did not concur with the second recommendation.
Specifically, DOT concurred with the first recommendation, to determine an appropriate method or methods for measuring driver visibility of pedestrians and cyclists, including the size of blind zones, for passenger vehicles and commercial trucks. DOT stated that it has ongoing research into methods for measuring visibility. As we note in our report, this ongoing research is a step in the right direction but does not include medium or heavy-duty commercial trucks, only light vehicles. Our report also notes that DOT’s Volpe Center has evaluated methods for assessing blind zones that could be generalized to assess all passenger and commercial vehicles. By fully implementing our recommendation, DOT will have a method to consistently measure the size of blind zones in vehicles to examine any relationships between driver visibility and risks to pedestrians and cyclists.
DOT did not concur with the second recommendation, to take steps to fully analyze and address risks that limited driver visibility poses to the safety of pedestrians and cyclists. In its written response, DOT noted that the recommendation relies on three flawed assumptions that overlook the underlying analytical complexity and are not entirely accurate at this time.
First, DOT’s written response stated that the recommendation assumes that the necessary datasets already exist to isolate the effects of visibility. The recommendation does not make this assumption. Rather, our report notes that DOT has conducted some research and collected data on the relationship between driver visibility and risks to pedestrians and cyclists that could be useful in assessing risks. Our report describes DOT’s efforts to collect data on vehicle safety outcomes through the (1) Crash Investigation Sampling System (CISS), (2) Crash Report Sampling System (CRSS), and (3) Crash Causal Factors Program (CCFP). We recognize that each of these sources has specific purposes and, on their own, may not answer all the questions necessary to fully analyze risks. However, they provide a useful starting point for analysis. Moreover, the availability and quality of data are factors that agencies should consider when identifying, analyzing, and responding to risk, according to Standards for Internal Control in the Federal Government.[83] As such, one of DOT’s steps in analyzing risks could be to review and identify any gaps in available data, and determine the appropriate actions to address them.
Second, DOT stated that the recommendation assumes that relatively more limited visibility introduces a measurable and unreasonable risk to real-world safety outcomes. We disagree that the recommendation makes this assumption. Instead, the recommendation directs DOT to examine this assumption by fully analyzing risks and taking steps to address them. Our analysis of DOT data showed that larger vehicles may pose a greater risk to pedestrians and cyclists when turning, partly due to factors related to driver visibility. In addressing the recommendation, DOT could more directly investigate the relationship between driver visibility and pedestrian and cyclist safety. For example, DOT could draw on work, discussed in our report, that it conducted with the Volpe Center and others to measure changes in blind zones in six top-selling vehicles. DOT could combine these blind-zone measurements, or the measurement it plans to develop in response to recommendation one, with DOT’s data on fatalities and injuries. In doing so, DOT could more fully analyze risks that limited driver visibility poses to pedestrians and cyclists. Such research would provide a starting point for DOT to determine actions to address risks.
Third, DOT stated that the recommendation assumes that policy changes may effectively address any quantifiable effects. As DOT stated in its letter, NHTSA’s mission is to save lives and prevent injuries, among other things, due to crashes on the nation’s roadways. As we describe in our report, NHTSA has multiple avenues to carry out its mission, and multiple datasets and other resources that it could use to fully analyze and address risks posed by limited driver visibility. We continue to believe that given its mission and subject matter expertise in this area, DOT is well positioned to determine policy changes to address risks, and that DOT should fully implement the recommendation.
We are sending copies of this report to the appropriate congressional committees, the Secretary of Transportation, the Administrator of the National Highway Traffic Safety Administration, and the Administrator of the Federal Motor Carrier Safety Administration. In addition, the report is available at no charge on the GAO website at https://www.gao.gov.
If you or your staff have any questions about this report, please contact me at repkoe@gao.gov. Contact points for our Offices of Congressional Relations and Media Relations may be found on the last page of this report. GAO staff who made key contributions to this report are listed in appendix IV.

Elizabeth Repko
Director, Physical Infrastructure
This report (1) examines what studies and federal data show about the relationship between vehicle characteristics, driver visibility, and pedestrian and cyclist fatalities; (2) describes actions that selected auto and commercial truck manufacturers have taken related to driver visibility of pedestrians and cyclists; (3) describes approaches that selected foreign jurisdictions have used to reduce driver visibility–related risks to pedestrians and cyclists; and (4) evaluates the extent to which the Department of Transportation (DOT) has analyzed and responded to potential driver visibility–related risks to pedestrians and cyclists.
To examine the relationship between vehicle characteristics (including size, design, and turning maneuvers), driver visibility, and pedestrian and cyclist fatalities, we identified and reviewed selected studies published from 2015 to 2025. We identified a total of 55 studies for potential inclusion in our review through multiple search methods (see table 2).
|
Search method |
Method description |
Number of studies identified for potential inclusion |
|
Databases |
Searched selected ProQuest, EBSCO, and Dialog databases and Scopus using variations and combinations of terms such as blind zone, design, pedestrian, and windshield. |
17 |
|
Online search engines |
Searched Google Scholar using variations and combinations of terms such as vehicle design, driver direct visibility, and pedestrian and cyclist fatalities. |
7 |
|
Identified by Department of Transportation (DOT) |
Received studies DOT identified as related to driver visibility and pedestrian and cyclist safety. |
8 |
|
Identified by other stakeholders |
Received studies from other stakeholders, such as nonprofit organizations or auto manufacturers, identified as related to driver visibility and pedestrian and cyclist safety. |
6 |
|
“Snowball” |
Reviewed citations in each study to identify additional studies not already identified in previous methods. |
17 |
|
Total |
|
55 |
Source: GAO. | GAO‑26‑107954
For the 55 studies we identified through these search methods, we conducted a multiphase review process to determine their relevance and methodological sufficiency for inclusion in our analysis. Specifically, we:
· Screened for relevance. First, two analysts independently reviewed each of the 55 studies against six criteria, such as the types of vehicles and the vehicle characteristics the study covered. The analysts also assessed whether the study discussed driver visibility and pedestrian and cyclist fatalities, had original results, and had a U.S. scope. For studies whose scope was outside the U.S., the analysts assessed whether the results could be applicable or informative to the U.S. context. Based on these criteria, each analyst determined whether the study should be included or excluded for the methodological review. The two analysts discussed and resolved any differences. We identified 42 studies to be assessed for methodological sufficiency.
· Assessed for sufficiency. GAO specialists assessed the studies that passed relevance screening for methodological sufficiency based on the design, data sources, analysis, originality of findings, and limitations. As with the screening, two specialists independently reviewed each study and determined whether to include it in our final review and noted any limitations. The specialists discussed and resolved any differences in their determinations. We identified 18 studies for inclusion in our report (see table 3).[84]
Table 3: Studies Included in GAO’s Analysis of Literature on Driver Visibility and Vehicle Characteristics
|
Studies |
|
Chiarenza, Jonah, Margo Dawes, Alexander K Epstein, Donald Fisher, and Katherine Welty. Optimizing Large Vehicles for Urban Environments: Downsizing. DOT-VNTSC-NACTO-18-01. Cambridge, MA: December 2018. |
|
Crocetta, Gianmarco, Simone Piantini, Marco Pierini, and Ciaran Simms. “The Influence of Vehicle Front-End Design on Pedestrian Ground Impact.” Accident Analysis and Prevention, vol. 79 (2015): 56-69. |
|
Epstein, Alexander K., Alyssa Brodeur, Juwon Drake, et al. “Longitudinal Analysis of Forward Blind Zone Changes in Popular Vehicle Models (1997-2023).” SAE International Journal of Transportation Safety, vol. 13, no. 1 (2025),: doi.org/10.4271/09‑13‑01‑0005. |
|
Frampton, Richard J., and Jack E. Millington. “Vulnerable Road User Protection from Heavy Goods Vehicles Using Direct and Indirect Vision Aids.” Sustainability, vol. 14, no. 3317 (2022). |
|
Hu, Wen, and Jessica B. Cicchino. “An Examination of the Increases in Pedestrian Motor-vehicle Crash Fatalities During 2009-2016.” Journal of Safety Research, vol. 67 (2018): 37-44. |
|
Hu, Wen, and Jessica B. Cicchino. Effects of Driver Direct Visibility in Passenger Vehicles on the Risk of Turning Crashes with Pedestrians. Arlington, VA: Insurance Institute for Highway Safety, 2025. |
|
Hu, Wen, and Jessica B. Cicchino. “Relationship of Pedestrian Crash Types and Passenger Vehicle Types.” Journal of Safety Research, vol. 82 (2022): 392-401. |
|
Hu, Wen, Samuel S. Monfort, and Jessica B. Cicchino. “The Association Between Passenger-Vehicle Front-End Profiles and Pedestrian Injury Severity in Motor Vehicle Crashes.” Journal of Safety Research, vol. 90 (2024): 115-127. |
|
Johannsen, Heiko, Dietmar Otte, and Martin Urban. “Pre-Crash Analysis of Accidents Involving Turning Trucks and Bicyclists.” Paper presented at the IRCOBI Conference, 2015. |
|
Monfort, Samuel S., and Becky C. Mueller. “A Modern Injury Risk Curve for Pedestrian Injury in the United States: The Combined Effects of Impact Speed and Vehicle Front-End Height.” Journal of Safety Research, vol. 94 (2025): 235-241. |
|
Monfort, Samuel S., Wen Hu, and Becky C. Mueller. “Vehicle Front-End Geometry and In-Depth Pedestrian Injury Outcomes.” Traffic Injury Prevention, vol. 25, no. 4 (2024): 631-639. |
|
Niewoehner, Walter, and F. Alexander Berg. “Endangerment of Pedestrians and Cyclists at Intersections.” Paper Number 05-0344. DEKRA Automobil GmbH. |
|
Pokorny, Petr, Jerome Drescher, Kelly Pitera, and Thomas Jonsson. “Accidents between Freight Vehicles and Bicycles, with a Focus on Urban Areas.” Paper presented at the World Conference on Transport Research, Shanghai, China, July 2016. |
|
Summerskill, Steve, Russell Marshall, Abby Paterson, Anthony Eland, and James Lenard. The Definition, Production and Validation of the Direct Vision Standard (DVS) for HGVS. Final Report for TfL Review. Transport for London, 2018. |
|
Summerskill, Steve, Russell Marshall, Abby Paterson, and Steve Reed. Understanding Direct and Indirect Driver Vision in Heavy Goods Vehicles. Loughborough University Design School, 2015. |
|
Transport for London. Exploring the Road Safety Benefits of Direct vs Indirect Vision in HGV Cabs. Job Number 247997-00. London, United Kingdom: November 2016. |
|
Tyndall, Justin. “The Effect of Front-End Vehicle Height on Pedestrian Death Risk.” Economics of Transportation, vol. 37 (2024): 100342. |
|
Wang, Ming-Hang, and Chien-Hung Wei. “Potential Safety Benefit of the Blind Spot Detection System for Large Trucks on the Vulnerable Road Users in Taiwan.” MATEC Web of Conferences, vol. 81, no. 02007 (2016). |
Source: GAO analysis of selected studies. | GAO‑26‑107954
We analyzed these studies by identifying similar themes related to vehicle design features, driver visibility, and pedestrian and cyclist fatalities or injuries.[85] Specifically, we identified and described similar findings regarding the potential relationships between characteristics including vehicle size, design features, and turning maneuvers, and driver visibility.[86] We also identified and described similar findings regarding potential relationships between these characteristics and pedestrian and cyclist injuries or fatalities.
To further examine the relationship between vehicle characteristics (including size, design, and turning maneuvers), driver visibility, and pedestrian fatalities, we analyzed pedestrian fatality data from the National Highway Traffic Safety Administration’s (NHTSA) Fatality Analysis Reporting System (FARS). We analyzed these data for 2016 through 2023 to determine whether a relationship exists between turning vehicles—a crash scenario in which, according to studies we reviewed, driver visibility of pedestrians may be affected—and pedestrian fatalities. We examined whether any such relationship varied across certain characteristics that could be related to driver visibility, including vehicle type, turning direction, and pedestrian characteristics. See appendix II for full information on our method and results. We assessed the reliability of these data by interviewing NHTSA officials and conducting electronic testing, among other steps. We determined the data to be reliable and sufficient for the purpose of analyzing relationships between vehicle characteristics related to driver visibility and pedestrian fatalities. We did not conduct a similar analysis for cyclist fatalities because there was not a sufficiently large sample size.
To describe actions that selected auto and commercial truck manufacturers have taken related to driver visibility of pedestrians and cyclists, we interviewed a nongeneralizable sample of five passenger vehicle manufacturers and five commercial truck manufacturers.[87] We selected these manufacturers by analyzing 2024 U.S. vehicle sales data. Specifically, using 2024 Bloomberg data, we calculated the market share of each manufacturer, based on the total number of units sold. We then ranked the auto manufacturers and commercial truck manufacturers from the highest number of sales to the lowest number of sales. Based on our ranked list, we contacted a total of 13 manufacturers with high numbers of sales for interviews.
We ultimately interviewed five manufacturers in each category (see table 4). These manufacturers represented approximately 43 percent and 64 percent of passenger vehicle and commercial truck market share respectively, based on their 2024 U.S. vehicle unit sales data (i.e., number of units sold). We reviewed documents provided by the manufacturers and interviewed manufacturers to obtain information about the role that vehicle design plays in driver visibility of pedestrians and cyclists. We asked how manufacturers were addressing issues related to driver visibility, including the role that technologies play in driver visibility of pedestrians and cyclists. We also asked about any challenges they have faced in improving visibility. Our sample is nongeneralizable and intended to provide perspectives on manufacturers’ actions related to driver visibility.
|
Auto manufacturers |
American Honda Motor Company, Inc. |
|
|
Ford Motor Companya |
|
|
General Motors Company |
|
|
Mazda Motor Corporation |
|
|
Subaru of America, Inc. |
|
Truck manufacturers |
Ford Motor Company |
|
|
International Motors, LLC |
|
|
Isuzu Technical Center of America, Inc. |
|
|
PACCAR, Inc. |
|
|
Volvo Trucks North America |
Source: GAO. | GAO‑26‑107954
aGAO met with Ford representatives to discuss both passenger vehicles and commercial trucks.
To describe the approaches that selected foreign jurisdictions have used to reduce the risks to pedestrians and cyclists related to limited driver visibility, we conducted a literature search to identify and select foreign entities that had developed and implemented driver visibility standards. We searched selected ProQuest databases, selected EBSCO databases, Dialog Automotive, and Scopus for English-language academic and trade publications. In addition, we conducted an internet search to identify documents or articles discussing actions foreign jurisdictions have taken to reduce the risk to pedestrians and cyclists related to driver visibility. We also interviewed federal entities and other stakeholders that included industry groups, academia, and safety advocacy organizations. Selection criteria included whether the foreign jurisdiction had taken or was planning to take steps related to driver visibility and pedestrian and cyclist safety, and whether the action focused on passenger or commercial vehicles, among others. Using this methodology, we selected two jurisdictions—the European Union (EU) and London, England—to conduct further work.
For our selected jurisdictions, we reviewed laws, regulations, and other documents about these approaches. This included implementation guides for London’s Direct Vision Standard and background documents on its development. We also interviewed officials from Transport for London; Loughborough University, which helped develop the Direct Vision Standard; and trade associations representing truck operators in London. For the EU, we interviewed officials from the European New Car Assessment Program (Euro NCAP),[88] a trade association representing truck manufacturers in Europe, and selected auto and truck makers that market vehicles in the EU. We discussed topics such as how London and the EU’s approaches were implemented; vehicle changes that auto and truck makers had made (or planned to make) to meet London or EU requirements; and challenges encountered with the approaches.
To evaluate the extent to which DOT has analyzed and responded to potential risks to pedestrians and cyclists related to driver visibility, we reviewed the Federal Motor Vehicle Safety Standards and Federal Motor Carrier Safety Regulations, as well as reports and studies conducted by DOT and the John A. Volpe National Transportation Systems Center (Volpe Center).[89] The latter included studies related to changes in blind zones in vehicles over time, tools for measuring blind zones, and different approaches for measuring blind zones. We also reviewed information on NHTSA’s Crash Investigation Sampling System and the Federal Motor Carrier Safety Administration’s (FMCSA) Crash Causal Factors Program.
We reviewed DOT’s fiscal year 2026 Annual Performance Plan, in which DOT set performance goals to reduce annual roadway fatalities.[90] We also reviewed NHTSA’s 10-year Roadmap for the New Car Assessment Program.[91] We reviewed information in these documents in relation to risk management principles in Standards for Internal Control in the Federal Government.[92] Specifically, we reviewed Principle 7 in these standards, which states that agency management should identify and analyze risks to achieving defined objectives. Further, we interviewed DOT, NHTSA, FMCSA, and Volpe Center officials about actions that DOT has taken to assess driver visibility risks to passengers and cyclists. Finally, we interviewed selected auto and truck makers about potential benefits and challenges of developing driver visibility or direct vision standards in the U.S.
We conducted this performance audit from November 2024 to July 2026 in accordance with generally accepted government auditing standards. Those standards require that we plan and perform the audit to obtain sufficient, appropriate evidence to provide a reasonable basis for our findings and conclusions based on our audit objectives. We believe that the evidence obtained provides a reasonable basis for our findings and conclusions based on our audit objectives.
To identify potential relationships between vehicles turning and pedestrian fatalities, we analyzed nationwide data on all motor vehicle traffic crashes resulting in fatal injuries from the National Highway Traffic Safety Administration’s (NHTSA) Fatality Analysis Reporting System (FARS). We (1) conducted a descriptive analysis of these data, and (2) implemented an odds ratio model.
NHTSA FARS Data Analysis
To analyze factors associated with fatal pedestrian crashes, we obtained FARS data for 2016 through 2023. Within FARS, we selected variables from the non-motorist person file, the vehicle file, and the accident file to create the dataset for our analysis.
Data Preparation
NHTSA makes changes to the categorization of many FARS variables from one year to the next. As we constructed the analysis data set, any variable from the 2016 – 2022 FARS data years that differed in coding from the version of the variable available in the most recent 2023 FARS data had the older version coded forward to match the 2023 coding scheme. All variables in our analysis dataset follow the 2023 FARS coding convention.
After coding prior years forward as needed and appending the data for 2016 through 2022 to the 2023 FARS data, we applied the following filters to the pedestrian data in the order in which the filters are listed:
1. Created a subset for only pedestrians from the data for all non-motorists.[93]
2. Retained crashes in the non-motorist file that involved one or two pedestrians, which were labeled PER_NO 1 or 2.
3. Retained all crashes that involved a single vehicle.
4. Scoped out and removed all crashes in which the striking vehicle was a bus in use at the time of the accident, which were labeled BUS_USE categories 1, 4, 5, 6, 7, 8, or 97.
5. Scoped out and removed all crashes in which the striking vehicle was an emergency response vehicle in emergency use at the time of the accident, which were labeled EMER_USE categories 4, 5, or 6.
6. Scoped out and removed all hit and run accidents in which the body type of the vehicle was missing or unknown, which were labeled HIT_RUN = 1 & BODY_TYP coded as 98 or 99.
We then used a table in appendix C of the 2023 FARS Analytical User’s Manual to assign vehicles to one of six body type categories using the vehicle body type variable (BODY_TYP). We assigned all vehicles to one of the following categories: cars, light trucks (i.e., sport utility vehicles (SUVs) and vans, not including pickup trucks), pickup trucks, medium-duty trucks, heavy-duty trucks, and other/unknown.
Descriptive Analysis
After constructing the initial analysis dataset using the steps described above, we analyzed frequency tables and cross tabs of candidate variables to use for identifying crashes with a potential for driver visibility (based on vehicle type) as one of the contributing factors. Based on this work, we used the pedestrian location (PEDLOC) and pedestrian scenario (PEDSNR) variables from the non-motorist crash groups to identify our target and control group crashes.
Category 1: Target Crash Group
· Vehicle turning left at intersection:
· PEDLOC = 1 & PEDSNR in (5a, 5b, 5c, 5d, 6a, 6b, 6c, 6d, 7a, 7b, 7c, 7d, 8a, 8b, 8c, 8d)
· Vehicle turning right at intersection:
· PEDLOC = 1 & PEDSNR in (9a, 9b, 9c, 9d, 10a, 10b, 10c, 10d, 11a, 11b, 11c, 11d, 12a, 12b, 12c, 12d)
Category 2: Control Crash Group
· Vehicle driving straight through intersection:
· PEDLOC = 1 & PEDSNR in (1a, 1b, 1c, 1d, 2a, 2b, 2c, 2d, 3a, 3b, 3c, 3d, 4a, 4b, 4c, 4d)
Category 3: Remainder
· All other crashes
We retained candidate variables from the accident, non-motorist, and vehicle file for use as control variables in the odds ratio analysis, which we describe below. We selected these control variables based on subject matter expertise and the results of a literature review. The variables were: rural/urban location of crash (RUR_URB), sex of pedestrian involved in crash (PBSEX), light conditions of crash (LGH_COND), weather conditions during crash (WEATHER), and age of pedestrian involved in crash (PBAGE).
Odds Ratio Modeling Analysis
Binary Case-Control Analysis
We used the FARS data to investigate the association between vehicle body type and the odds of a crash potentially related to vehicle design and driver visibility, among crashes resulting in a pedestrian fatality. Without being able to control for vehicle design features, we assumed that size was a good indicator of vehicle design features that change with vehicle size and that affect driver visibility. We used a case-control study design and compared the odds between vehicle body type using odds ratios.
While a cohort design would have been ideal, this study design is impractical, so we opted not to use it. In a cohort design, the analyst randomly samples a representative set of vehicles of the entire U.S. motor vehicle fleet and follows those vehicles to observe a fatal pedestrian crash related to vehicle design and visibility. However, such crashes are rare in relation to the number of vehicles in the fleet.
It is often not observable whether a crash was related to vehicle design. To address this limitation, we defined a case (or “target”) crash by choosing characteristics that are most likely related to design in a manner affecting driver visibility (e.g., a driver turning and having to account for a blind zone when looking for obstacles). We then defined a control crash by choosing characteristics that are most likely not related to design (e.g., driving straight with less potential for vehicle-induced visibility issues). This case-control comparison then serves as a proxy for the odds that a crash related to vehicle-induced driver visibility issues. A case-control study design does not allow for accurate estimates or comparisons of risk of an outcome (e.g., risk of a fatal crash related to vehicle-induced visibility issues for a given body type), because the inclusion of a crash in the study does not account for the number of vehicles at risk.
Table 5 shows the descriptive statistics for the analysis dataset we created using FARS data for 2016 through 2023, as discussed above.
|
Characteristic |
Control, N = 5,128a |
Target, N = 1,759a |
|
Body type |
|
|
|
Car |
2,595 (51%) |
373 (21%) |
|
Sport utility vehicles/vans (not including pickup trucks) |
1,584 (31%) |
543 (31%) |
|
Pickup trucks |
774 (15%) |
575 (33%) |
|
Medium-duty trucks |
89 (1.7%) |
107 (6.1%) |
|
Heavy-duty trucks |
86 (1.7%) |
161 (9.2%) |
|
Urban/rural |
|
|
|
Rural |
2,340 (46%) |
831 (47%) |
|
Urban |
2,788 (54%) |
928 (53%) |
|
Pedestrian sex |
|
|
|
Male |
3,452 (67%) |
845 (48%) |
|
Female |
1,676 (33%) |
914 (52%) |
|
Light/dark |
|
|
|
Dawn/day |
2,507 (49%) |
905 (51%) |
|
Dusk/night |
2,621 (51%) |
854 (49%) |
|
Weather |
|
|
|
Clear |
3,839 (75%) |
1,302 (74%) |
|
Not clear |
1,289 (25%) |
457 (26%) |
|
Target-control with direction |
|
|
|
Control |
5,128 (100%) |
0 (0%) |
|
Target right turn |
0 (0%) |
475 (27%) |
|
Target left turn |
0 (0%) |
1,284 (73%) |
|
Pedestrian age |
|
|
|
17 years to 50 years |
1,966 (39%) |
297 (17%) |
|
16 years or under |
233 (4.6%) |
83 (4.7%) |
|
Over 50 years |
2,890 (57%) |
1,376 (78%) |
|
Unknown |
39 |
3 |
Source: GAO Analysis of Fatality Analysis Reporting System (FARS) data. | GAO‑26‑107954
an (%); Median (IQR)
To estimate the odds of interest while controlling for other factors that may be associated with driver visibility or pedestrian fatalities, we used a logistic regression model. For this analysis, the odds of interest are:

So, in our case-control design comparing vehicle body types, we are interested in:

To compare these odds between different body types, we are interested in an odds ratio (OR), defined as:

where X and Y are two different body types. If OR = 1, then the odds are the same, implying no association, with OR > 1 and OR < 1 indicating an association of different directions and magnitudes. Note that the OR is not a linear measure; for example, an OR of 0.5 reflects the odds for X being half of the odds for Y, while an OR of 2 reflects the odds for X being double the odds for Y (same magnitude but opposite direction).
We estimated these ORs for different body types while controlling for potential confounders using the logistic regression model. We did not include observations with unknown pedestrian age in the analysis. The outcome of the model is binary target or control, with the following covariates: vehicle body type (cars, SUVs and vans, pickup trucks, medium-duty trucks, and heavy-duty trucks), urban/rural location, pedestrian sex, light/dark time of day, dry/not dry weather conditions, and pedestrian age.
We categorized pedestrian age 1) due to a potentially nonlinear relationship affecting driver visibility and crash risk, and 2) for improved interpretability of results. To choose these categories (16 years or under, 17 to 50 years, over 50 years), we first compared density estimate plots of pedestrian age among case and among control accidents, and then selected cut points where these densities change visually.
We set the reference groups for the above covariates to cars, rural, male, dawn/day, clear, and between 17 and 50 years of age, respectively. The model parameters related to body type then served as the ORs for the corresponding body type compared with cars, controlling for these covariates. The other model parameters served as ORs comparing the labeled value for a covariate with its reference level. Table 6 shows OR estimates and 95-percent confidence intervals for these parameters.
Table 6: Parameter Estimates and 95-Percent Confidence Intervals from Binary Logistic Regression Case-Control Analysis
|
Covariate |
Odds ratio estimate (confidence interval) |
|
Body type |
|
|
Sport utility vehicles/vans (not including pickup trucks) |
2.37 (2.04, 2.76) |
|
Pickup trucks |
5.05 (4.3, 5.92) |
|
Medium-duty trucks |
8.73 (6.34, 12.06) |
|
Heavy-duty trucks |
16.46 (12.18, 22.42) |
|
Urban/rural |
|
|
Urban |
0.98 (0.87, 1.11) |
|
Pedestrian sex |
|
|
Female |
2.27 (2.01, 2.56) |
|
Conditions |
|
|
Light/dark: dusk/night |
0.94 (0.83, 1.06) |
|
Weather: not clear |
1.06 (0.93, 1.22) |
|
Pedestrian age |
|
|
16 years or under |
2.14 (1.58, 2.88) |
|
Over 50 years |
3.55 (3.06, 4.12) |
Source: GAO Analysis of Fatality Analysis Reporting System (FARS) data. | GAO‑26‑107954
Note: Each estimate reflects the estimated odds ratio between the labeled value and the corresponding variable’s reference level. Reference levels are cars (body type), rural location (urban/rural), male (pedestrian sex), dawn/day (light/night), clear (weather), and 17 to 50 years (pedestrian age).
Based on the model, the following estimates were statistically significant: the odds of a target versus control accident for SUVs/vans are 2.37 times the odds for cars; for pickup trucks are 5.05 times the odds for cars; for medium-duty trucks are 8.73 times the odds for cars; for heavy-duty trucks are 16.46 times the odds for cars; for female pedestrians are 2.27 times the odds for male pedestrians; for pedestrians 16 years old or younger are 2.14 times the odds for pedestrians from 17 to 50 years old; and for pedestrians over 50 years old are 3.55 times the odds for pedestrians from 17 to 50 years old; controlling for all other variables in the model.
Multivariate Case-Control Analysis
We also conducted an odds-ratio analysis that considers vehicle turning direction during a crash to create a three-outcome model: target crash and left turn, target crash and right turn, and target crash. Target and control have the same definitions as above. As a result, we can define three different odds:



As above, we constructed ORs by body type and estimated the corresponding ORs, controlling for other covariates. To do this, we used a multinomial logistic regression model with the same covariates defined previously and the same respective reference groups. We did not include observations with missing pedestrian age in the analysis. The results of this model were similar to the original logistic regression model that we used with a binary outcome; the only difference was that the model estimates reflected ORs specific to each of the three types of odds defined above.
The model parameters related to body type served as the ORs for the corresponding body type compared with cars, controlling for these covariates. The other model parameters served as ORs comparing the labeled value for a covariate with its reference level. Since the outcome has three potential values, there are three sets of ORs, each comparing one outcome value with another. Table 7 shows estimates and 95-percent confidence intervals for these parameters, along with which OR comparison they relate to.
Table 7: Parameter Estimates and 95-Percent Confidence Intervals from Multinomial Logistic Regression Case-Control Analysis
|
Outcome comparison |
Covariate |
Odds ratio estimate (confidence interval) |
|
Target & right turn versus control |
Body type: sport utility vehicles (SUVs)/vans (not including pickup trucks) |
2.71 (2.05, 3.58) |
|
Body type: pickup trucks |
4.86 (3.63, 6.5) |
|
|
Body type: medium-duty trucks |
11.23 (7.01, 18.01) |
|
|
Body type: heavy-duty trucks |
39.58 (27.15, 57.69) |
|
|
Urban/rural: urban |
0.92 (0.76, 1.13) |
|
|
Pedestrian sex: female |
1.97 (1.61, 2.41) |
|
|
Light/dark: dusk/night |
0.91 (0.75, 1.11) |
|
|
Weather: not clear |
1.16 (0.93, 1.45) |
|
|
Pedestrian age: 16 years or under |
1.93 (1.2, 3.08) |
|
|
Pedestrian age: over 50 years |
2.47 (1.95, 3.13) |
|
|
Target & left turn versus control |
Body type: SUVs/vans (not including pickup trucks) |
2.27 (1.92, 2.69) |
|
Body type: pickup trucks |
5.11 (4.29, 6.09) |
|
|
Body type: medium-duty trucks |
7.97 (5.61, 11.31) |
|
|
Body type: heavy-duty trucks |
8.54 (5.94, 12.28) |
|
|
Urban/rural: urban |
1.01 (0.88, 1.15) |
|
|
Pedestrian sex: female |
2.38 (2.09, 2.72) |
|
|
Light/dark: dusk/night |
0.95 (0.83, 1.09) |
|
|
Weather: not clear |
1.03 (0.88, 1.2) |
|
|
Pedestrian age: 16 years or under |
2.26 (1.61, 3.19) |
|
|
Pedestrian age: over 50 years |
4.12 (3.46, 4.89) |
|
|
Target & right turn versus target & left turn |
Body type: SUVs/vans (not including pickup trucks) |
1.19 (0.88, 1.63) |
|
Body type: pickup trucks |
0.95 (0.69, 1.3) |
|
|
Body type: medium-duty trucks |
1.41 (0.87, 2.29) |
|
|
Body type: heavy-duty trucks |
4.63 (3.11, 6.91) |
|
|
Urban/rural: urban |
0.92 (0.74, 1.14) |
|
|
Pedestrian sex: female |
0.83 (0.67, 1.03) |
|
|
Light/dark: dusk/night |
0.96 (0.77, 1.19) |
|
|
Weather: not clear |
1.13 (0.89, 1.44) |
|
|
Pedestrian age: 16 years or under |
0.85 (0.5, 1.44) |
|
|
Pedestrian age: over 50 years |
0.6 (0.46, 0.79) |
Source: GAO Analysis of Fatality Analysis Reporting System (FARS) data. | GAO‑26‑107954
Note: Each estimate reflects the estimated odds ratio between the labeled value and the corresponding variable’s reference level, for each set of odds ratios in the model (outcome comparison). Reference levels are cars (body type), rural location (urban/rural), male (pedestrian sex), dawn/day (light/dark), clear (weather), and 17 to 50 years (pedestrian age).
Based on the model, the following estimates were statistically significant:
Target and right turn versus control. The odds of a target and right turn crash versus the control for SUVs/vans are 2.71 times the odds for cars; for pickup trucks are 4.86 times the odds for cars; for medium-duty trucks are 11.23 times the odds for cars; for heavy-duty trucks are 39.58 times the odds for cars; for female pedestrians are 1.97 times the odds for male pedestrians; for pedestrians 16 years old or younger are 1.93 times the odds for pedestrians from 17 to 50 years old; and for pedestrians over 50 years old are 2.47 times the odds for pedestrians from 17 to 50 years old; controlling for all other variables in the model.
Target and left turn versus control. The odds of a target and left turn crash versus control for SUVs/vans are 2.27 times the odds for cars; for pickup trucks are 5.11 times the odds for cars; for medium-duty trucks are 7.97 times the odds for cars; for heavy-duty trucks are 8.54 times the odds for cars; for female pedestrians are 2.38 times the odds for male pedestrians; for pedestrians 16 years old or younger are 2.26 times the odds for pedestrians from 17 to 50 years old; and for pedestrians over 50 years old are 4.12 times the odds for pedestrians from 17 to 50 years old; controlling for all other variables in the model.
Target and right turn versus target and left turn. The odds of a target and right turn crash versus a target and left turn crash for heavy-duty trucks are 4.63 times the odds for cars, and for pedestrians over 50 years old are 0.6 times the odds for pedestrians from 17 to 50 years old, controlling for all other variables in the model.
Case-Control Analysis Limitations
The case-control analyses have several limitations. First, case-control designs cannot accurately estimate the risk of an outcome, because the data do not reflect the total distribution of the vehicle fleet in use on U.S. roadways. However, case-control designs can estimate ORs accurately, with a difference in odds providing evidence of a potential difference in the risk. Such risk needs to be corroborated with additional study.
Second, the results of these analyses should not be interpreted causally, because
· the comparison we made in these analyses is a proxy of the comparison of interest (i.e., if a crash was induced by vehicle design and related to driver visibility), which is unobservable;
· the data we analyzed are observational and contain no experimental or quasi-experimental design, and so are susceptible to confounding effects not specified or controlled for in the modeling; and
· we analyzed only crashes involving a pedestrian fatality. As a result, the probability of a fatal accident cannot be estimated from these analyses when comparing body types, as all crash data and associated outcomes (such as fatalities and nonfatalities) are not available.
GAO Contact
Elizabeth Repko, repkoe@gao.gov
Staff Acknowledgments
In addition to the contact named above, Matt Barranca (Assistant Director), McKenna Ventura (Analyst in Charge), Carl Barden, Sarah Craig, Emily Crofford, Kevin Donovan, Richard Jorgenson, Maria Mercado, Joshua Ormond, Katherine Raymond, Norma-Jean Simon, Amber Sinclair, Pamela Snedden, Amy Suntoke, Laurel Voloder, and Alicia Wilson made key contributions to this report.
The Government Accountability Office, the audit, evaluation, and investigative arm of Congress, exists to support Congress in meeting its constitutional responsibilities and to help improve the performance and accountability of the federal government for the American people. GAO examines the use of public funds; evaluates federal programs and policies; and provides analyses, recommendations, and other assistance to help Congress make informed oversight, policy, and funding decisions. GAO’s commitment to good government is reflected in its core values of accountability, integrity, and reliability.
Obtaining Copies of GAO Reports and Testimony
The fastest and easiest way to obtain copies of GAO documents at no cost is through our website. Each weekday afternoon, GAO posts on its website newly released reports, testimony, and correspondence. You can also subscribe to GAO’s email updates to receive notification of newly posted products.
Order by Phone
The price of each GAO publication reflects GAO’s actual cost of production and distribution and depends on the number of pages in the publication and whether the publication is printed in color or black and white. Pricing and ordering information is posted on GAO’s website, https://www.gao.gov/ordering.htm.
Place orders by calling (202) 512-6000, toll free (866) 801-7077,
or
TDD (202) 512-2537.
Orders may be paid for using American Express, Discover Card, MasterCard, Visa, check, or money order. Call for additional information.
Connect with GAO
Connect with GAO on X,
LinkedIn, Instagram, and YouTube.
Subscribe to our Email Updates. Listen to our Podcasts.
Visit GAO on the web at https://www.gao.gov.
To Report Fraud, Waste, and Abuse in Federal Programs
Contact FraudNet:
Website: https://www.gao.gov/about/what-gao-does/fraudnet
Automated answering system: (800) 424-5454
Media Relations
Sarah Kaczmarek, Managing Director, Media@gao.gov
Congressional Relations
David A. Powner, Acting Managing Director, CongRel@gao.gov
General Inquiries
[1]NHTSA, Traffic Safety Facts 2010 Data, DOT HS 811 630 (June 2012); Traffic Safety Facts 2024 Data, DOT HS 813 791 (April 2026).
[2]GAO, Driver Assistance Technologies: NHTSA Should Take Action to Enhance Consumer Understanding of Capabilities and Limitations, GAO‑24‑106255 (Washington, D.C.: Mar. 28, 2024); Pedestrian Safety: NHTSA Needs to Decide Whether to Include Pedestrian Safety Tests in Its New Car Assessment Program, GAO‑20‑419 (Washington, D.C.: Apr. 23, 2020); Pedestrians and Cyclists: Cities, States, and DOT Are Implementing Actions to Improve Safety, GAO‑16‑66 (Washington, D.C.: Nov. 19, 2015).
[3]GAO‑20‑419. In GAO-20-419, our scope included passenger cars, SUVs, light trucks and vans that were offered for sale in the U.S.
[4]Alexander K. Epstein, Alyssa Brodeur, Juwon Drake, Eric Englin, Donald L. Fisher, Stephen Zoepf, Becky C. Mueller, and Haden Bragg, “Longitudinal Analysis of Forward Blind Zone Changes in Popular Vehicle Models (1997-2023),” SAE International Journal of Transportation Safety, vol. 13, no. 1 (2025), doi.org/10.4271/09-13-01-0005. This study was coauthored by IIHS and DOT’s Volpe Center. IIHS is an independent, nonprofit scientific and educational organization focused on reducing deaths, injuries, and property damage from motor vehicle crashes through research and evaluation and through education of consumers, policymakers, and safety professionals. IIHS has collaborated with DOT on vehicle safety research.
[5]For the purposes of our review, passenger vehicles include cars, SUVs vans, and pickup trucks. We met with representatives from one manufacturer to discuss both passenger vehicles and commercial trucks.
[6]DOT established the Volpe Center in 1970, and its mission is to improve the U.S. transportation system by anticipating emerging issues and advancing technical, operational, and institutional innovations for the public good. DOT operating administrations enter into agreements with the Volpe Center for a variety of services, including research.
[7]U.S. Department of Transportation, FY 2026 Annual Performance Plan (undated); and New Car Assessment Program Final Decision Notice-Advanced Driver Assistance Systems and Roadmap, 89 Fed. Reg. 95,916 (Dec. 3, 2024).
[8]GAO, Standards for Internal Control in the Federal Government, GAO‑25‑107721 (Washington, D.C.: May 15, 2025).
[9]Pedestrian and cyclist fatalities involving motorcycles also increased notably from 2010 to 2024. However, such crashes made up less than 1 percent of all pedestrian and cyclist fatalities throughout the 15-year period, and we did not include motorcycles in the scope of our report.
[10]We reported fatalities by vehicle type separately for 2010 to 2019 and 2020 to 2024 because NHTSA changed its vehicle classification methodology in 2020. According to NHTSA, vehicle type classifications for 2020 and later are not comparable to vehicle type classifications for 2019 and earlier. NHTSA stated that most of the changes appear in passenger vehicles, with the new methodology showing declines in cars and increases in light trucks, especially SUVs.
[11]Pedestrian and cyclist fatalities resulting from crashes with motorcycles increased 17 percent from 2023 to 2024, from 64 fatalities to 75 fatalities. However, as noted above, such crashes comprise a small percentage of all pedestrian and cyclist fatalities, and we did not include motorcycles in the scope of our report.
[12]GAO, Pedestrians and Cyclists: Better Information to States and Enhanced Performance Management Could Help DOT Improve Safety, GAO‑21‑405 (Washington, D.C.: May 20, 2021); and GAO‑20‑419; GAO‑16‑66.
[17]National Highway Traffic Safety Administration, Fatality Analysis Reporting System Analytical User’s Manual, 1975-2024, DOT HS 813 794 (Washington, D.C.: April 2026).
[18]Samuel S. Monfort, Wen Hu, and Becky C. Mueller, “Vehicle Front-End Geometry and In-Depth Pedestrian Injury Outcomes,” Traffic Injury Prevention, vol. 25, no. 4 (2024): 631-639.
[20]These areas are popularly referred to as “blind spots.” We refer to them as blind zones, because this terminology more accurately captures the potential size of these areas and is consistent with language in studies of vehicle safety and driver visibility, including DOT studies.
[21]The vehicle safety standards are located in 49 C.F.R. Part 571 and cover a wide range of vehicle characteristics. For example, NHTSA requires all passenger cars and trucks, among other vehicles, to have rear visibility systems—including direct vision features and indirect vision features like mirrors and cameras—that provide a driver with a rearview image as specified for each vehicle type. 49 C.F.R. § 571.111.
[22]49 U.S.C. §§ 30112, 30115.
[23]New Car Assessment Program Final Decision Notice—Crashworthiness Pedestrian Protection, 89 Fed. Reg. 93,000 (Nov. 25, 2024). NHTSA also published a second final decision notice in December 2024 to include pedestrian automatic emergency braking in NCAP, evaluated in day and night lighting conditions. See New Car Assessment Program Final Decision Notice—Advanced Driver Assistance Systems and Roadmap 89 Fed. Reg. 95,916 (Dec. 3, 2024).
[24]Three of the studies identified statistical associations between size and driver visibility, and four used a descriptive approach to illustrate potential relationships.
[25]Epstein, Brodeur, Drake, Englin, Fisher, Zoepf, Mueller, and Bragg, “Longitudinal Analysis of Forward Blind Zone Changes.” This study measured the size of blind zones based on what a male in the 50th percentile for height could see.
[26]Seven of these studies identified statistical relationships between size and severe pedestrian and cyclist injuries or fatalities. The other three studies used a descriptive approach to illustrate potential relationships.
[27]Gianmarco Crocetta, Simone Piantini, Marco Pierini, and Ciaran Simms, “The Influence of Vehicle Front-End Design on Pedestrian Ground Impact,” Accident Analysis and Prevention, 79 (2015): 56-69. This study simulated pedestrian accidents and ground impact with varying factors, including vehicle type, speed, and pedestrian type parameters. Speed was also determined to be an important factor.
[28]We considered height to be a characteristic related to size, not design.
[29]Justin Tyndall, “The Effect of Front-End Vehicle Height on Pedestrian Death Risk,” Economics of Transportation, 37 (2024): 100342.
[30]Blind zones are also attributable to situational or driver factors. For instance, the size of a driver can affect their ability to see certain areas around the vehicle. Five of these studies used a descriptive approach to illustrate how design may affect visibility, and two measured statistical relationships between design features and visibility.
[31]Epstein, Brodeur, Drake, Englin, Fisher, Zoepf, Mueller, and Bragg, “Longitudinal Analysis of Forward Blind Zone Changes.” According to DOT, while larger outside mirrors can contribute to forward blind zones, they also improve rear visibility.
[32]Monfort, Hu, and Mueller, “Vehicle Front-End Geometry.” This study did not directly measure blind zones; however, the authors suggested that the tall, blunt front end may obscure the sight of the roadway, contributing to pedestrian crashes.
[33]Two of these studies measured statistical relationships between front-end shape and fatality risk, and two used a descriptive approach.
[34]Wen Hu, Samuel S. Monfort, and Jessica B. Cicchino, “The Association Between Passenger-Vehicle Front-End Profiles and Pedestrian Injury Severity in Motor Vehicle Crashes,” Journal of Safety Research, 90 (2024): 115-127.
[35]One of these studies was from a working group that examined existing literature and made recommendations regarding driver visibility and commercial trucks.
[36]Jonah Chiarenza, Margo Dawes, Alexander K Epstein, Donald Fisher, and Katherine Welty, “Optimizing Large Vehicles for Urban Environments: Downsizing,” DOT-VNTSC-NACTO-18-01 (Cambridge, MA: December 2018).
[37]Five studies used a descriptive approach and four used statistical methods to evaluate or discuss potential relationships between maneuvers and visibility or pedestrian and cyclist injuries and fatalities. One of the studies found that turning vehicles were significantly less likely to kill a pedestrian, probably due to a turning vehicle’s relatively low speed. See Hu, Monfort, and Cicchino, “The Association Between Passenger-Vehicle Front-End Profiles and Pedestrian Injury Severity.”
[38]Steve Summerskill, Russell Marshall, Abby Paterson, Anthony Eland, and James Lenard, The Definition, Production and Validation of the Direct Vision Standard (DVS) for HGVS. Final Report for TfL Review (Transport for London, 2018).
[39]Wen Hu and Jessica B. Cicchino, Effects of Driver Direct Visibility in Passenger Vehicles on the Risk of Turning Crashes with Pedestrians (Arlington, VA: Insurance Institute for Highway Safety, 2025). According to DOT, right turning crashes can also be related to driver behavior. For example, a driver may be looking left at an intersection for oncoming vehicle traffic and never look to the right for a pedestrian or cyclist.
[40]Wen Hu and Jessica B. Cicchino, “Relationship of Pedestrian Crash Types and Passenger Vehicle Types,” Journal of Safety Research, vol. 82 (2022): 392-401.
[41]Hu, Monfort, and Cicchino, “The Association Between Passenger-Vehicle Front-End Profiles and Pedestrian Injury Severity.”
[42]We modeled our analysis after other studies, such as those conducted by IIHS and the Volpe Center, that similarly conducted an odds-ratio analysis of fatal pedestrian crashes and characteristics related to driver visibility. See, for example, Hu and Cicchino, Effects of Driver Direct Visibility in Passenger Vehicles on the Risk of Turning Crashes with Pedestrians.
[43]We assumed cars to be the smallest vehicle body type with the smallest visibility obstructions. We also assumed that obstructed visibility would be less likely to be a contributing factor to fatal crashes with pedestrians when the vehicle was going straight through the intersection. We controlled for other variables such as weather, time of day, pedestrian age, and geographic location (urban versus rural).
[44]Light vehicles (SUVs, vans, and pickup trucks) are subject to different safety standards than medium- and heavy-duty vehicles.
[45]No other vehicle types had a significant relationship with turning direction. We determined each of these odds by comparing different vehicle types with the odds of involvement in a fatal pedestrian crash for cars in the same scenarios, among all fatal pedestrian crashes.
[46]According to Centers for Disease Control and Prevention data, from 2021 through 2023, the average 2- to 17-year-old male was from about 3 feet, 2 inches to 5 feet, 9 inches tall. During that same period, the average height for males 50 and older was from 5 feet 7 inches to 5 feet 9 inches, while the average 18- to 49-year-old male was about 5 feet, 9 inches tall.
[47]Summerskill, Marshall, Paterson, Eland, and Lenard, The Definition, Production and Validation of the Direct Vision Standard (DVS) for HGVS. Final Report for TfL Review. This study found that, among accidents between trucks and pedestrians or cyclists in the United Kingdom, there is an increase in fatalities for pedestrians above age 60. The authors inferred that pedestrians over 60 are disproportionately represented in such accidents and that, therefore, there is the potential for older people to be unable to move out of the way of a truck that is starting from a stopped position at a pedestrian crossing.
[48]We used a case-control study design with target and control groups. See appendix II for more information on our study design and limitations.
[49]Heiko Johannsen, Dietmar Otte, and Martin Urban, “Pre-crash Analysis of Accidents Involving Turning Trucks and Bicyclists,” paper presented at the IRCOBI Conference, 2015. Walter Niewoehner and F. Alexander Berg, “Endangerment of Pedestrians and Cyclists at Intersections,” Paper Number 05-0344 (DEKRA Automobil GmbH). Summerskill, Marshall, Paterson, Eland, and Lenard, The Definition, Production and Validation of the Direct Vision Standard (DVS) for HGVS. Final Report for TfL Review.
[50]For example, one manufacturer identified FMVSS 208 (occupant crash protection) and FMVSS 216a (roof crush resistance) as regulations related to vehicle crashworthiness. 49 C.F.R §§ 571.208; 571.216a. According to DOT officials, NHTSA establishes performance standards in FMVSS that manufacturers must meet when designing their vehicles. DOT officials told us DOT does not set design standards for vehicles; rather, manufacturers design their vehicles to meet federal performance requirements laid out in regulation.
[51]Representatives from the manufacturer said that it is possible for a driver to sit too high, which can also present visibility challenges.
[52]According to DOT officials, the driver’s side mirror obstructs part of the driver’s forward view and therefore would contribute to forward blind zones. Larger outside rearview mirrors would contribute to better rear visibility.
[53]In the U.S., side mirrors are generally required by regulation for passenger vehicles and commercial trucks. Specifically, FMVSS 111 describes requirements for rear visibility systems for passenger vehicles, and in general, vehicles must have flat or planar mirrors outside the vehicle, as well as inside, for some types of vehicle. See 49 C.F.R. § 571.111. Federal regulation also requires that buses, trucks, and truck tractors be equipped with one mirror on each side of the truck to provide rear visibility. See 49 C.F.R § 393.80.
[54]We have previously reported on driver assistance systems. See GAO‑20‑419 and GAO‑24‑106255. For example, in 2020, we found that most auto manufacturers reported offering various pedestrian safety features and that there are benefits and challenges associated with these technologies. In 2024, we reported that research suggests that consumers do not always have awareness or an accurate understanding of various technologies.
[55]See GAO‑24‑106255 for additional information.
[56]PAEB is related to automatic emergency braking, which is a system that automatically brakes when sensors determine that a frontal crash is imminent and the driver has not braked.
[57]DOT’s unified agenda for Spring 2025 includes an entry suggesting a planned Supplemental Notice of Proposed Rulemaking will delay the implementation date by two years, among other potential changes. If the substantive requirements in the current version of FMVSS 127 ultimately take effect without change, it will require PAEB on all passenger vehicles and on multipurpose passenger vehicles, trucks, and buses that are 10,000 pounds or less. 49 C.F.R § 571.127.
[58]According to DOT officials, unless a manufacturer develops a PAEB system that works at low speeds (speeds below 6.2 miles per hour), the system would not intervene to prevent a low-speed crash with a pedestrian, such as a crash in a parking lot, driveway, or when the vehicle is moving off through a crosswalk. The rule also does not require a PAEB system to work above 90.1 miles per hour.
[59]NHTSA requires that manufacturers have back-up cameras installed in all new passenger cars manufactured on or after May 1, 2018, to expand the rear-view field of vision for drivers. For additional requirements related to rear-view visibility, see 49 C.F.R § 571.111.
[60]The Society of Automotive Engineers International is a global association of engineers and technical experts in the aerospace, automotive, and commercial vehicle industries. See Society of Automotive Engineers, Describing and Evaluating the Truck Driver’s Viewing Environment, J1750-2024, for its recommended practice related to truck drivers’ visibility. The Technology and Maintenance Council, a part of the American Trucking Associations, is an association representing the commercial truck industry and sets standards to help truck companies specify and maintain their fleets. See Technology and Maintenance Council, Guidelines for Vision Devices, RP 428A, for its recommended practice related to minimum driver vision requirements.
[61]UN Regulation 125 covers forward field of vision requirements. U.N. Econ. Comm’n for Eur., Uniform Provisions Concerning The Approval Of Motor Vehicles With Regard To The Forward Field Of Vision Of The Motor Vehicle Driver, U.N. Doc E/TRANS/505/Rev.2/Add.124 (Nov. 9, 2007) (as revised and amended). UN Regulation 167 contains direct vision requirements for some classes of vehicles. U.N. Econ. Comm’n for Eur., Uniform Provisions Concerning the Approval of Motor Vehicles with Regard to Their Direct Vision, E/ECE/TRANS/505/Rev.3/Add.166 (June 8, 2023) (as amended).
[62]UN Regulation 151 covers blind spot information systems. U.N. Econ. Comm’n for Eur., Uniform provisions concerning the approval of motor vehicles with regard to the Blind Spot Information System for the Detection of Bicycles, E/ECE/TRANS/505/Rev.3/Add.150 (Aug. 18, 2021) (as amended). UN Regulation 159 covers moving-off information systems. U.N. Econ. Comm’n for Eur., Uniform provisions concerning the approval of motor vehicles with regard to the Moving Off Information System for the Detection of Pedestrians and Cyclists, E/ECE/TRANS/505/Rev.3/Add.158 (June 10, 2021) (as amended).
[63]According to Euro NCAP officials, the group’s membership includes organizations from both the public and private sectors. Members include governmental authorities, mobility advocacy groups, and insurance companies, among others. Vehicle manufacturers are not members but are partners in testing. Euro NCAP officials told us one of their primary goals is to incentivize manufacturers to increase the safety of their vehicles.
[64]The Euro NCAP rating scheme also includes a “City Safe” award. According to Euro NCAP, the City Safe award only applies to truck ratings and recognizes high performance across key elements that serve to protect vulnerable road users in urban areas. This includes direct and indirect vision and technology (Automatic Emergency Braking), which reacts to pedestrians and cyclists in the road ahead as well as cyclists in near side turns. Manufacturers must score at least 3 stars to receive a City Safe award.
[65]According to Euro NCAP material, there are four components to the commercial truck rating scheme: Safe Driving, Crash Avoidance, Crash Protection, and Post-Crash. Vision is part of the Safe Driving component. Euro NCAP officials told us UN Regulation 167, which addresses direct vision for heavy-duty trucks, serves as the basis for their truck rating system.
[66]The permit scheme applies to vehicles or trailers over 12,000 tonnes hauling goods. The British tonne is legally defined as 1,000 kilograms. Weights and Measures Act 1985 §1(2), sch. 1 (UK). Twelve tonnes is equivalent to approximately 26,455 pounds. For the purposes of our report, we refer to such vehicles as “commercial trucks.”
[67]According to Transport for London guidance, the permit scheme also aimed to support the mayor of London’s Vision Zero Plan, which called for the elimination of all deaths and serious injuries on London’s streets by 2041.
[68]The methodology behind the star-rating system used a volumetric projection of the field of view of the driver via the windows in the truck cab and represents the volume of space around a truck cab that a driver can see to the front and sides of the vehicle. For more information about this methodology and how it was developed, see Steve Summerskill, Russell Marshall, Abby Paterson, Anthony Eland, and James Lenard, The Definition, Production, and Validation of the Direct Vision Standard (DVS) for HGVS, Final Report for TfL.
[69]Transport for London officials told us they also conduct roadside inspections of vehicles that access Transport for London property.
[70]According to a Transport for London official, the final specifications for the blind spot and moving-off information systems were issued in September 2023.
[71]Transport for London officials said they publish road safety data on their website, if someone wanted to see collision rates as they are reported.
[72]Epstein, Brodeur, Drake, Englin, Fisher, Zoepf, Mueller, and Bragg, “Longitudinal Analysis of Forward Blind Zone Changes.”
[73]U.S. Department of Transportation, Volpe Center, Commonwealth of Massachusetts, Direct Vision Study: Current Fleet Analysis and Potential Safety Criteria, DOT-VNTSC-MADOT-24-01, prepared for Massachusetts Department of Transportation (July 2024).
[74]Juwon Drake, Alessandra Vennema, Lily Slonim, Eric Englin, Alyssa Brodeur, Alexander K. Epstein, and Donald L. Fisher, “Evaluating the Performance of a Web-Based Vehicle Blind Zone Estimation Application: Validation and Policy Implications,” Frontiers in Future Transportation, vo. 4 (2023), doi.org/10.3389/ffutr.2023.1003175.
[75]Pub. L. 117-58 § 24108, 135 Stat 429, 809 (2021).
[76]In addition to CISS, NHTSA has also collected crash data since the early 1970s through the Crash Report Sampling System (CRSS). According to DOT,CRSS is a sample of police-reported crashes involving all types of motor vehicles, pedestrians, and cyclists, and is used to estimate the overall crash picture, identify highway safety problem areas, measure trends, drive consumer information initiatives, and form the basis for cost and benefit analyses of highway safety initiatives and regulations.
[77]DOT officials also told us NHTSA’s Special Crash Investigations program began documenting crashes in which a vehicle was moving forward from a stopped (or nearly stopped) position. These cases were investigated as “frontover” cases, and they address visibility, both vehicle and environmental. According to NHTSA, the Special Crash Investigations program provides in-depth, detailed crash data for examining special crash circumstances or outcomes from an engineering perspective. Although NHTSA has reported that there is no specific definition for a frontover crash, in general it is when someone is killed or injured when hit by the front of a vehicle moving off from a stopped or nearly stopped position.
[78]According to FMCSA, CCFP was established to meet requirements in the Infrastructure Investment and Jobs Act for a study of commercial motor vehicle crash causation. Pub L. 117-58 § 23006, 135 Stat 429, 760-761.
[79]U.S. Department of Transportation, FY 2026 Annual Performance Plan (undated).
[81]New Car Assessment Program Final Decision Notice—Advance Driver Assistance Systems and Roadmap, 89 Fed. Reg. 95,916 (Dec. 3, 2024).
[82]According to its website, NHTSA prioritizes updates to NCAP that have the greatest safety impact. NHTSA uses four prerequisites when considering updates to the program: (1) Does the update address a significant safety need? (2) Do vehicle designs exist for the update? (3) Does the update have the potential to improve safety? and (4) Does an objective test procedure exist for the update? Once the prerequisites for an update are met, NHTSA begins the updating process, which includes requesting, reviewing, and resolving comments from the public; conducting additional research, if needed; issuing a supplemental public notice or request for comments, if needed; and posting a final decision notice to the Federal Register, which includes lead time for changes and implementation.
[83]GAO, Standards for Internal Control in the Federal Government, GAO‑25‑107721 (Washington, D.C.: May 15, 2025).
[84]We found that 23 of the 42 studies were sufficient for our purposes. However, due to limitations identified during our review, we determined that information sufficient for inclusion from five of the studies was not directly relevant to our first objective.
[85]Of the 18 studies we included in the report, five assessed or discussed only driver visibility, eight assessed or discussed only pedestrian and cyclist injury or fatalities, and five assessed or discussed both driver visibility and pedestrian and cyclist injury or fatalities.
[86]We considered vehicle size to include discussion of the dimensions or weight of a vehicle. We considered design features to include discussion of the shape or layout of specific vehicle elements. We considered maneuvers to include discussion of vehicle movements. Driver visibility refers to the ability of a driver to see objects in the area around their vehicle.
[87]We met with representatives from Ford Motor Company to discuss both passenger vehicles and commercial trucks.
[88]Created in 1997, Euro NCAP is a consumer advocacy member organization that conducts crash and other tests on new vehicles to assess their safety. According to Euro NCAP officials, its membership includes organizations from both the public and private sectors.
[89]DOT established the Volpe Center in 1970, and its mission is to improve the U.S. transportation system by anticipating emerging issues and advancing technical, operational, and institutional innovations for the public good. DOT operating administrations enter into agreements with the Volpe Center for a variety of services, including research.
[90]DOT, FY 2026 Annual Performance Plan (undated).
[91]U.S. Department of Transportation, New Car Assessment Program Final Decision Notice—Advance Driver Assistance Systems and Roadmap, 89 Fed. Reg. 232 (Dec. 3, 2024).
[92]GAO, Standards for Internal Control in the Federal Government, GAO‑25‑107721 (Washington, D.C.: May 2025).
[93]For the purposes of defining a pedestrian, we used the pedestrian/bicyclist person type variable PBTYPE and defined pedestrians as persons with either a code of 05 Pedestrian or 08 Person on a Personal Conveyance.