|
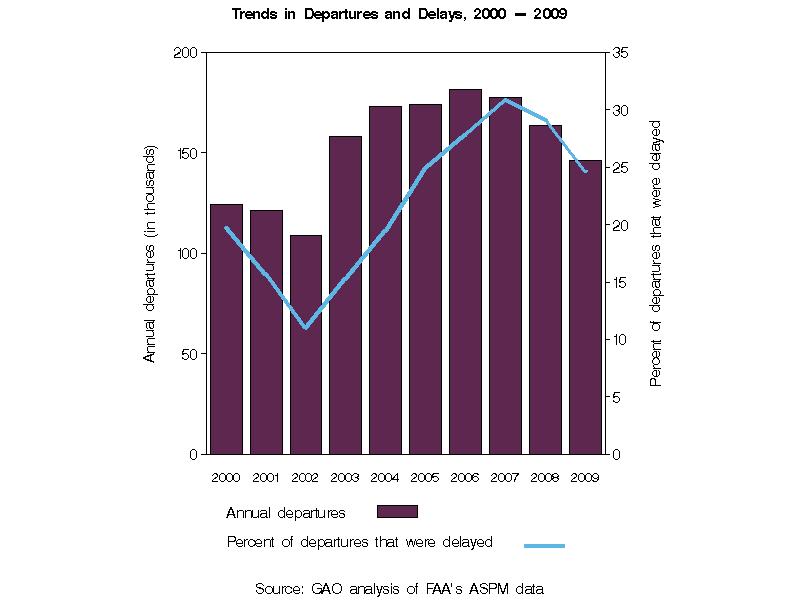
| Year | Annual departures (in thousands) |
Percent change in annual departures |
Percent of annual departures that were delayed |
Percentage point change in annual departures that were delayed |
Average delay per delayed departure (in minutes) |
|---|---|---|---|---|---|
| 2000 | 124 | -- | 19.7 | -- | 63.4 |
| 2001 | 121 | -2.4 | 15.7 | -4.0 | 59.1 |
| 2002 | 109 | -10.2 | 11.0 | -4.7 | 55.6 |
| 2003 | 158 | 45.0 | 15.3 | 4.3 | 55.1 |
| 2004 | 173 | 9.3 | 19.5 | 4.2 | 57.0 |
| 2005 | 174 | 0.6 | 24.9 | 5.5 | 57.7 |
| 2006 | 182 | 4.4 | 27.8 | 2.9 | 60.6 |
| 2007 | 177 | -2.3 | 30.8 | 3.0 | 65.8 |
| 2008 | 164 | -7.7 | 29.1 | -1.7 | 63.7 |
| 2009 | 146 | -10.8 | 24.7 | -4.4 | 63.6 |
| Source: GAO analysis of FAA's ASPM data |
| Note: The percentage change in departures and the change in percentage points of departures that were delayed may not compute due to rounding. |