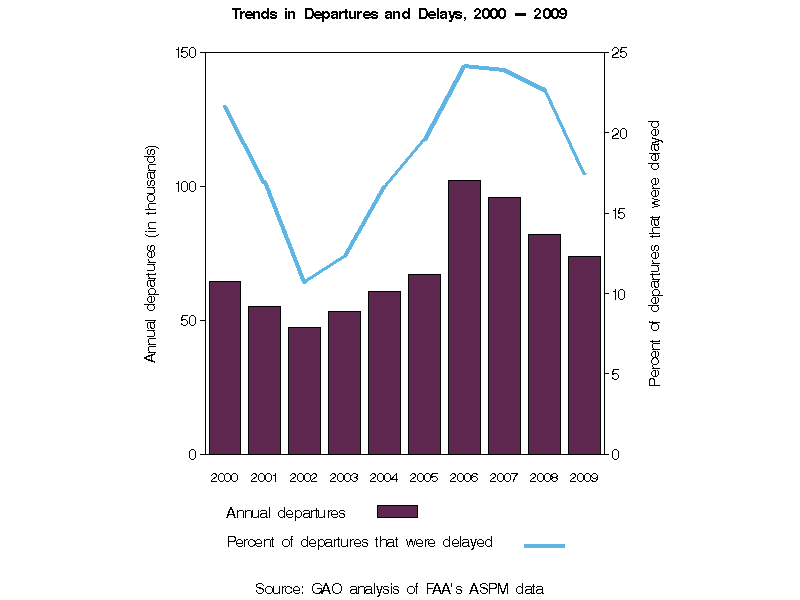
|
| Year | Annual departures (in thousands) |
Percent change in annual departures |
Percent of annual departures that were delayed |
Percentage point change in annual departures that were delayed |
Average delay per delayed departure (in minutes) |
|---|---|---|---|---|---|
| 2000 | 65 | -- | 21.6 | -- | 62.8 |
| 2001 | 55 | -14.7 | 16.9 | -4.7 | 58.5 |
| 2002 | 47 | -14.3 | 10.7 | -6.2 | 57.8 |
| 2003 | 53 | 12.9 | 12.3 | 1.6 | 58.3 |
| 2004 | 61 | 13.9 | 16.6 | 4.3 | 54.8 |
| 2005 | 67 | 10.4 | 19.6 | 2.9 | 58.0 |
| 2006 | 102 | 52.5 | 24.1 | 4.6 | 64.7 |
| 2007 | 96 | -6.2 | 23.9 | -0.2 | 64.2 |
| 2008 | 82 | -14.3 | 22.7 | -1.2 | 66.8 |
| 2009 | 74 | -10.0 | 17.5 | -5.2 | 64.3 |
| Source: GAO analysis of FAA's ASPM data |
| Note: The percentage change in departures and the change in percentage points of departures that were delayed may not compute due to rounding. |