|
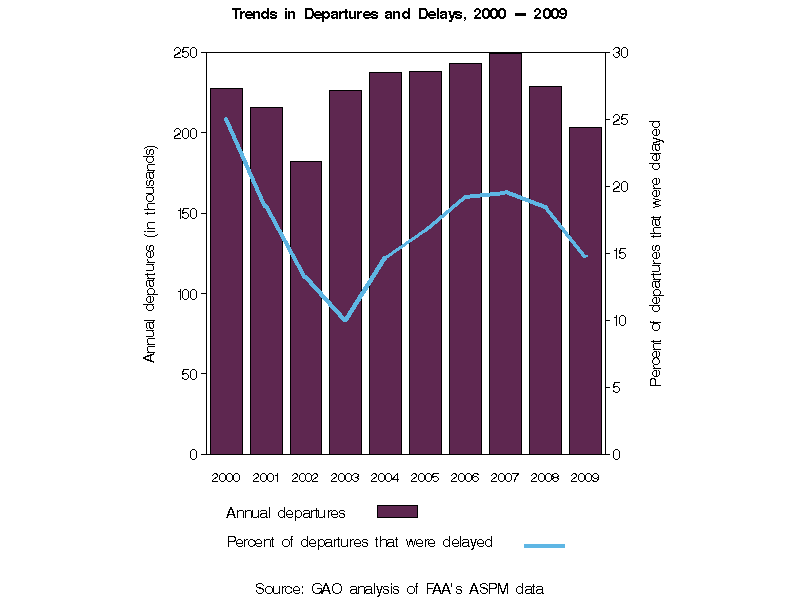
| Year | Annual departures (in thousands) |
Percent change in annual departures |
Percent of annual departures that were delayed |
Percentage point change in annual departures that were delayed |
Average delay per delayed departure (in minutes) |
|---|---|---|---|---|---|
| 2000 | 228 | -- | 25.0 | -- | 49.3 |
| 2001 | 215 | -5.4 | 18.5 | -6.5 | 45.8 |
| 2002 | 182 | -15.4 | 13.2 | -5.3 | 43.6 |
| 2003 | 226 | 24.2 | 10.0 | -3.2 | 46.9 |
| 2004 | 238 | 5.0 | 14.7 | 4.6 | 46.2 |
| 2005 | 238 | 0.1 | 16.7 | 2.0 | 45.8 |
| 2006 | 243 | 2.1 | 19.2 | 2.5 | 47.9 |
| 2007 | 249 | 2.6 | 19.6 | 0.3 | 49.2 |
| 2008 | 229 | -8.2 | 18.5 | -1.1 | 52.8 |
| 2009 | 203 | -11.1 | 14.8 | -3.6 | 51.5 |
| Source: GAO analysis of FAA's ASPM data |
| Note: The percentage change in departures and the change in percentage points of departures that were delayed may not compute due to rounding. |