|
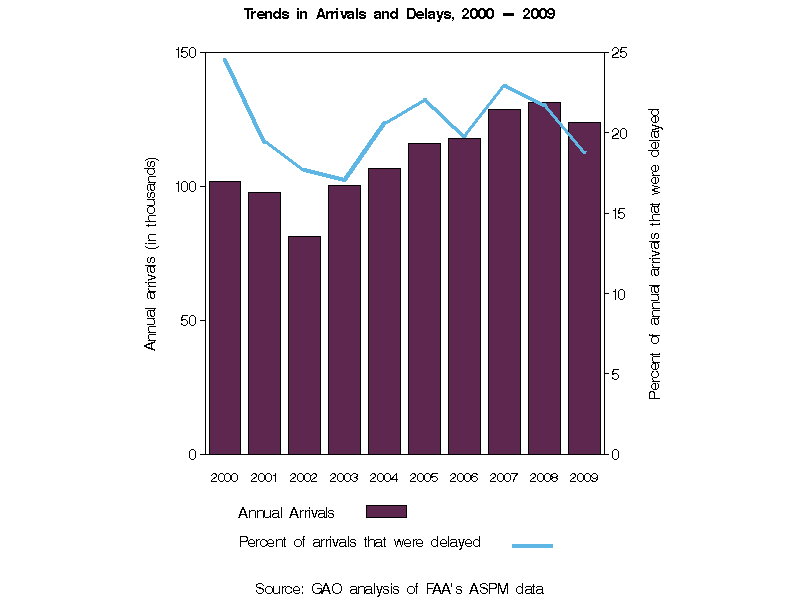
| Year | Annual arrivals (in thousands) |
Percent change in annual arrivals |
Percent of annual arrivals that were delayed |
Percentage point change in annual arrivals that were delayed |
Average delay per delayed arrival (in minutes) |
|---|---|---|---|---|---|
| 2000 | 102 | -- | 24.5 | -- | 52.9 |
| 2001 | 98 | -4.0 | 19.5 | -5.1 | 49.5 |
| 2002 | 81 | -16.9 | 17.7 | -1.8 | 46.5 |
| 2003 | 100 | 23.4 | 17.1 | -0.6 | 47.8 |
| 2004 | 107 | 6.2 | 20.6 | 3.5 | 48.9 |
| 2005 | 116 | 8.7 | 22.1 | 1.5 | 50.6 |
| 2006 | 118 | 1.6 | 19.8 | -2.3 | 51.0 |
| 2007 | 129 | 9.4 | 22.9 | 3.1 | 53.8 |
| 2008 | 131 | 1.9 | 21.7 | -1.2 | 54.5 |
| 2009 | 124 | -5.7 | 18.8 | -2.9 | 52.2 |
| Source: GAO analysis of FAA's ASPM data |
| Note: The percent change in arrivals and the change in percentage points of arrivals that were delayed may not compute due to rounding |